 Deutsch
 English
 Español
 Français
 Italiano
 Nederlands
 Polski
 Português
 Русский
 Türkçe
 Svenska
 Chinese
 Magyar
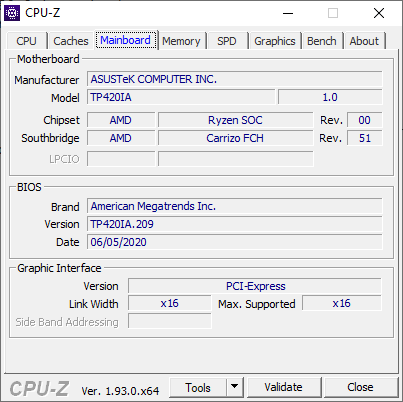
Asus VivoBook Flip 14 TM420IA Ryzen 7 Convertible Review: Core i7 Need Not Apply
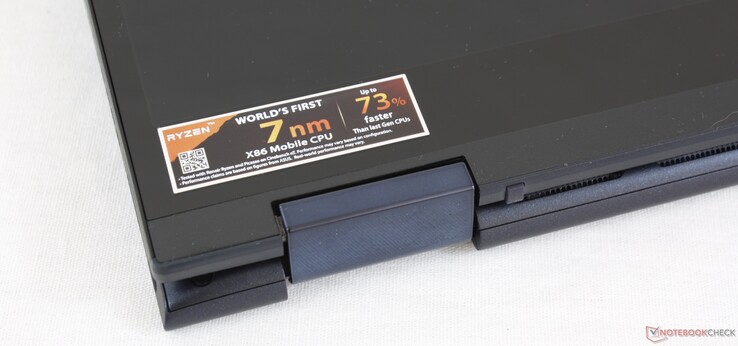
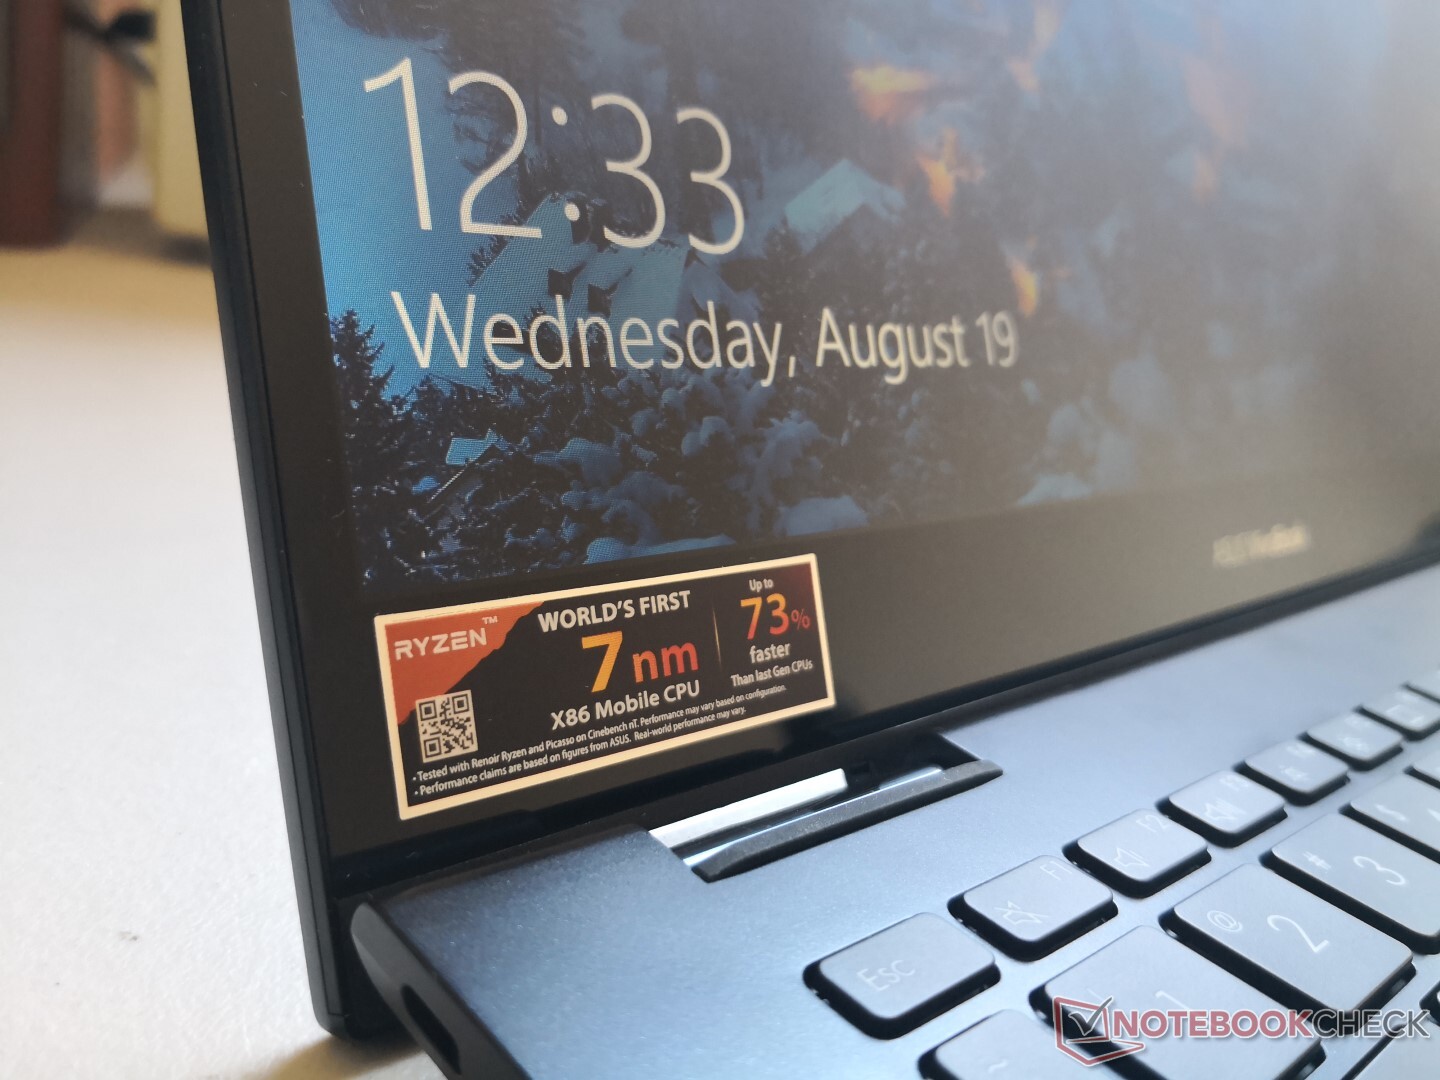
Unveiled earlier this year, the Asus VivoBook Flip 14 TM420 convertible is the successor to last year's VivoBook Flip 14 TP410 series. This latest model introduces both a brand new chassis design and the latest Zen 2 U-series CPUs to be sleeker and faster than before without burning a hole through your wallet. Asus markets its VivoBook series to budget-conscious home users in contrast to the pricier higher-end ZenBook series.
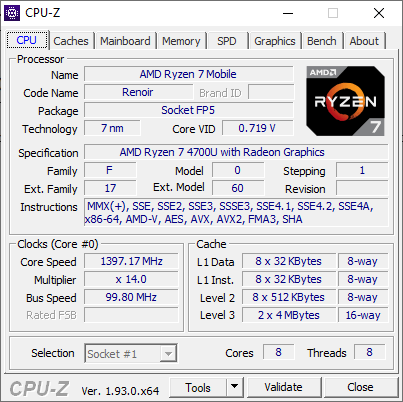
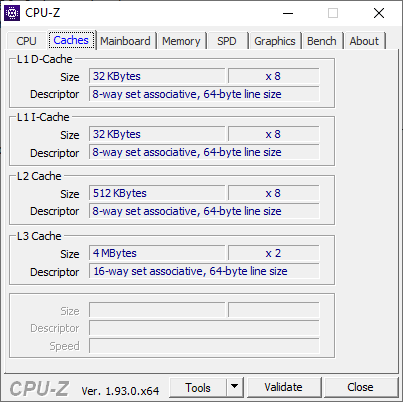
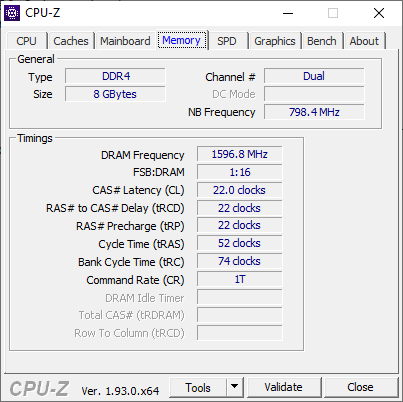
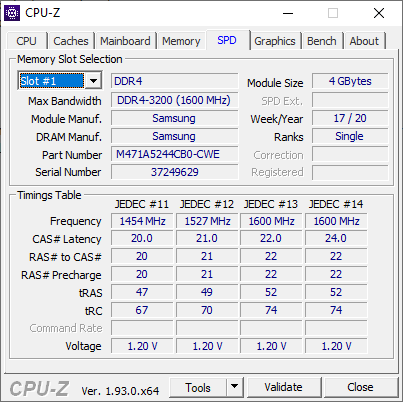
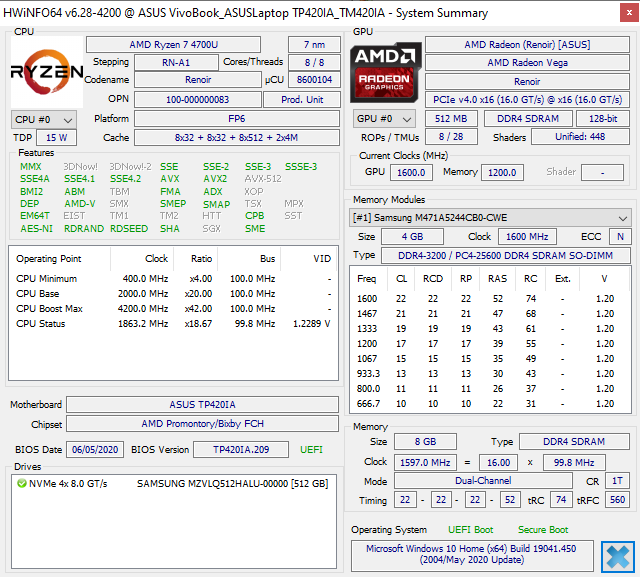
Our configuration here comes with the Ryzen 7 4700U CPU, 8 GB of RAM, 512 GB GB NVMe SSD, and 1080p touchscreen for about $700 USD. Less expensive Ryzen 5 4500U and Ryzen 3 4300U SKUs are also available for while Intel Tiger Lake versions will be coming later in Q4 2020. Competitors include other affordable subnotebook convertibles like the Lenovo IdeaPad Flex, HP Pavilion x360, or Dell Inspiron 2-in-1.
More Asus reviews:
Rating | Date | Model | Weight | Height | Size | Resolution | Best Price |
|---|---|---|---|---|---|---|---|
| 80.7 % | 08/2020 | Asus VivoBook Flip 14 TM420IA R7 4700U, Vega 7 | 1.6 kg | 18.2 mm | 14.00" | 1920x1080 | |
| 84.3 % | 03/2020 | Lenovo Yoga C740-14IML i5-10210U, UHD Graphics 620 | 1.4 kg | 16.9 mm | 14.00" | 1920x1080 | |
| 86.5 % | 05/2020 | Honor Magicbook 14 R5 3500U, Vega 8 | 1.4 kg | 16 mm | 14.00" | 1920x1080 | |
| 85 % | 06/2020 | Acer Swift 3 SF314-42-R27B R3 4300U, Vega 5 | 1.2 kg | 16.55 mm | 14.00" | 1920x1080 | |
| 83 % | 07/2020 | Lenovo IdeaPad 5 15IIL05 i5-1035G1, GeForce MX350 | 1.7 kg | 17.9 mm | 15.60" | 1920x1080 | |
| 81.2 % | 04/2020 | LG Gram 14T90N i7-10510U, UHD Graphics 620 | 1.2 kg | 18 mm | 14.00" | 1920x1080 |
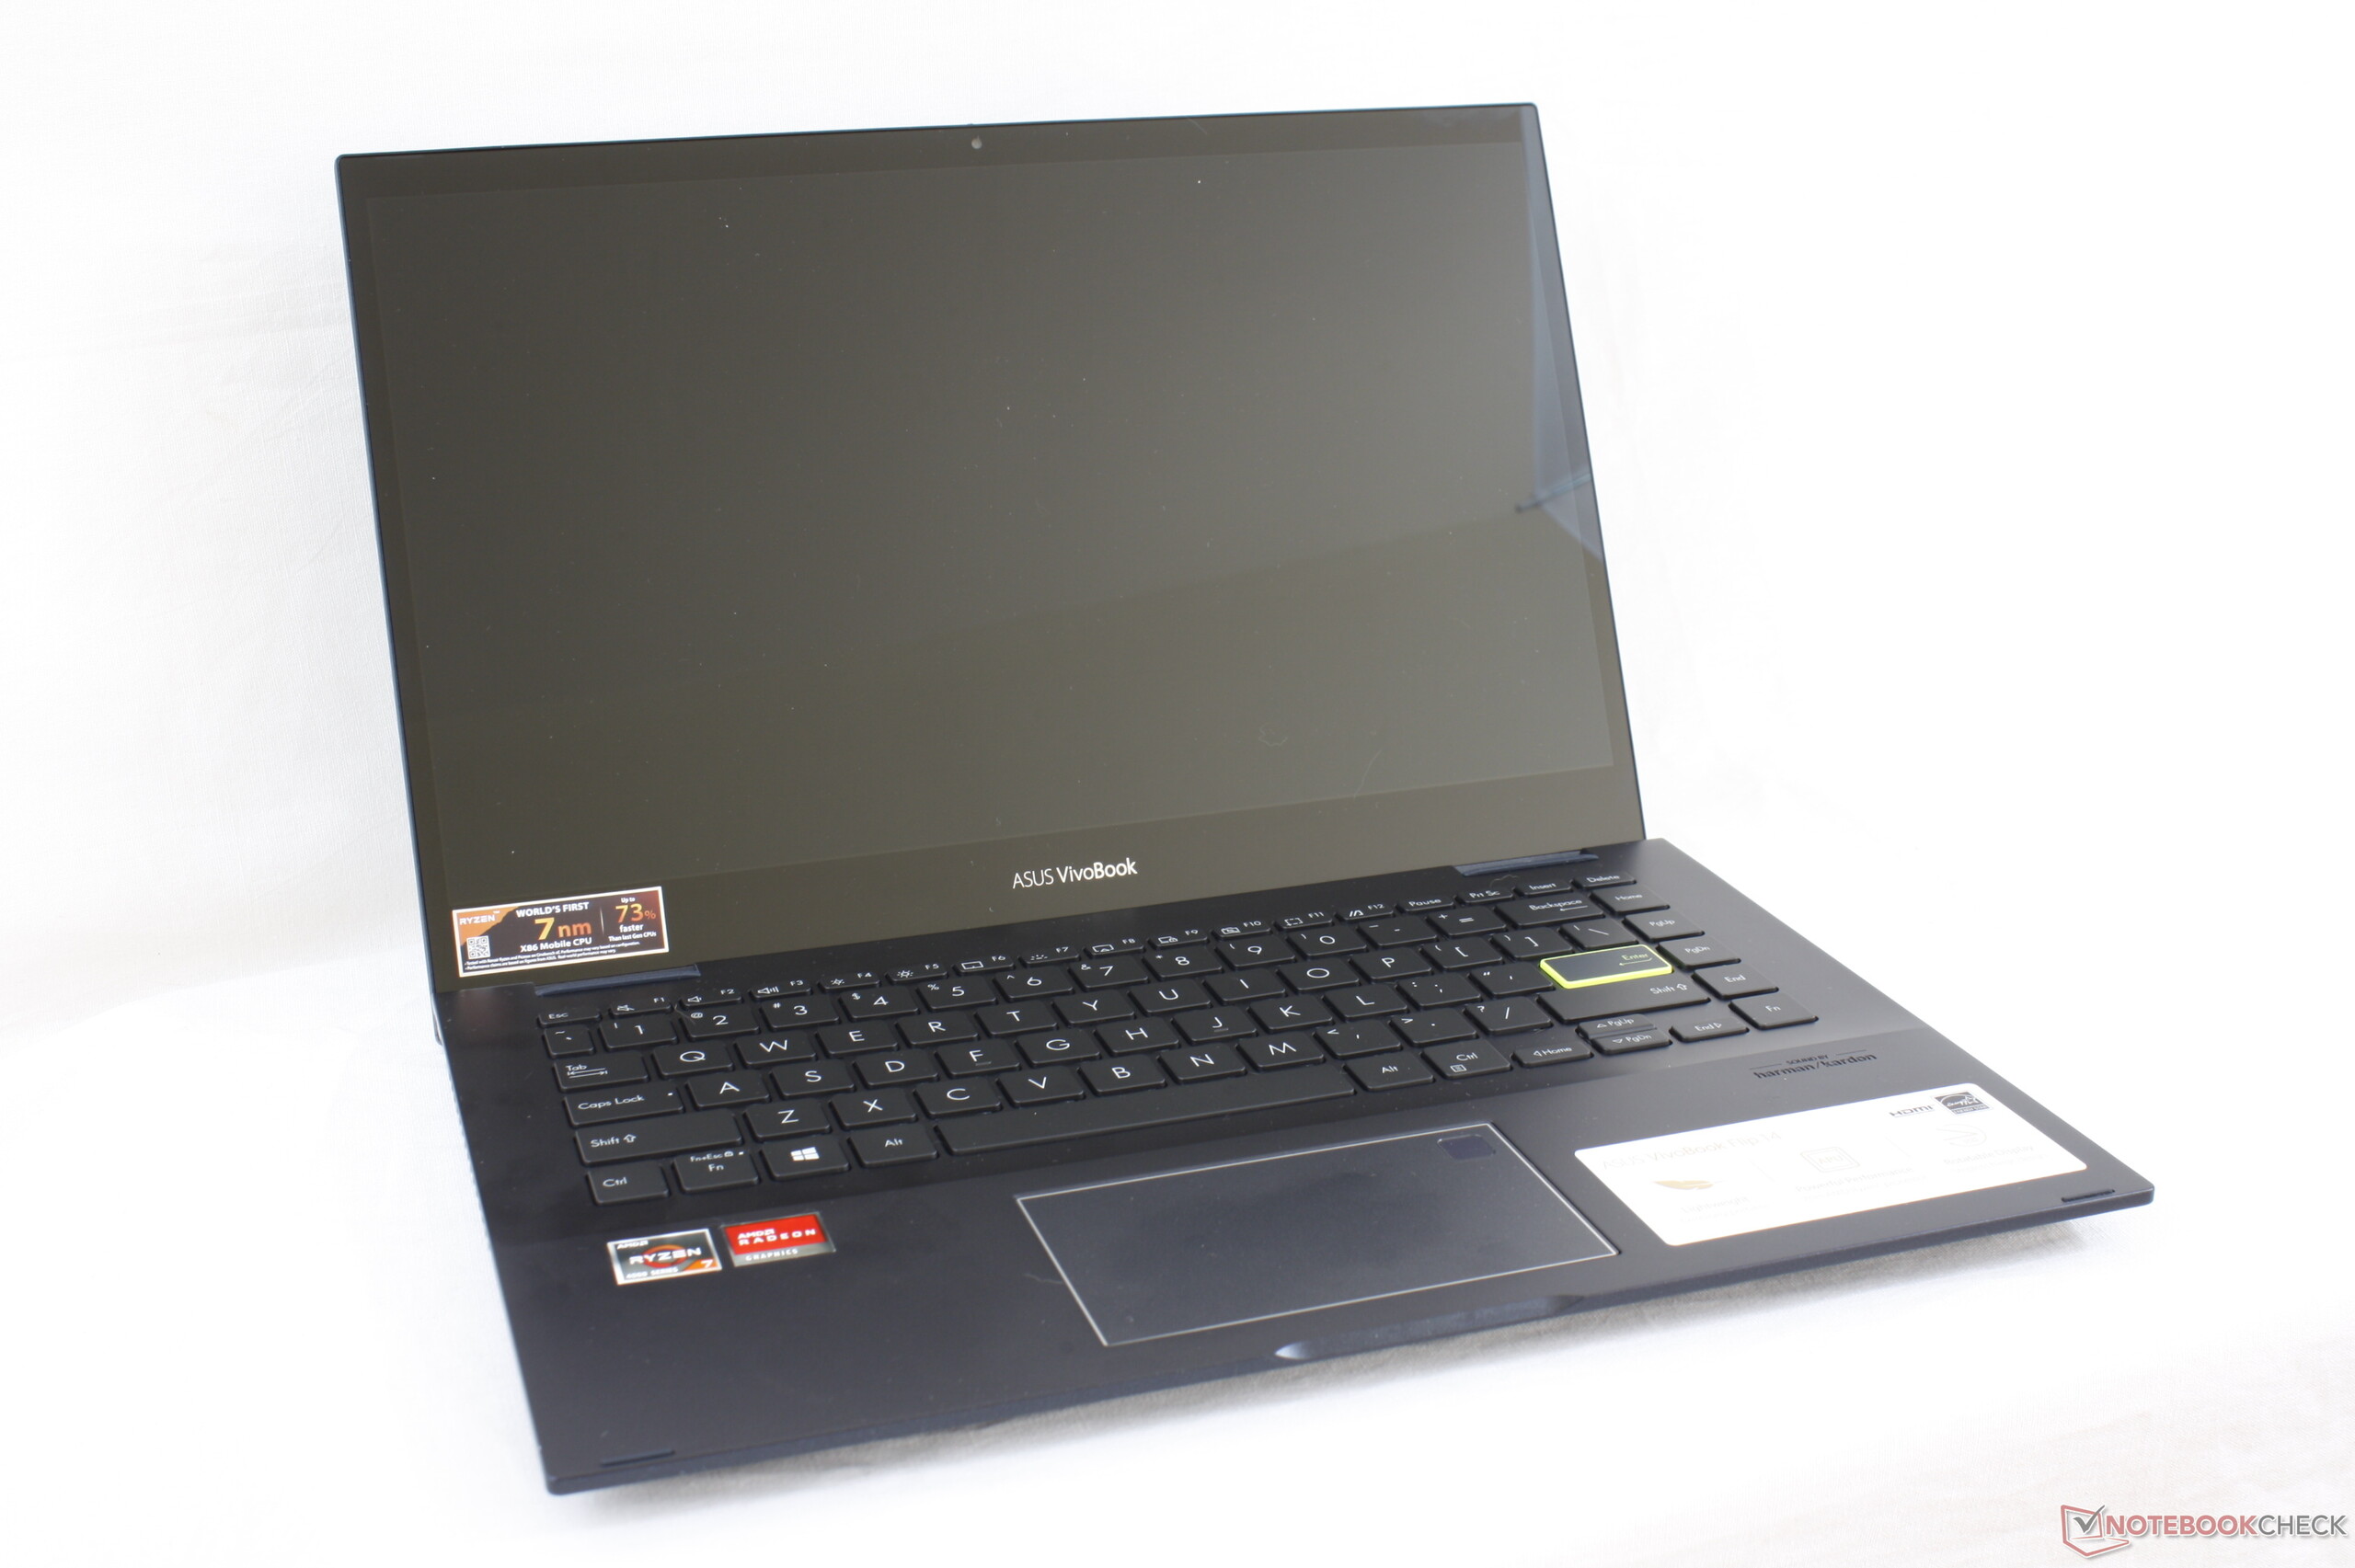
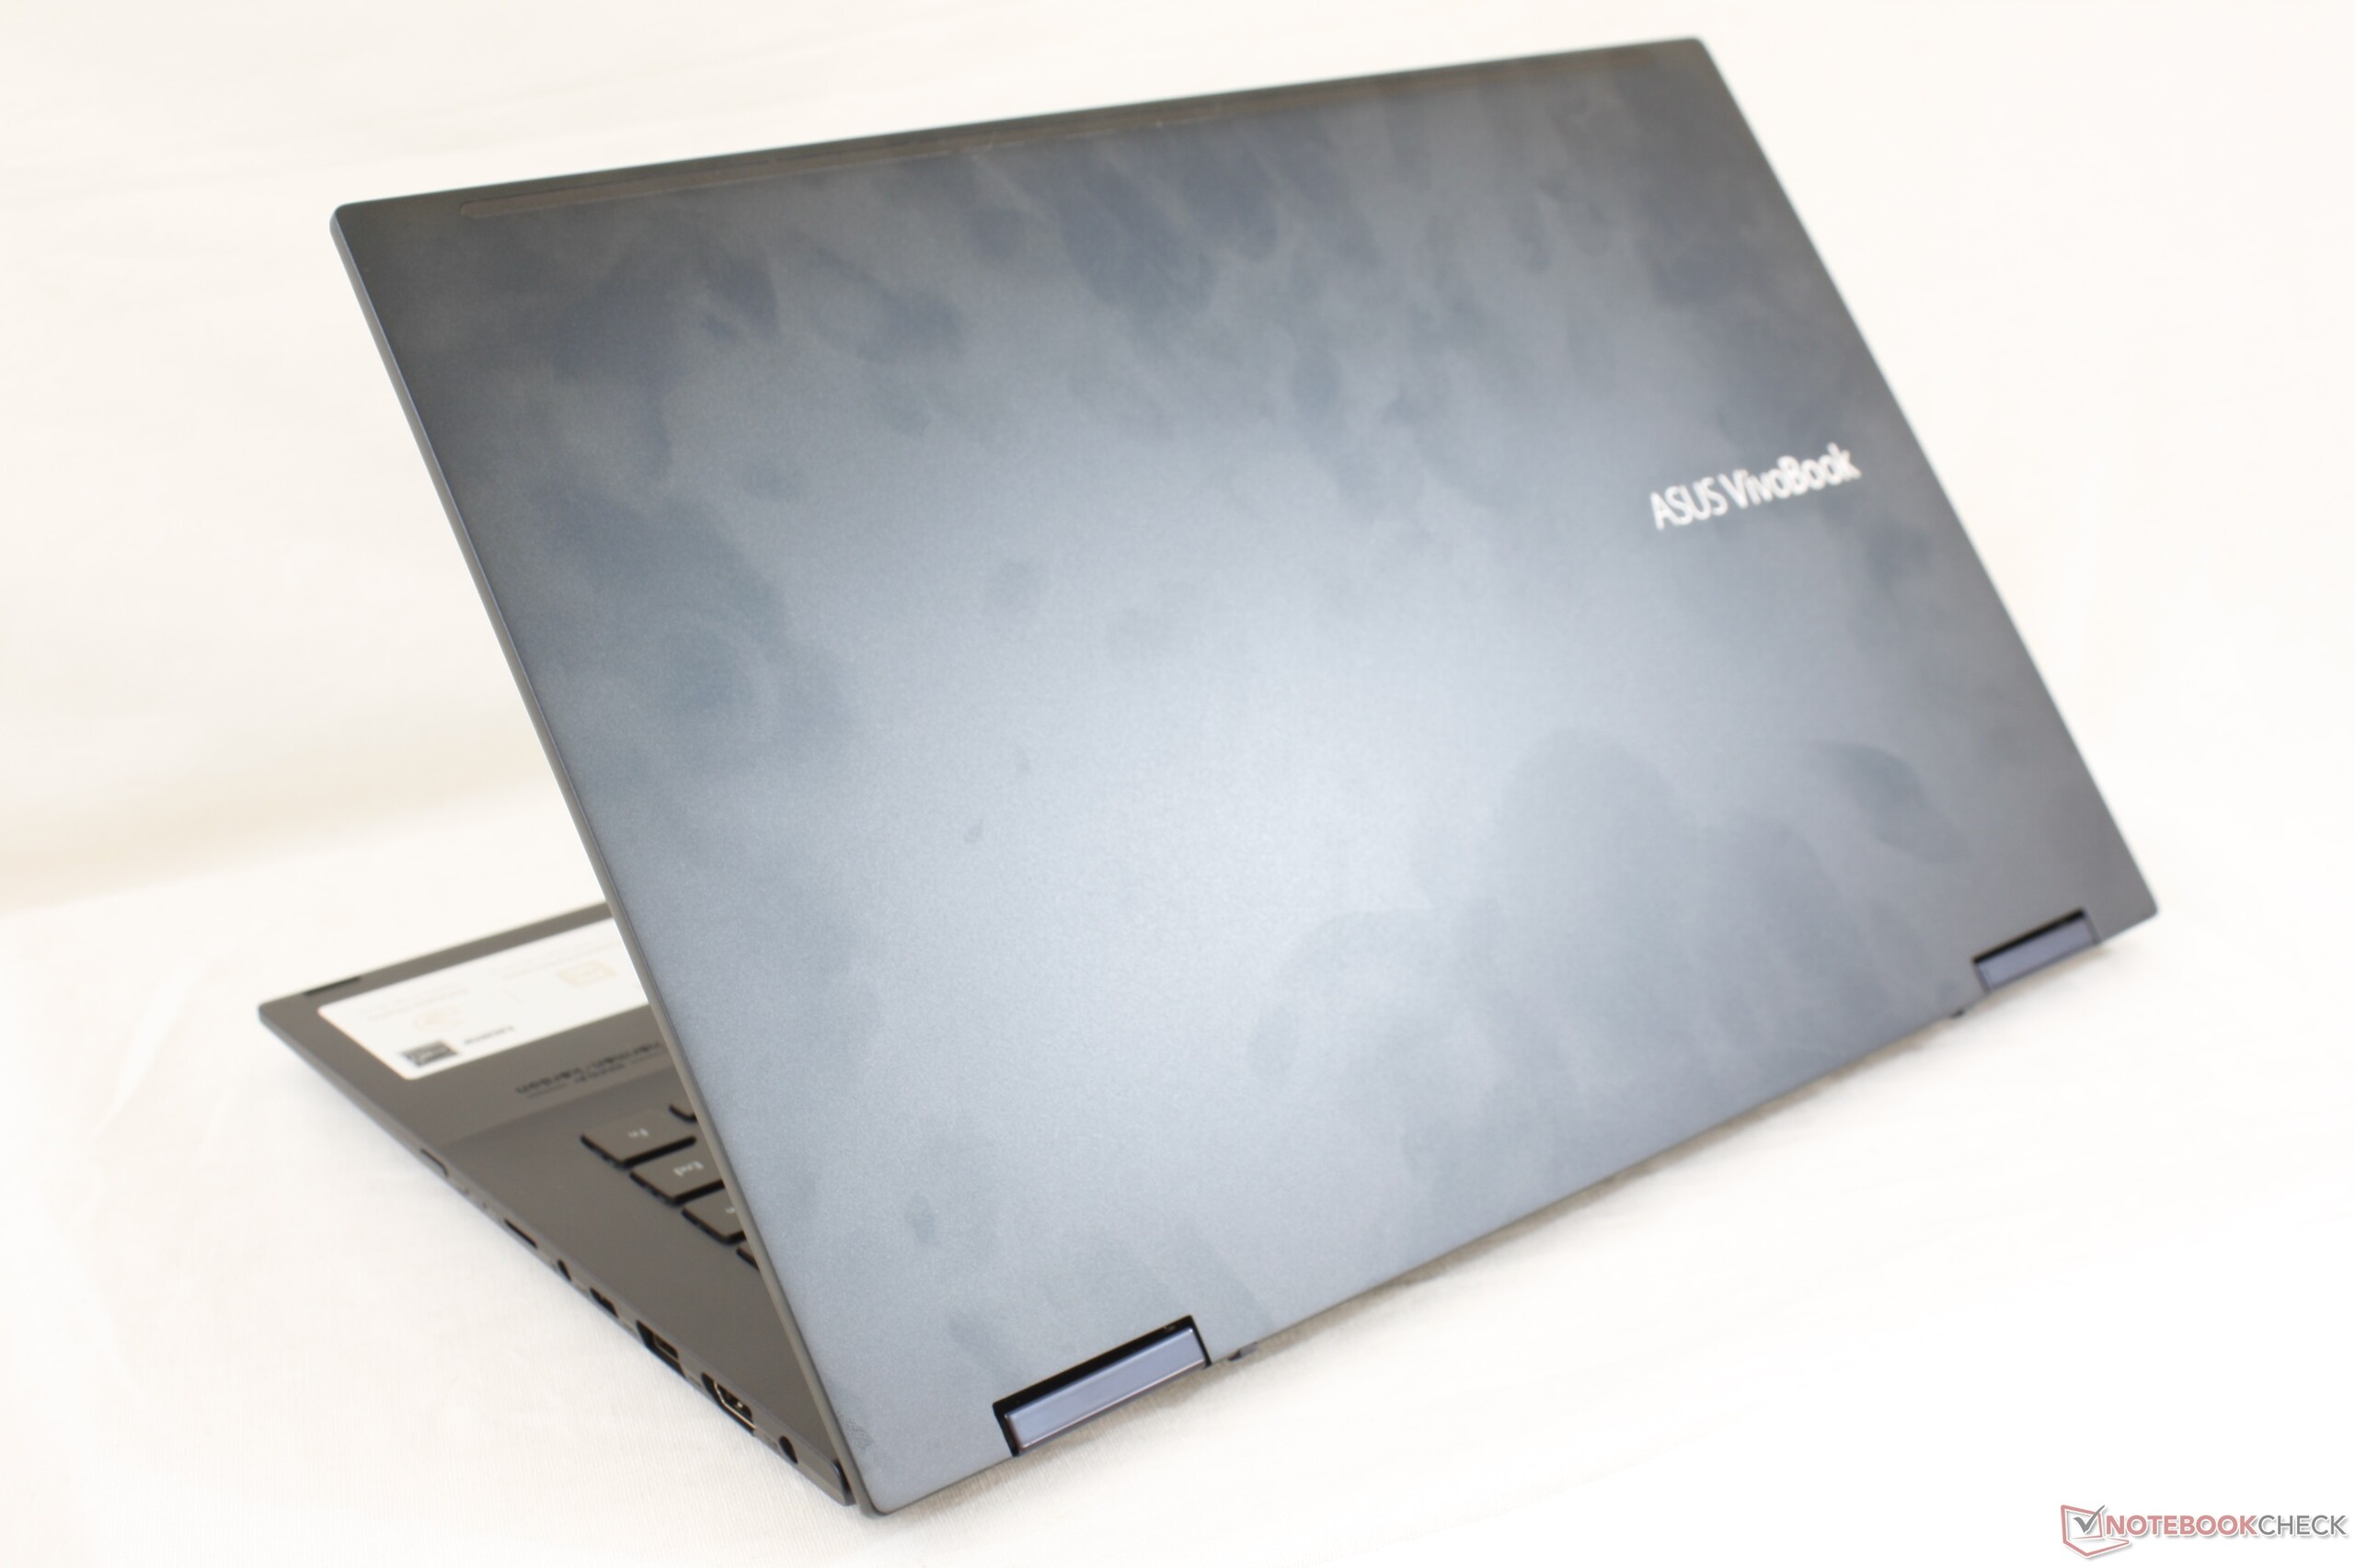
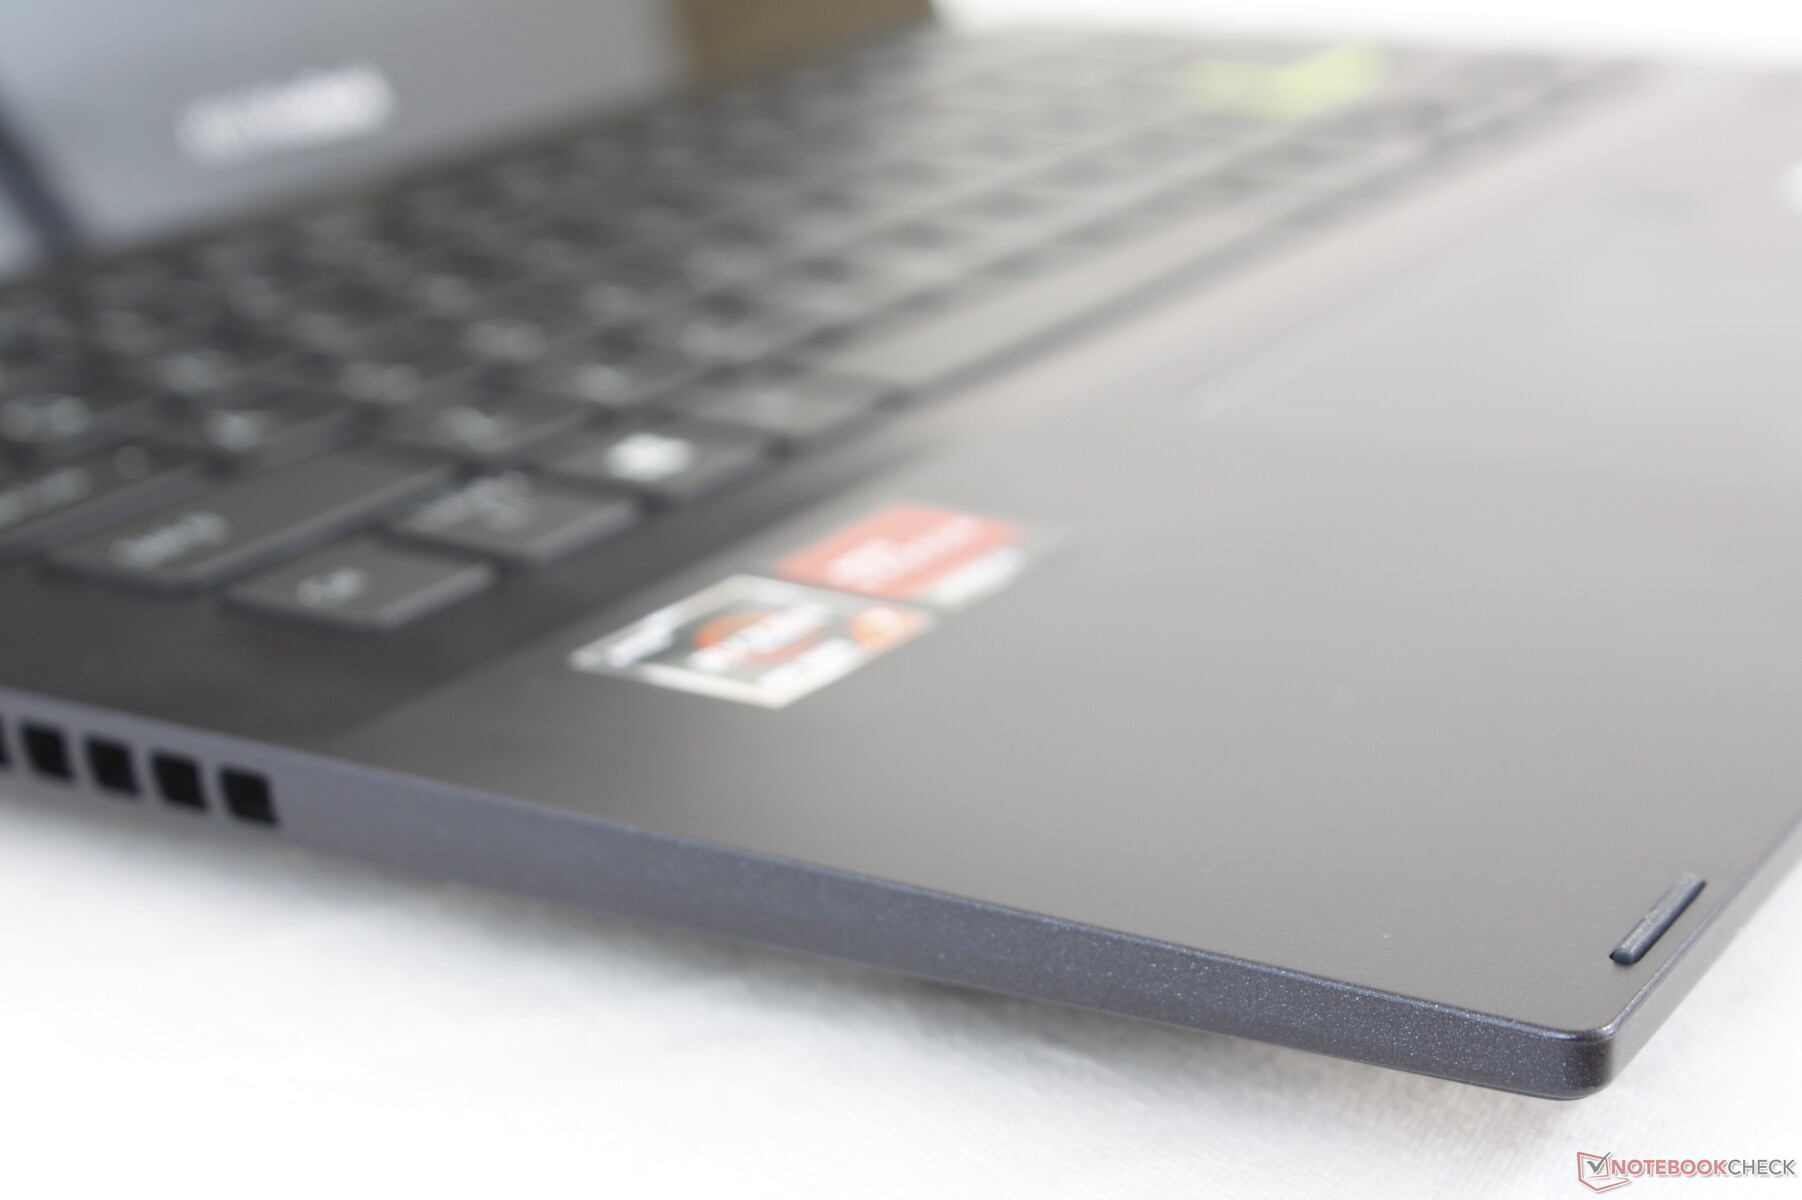
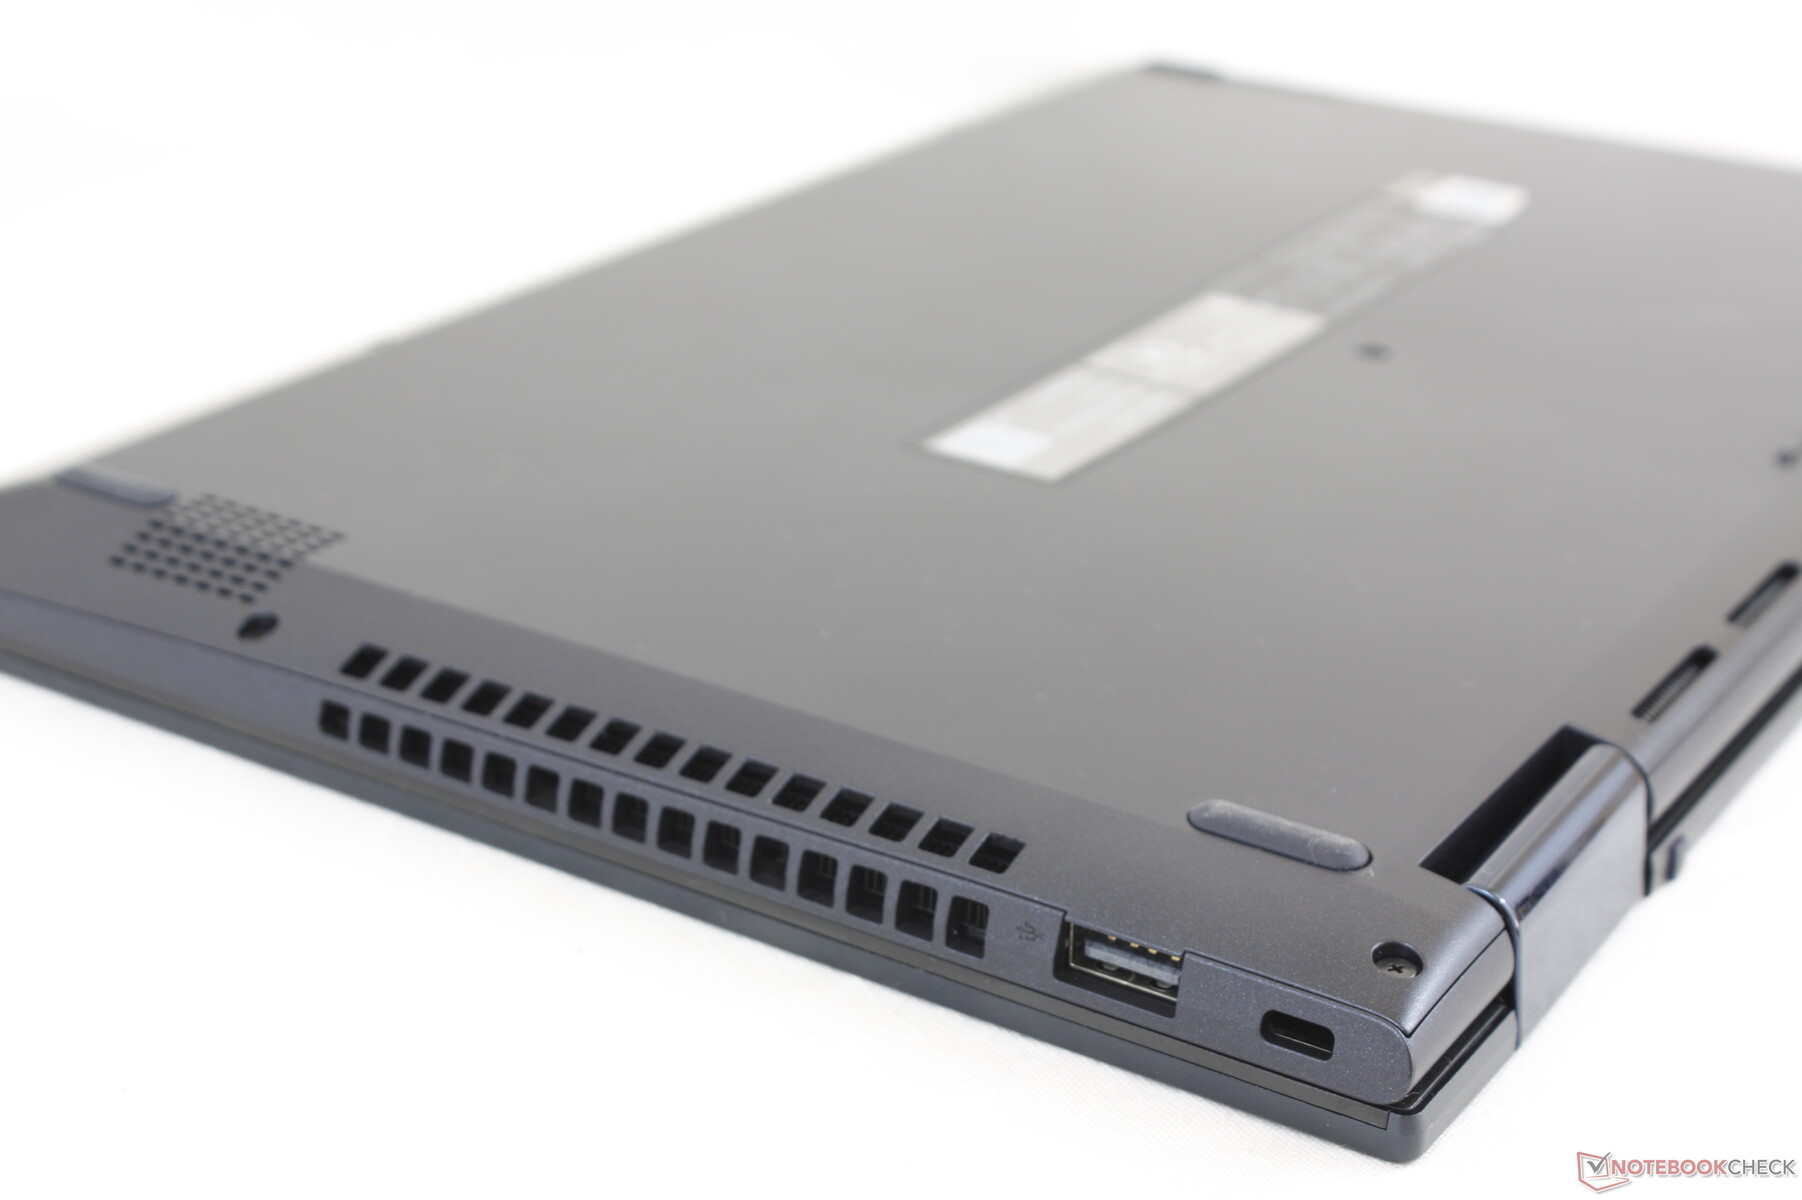
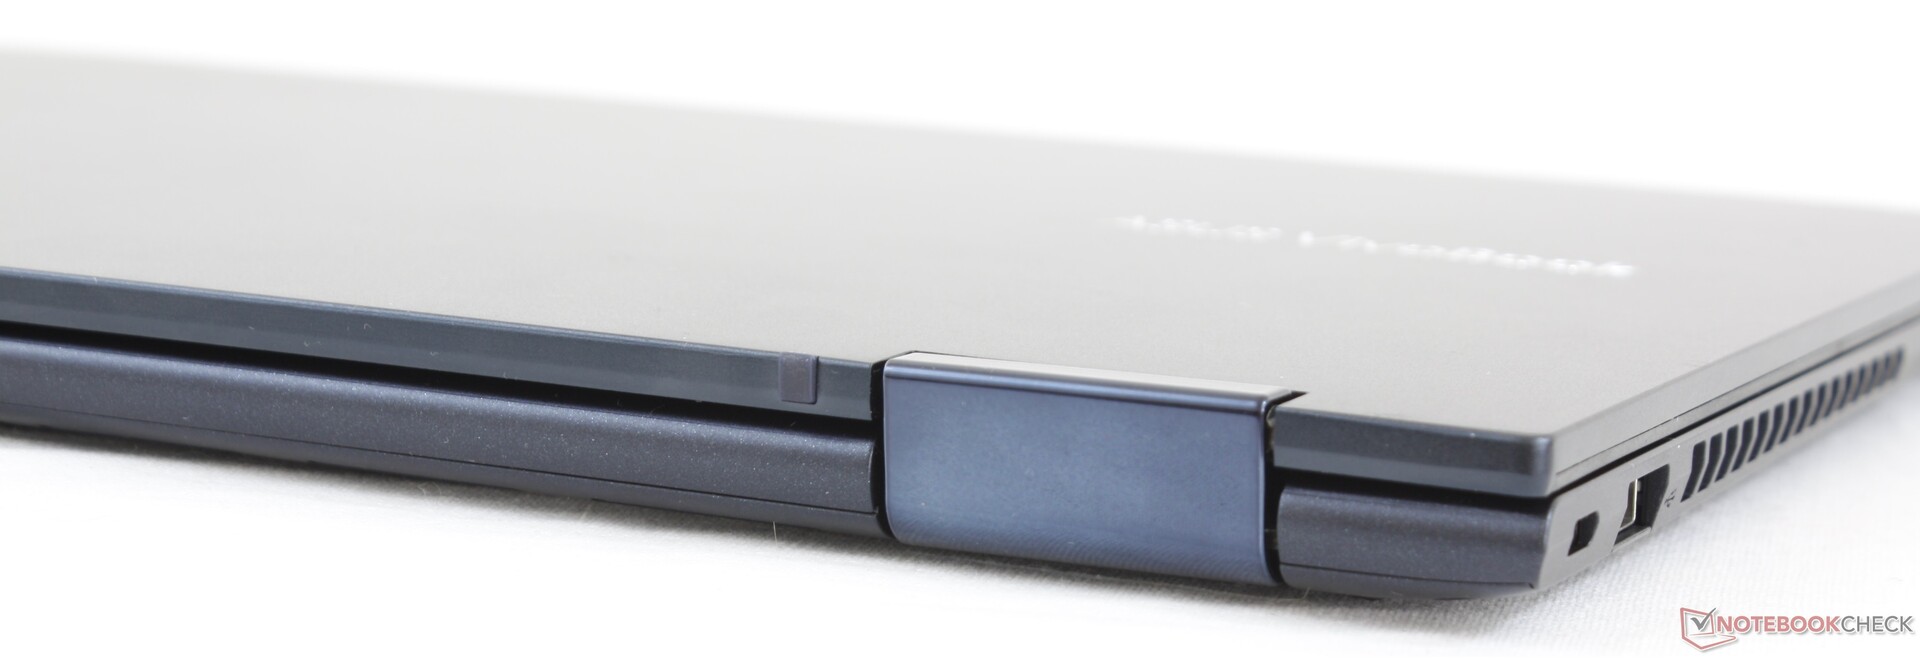
Case
When compared to the older VivoBook Flip 14 TP410, the TM420 is smaller in every dimension while still weighing about the same. Both the base and lid are rigid and just slightly weaker than an HP Envy x360.
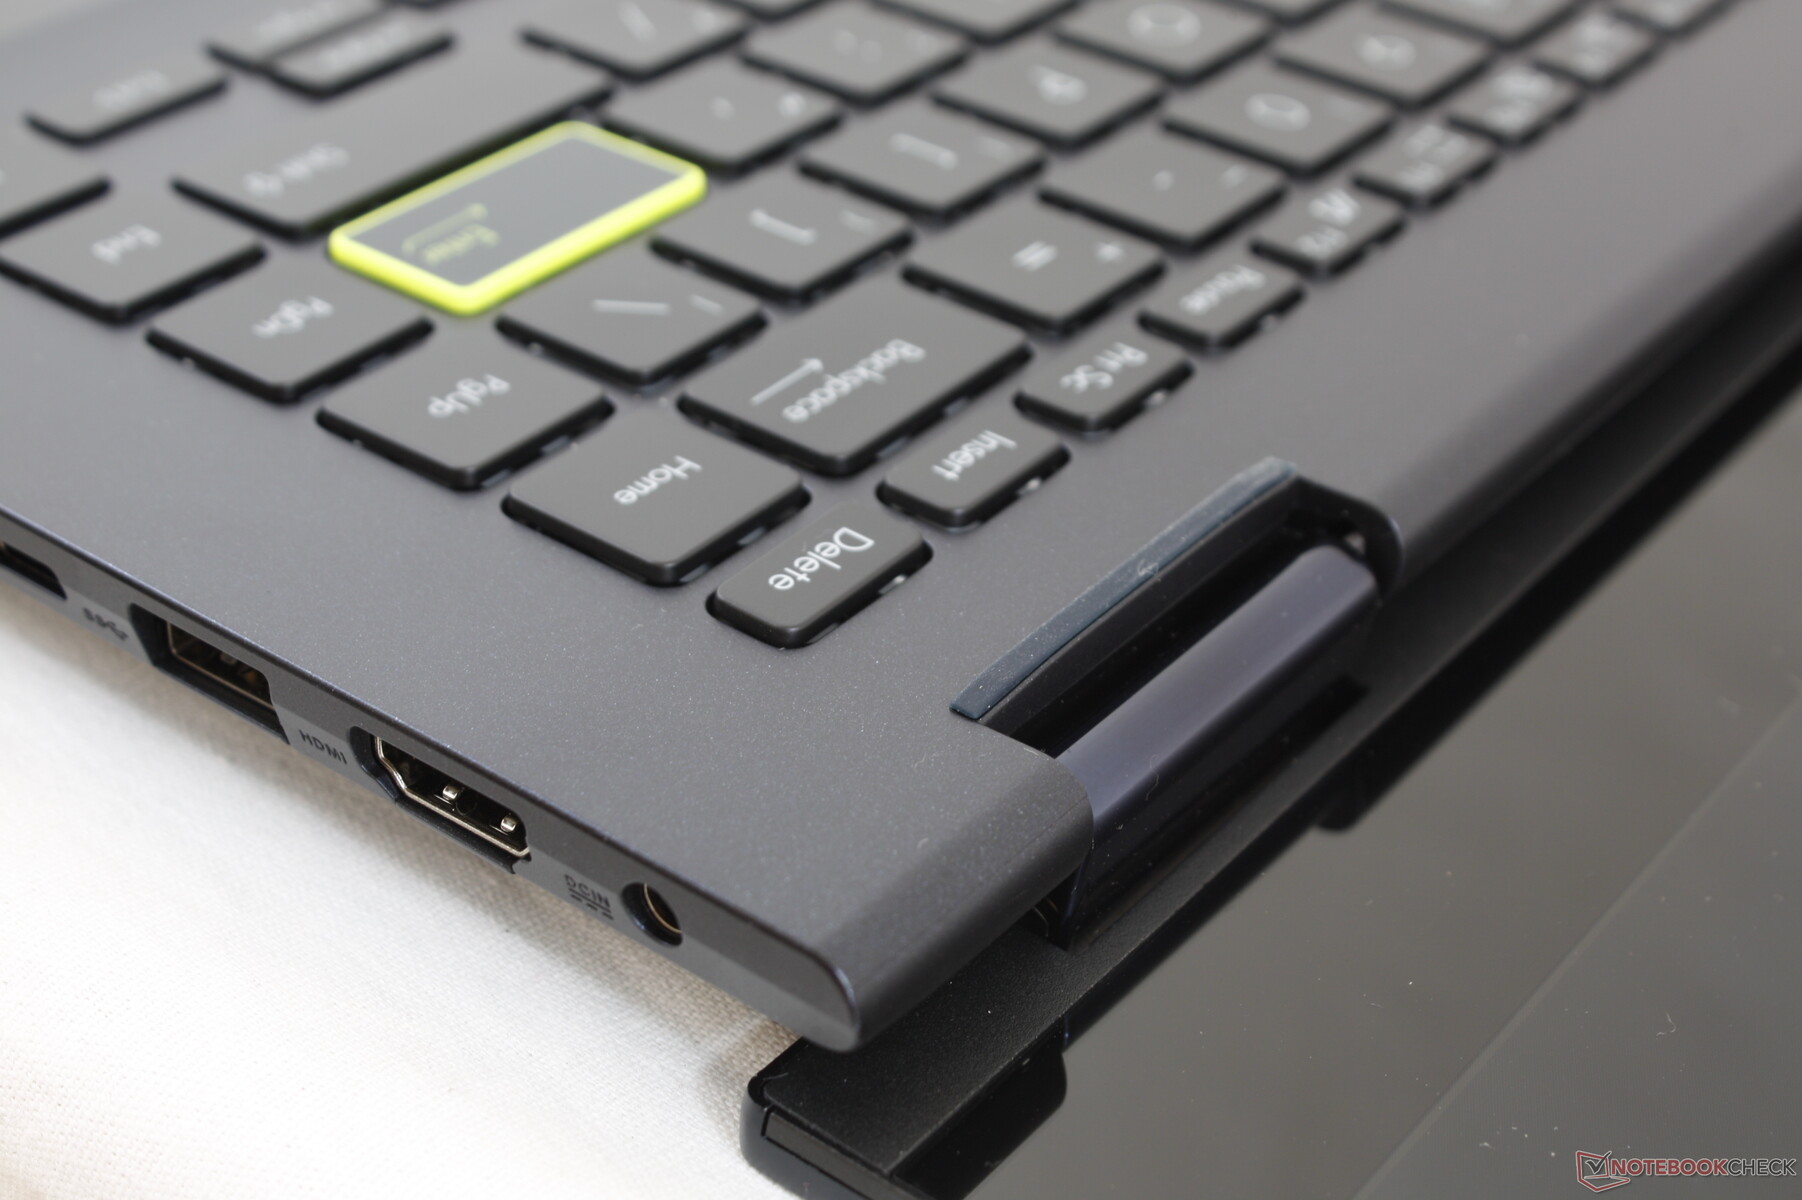
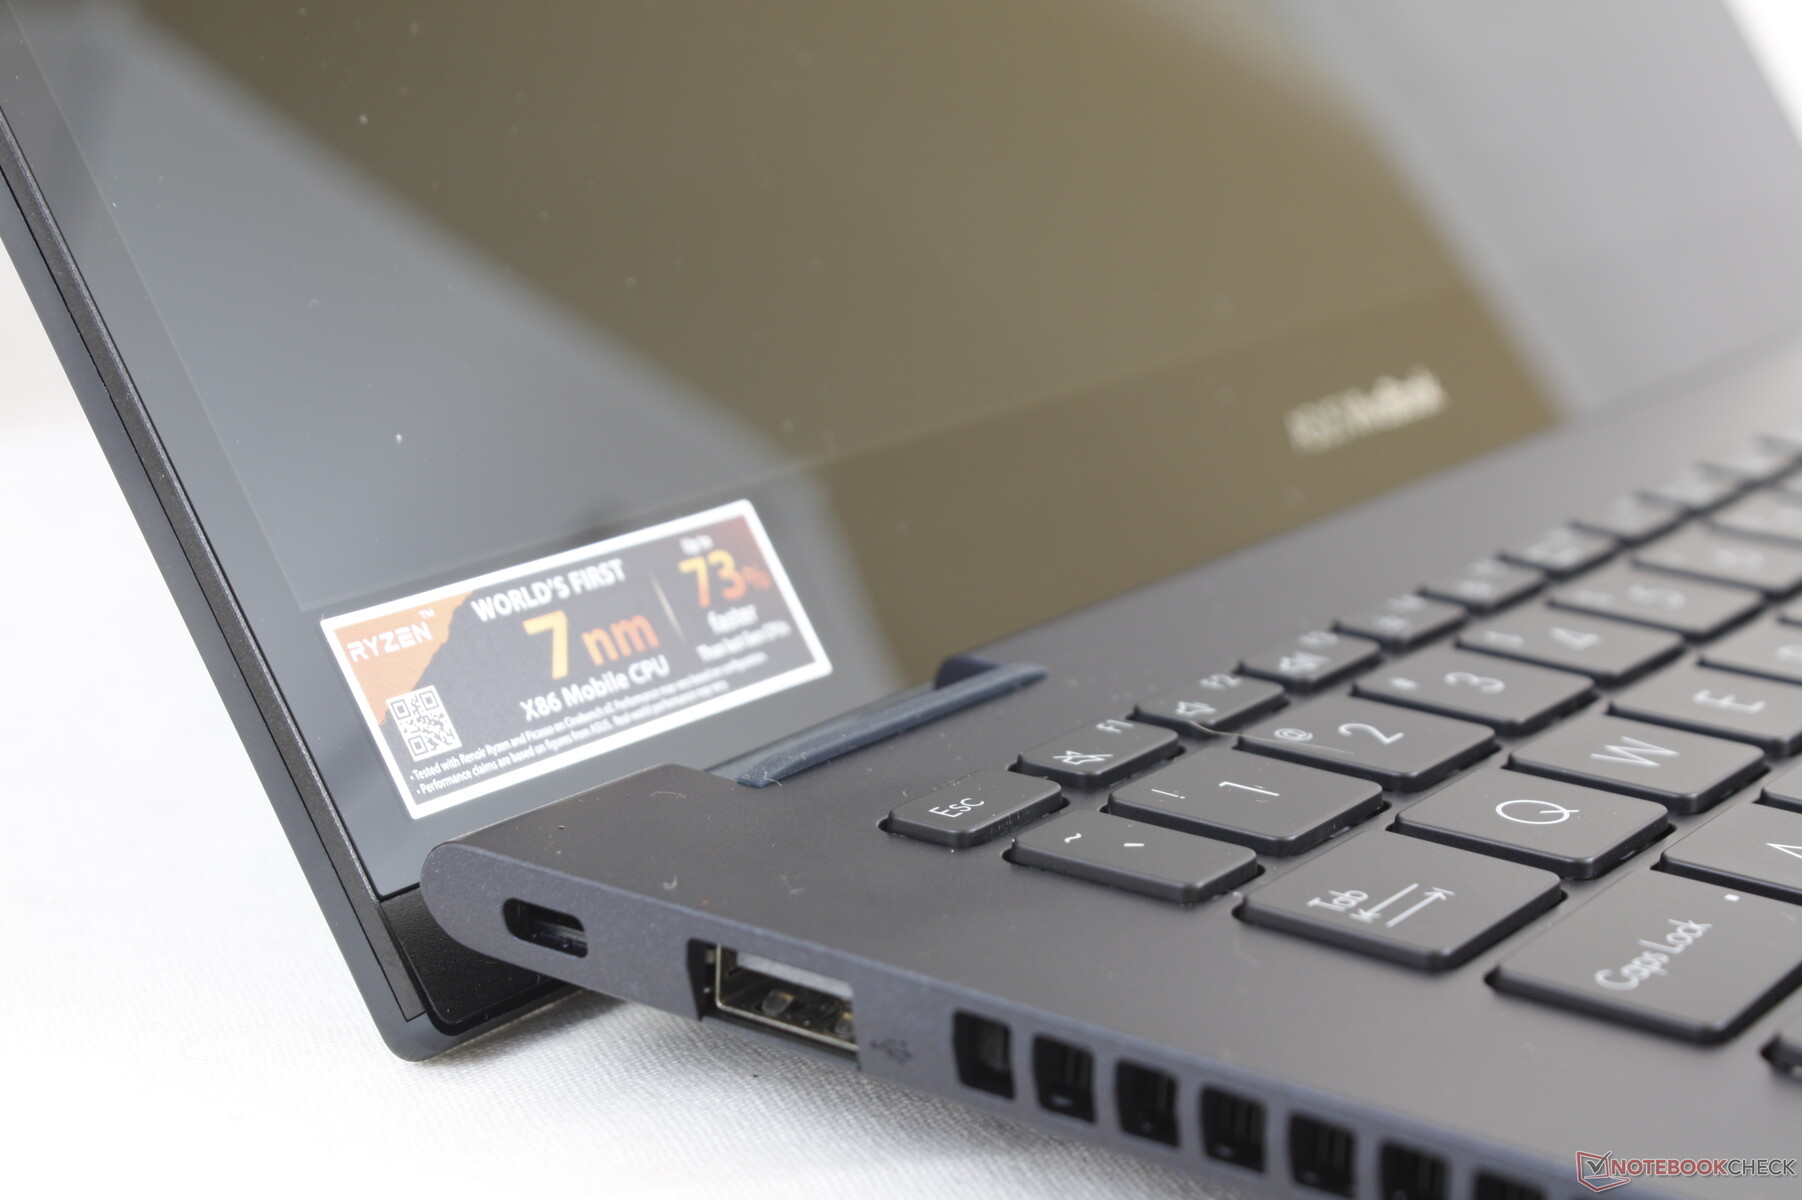
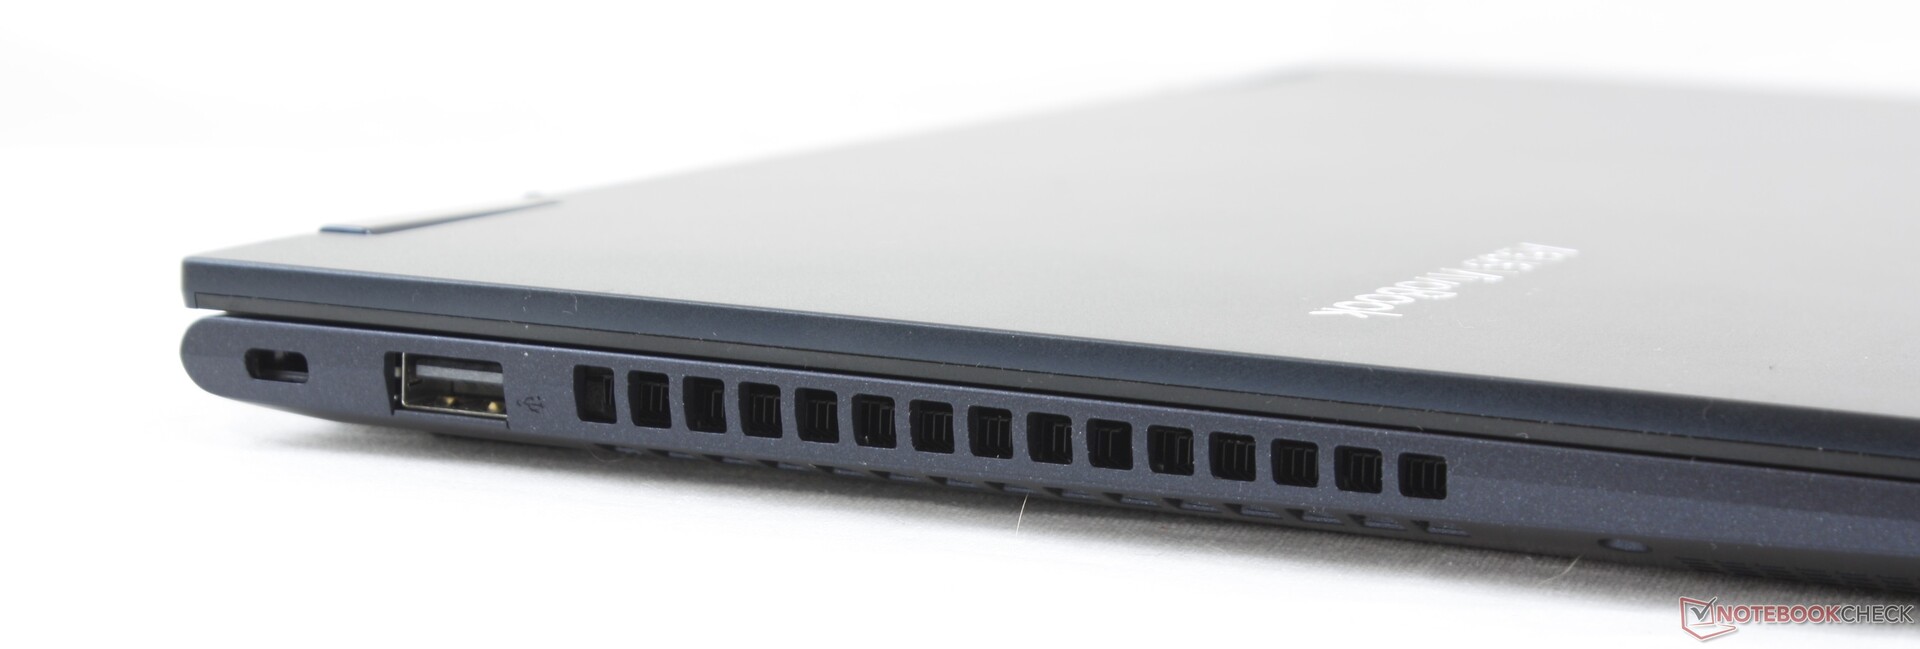
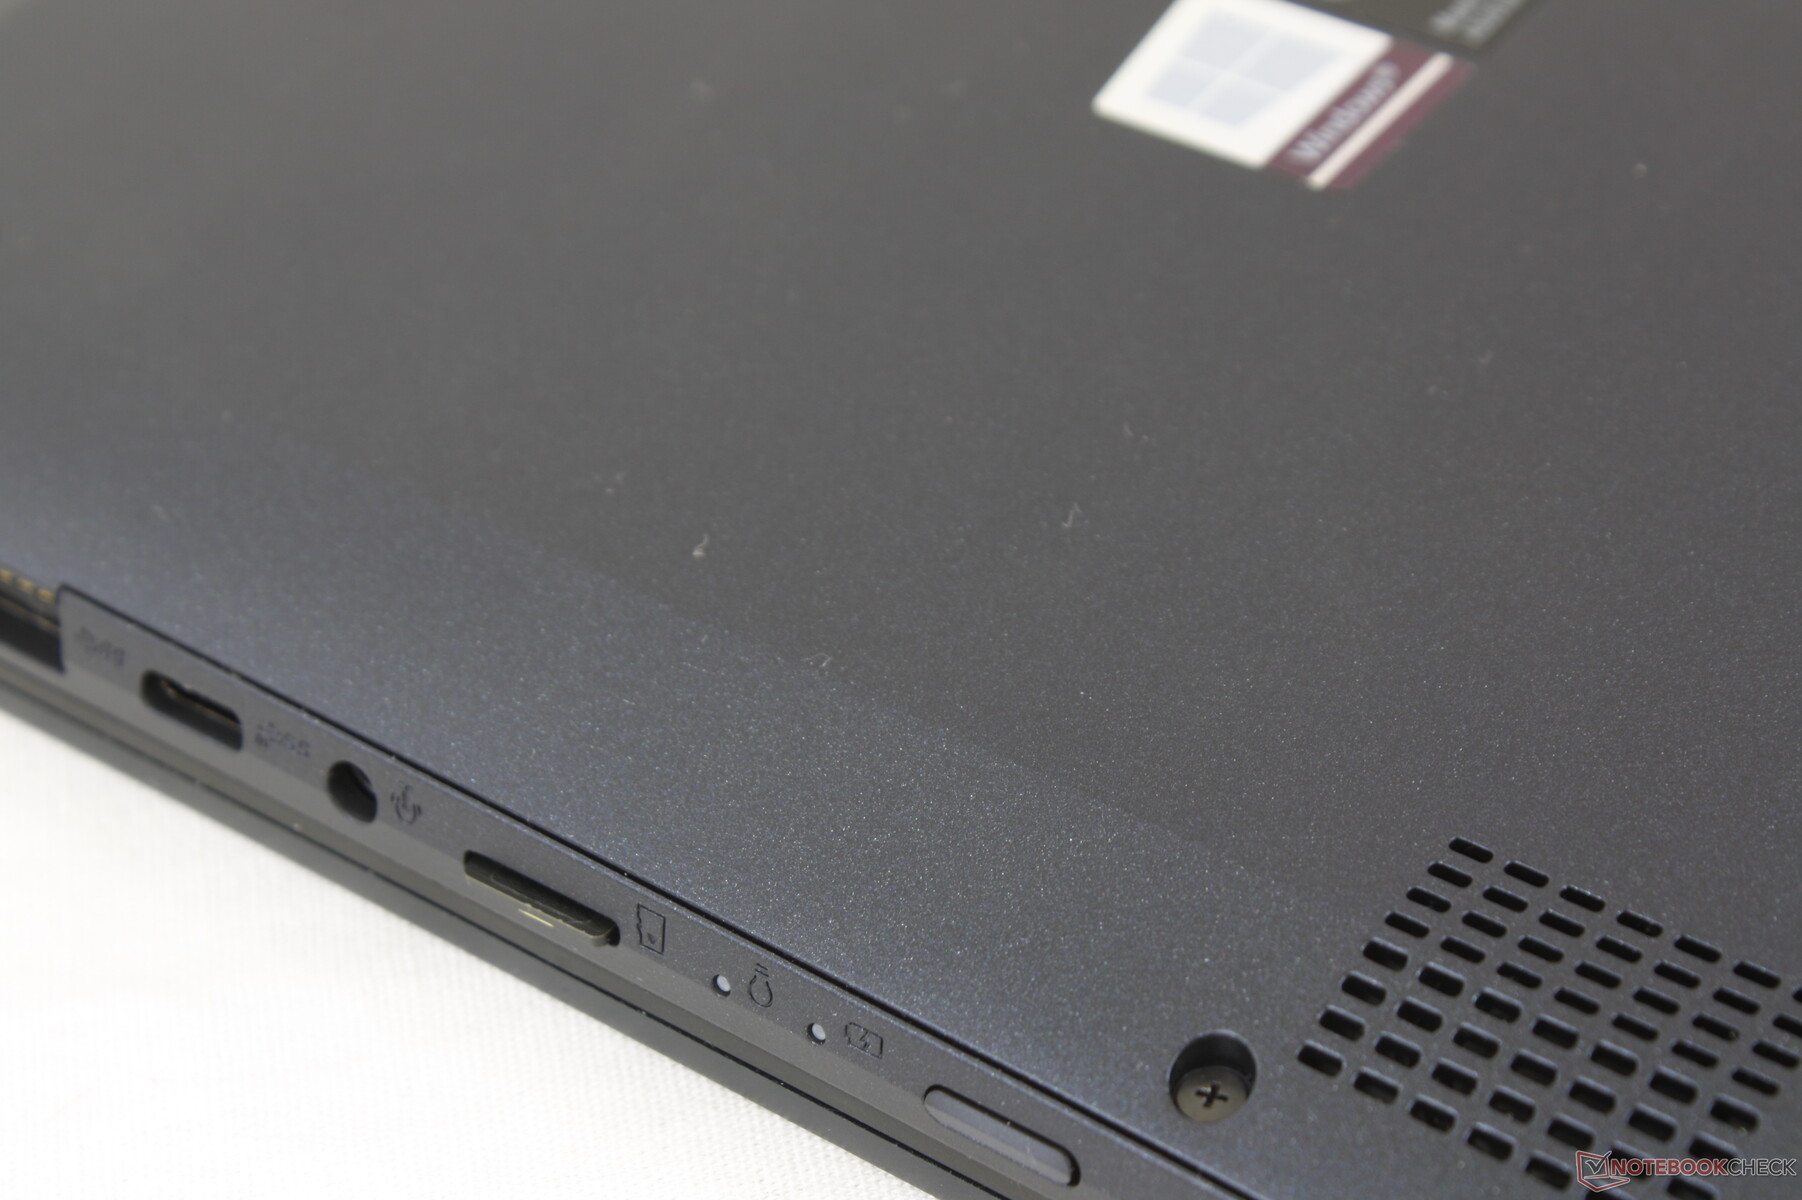
Connectivity
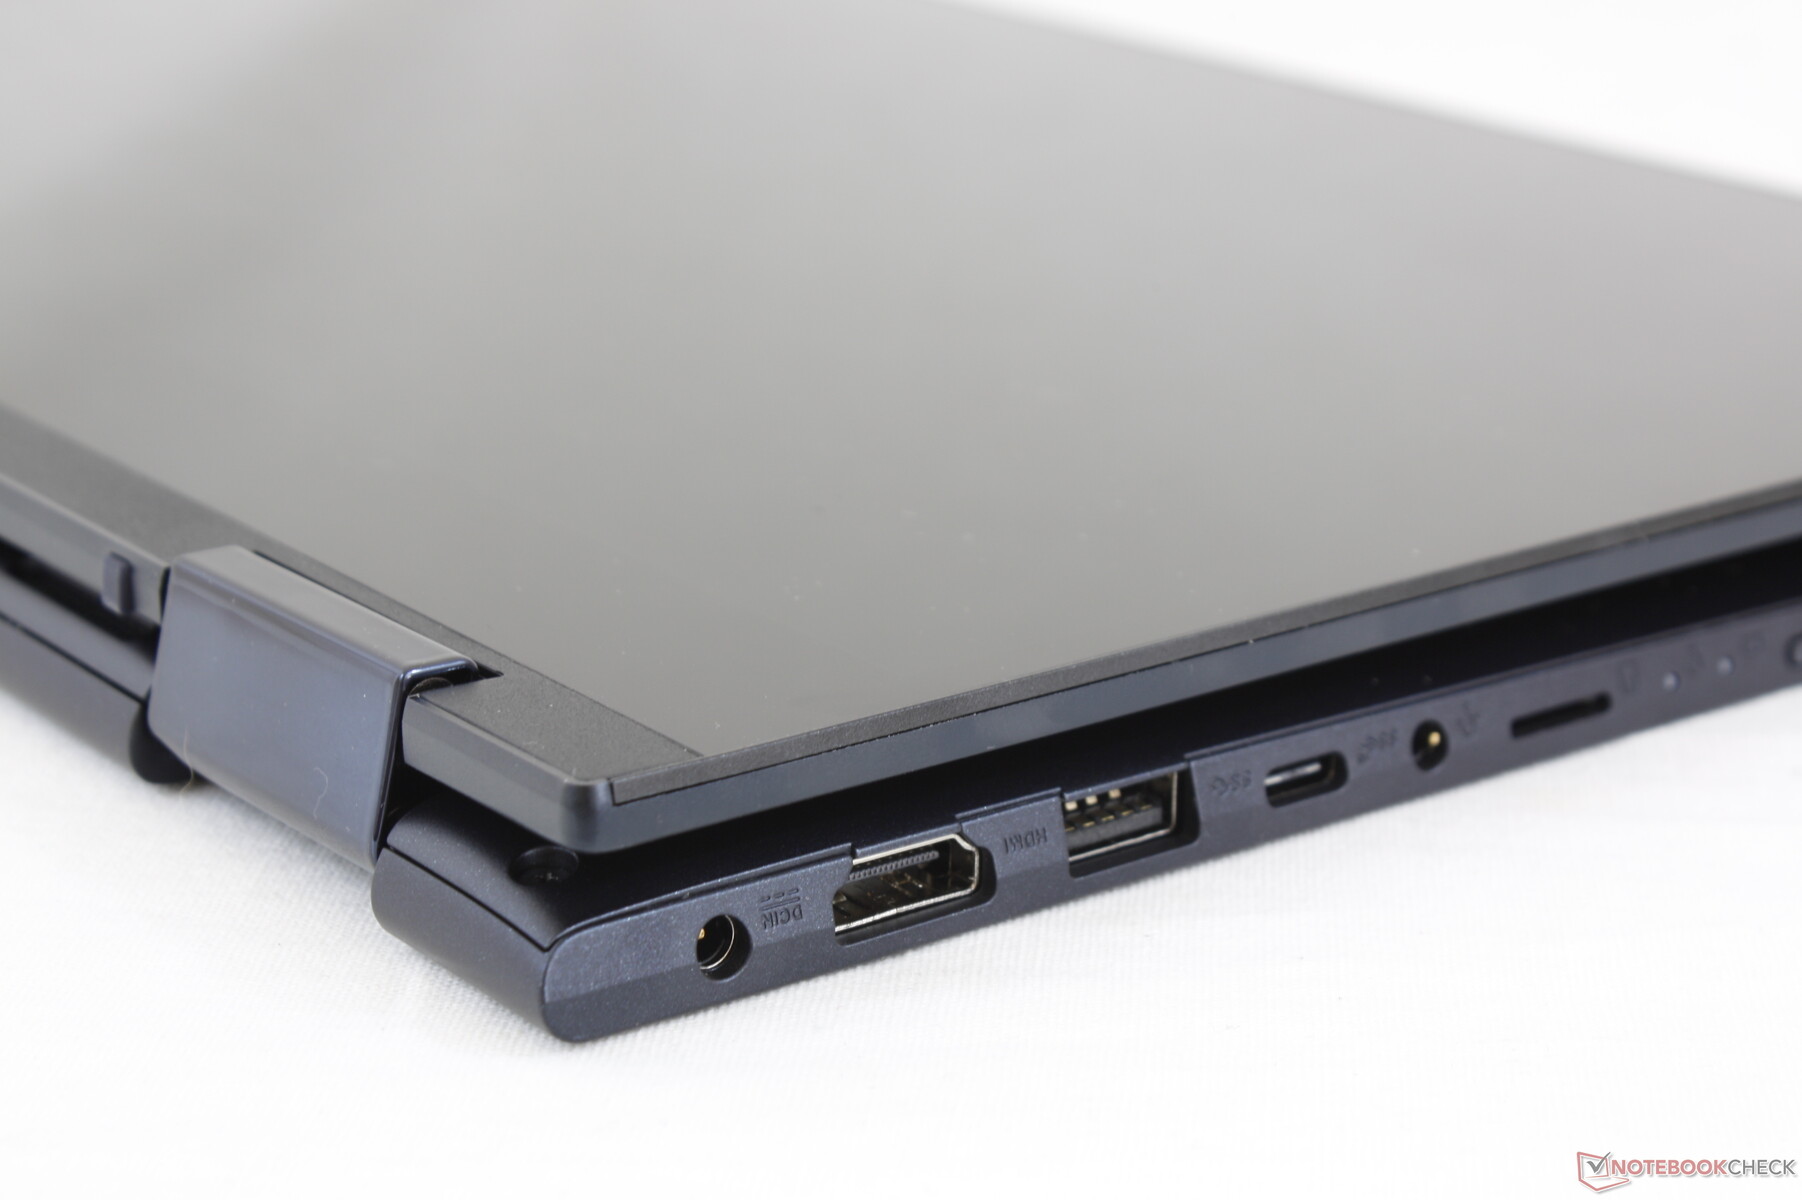
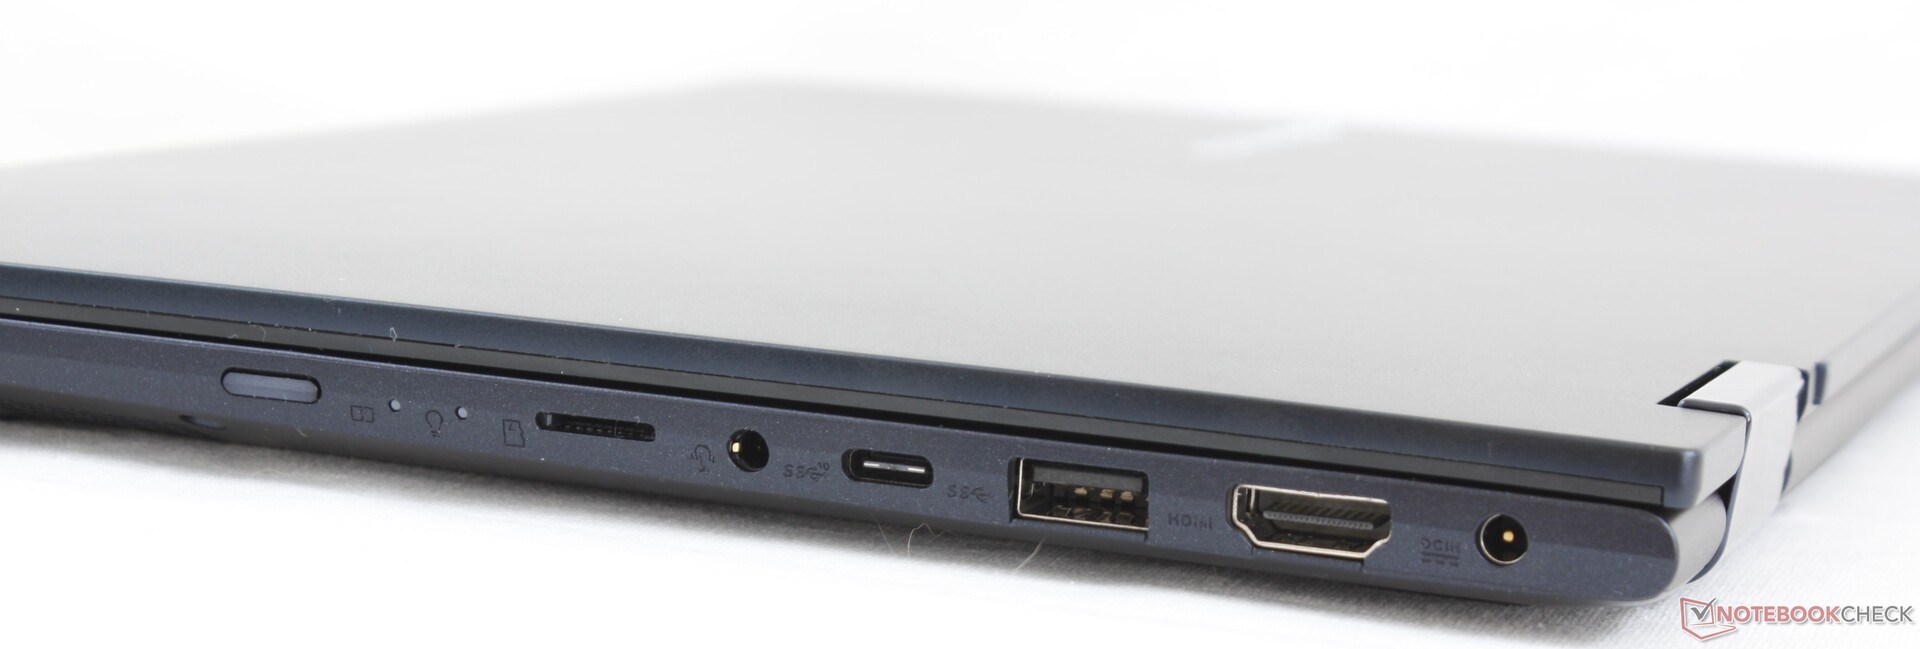
There are now two USB-A ports and a MicroSD card reader compared to three USB-A ports and a full-size SD reader on last year's VivoBook Flip TP410. Note that the USB-C port does not support DisplayPort.
SD Card Reader
| SD Card Reader | |
| average JPG Copy Test (av. of 3 runs) | |
| Asus VivoBook Flip 14 TM420IA (Toshiba Exceria Pro M501 microSDXC 64GB) | |
| Asus ZenBook Flip 14 UX463FA-AI039T (Toshiba Exceria Pro M501 microSDXC 64GB) | |
| Lenovo IdeaPad 3 14IIL05 (Toshiba Exceria Pro SDXC 64 GB UHS-II) | |
| maximum AS SSD Seq Read Test (1GB) | |
| Asus VivoBook Flip 14 TM420IA (Toshiba Exceria Pro M501 microSDXC 64GB) | |
| Lenovo IdeaPad 3 14IIL05 (Toshiba Exceria Pro SDXC 64 GB UHS-II) | |
| Asus ZenBook Flip 14 UX463FA-AI039T (Toshiba Exceria Pro M501 microSDXC 64GB) | |
Communication
| Networking | |
| iperf3 transmit AX12 | |
| Lenovo Yoga C740-14IML | |
| Honor Magicbook 14 | |
| Acer Swift 3 SF314-42-R27B | |
| Asus VivoBook Flip 14 TM420IA | |
| iperf3 receive AX12 | |
| Lenovo Yoga C740-14IML | |
| Acer Swift 3 SF314-42-R27B | |
| Honor Magicbook 14 | |
| Asus VivoBook Flip 14 TM420IA | |
Webcam


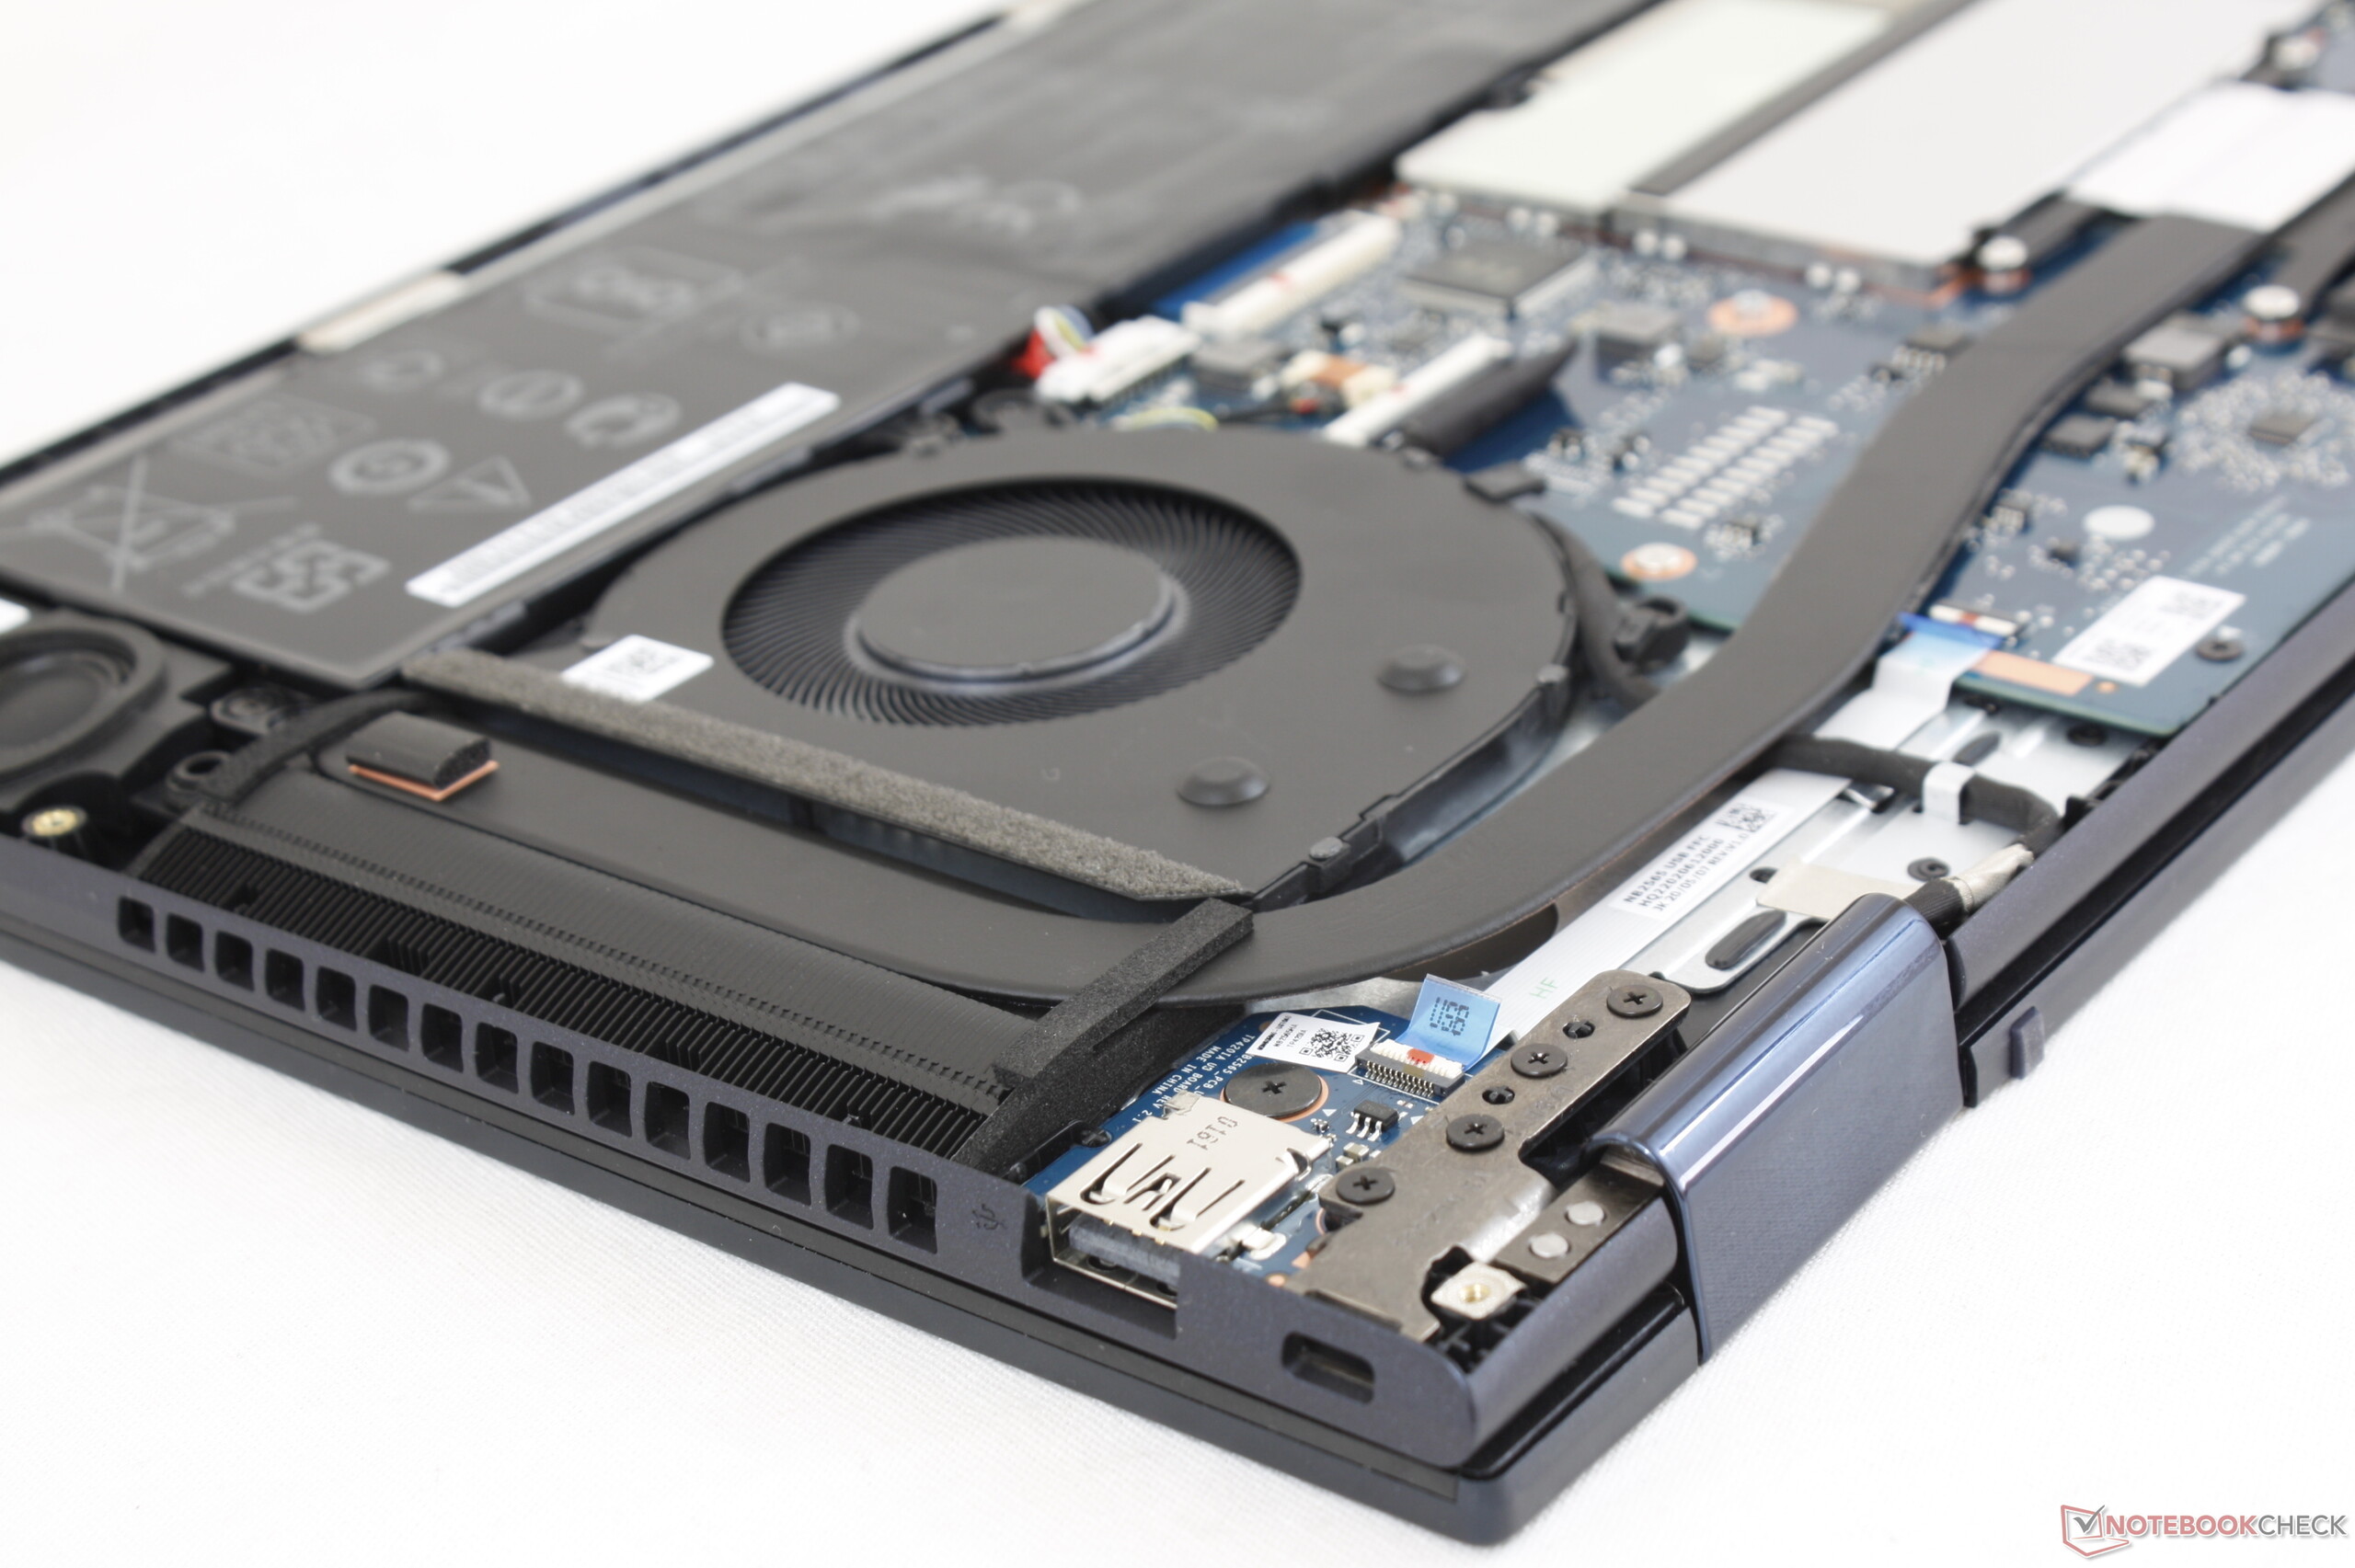
Maintenance
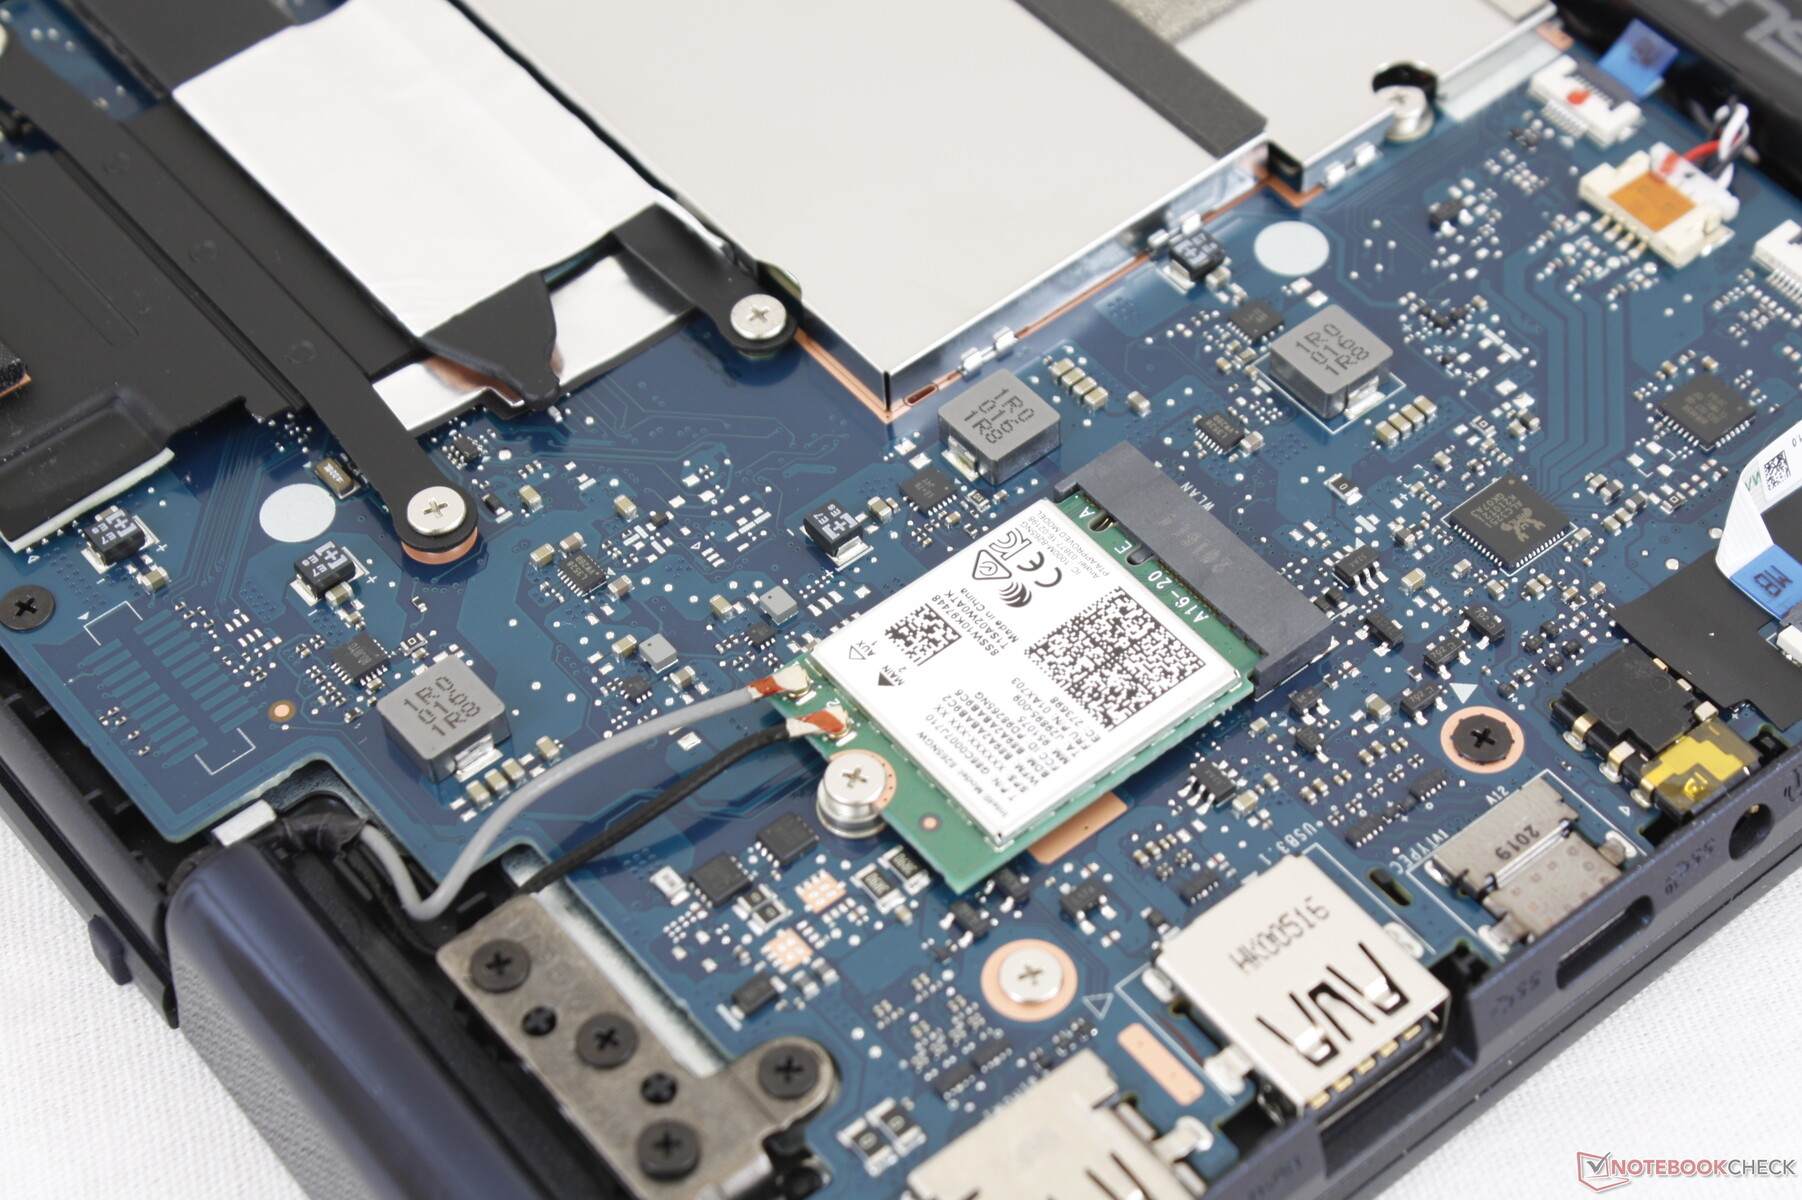
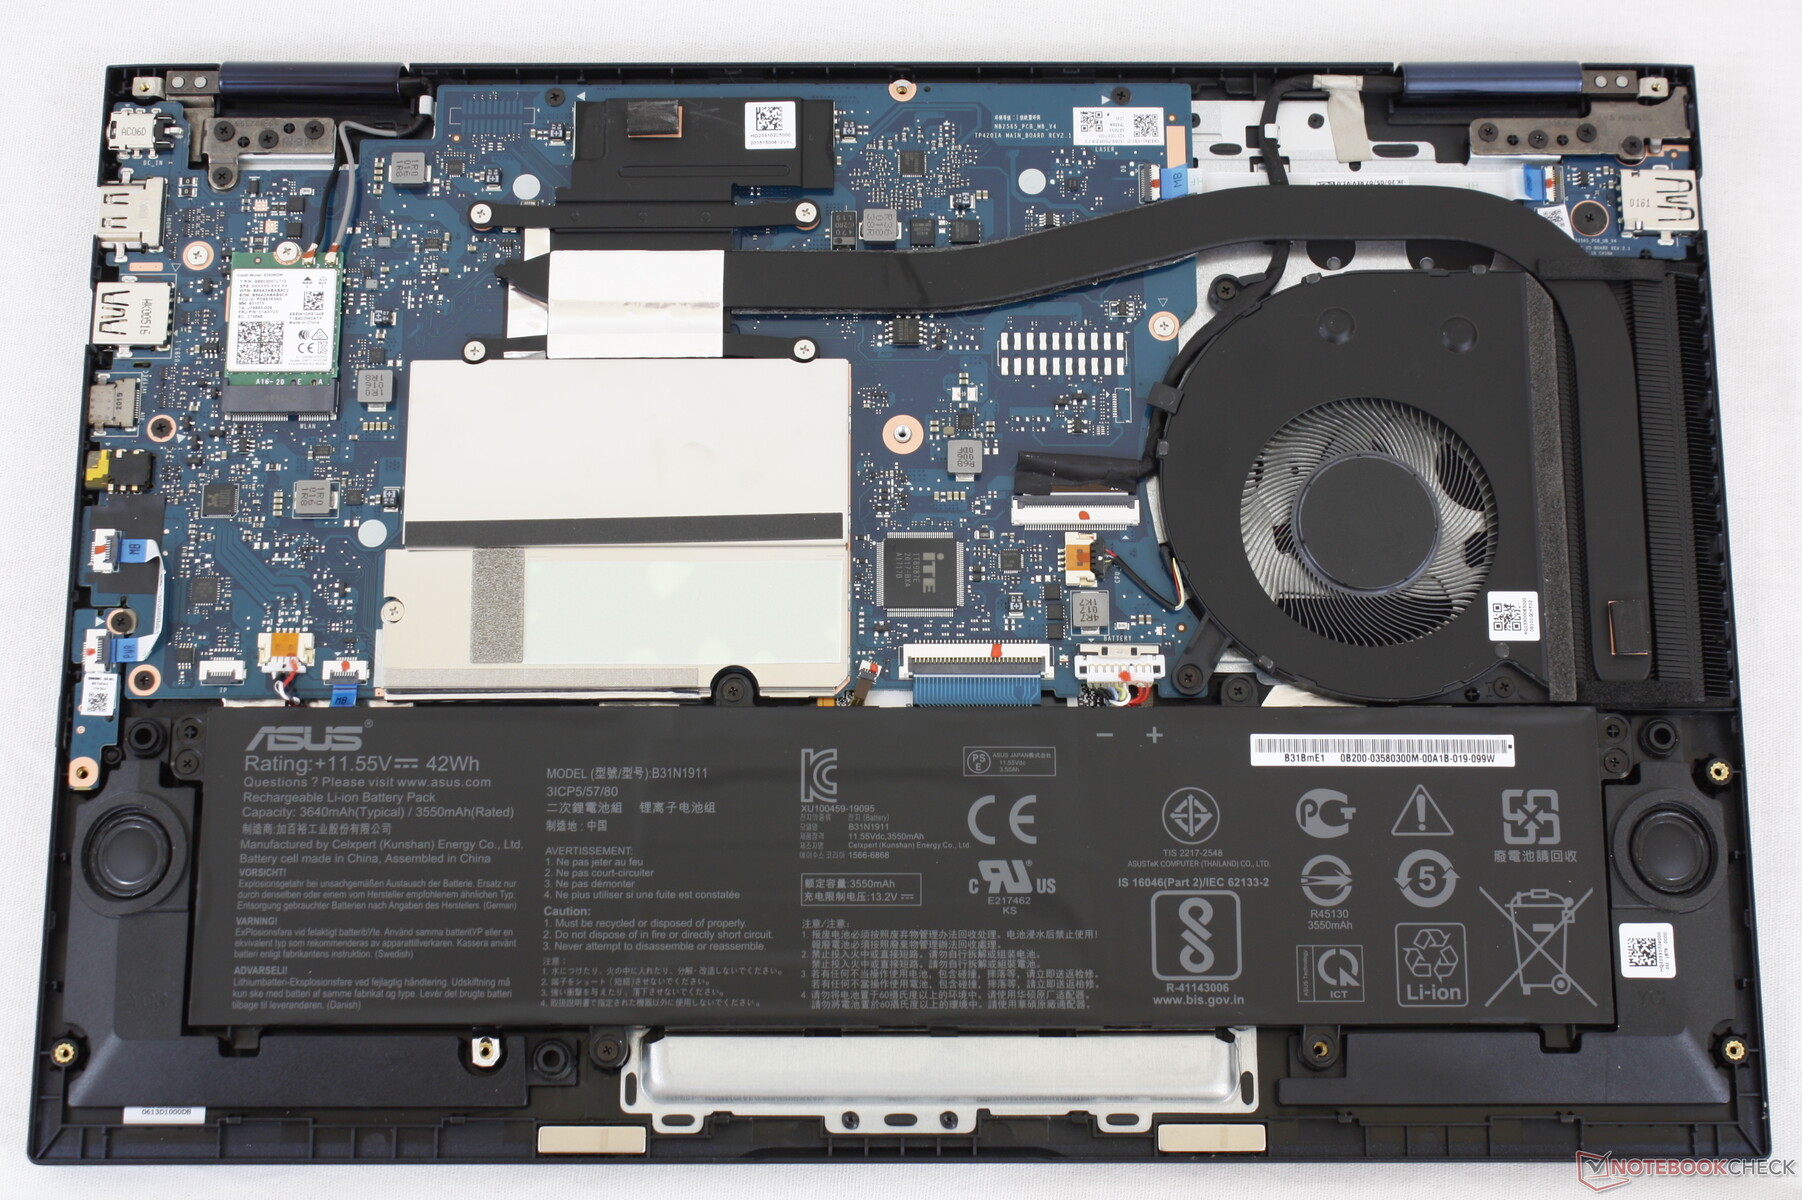
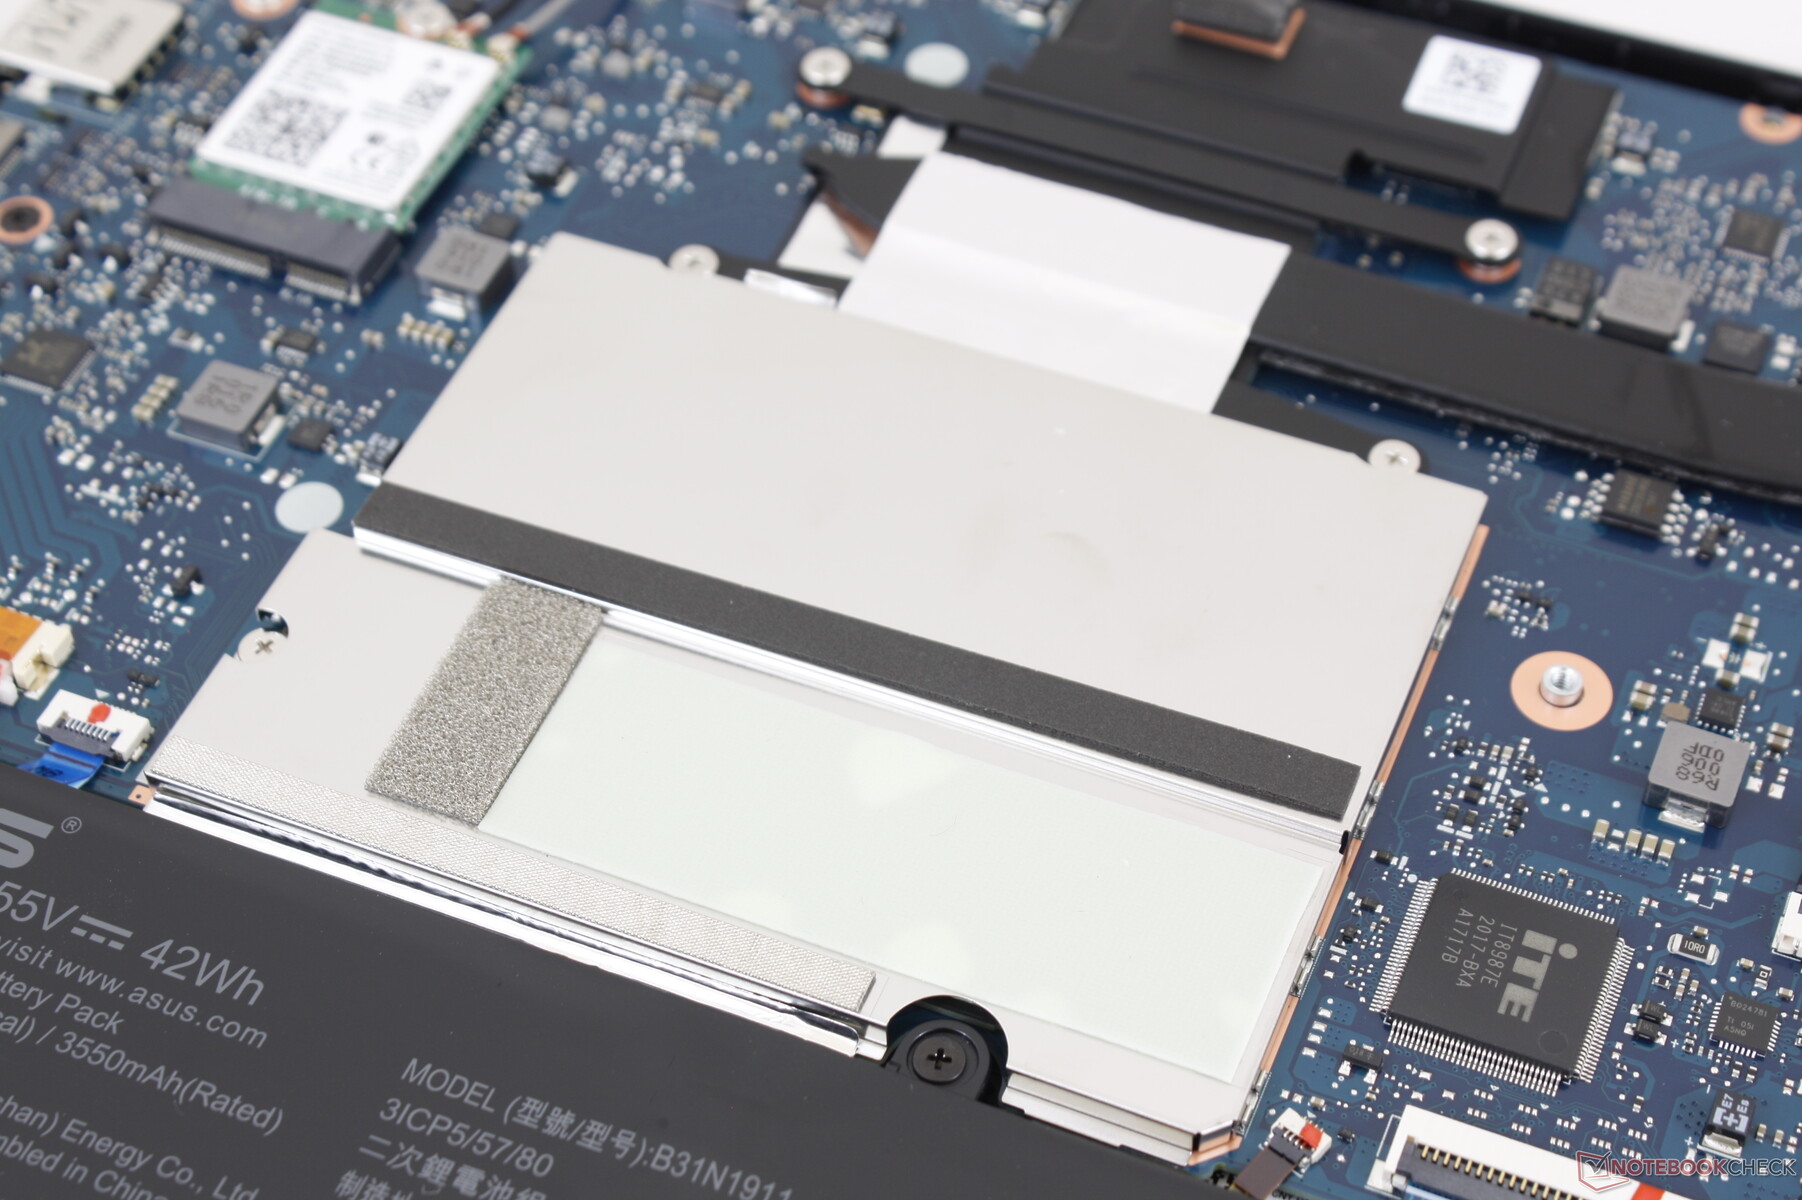
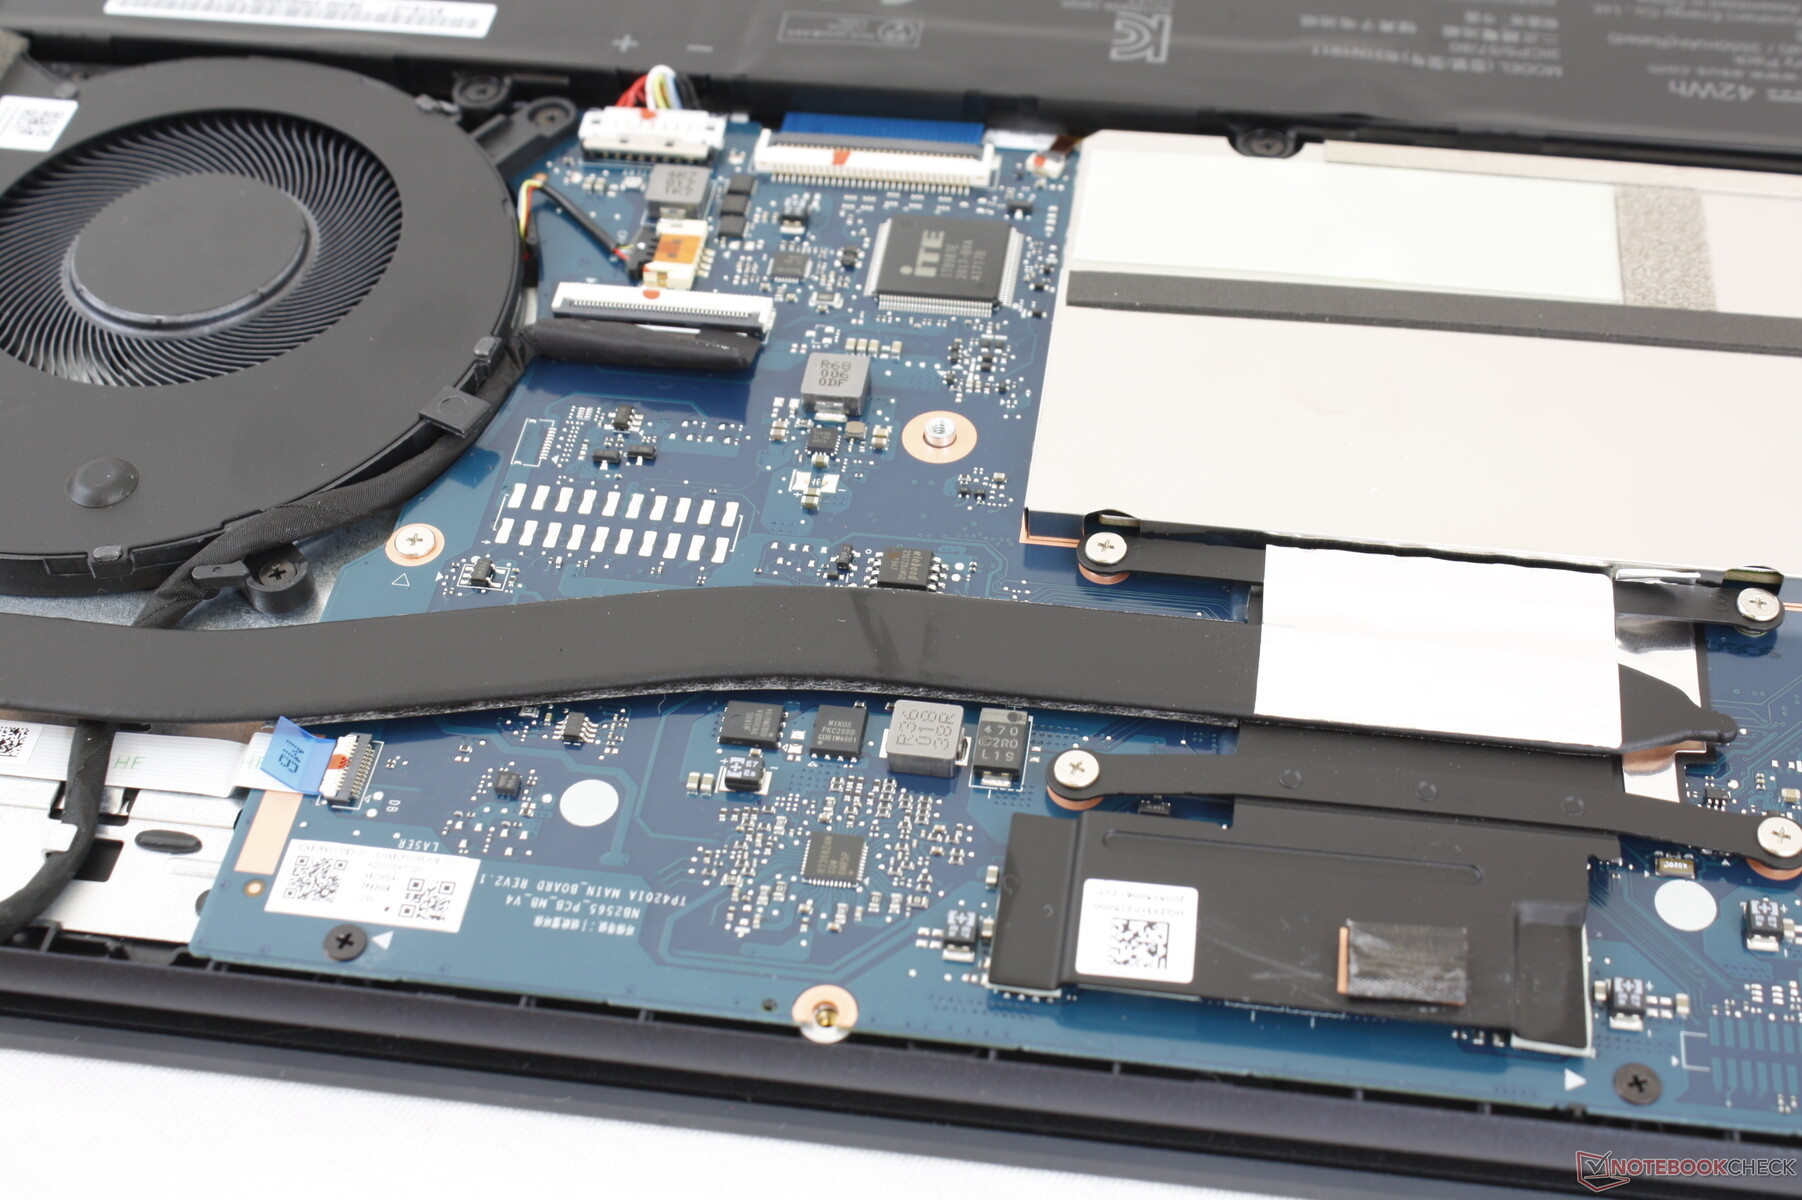
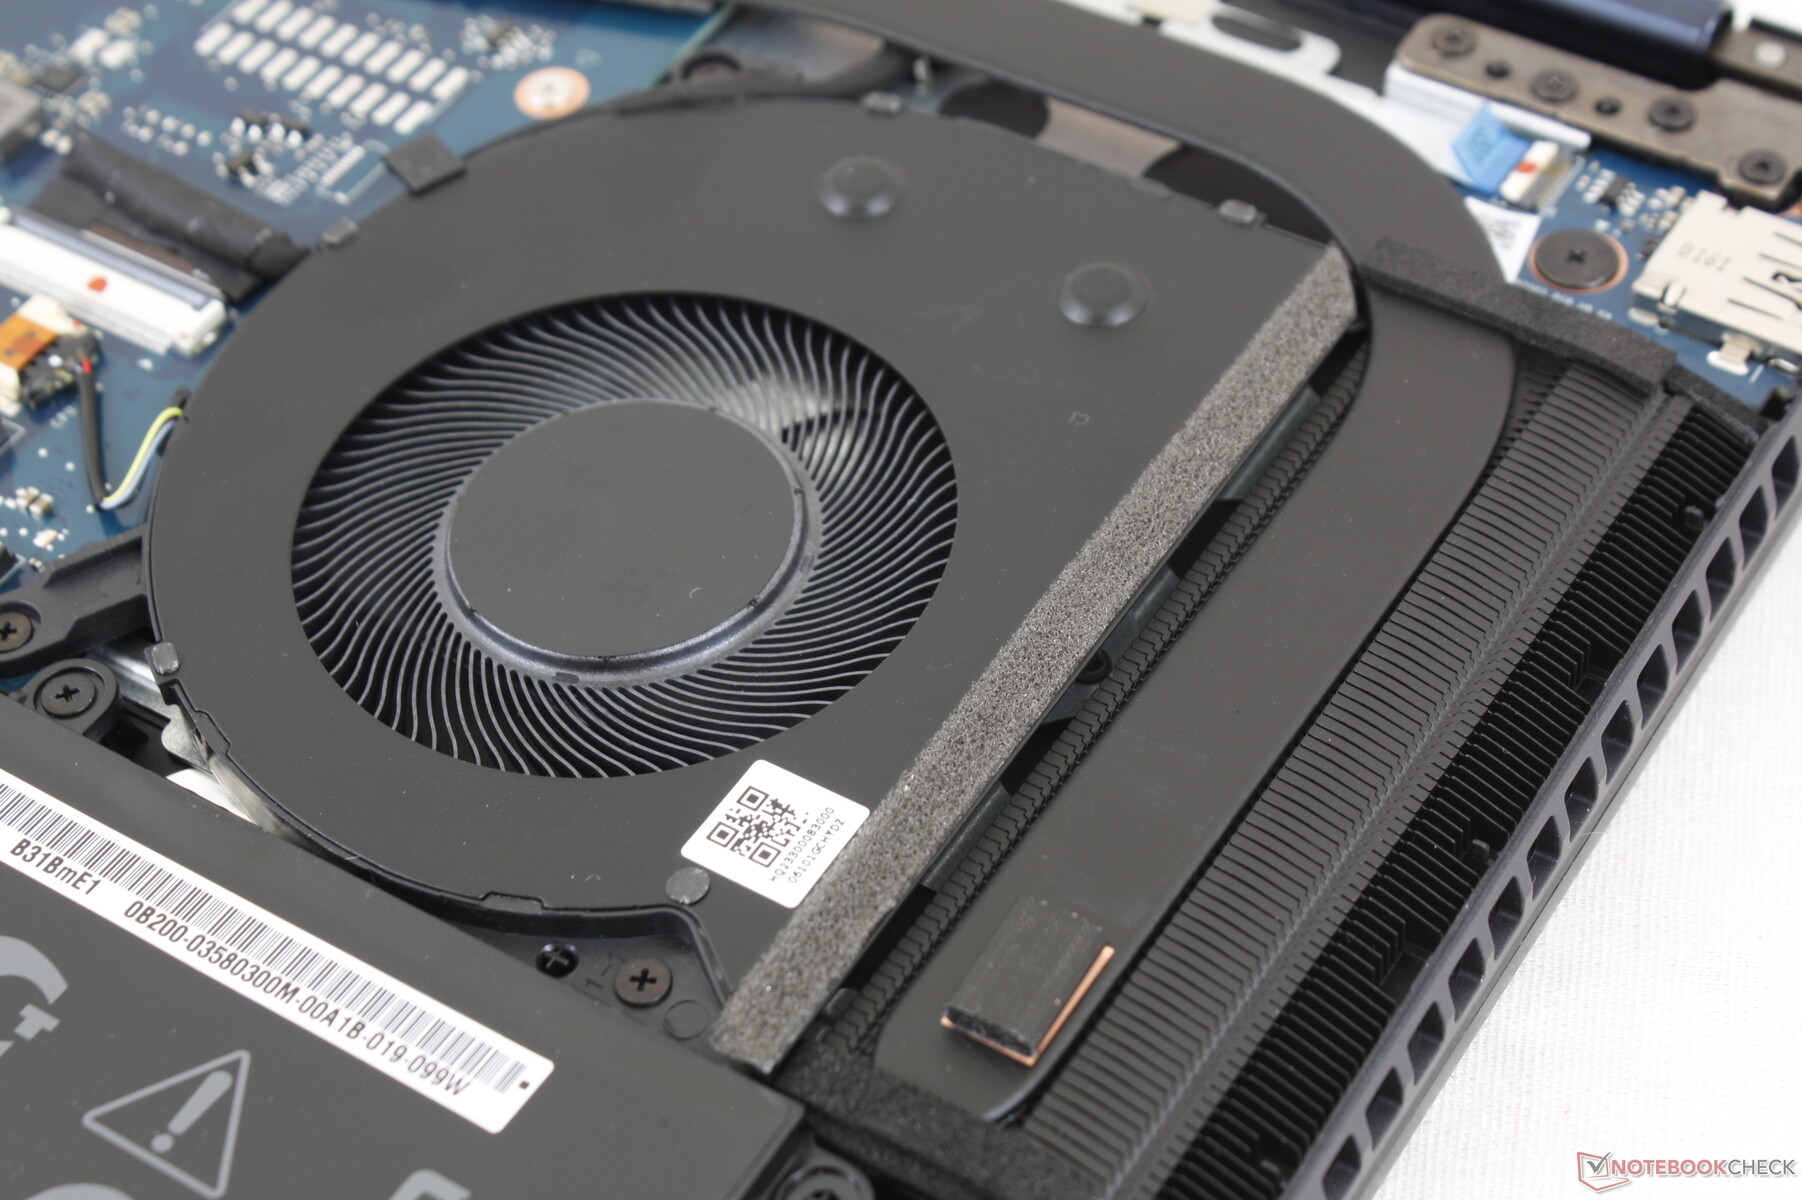
The bottom panel is secured by 10 Philips screws for easy removal. The M.2 SSD, M.2 WLAN, and 1x SODIMM slot are all accessible. Keep in mind that 4 GB of RAM comes soldered.
Accessories and Warranty
The box includes an active stylus pen in addition to the usual AC adapter and paperwork. The standard one-year limited warranty applies.
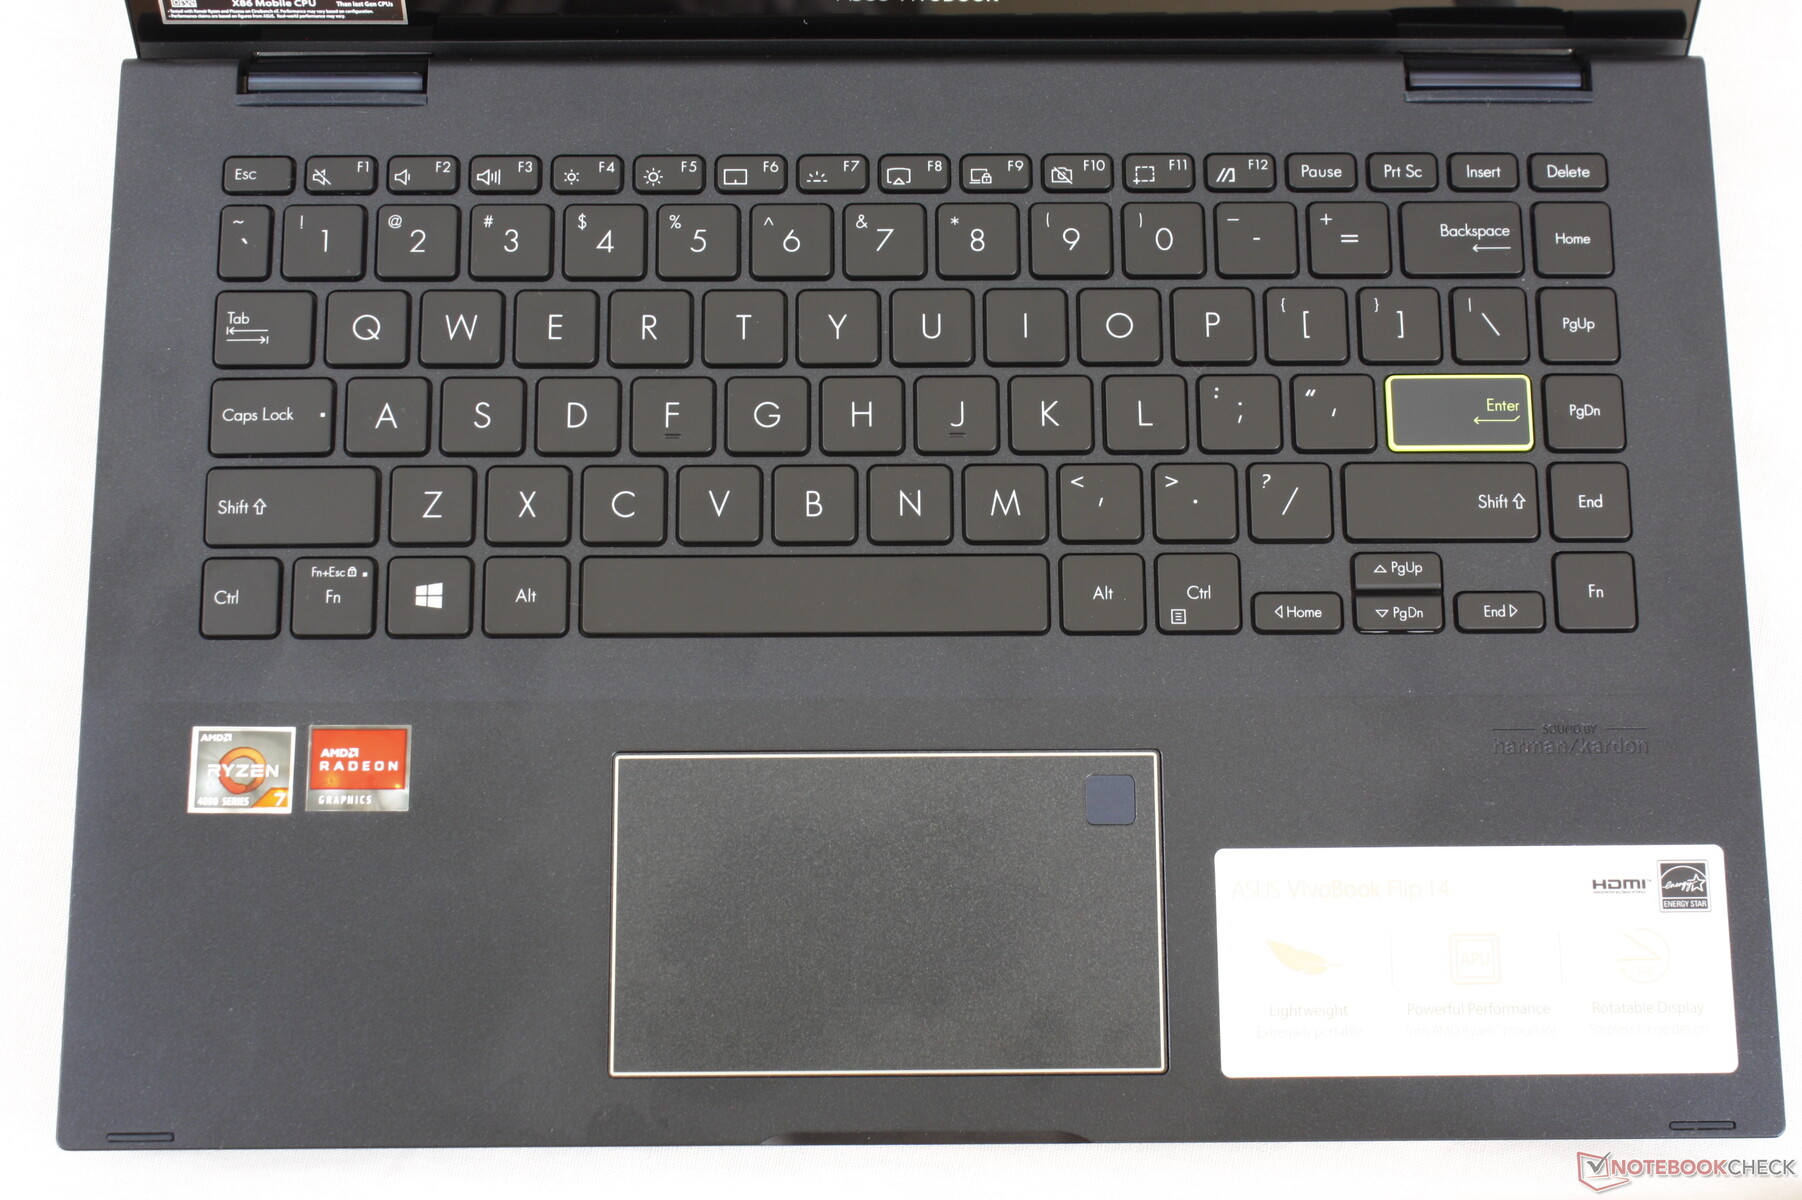
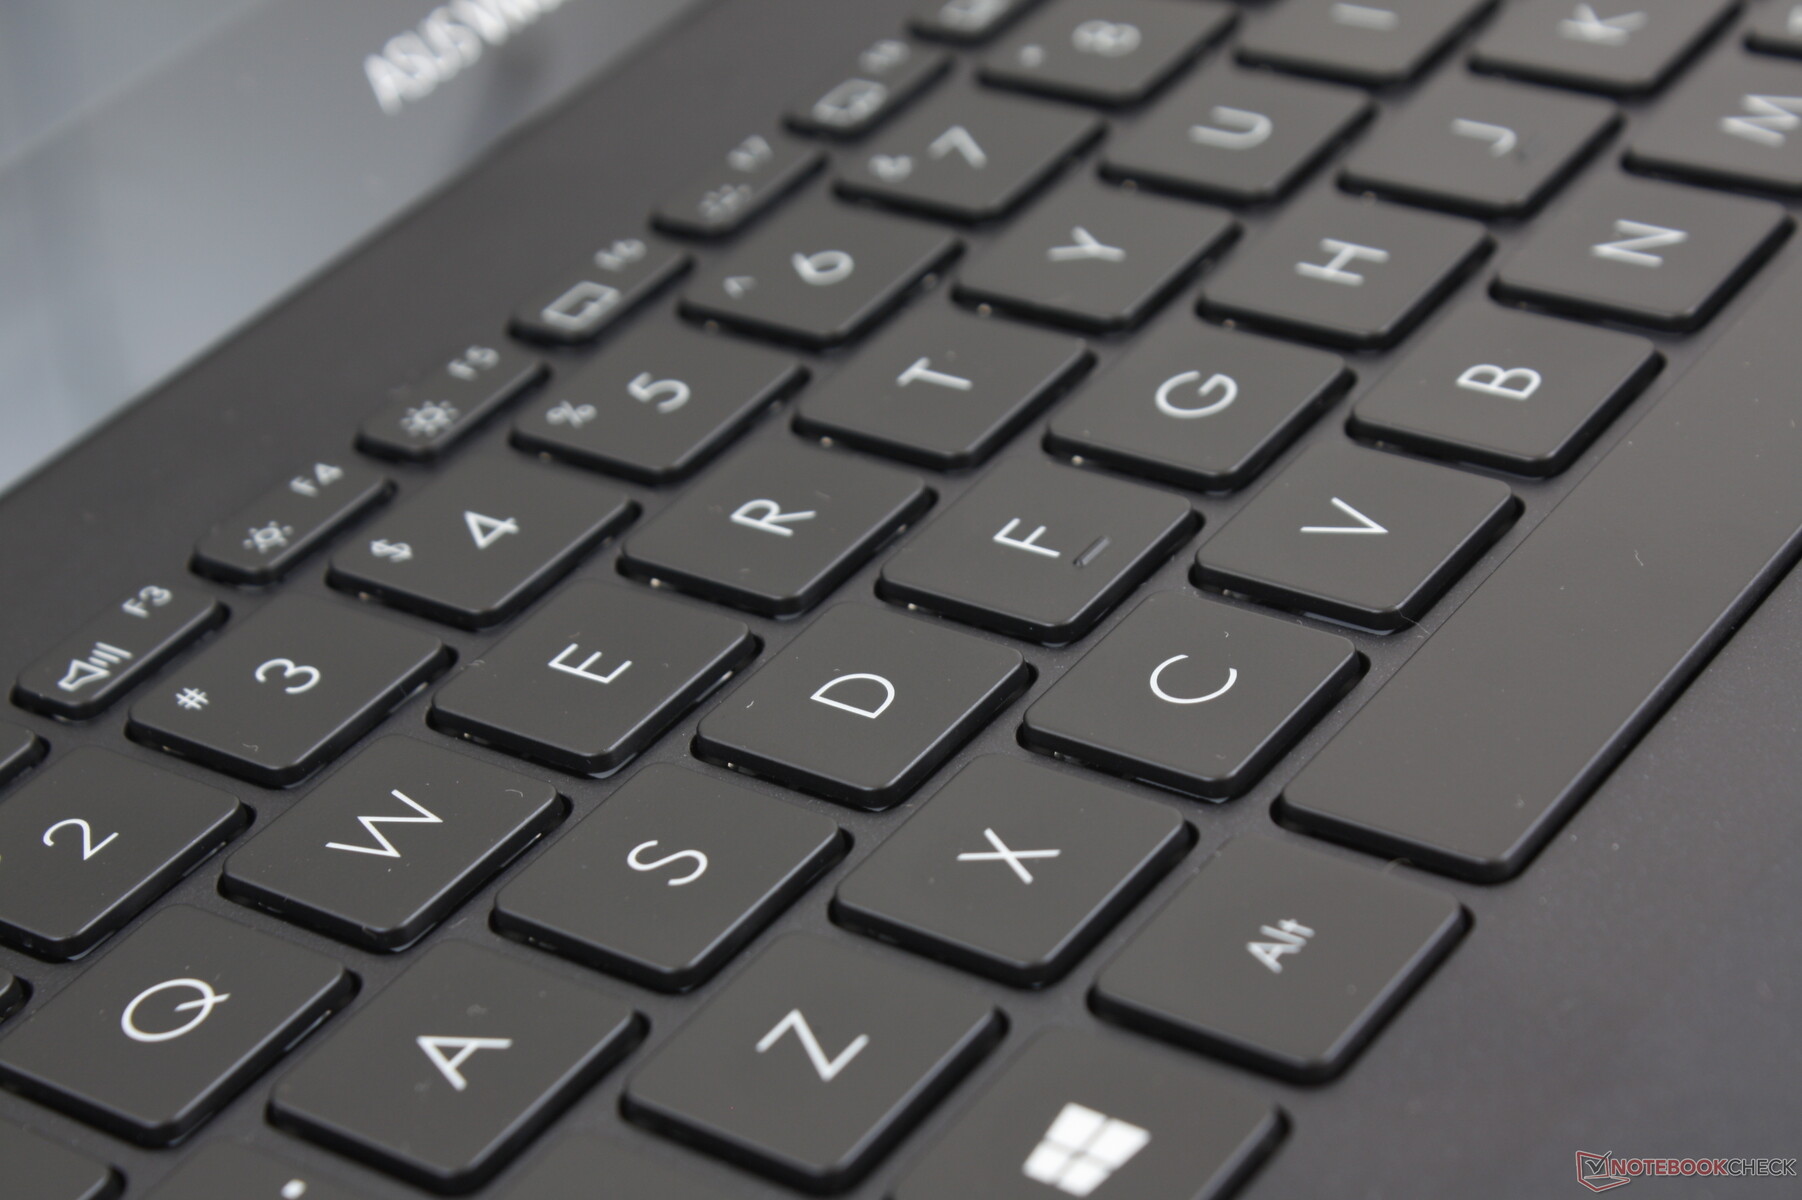
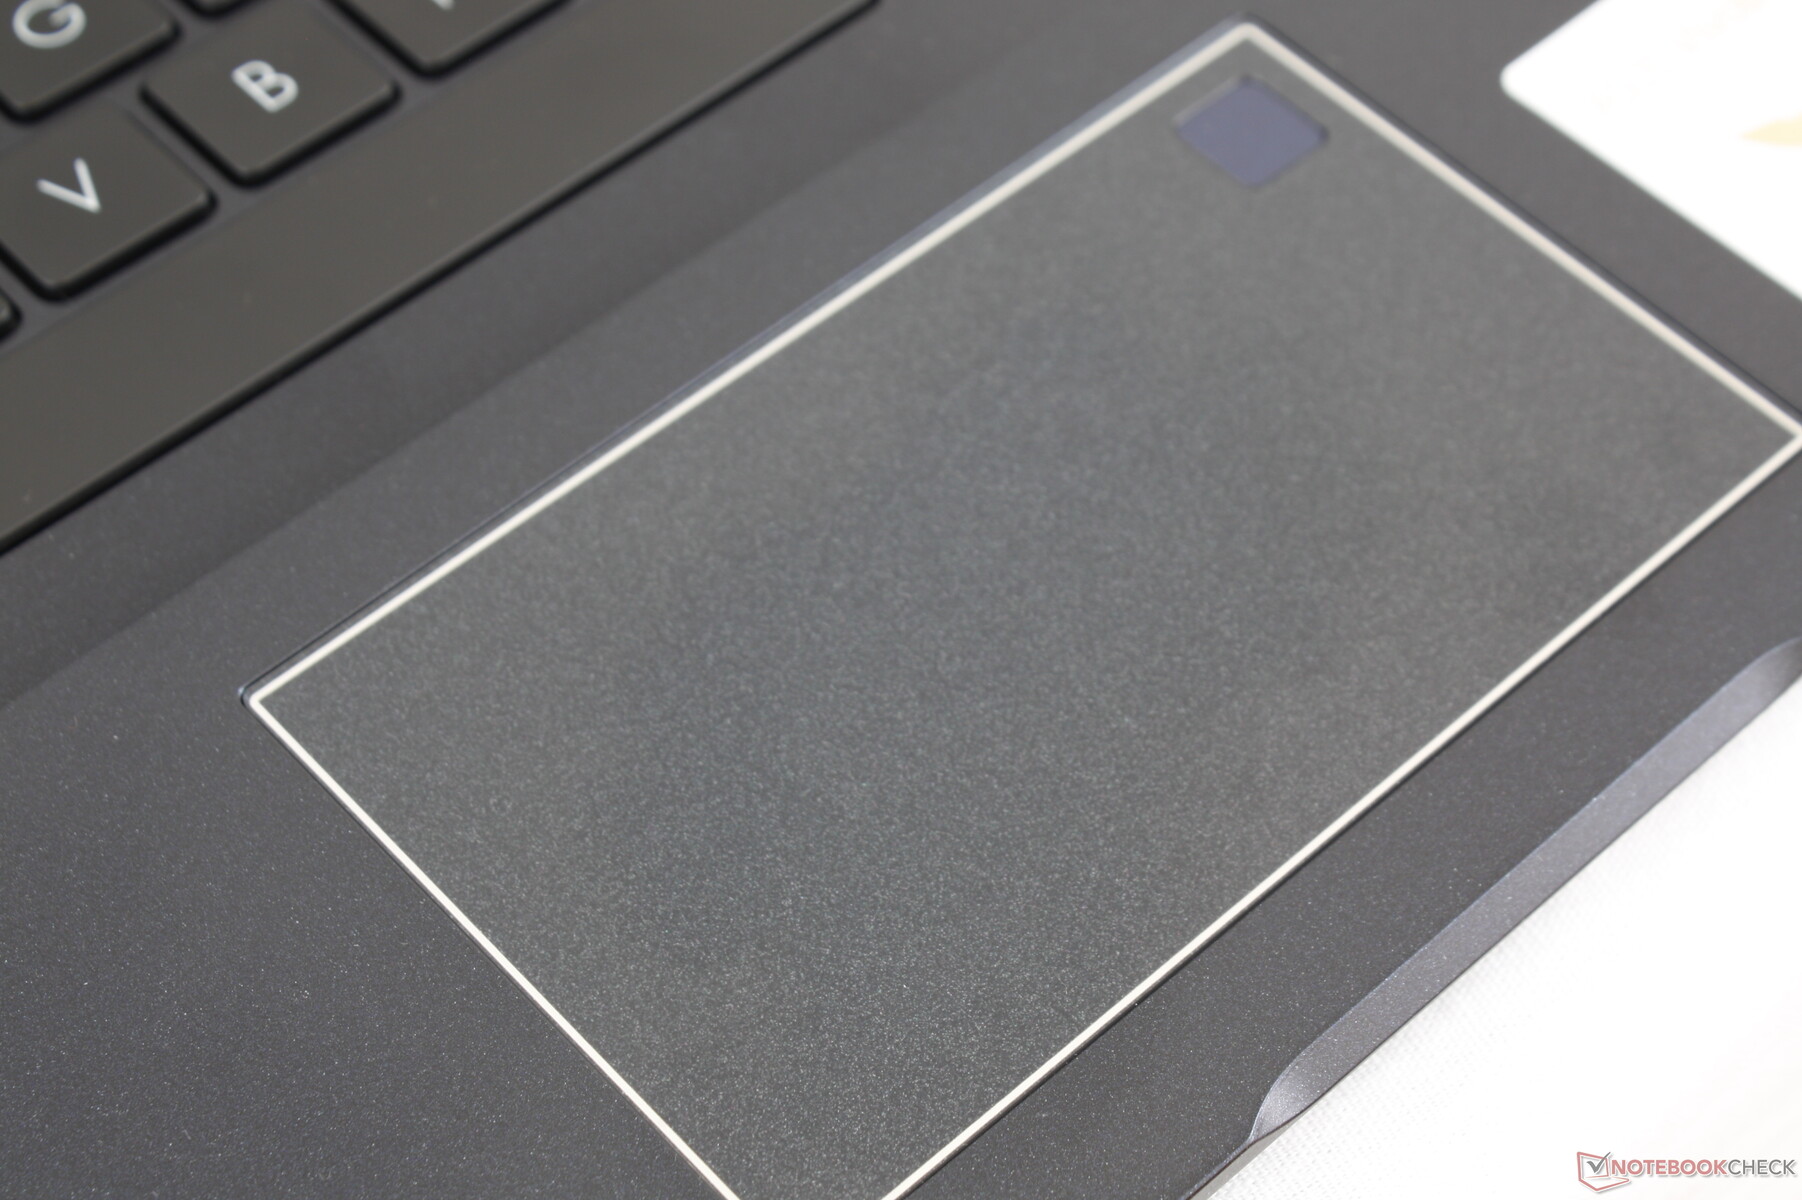
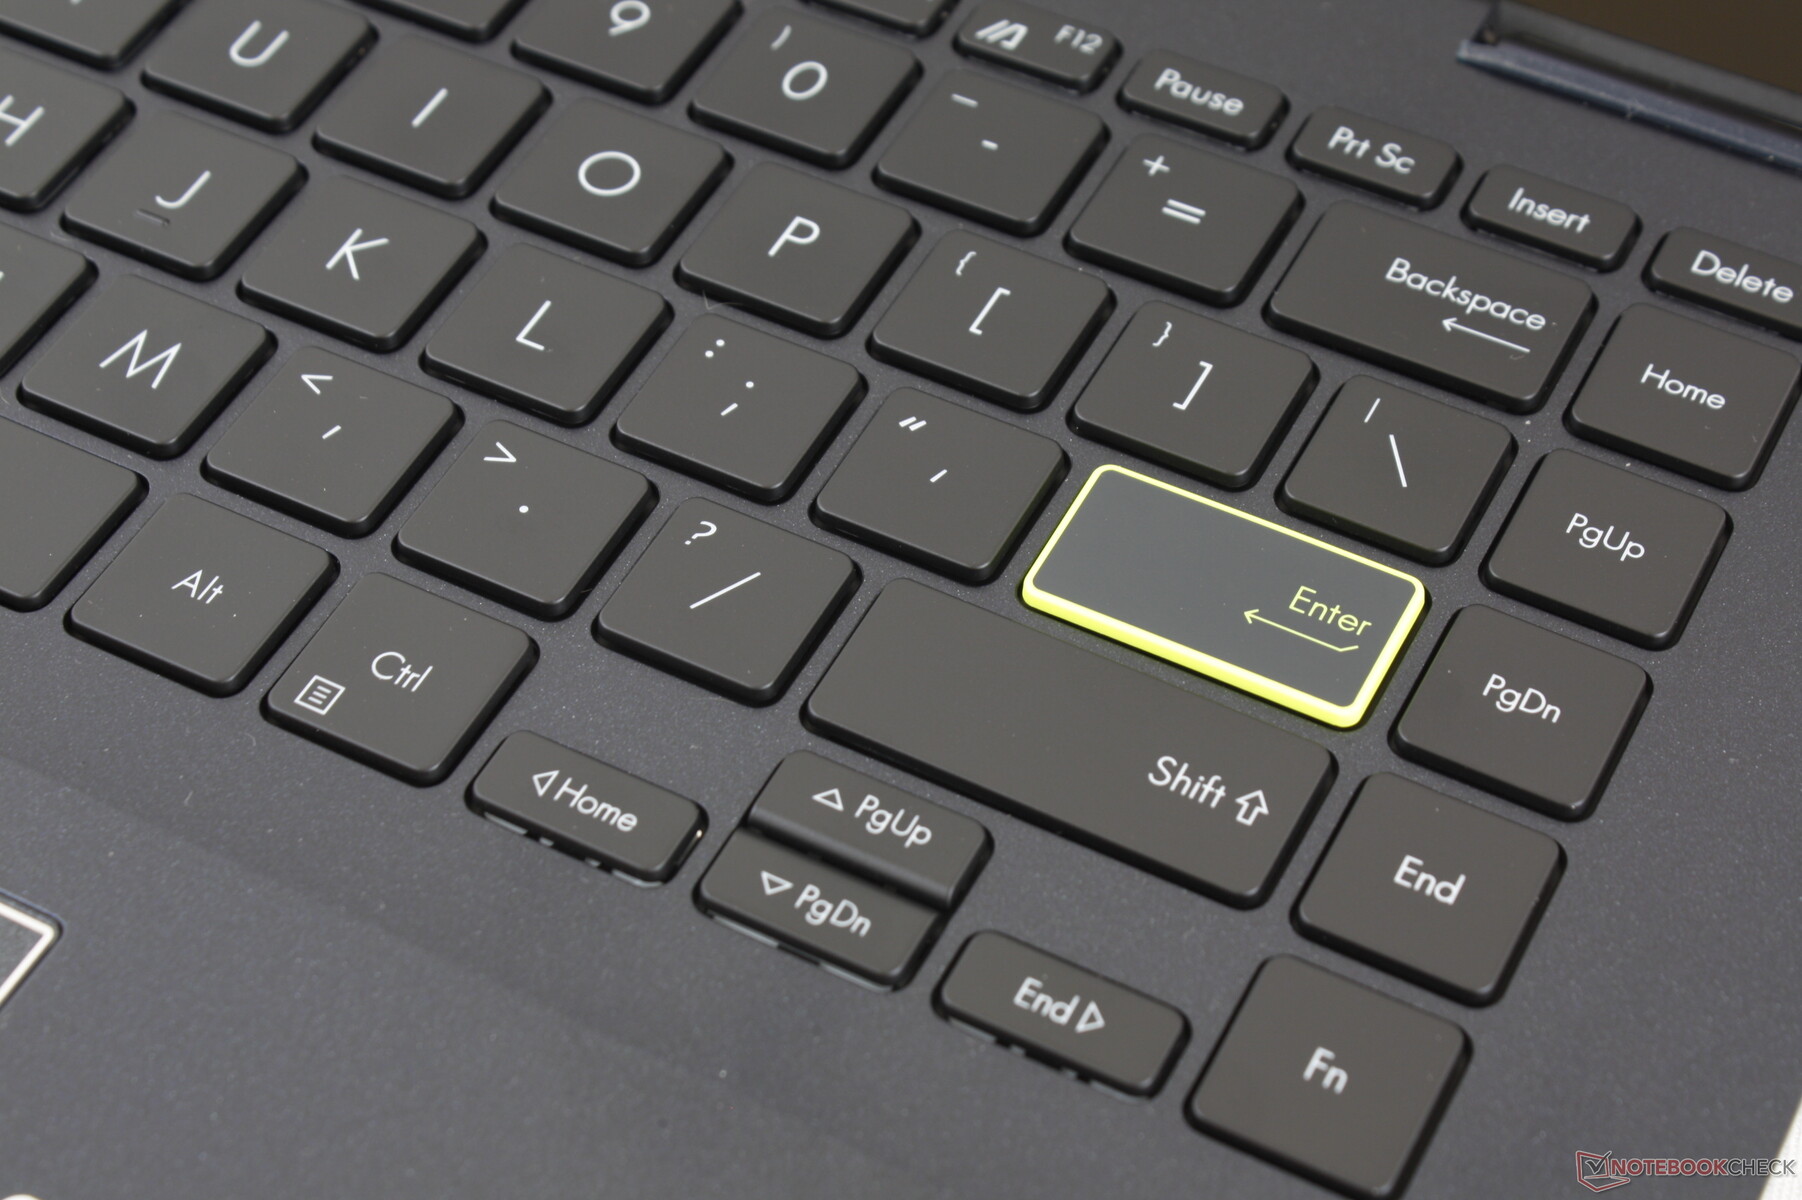
Input Devices
Keyboard and Touchpad
Display
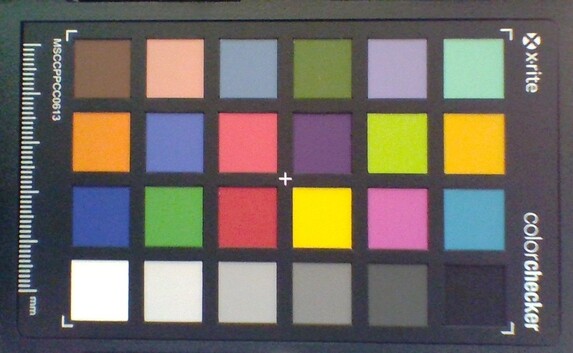
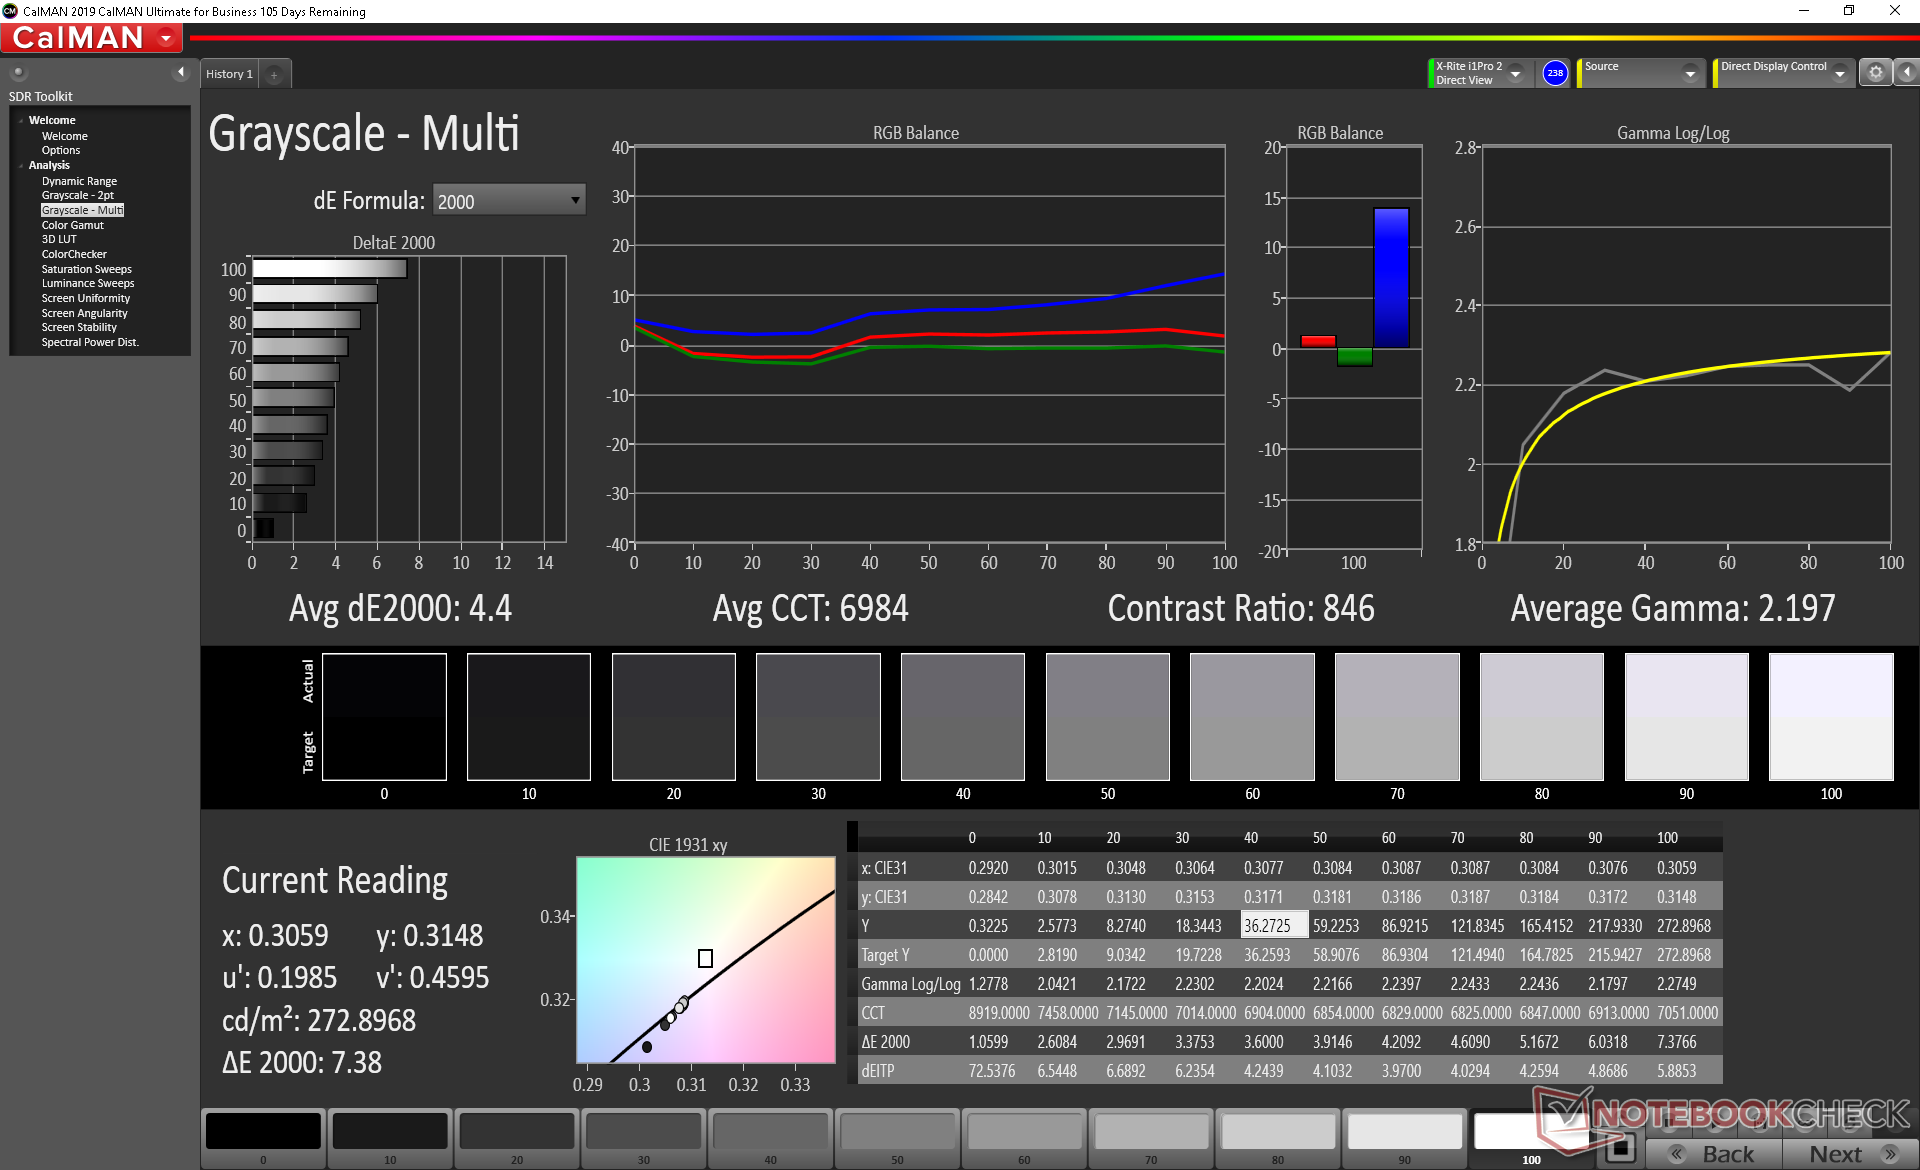
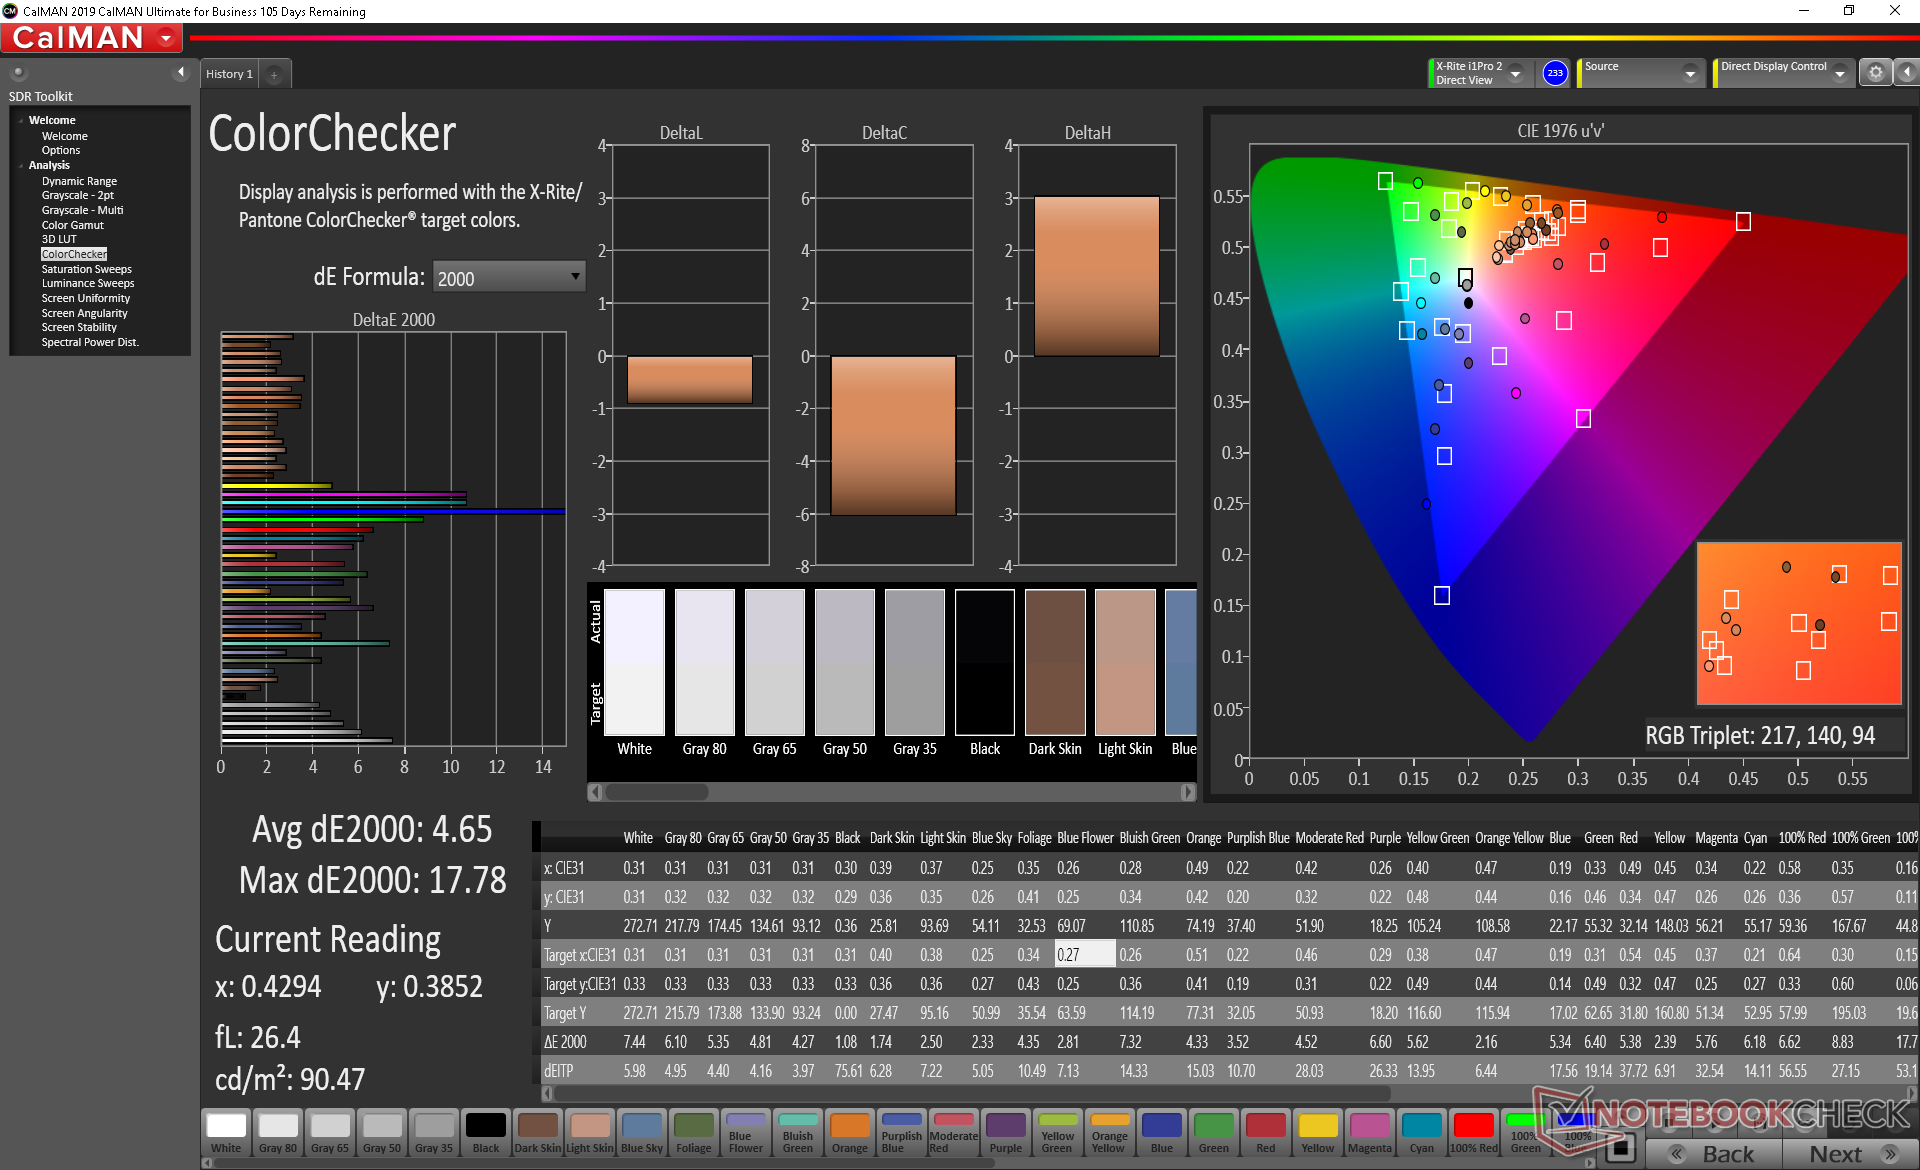
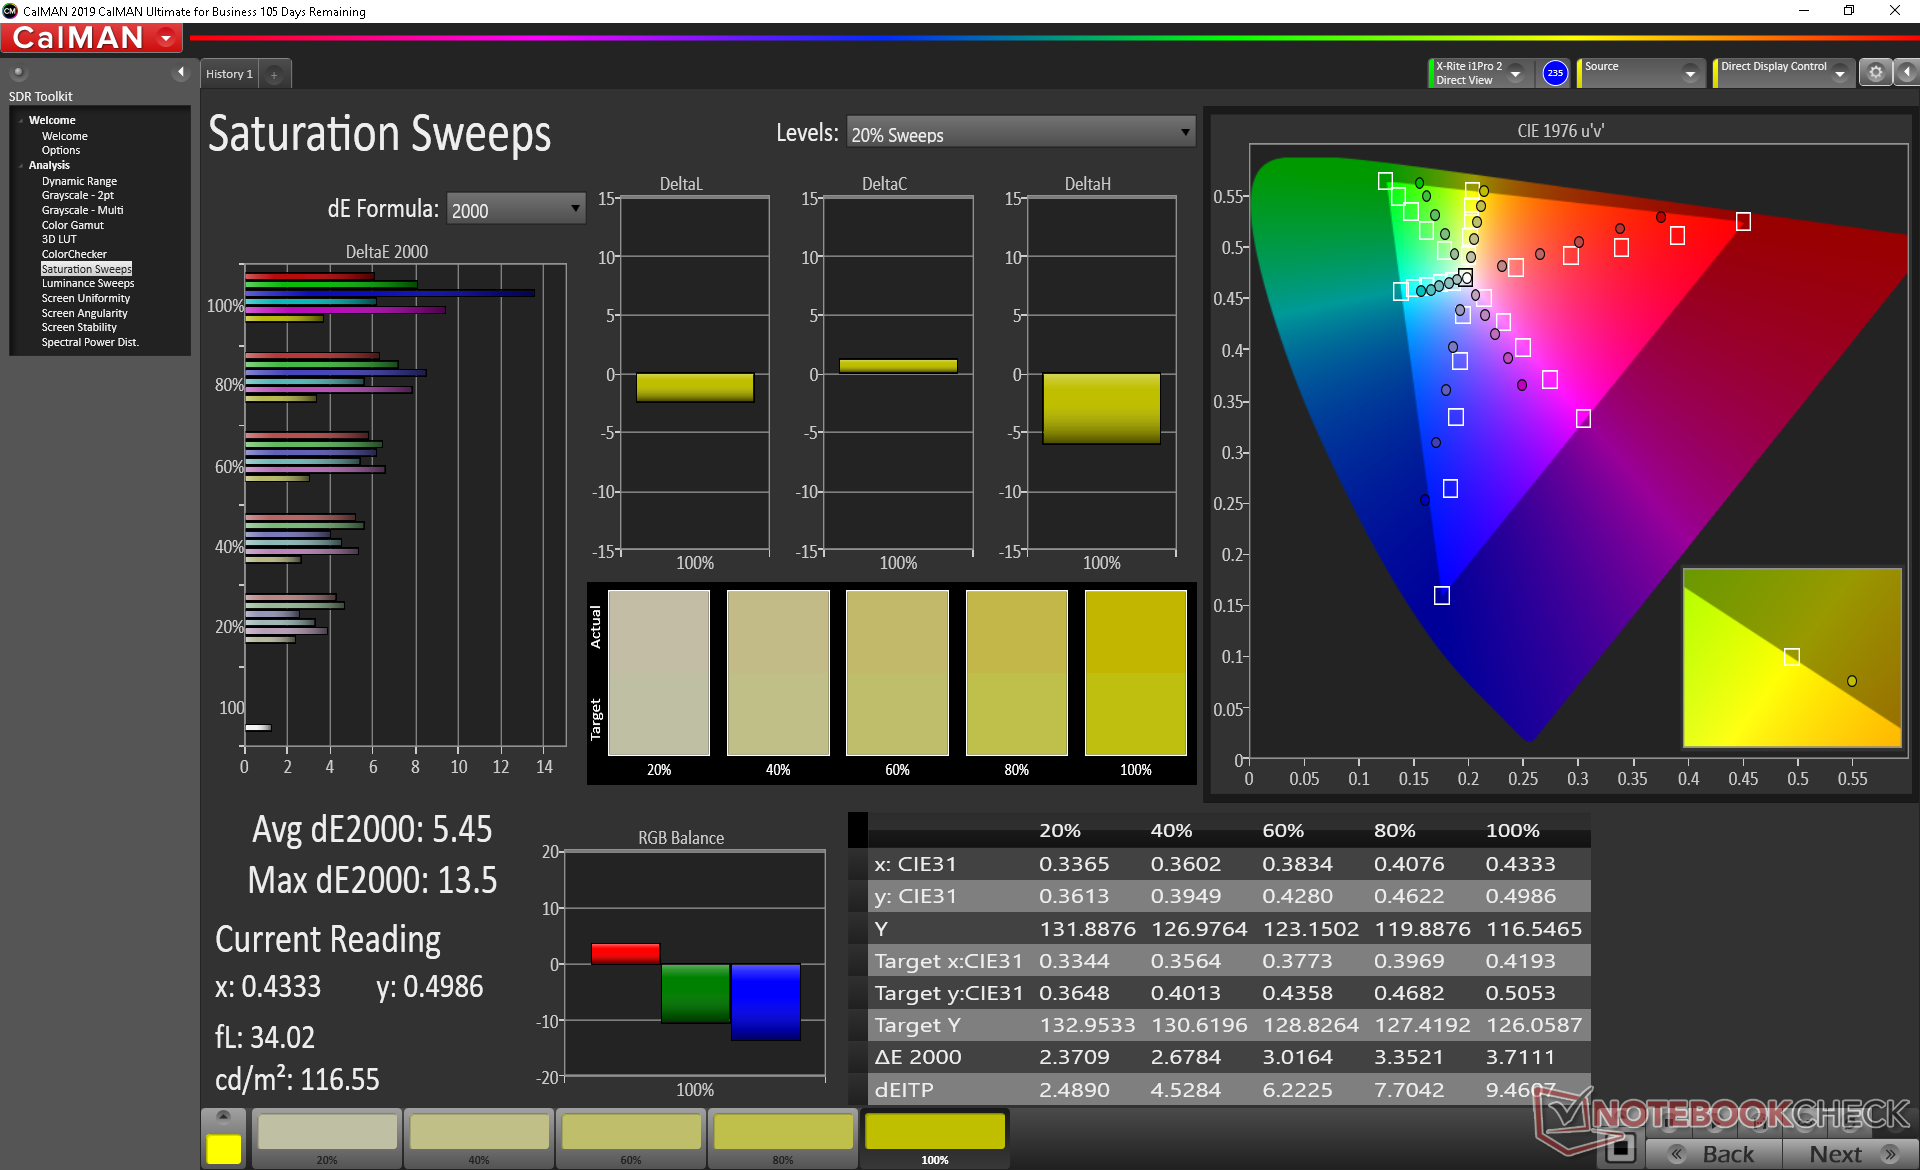
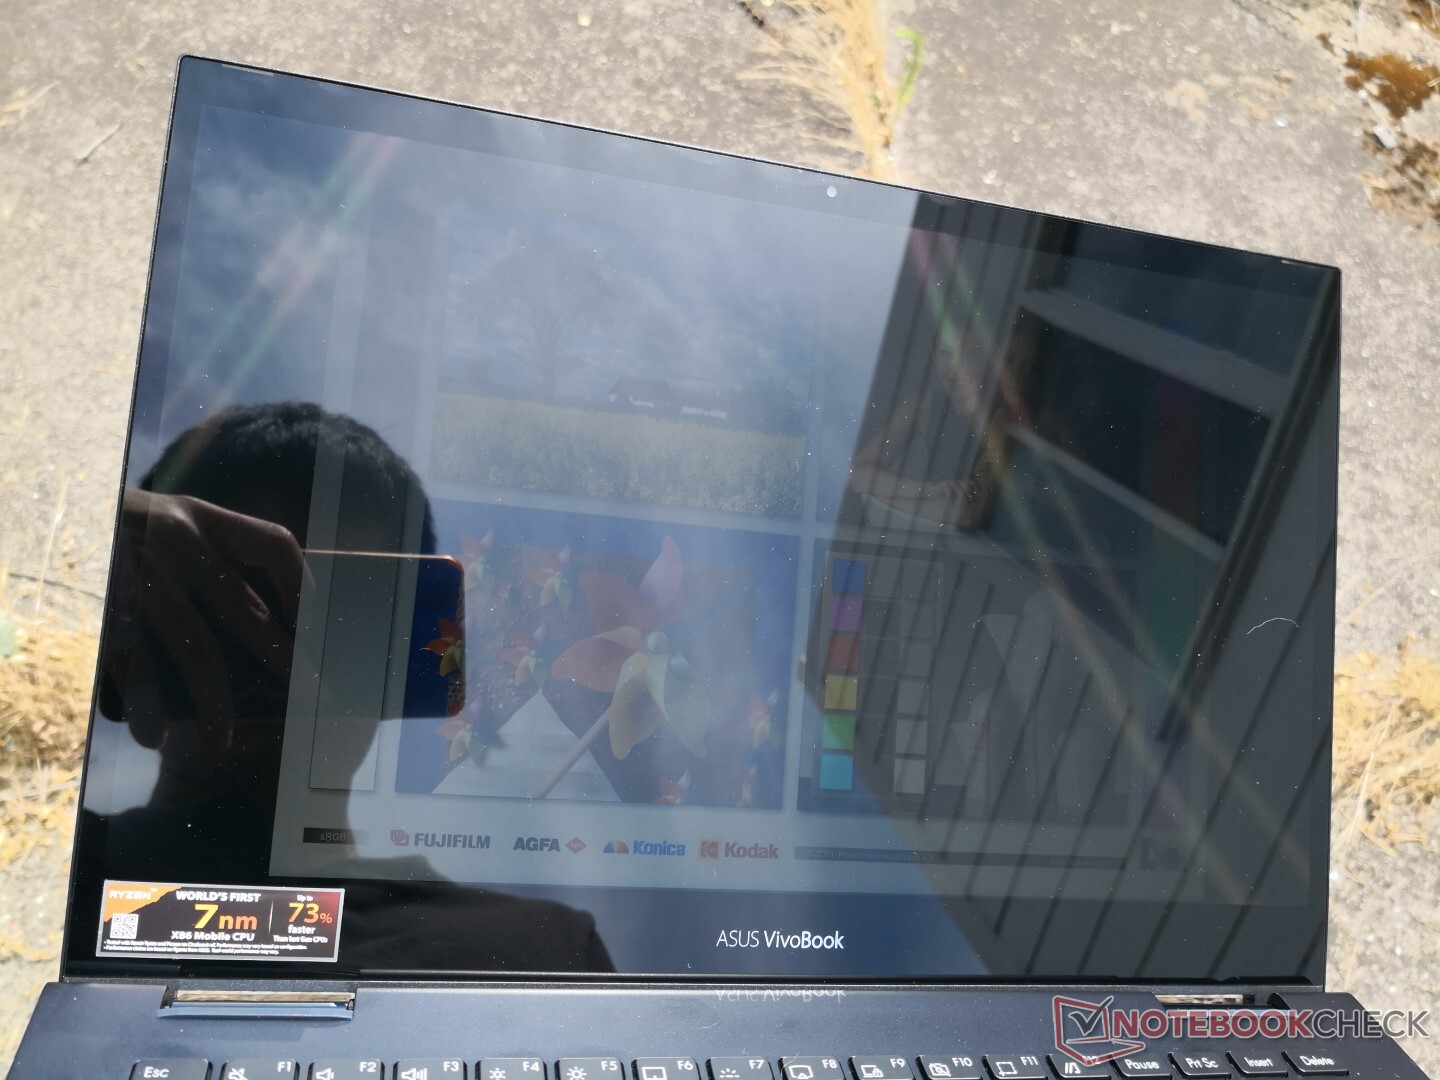
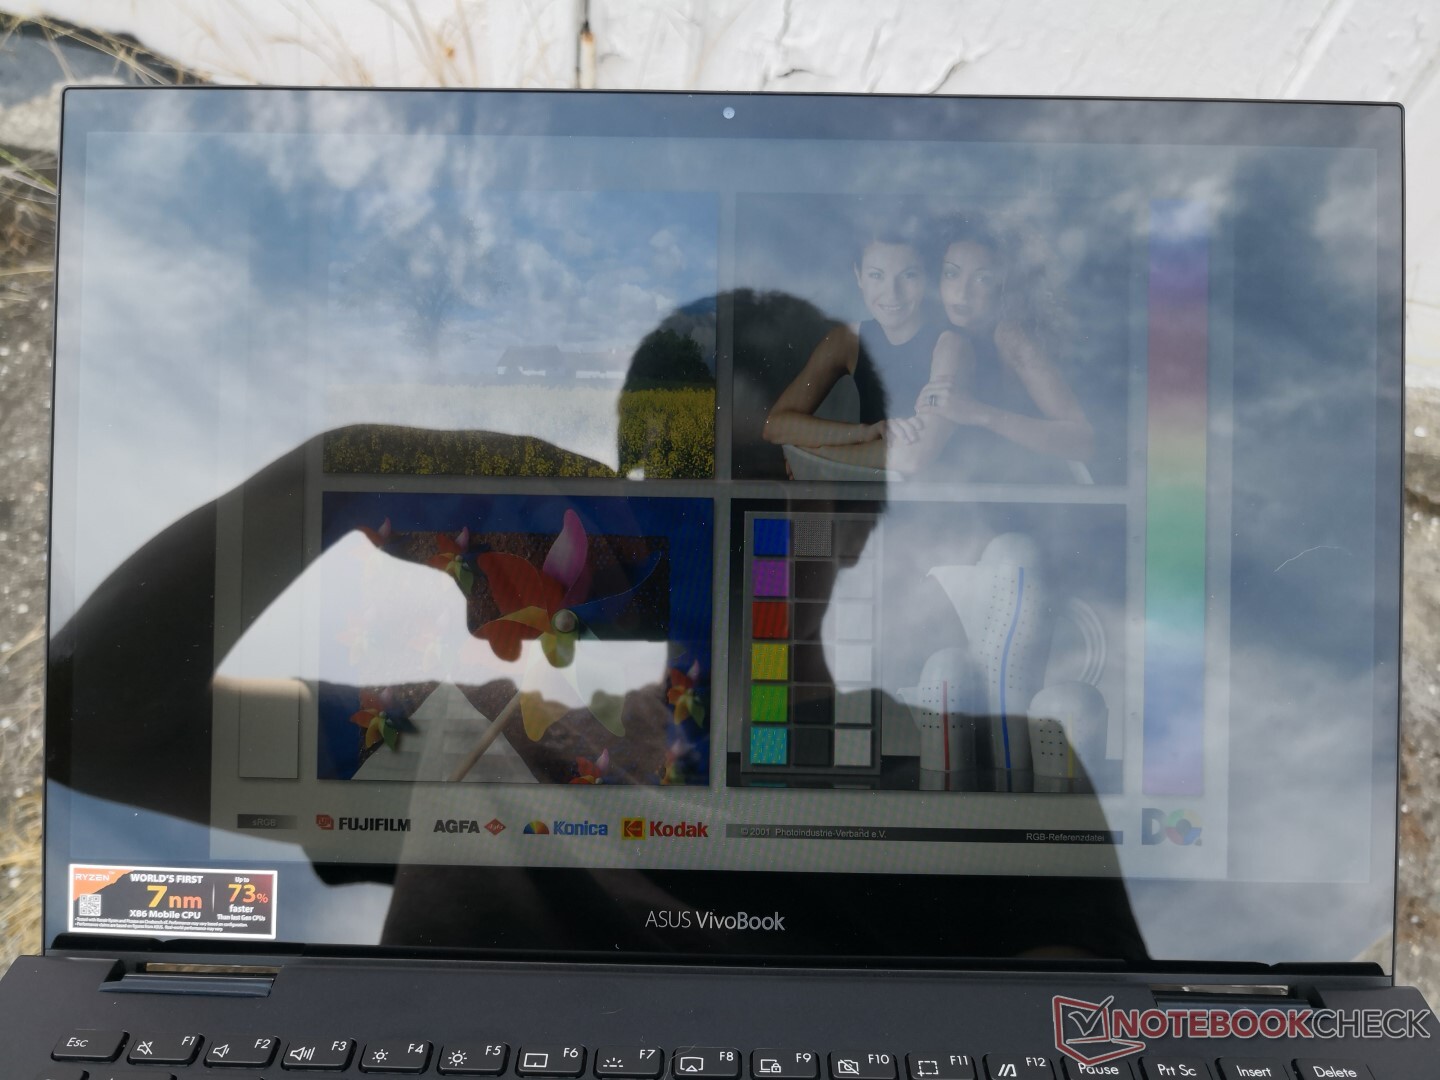
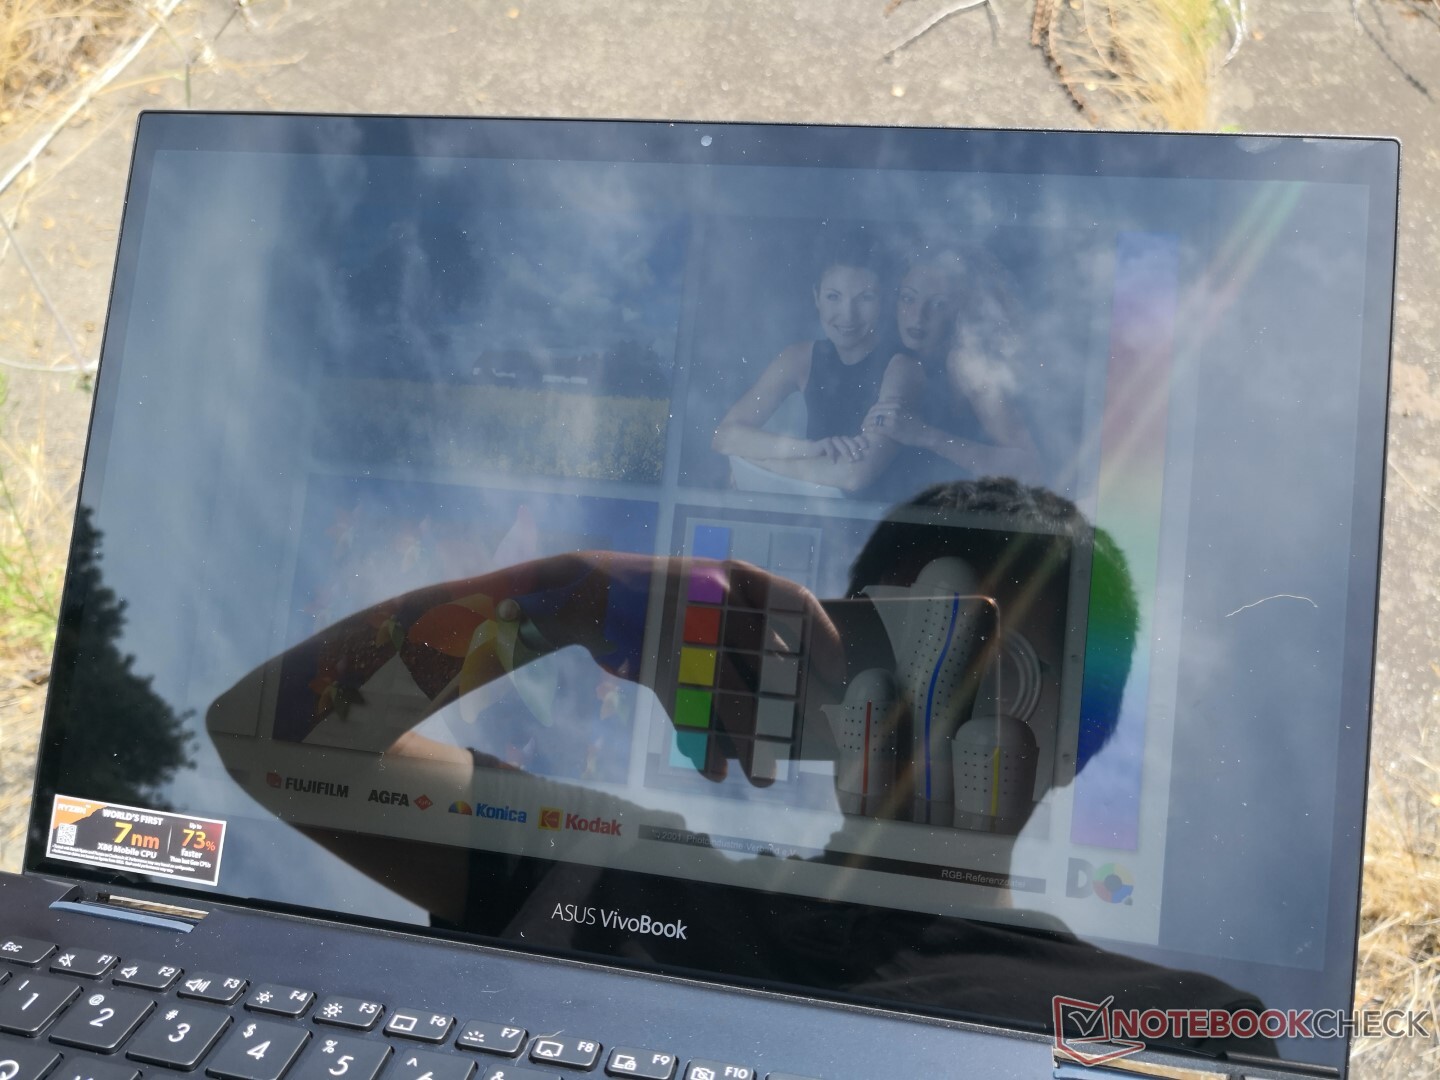
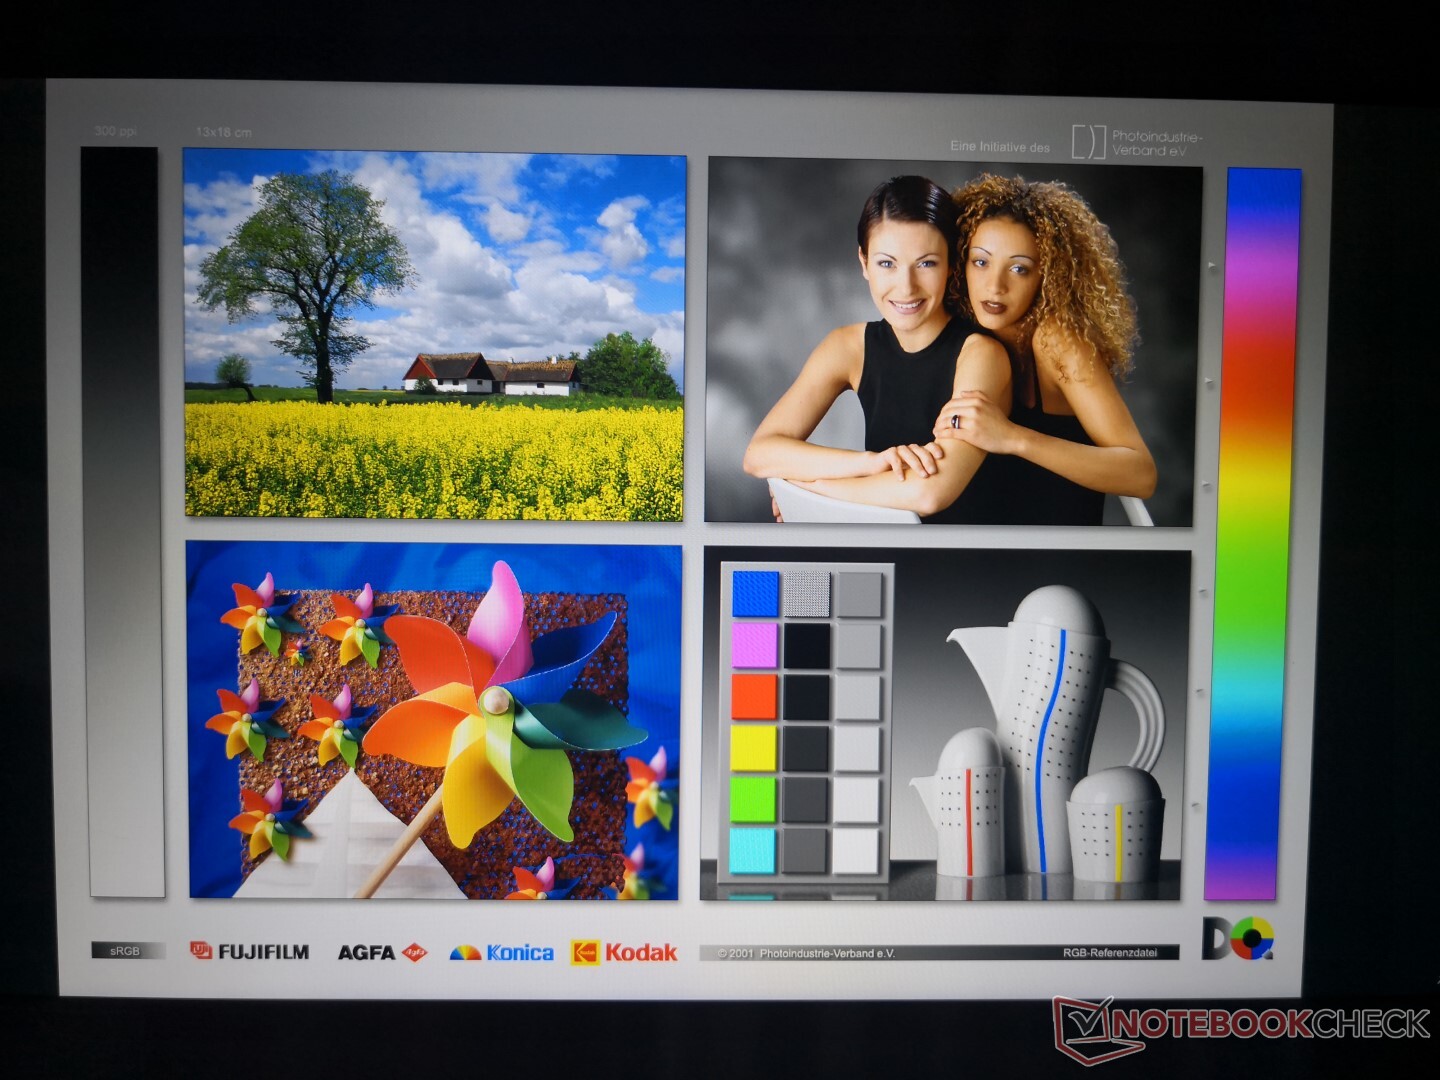
Though the chassis and innards may be new, Asus is still using the same BOE NV140FHM-N49 touchscreen panel as found on the older VivoBook Flip 14 TP401NA meaning that the visual experience remains the same year-over-year. This IPS panel is notable for its limited colors, average response times, and average contrast ratio to represent a budget display.
| |||||||||||||||||||||||||
Brightness Distribution: 88 %
Center on Battery: 272.5 cd/m²
Contrast: 649:1 (Black: 0.42 cd/m²)
ΔE Color 4.65 | 0.5-29.43 Ø5, calibrated: 4.34
ΔE Greyscale 4.4 | 0.57-98 Ø5.3
59.8% sRGB (Argyll 1.6.3 3D)
38.4% AdobeRGB 1998 (Argyll 1.6.3 3D)
41.81% AdobeRGB 1998 (Argyll 2.2.0 3D)
60% sRGB (Argyll 2.2.0 3D)
40.47% Display P3 (Argyll 2.2.0 3D)
Gamma: 2.2
| Asus VivoBook Flip 14 TM420IA BOE NV140FHM-N49, IPS, 14.00, 1920x1080 | Lenovo ThinkPad X1 Yoga 2020-20UCS03S00 LP140WF9-SPE1, IPS LED, 14.00, 1920x1080 | Lenovo IdeaPad 3 14IIL05 LG Philips LP140WFA-SPD1, IPS, 14.00, 1920x1080 | Acer Swift 3 SF314-42-R27B AU Optronics B140HAN04.0, IPS, 14.00, 1920x1080 | Asus ZenBook Flip 14 UX463FA-AI039T AU AUO323D, IPS, 14.00, 1920x1080 | Honor Magicbook 14 BOE CQ TV140FHM-NH1, IPS, 14.00, 1920x1080 | |
|---|---|---|---|---|---|---|
| Display | 58% | -7% | -6% | 46% | 11% | |
| Display P3 Coverage | 40.47 | 64.3 59% | 37.76 -7% | 37.78 -7% | 60.1 49% | 44.93 11% |
| sRGB Coverage | 60 | 95.5 59% | 56.6 -6% | 56.8 -5% | 85.5 43% | 66.2 10% |
| AdobeRGB 1998 Coverage | 41.81 | 65.6 57% | 39.05 -7% | 39.03 -7% | 61.1 46% | 46.42 11% |
| Response Times | -14% | 7% | -4% | 5% | -18% | |
| Response Time Grey 50% / Grey 80% * | 36.4 ? | 52 ? -43% | 39 ? -7% | 42 ? -15% | 36 ? 1% | 44.8 ? -23% |
| Response Time Black / White * | 30.4 ? | 25.6 ? 16% | 24 ? 21% | 28 ? 8% | 28 ? 8% | 34 ? -12% |
| PWM Frequency | 5952 ? | |||||
| Screen | 52% | -4% | 13% | 34% | 26% | |
| Brightness middle | 272.5 | 409 50% | 292 7% | 256 -6% | 280 3% | 311 14% |
| Brightness | 260 | 405 56% | 260 0% | 237 -9% | 286 10% | 296 14% |
| Brightness Distribution | 88 | 95 8% | 80 -9% | 81 -8% | 78 -11% | 92 5% |
| Black Level * | 0.42 | 0.21 50% | 0.36 14% | 0.17 60% | 0.208 50% | 0.18 57% |
| Contrast | 649 | 1948 200% | 811 25% | 1506 132% | 1346 107% | 1728 166% |
| Colorchecker dE 2000 * | 4.65 | 4.9 -5% | 6.92 -49% | 5.43 -17% | 3.97 15% | 5.3 -14% |
| Colorchecker dE 2000 max. * | 17.78 | 8.4 53% | 19.36 -9% | 19.73 -11% | 8.29 53% | 18.5 -4% |
| Colorchecker dE 2000 calibrated * | 4.34 | 1.3 70% | 5.13 -18% | 4.8 -11% | 3.42 21% | 4.2 3% |
| Greyscale dE 2000 * | 4.4 | 5.8 -32% | 3.94 10% | 3.29 25% | 2.83 36% | 3.5 20% |
| Gamma | 2.2 100% | 2.53 87% | 2.83 78% | 2.52 87% | 2.34 94% | 2.1 105% |
| CCT | 6984 93% | 7009 93% | 6737 96% | 6840 95% | 6556 99% | 7078 92% |
| Color Space (Percent of AdobeRGB 1998) | 38.4 | 60.7 58% | 36 -6% | 36 -6% | 56 46% | 42.5 11% |
| Color Space (Percent of sRGB) | 59.8 | 95.3 59% | 56 -6% | 57 -5% | 85 42% | 65.8 10% |
| Total Average (Program / Settings) | 32% /
45% | -1% /
-3% | 1% /
7% | 28% /
32% | 6% /
17% |
* ... smaller is better
Color space is narrow at just 60 percent of sRGB compared to >90 percent on most pricier Ultrabooks. For more accurate colors, we recommend looking at the higher-end ZenBook series instead.
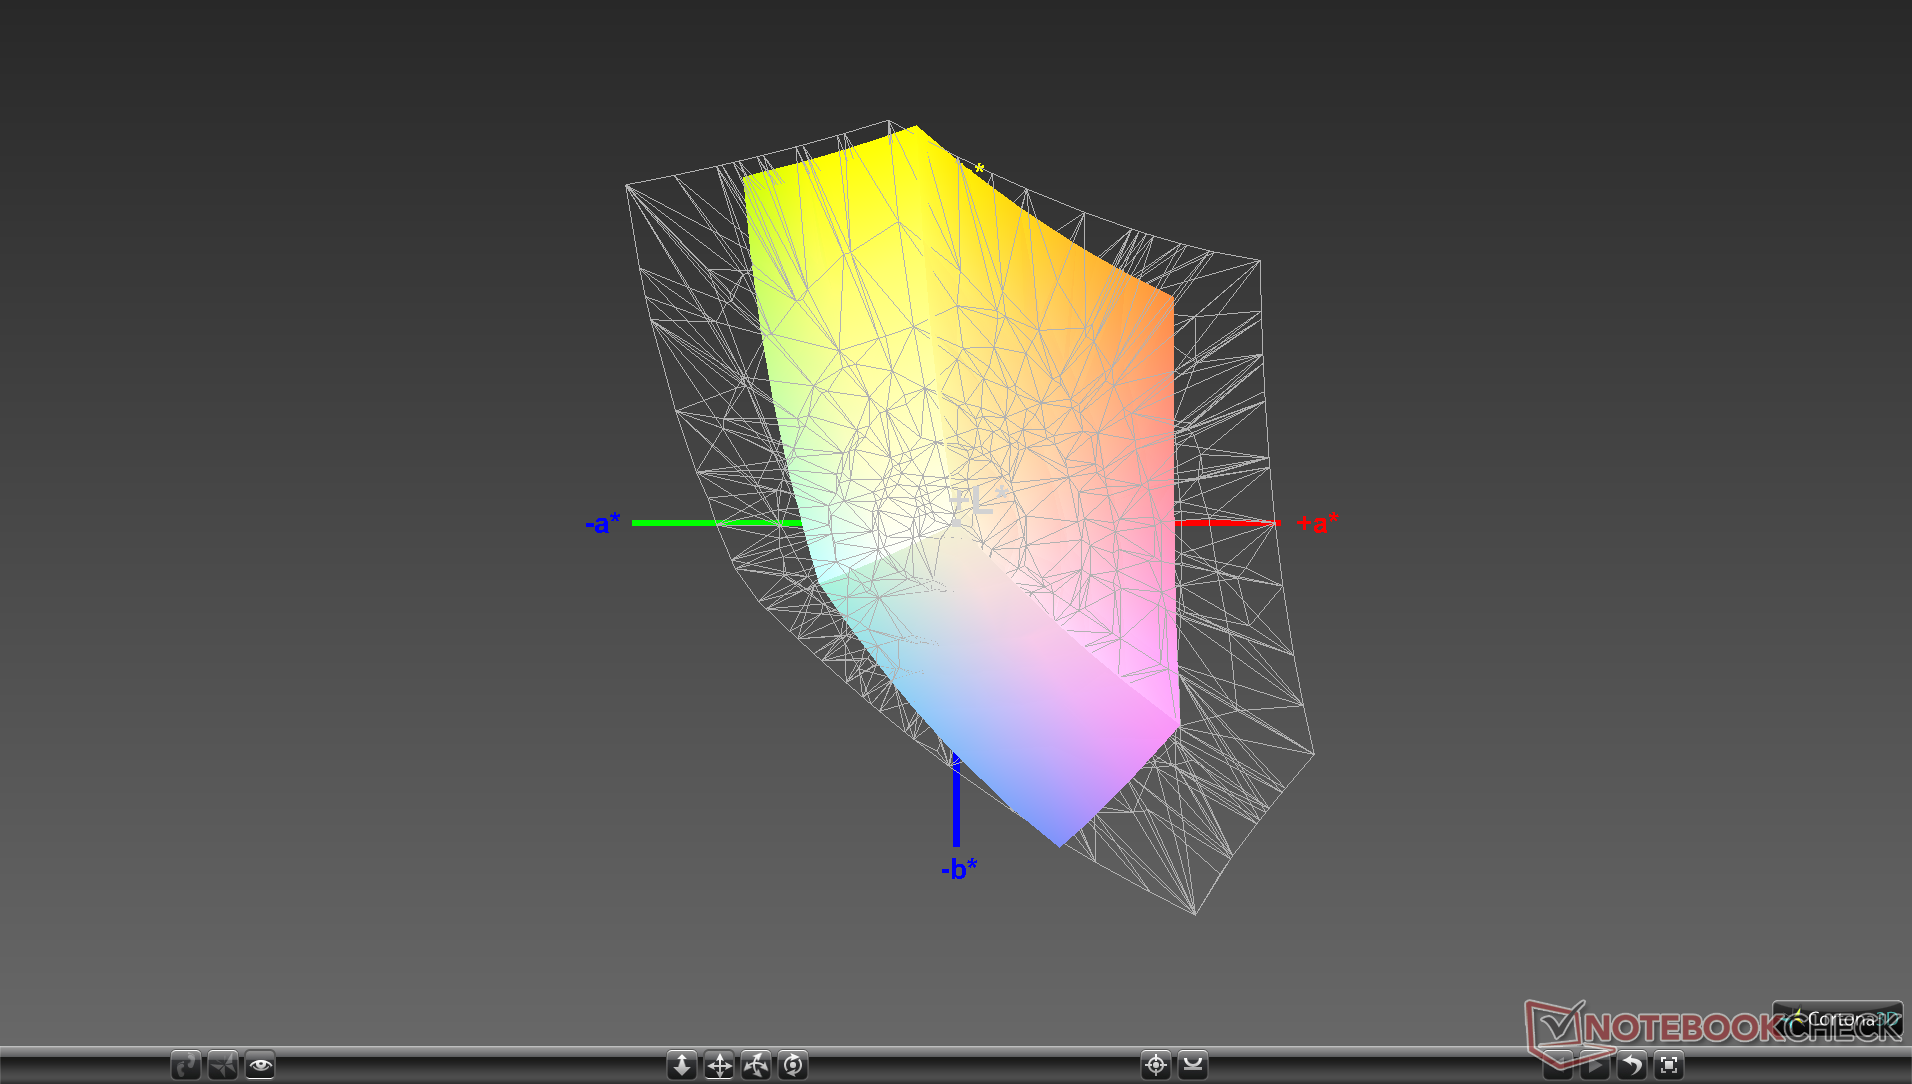
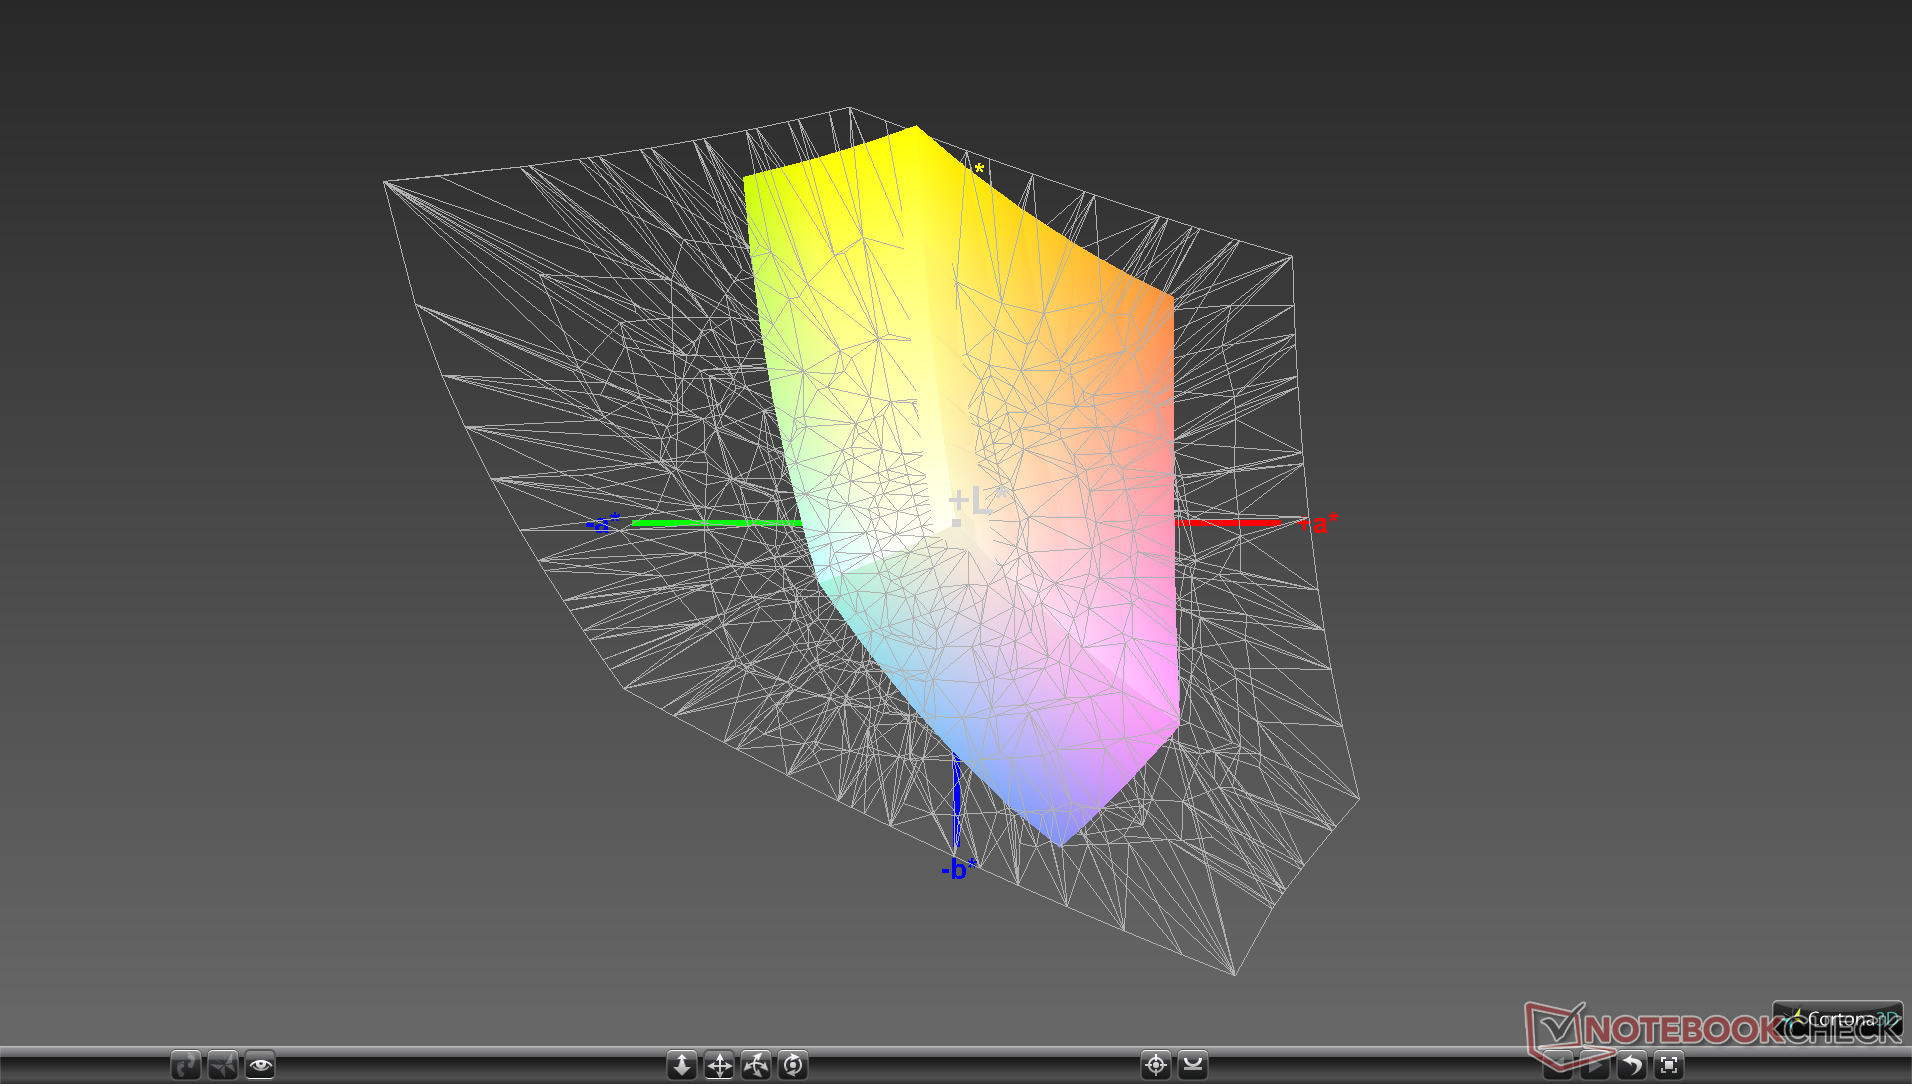
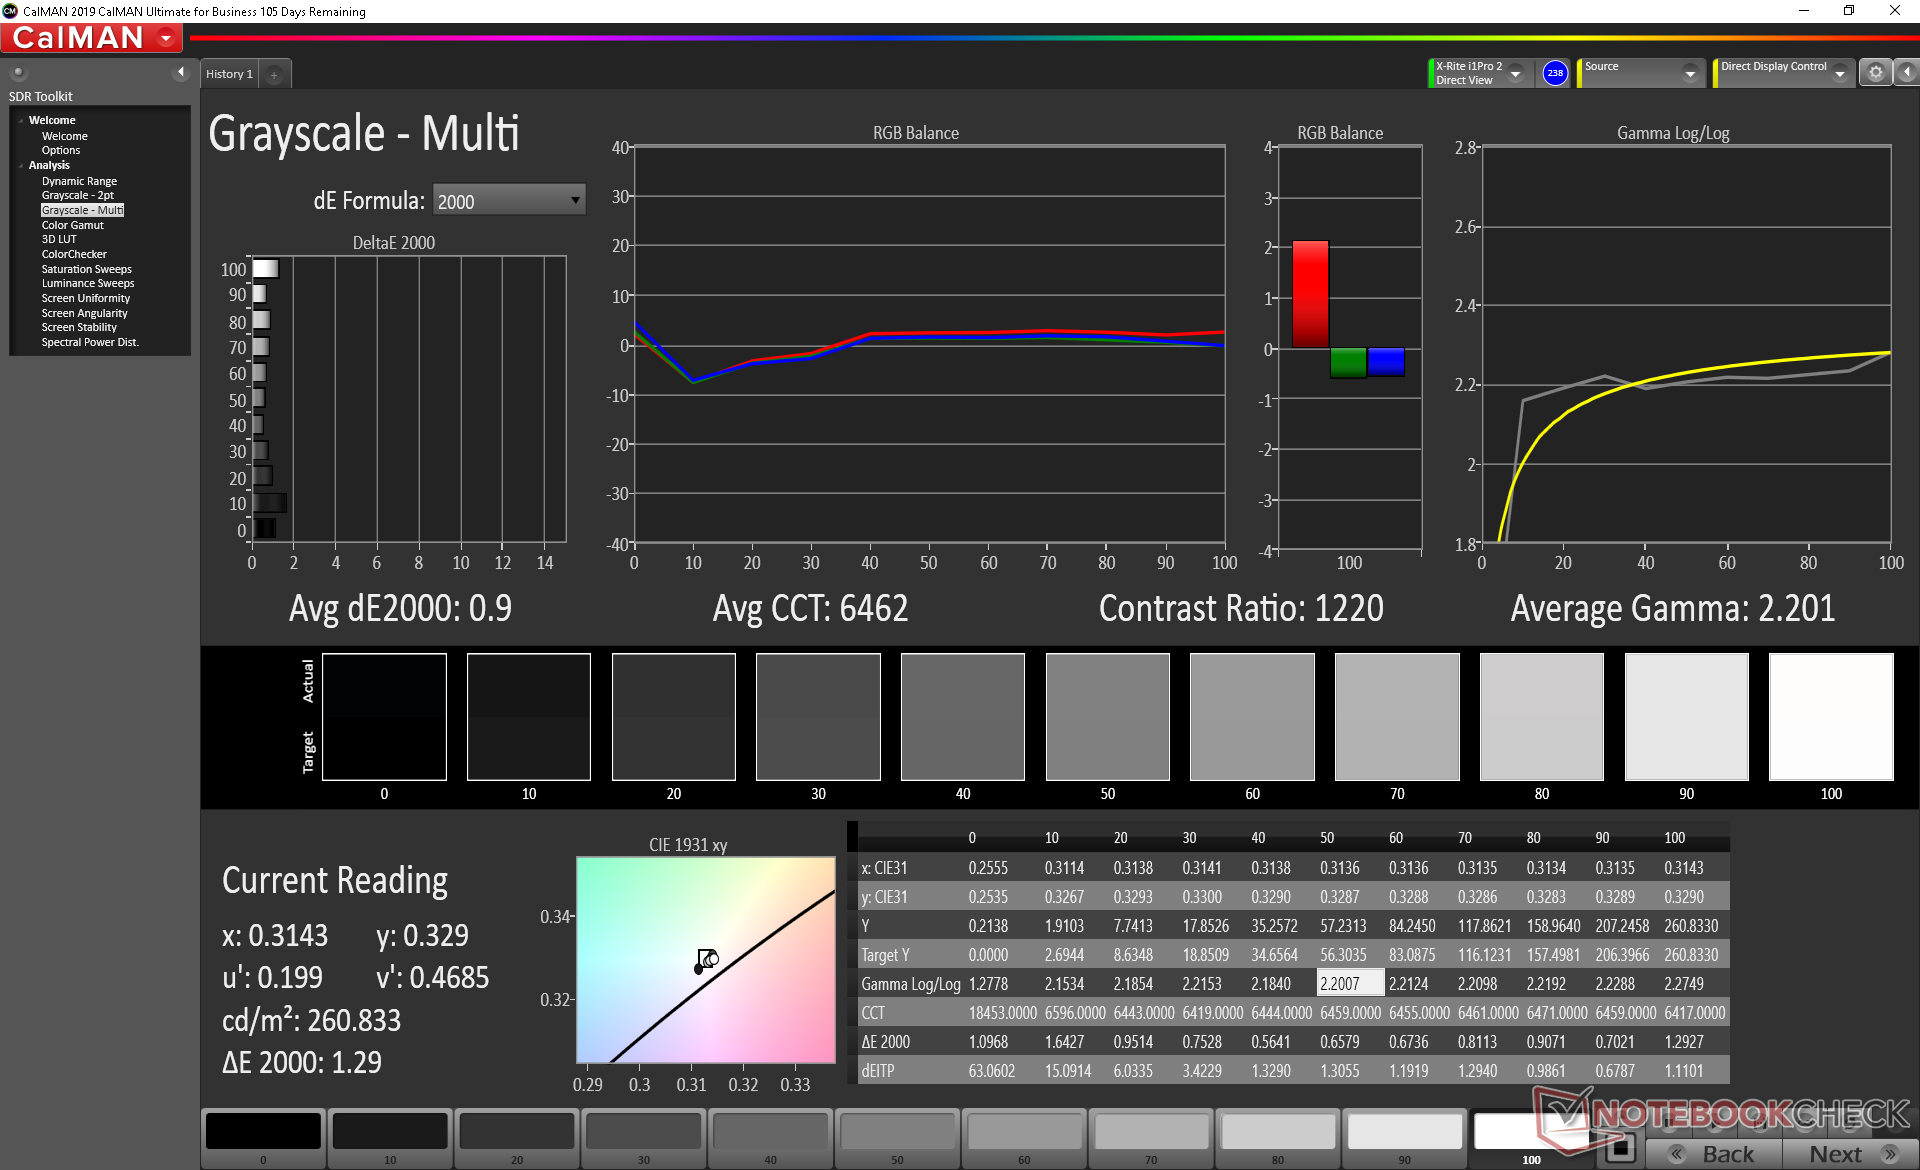
Average grayscale DeltaE would improve from 4.4 to just 0.9 after calibrating the display ourselves. Colors remain about the same, however, due to the narrow color space mentioned above.

Display Response Times
| ↔ Response Time Black to White | ||
|---|---|---|
| 30.4 ms ... rise ↗ and fall ↘ combined | ↗ 18.8 ms rise | 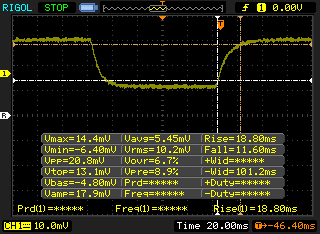 |
| ↘ 11.6 ms fall | ||
| The screen shows slow response rates in our tests and will be unsatisfactory for gamers. In comparison, all tested devices range from 0.1 (minimum) to 240 (maximum) ms. » 80 % of all devices are better. This means that the measured response time is worse than the average of all tested devices (21.5 ms). | ||
| ↔ Response Time 50% Grey to 80% Grey | ||
| 36.4 ms ... rise ↗ and fall ↘ combined | ↗ 18.8 ms rise | 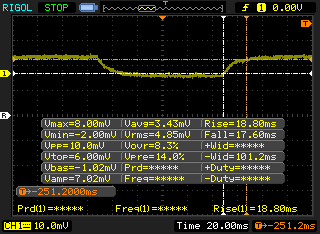 |
| ↘ 17.6 ms fall | ||
| The screen shows slow response rates in our tests and will be unsatisfactory for gamers. In comparison, all tested devices range from 0.2 (minimum) to 636 (maximum) ms. » 46 % of all devices are better. This means that the measured response time is similar to the average of all tested devices (33.7 ms). | ||
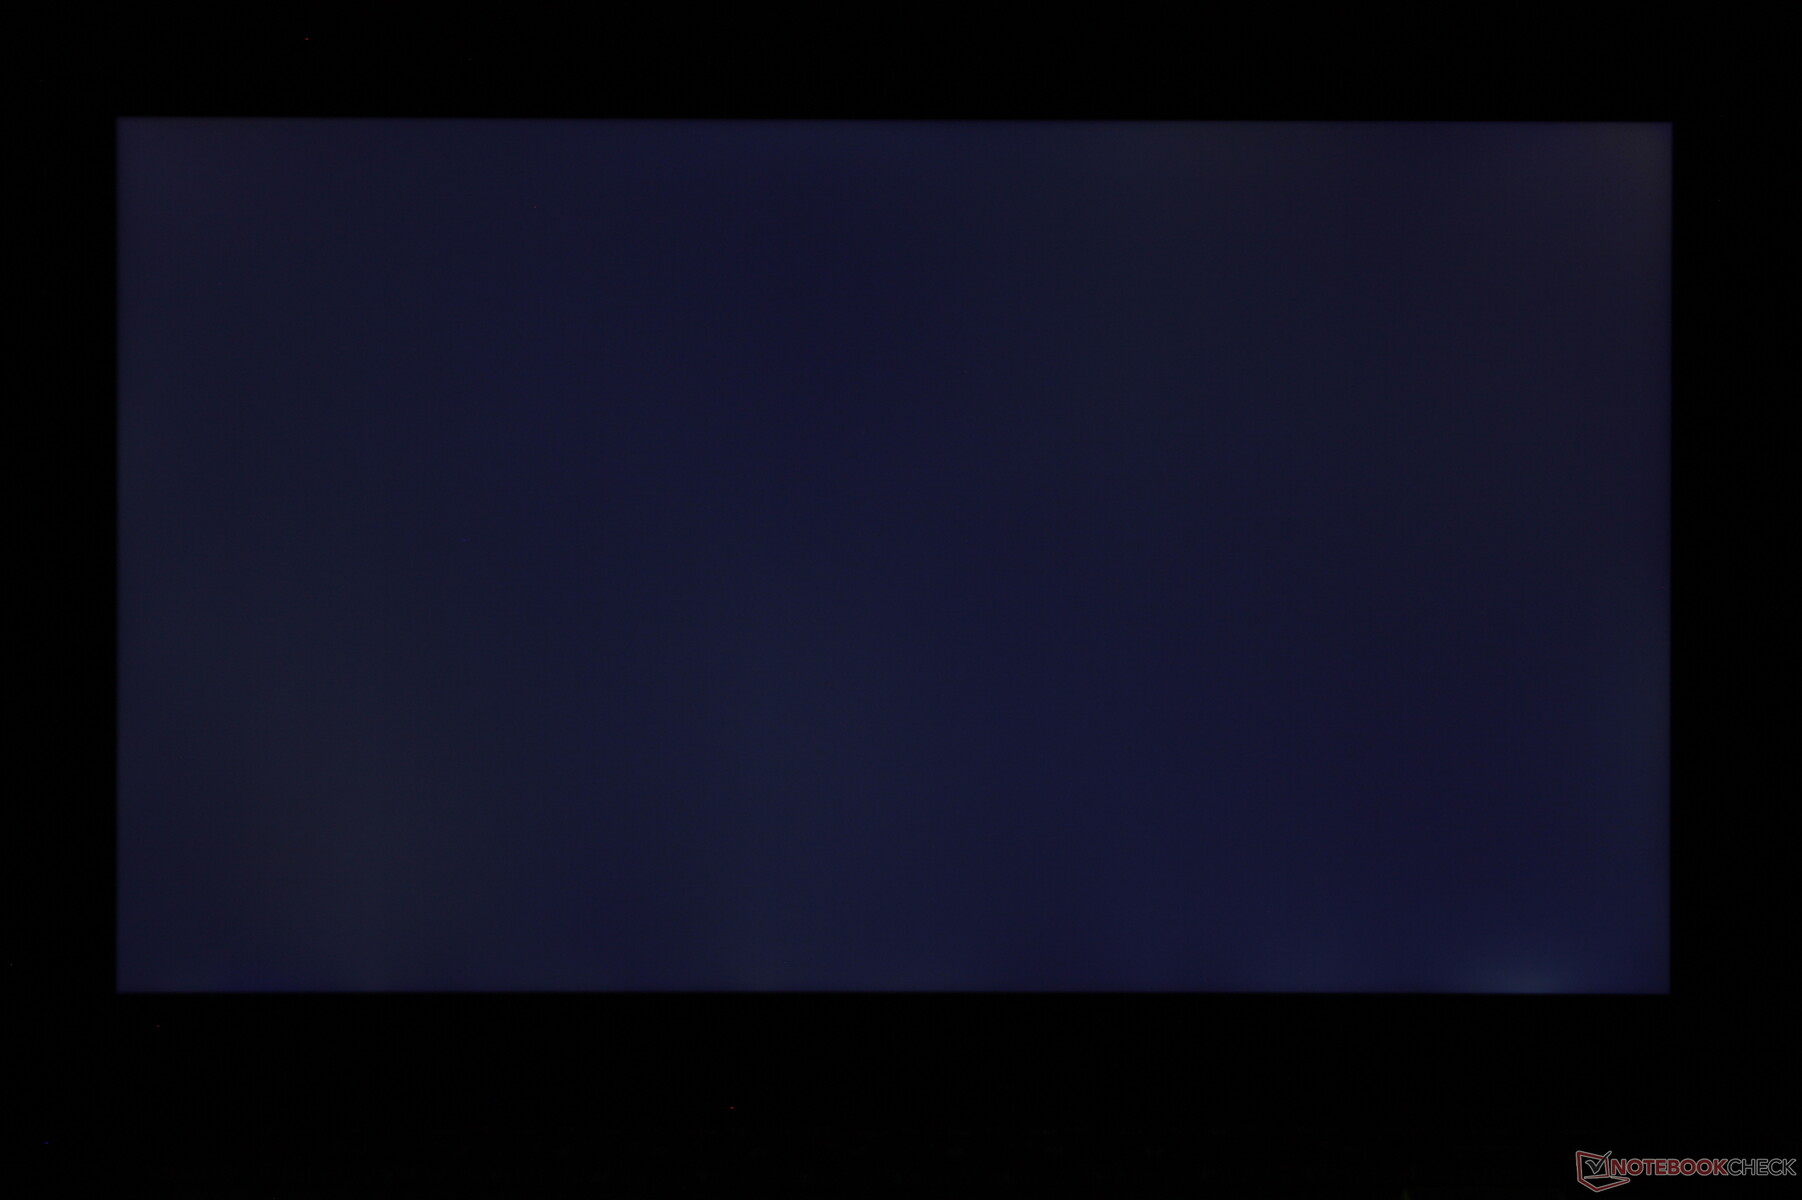
Screen Flickering / PWM (Pulse-Width Modulation)
| Screen flickering / PWM not detected |  | ||
In comparison: 53 % of all tested devices do not use PWM to dim the display. If PWM was detected, an average of 17900 (minimum: 5 - maximum: 3846000) Hz was measured. | |||
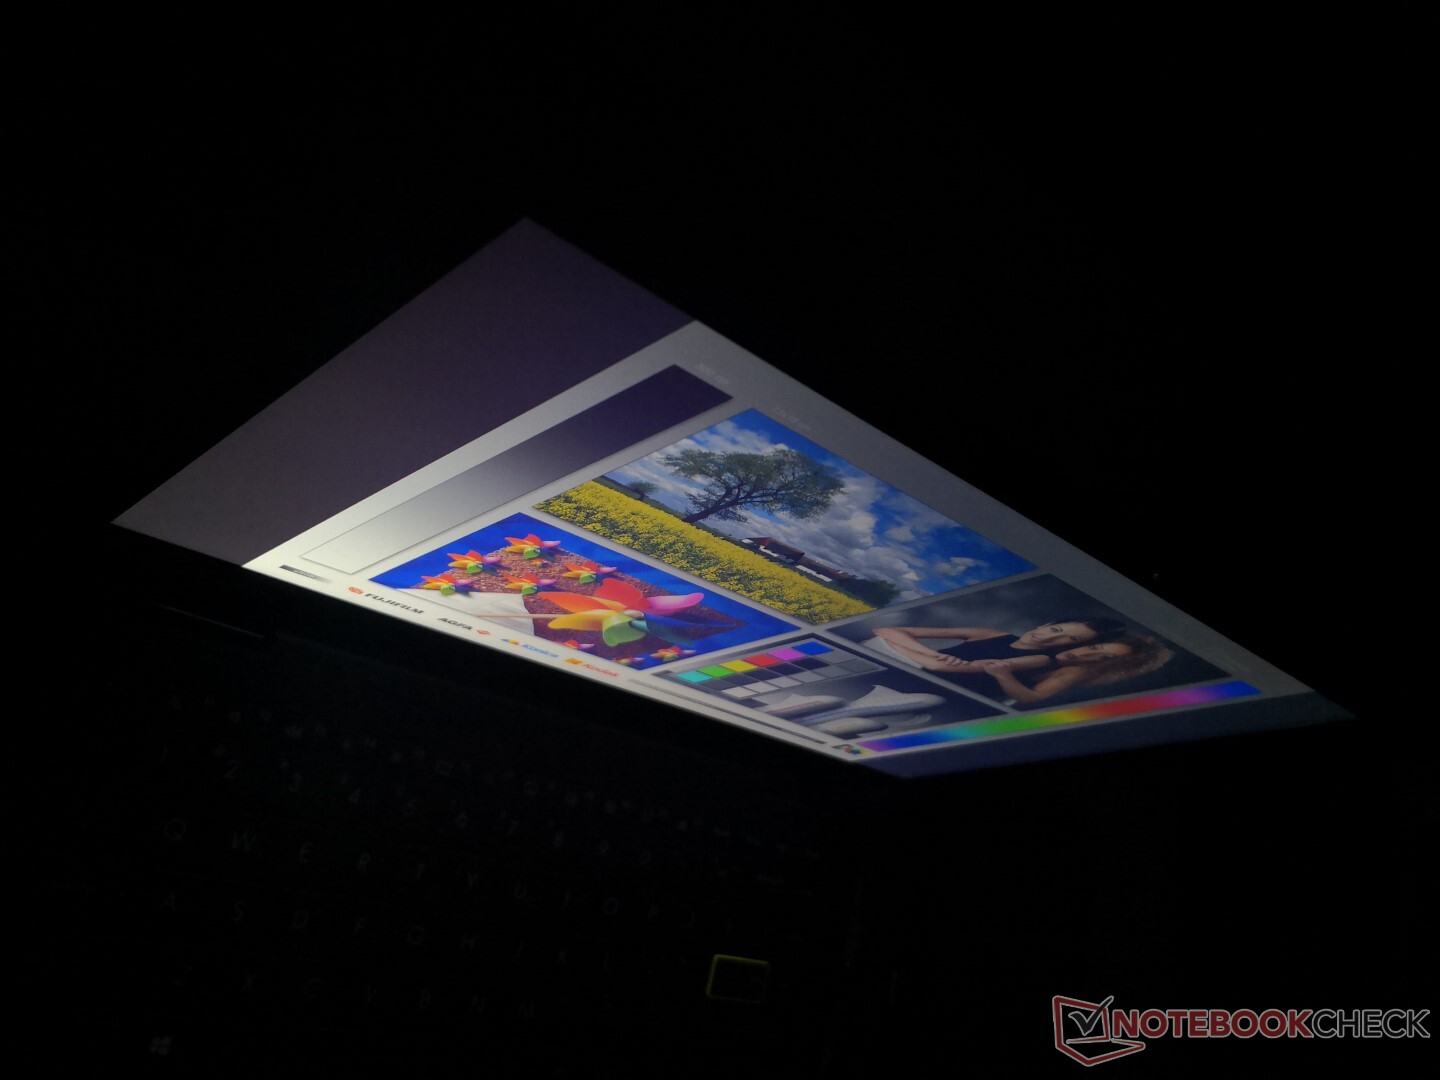
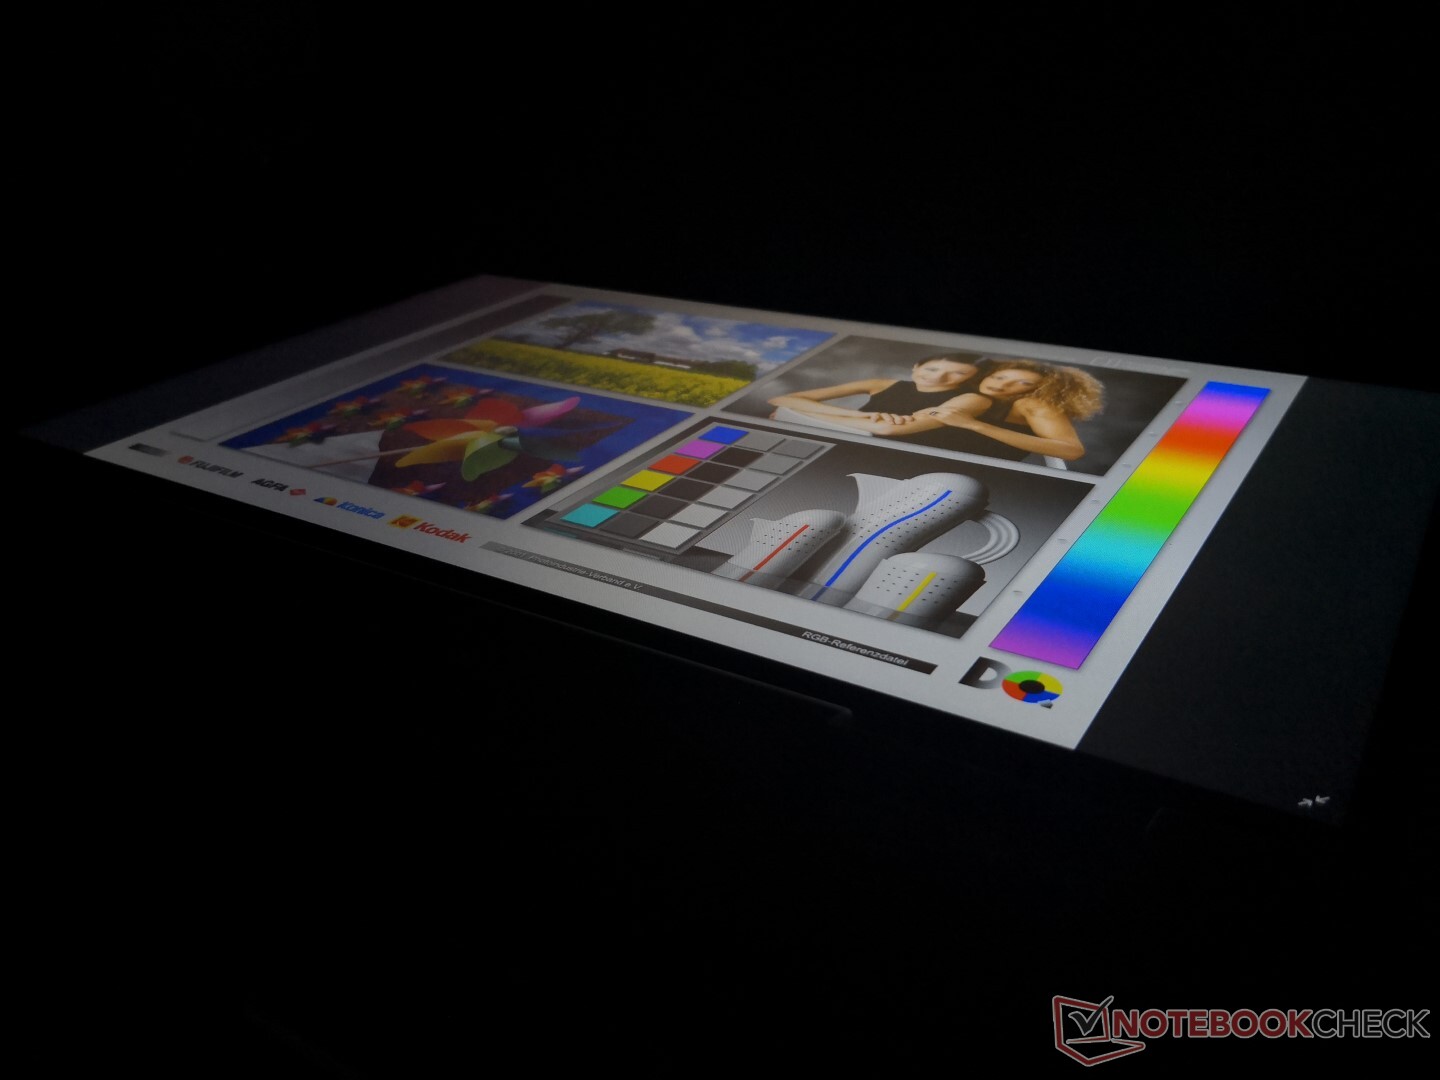
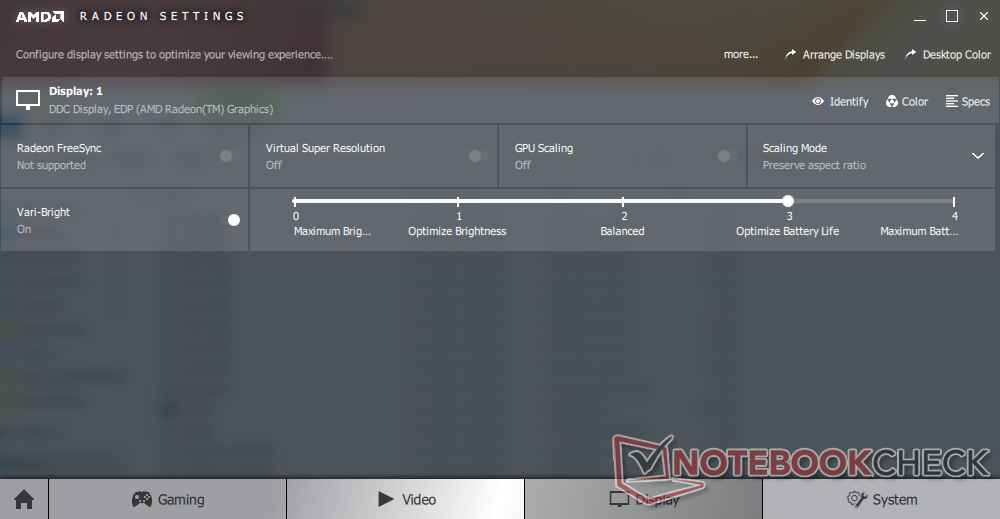
The display is not bright enough to overcome the glossy overlay and bright ambient lighting when outdoors. Expect a lot of glare even when set to the maximum brightness setting. Remember to disable AMD Vari-Bright or else maximum brightness will automatically drop to just 154 nits when running on battery power.
Performance
Processor
CPU performance is faster than any Intel Comet Lake-U or Ice Lake-powered laptop at the moment. Performance over time dips by about 20 percent as shown by our CineBench R15 xT loop test results below, but clock rates eventually recover and stabilize at the 1000-point range.
See our main page on the Ryzen 7 4700U for more technical information and benchmark comparisons.
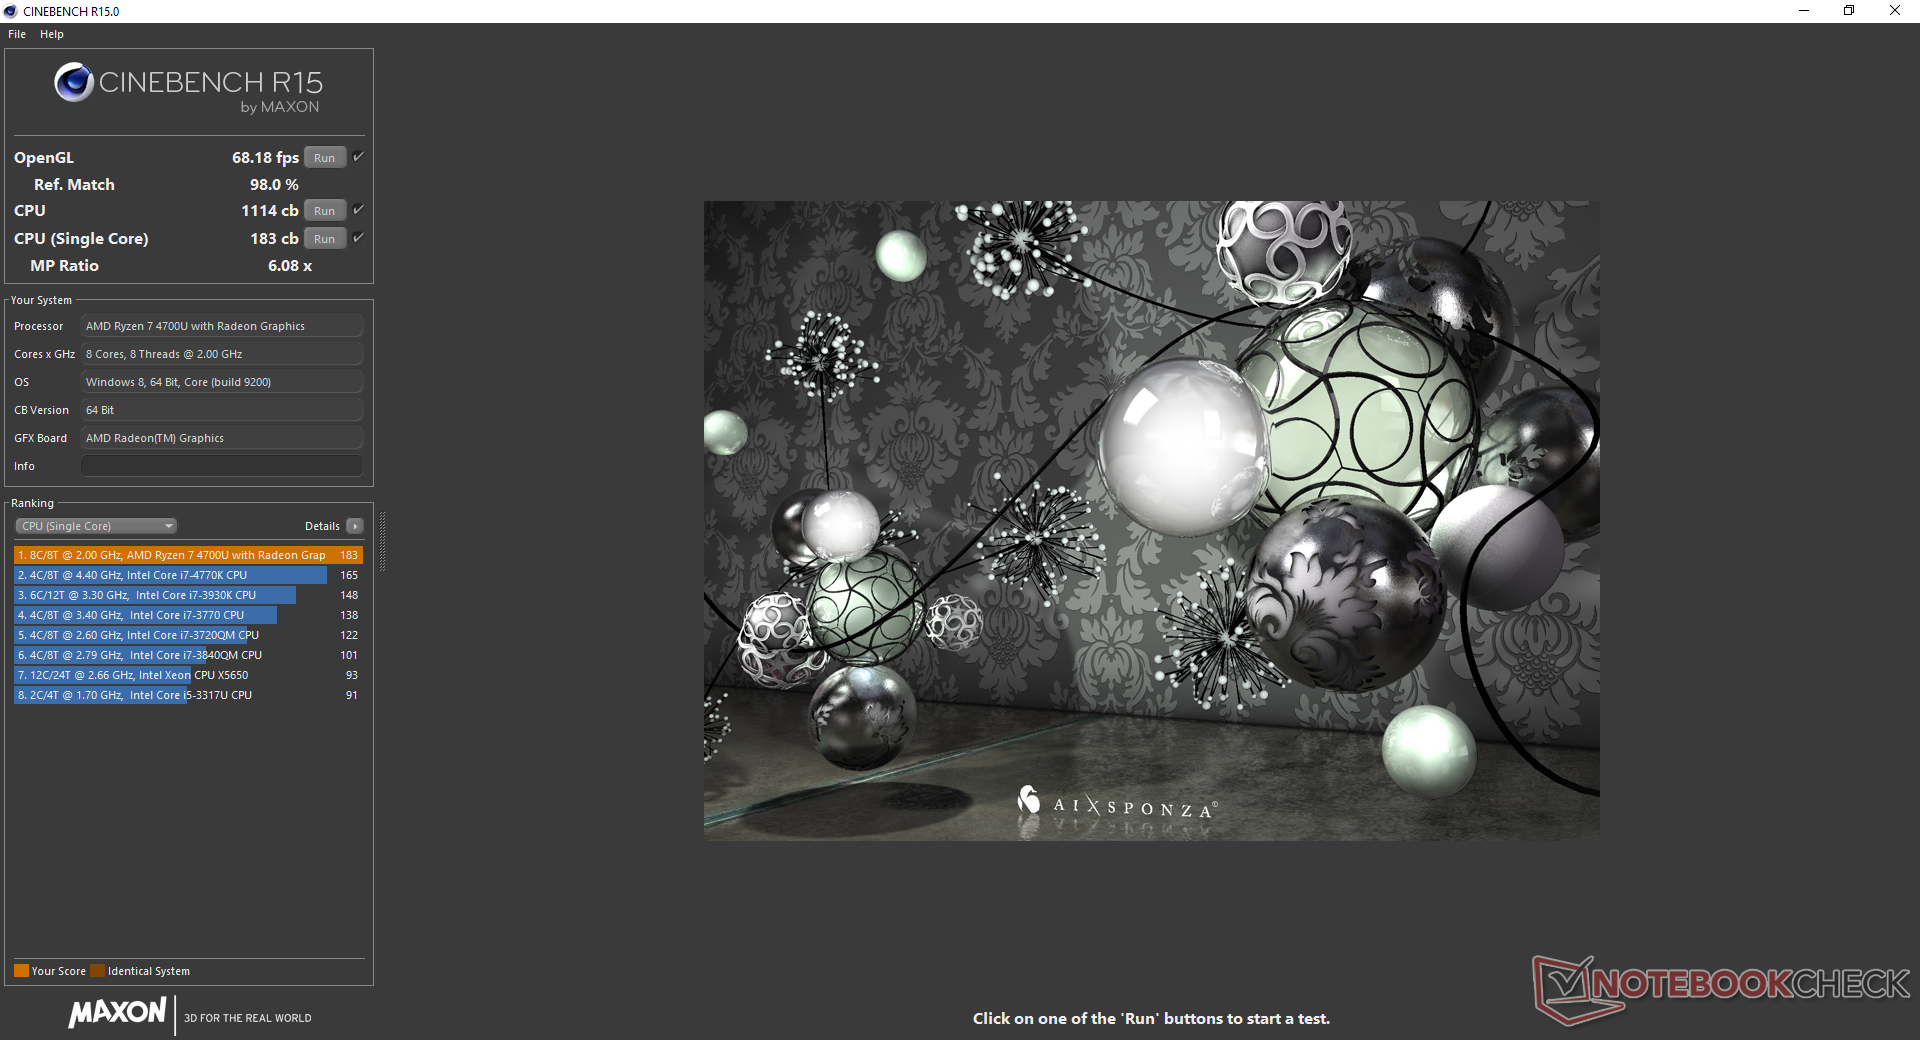
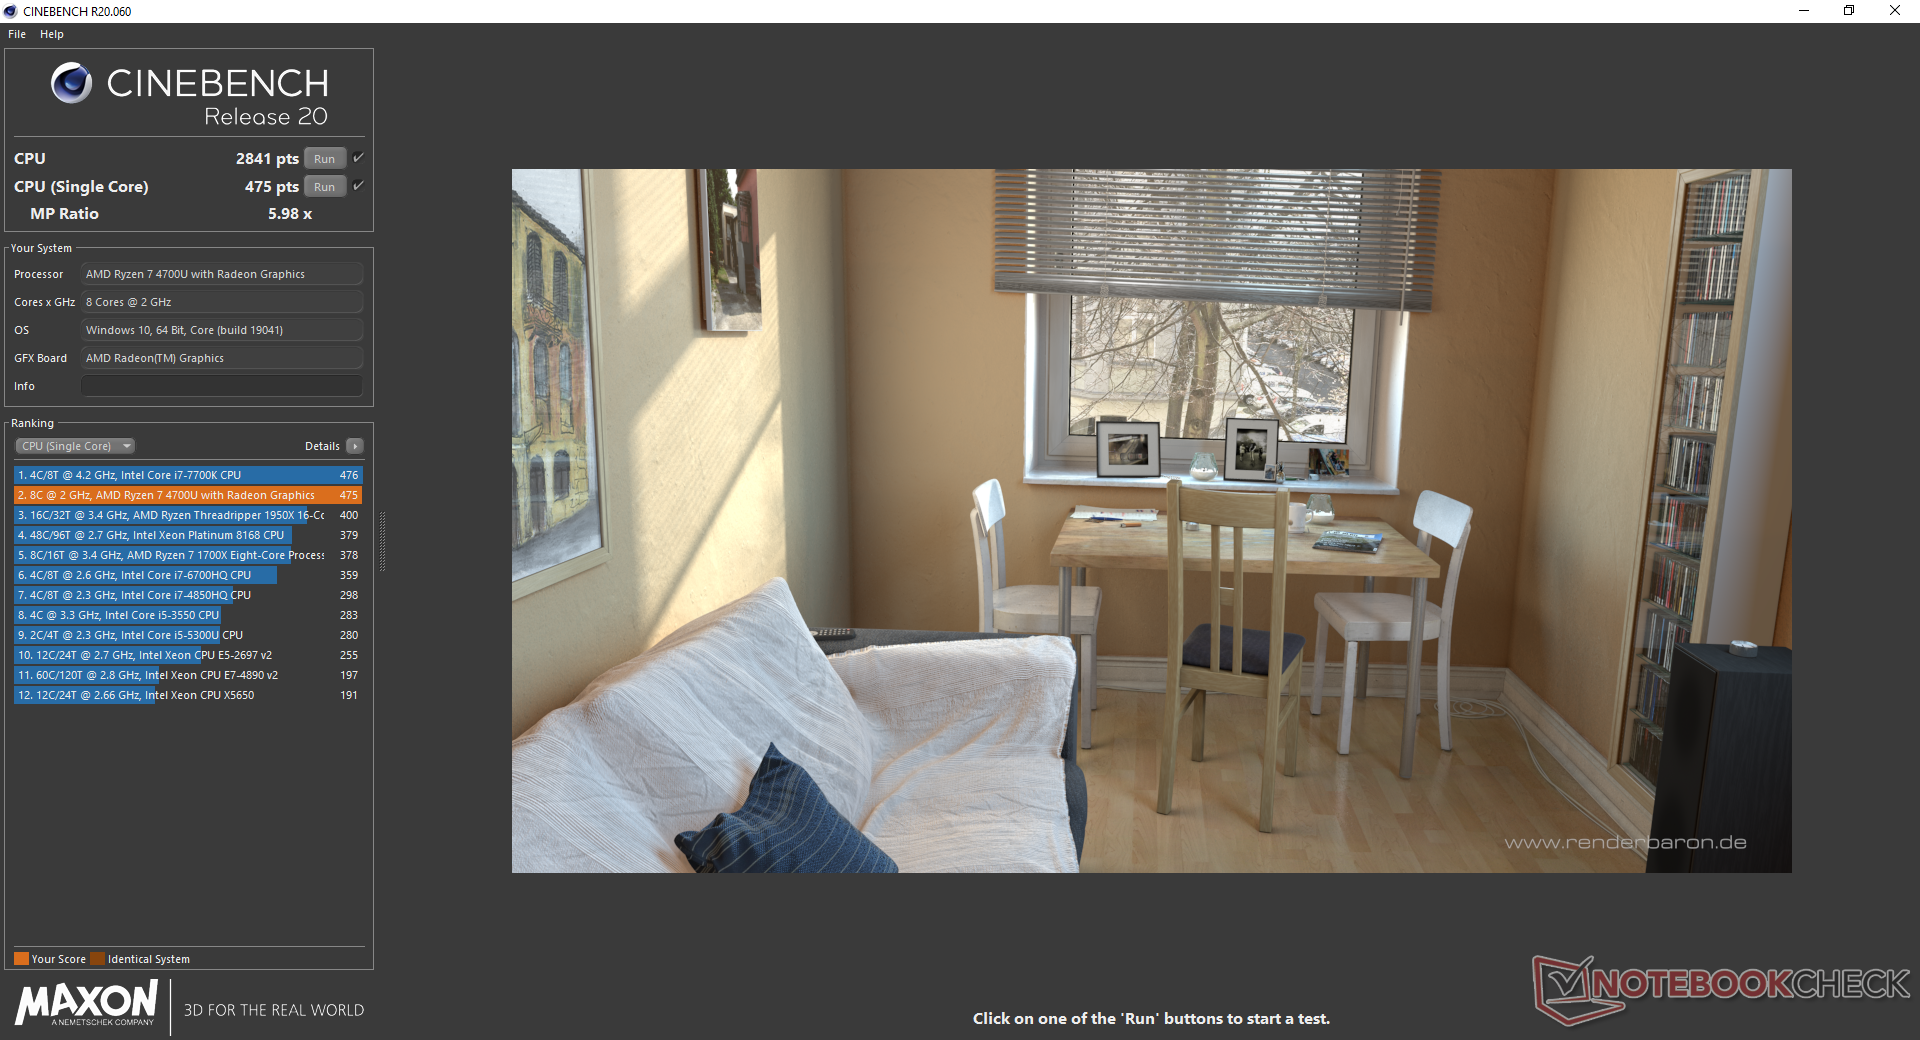
Cinebench R15: CPU Multi 64Bit | CPU Single 64Bit
Blender: v2.79 BMW27 CPU
7-Zip 18.03: 7z b 4 -mmt1 | 7z b 4
Geekbench 5.5: Single-Core | Multi-Core
HWBOT x265 Benchmark v2.2: 4k Preset
LibreOffice : 20 Documents To PDF
R Benchmark 2.5: Overall mean
| Blender / v2.79 BMW27 CPU | |
| Acer Swift 3 SF314-42-R27B | |
| Asus VivoBook 14 X403FA | |
| Asus VivoBook S14 S433FL | |
| Honor Magicbook 14 | |
| Lenovo IdeaPad 5 14ARE05 | |
| Dell XPS 13 7390 Core i7-10710U | |
| Average AMD Ryzen 7 4700U (407 - 537, n=8) | |
| Asus VivoBook Flip 14 TM420IA | |
| 7-Zip 18.03 / 7z b 4 -mmt1 | |
| Asus VivoBook S14 S433FL | |
| Dell XPS 13 7390 Core i7-10710U | |
| Asus VivoBook Flip 14 TM420IA | |
| Average AMD Ryzen 7 4700U (4208 - 4470, n=8) | |
| Lenovo IdeaPad 5 14ARE05 | |
| Asus VivoBook 14 X403FA | |
| Acer Swift 3 SF314-42-R27B | |
| Honor Magicbook 14 | |
| Geekbench 5.5 / Single-Core | |
| Asus VivoBook S14 S433FL | |
| Asus VivoBook Flip 14 TM420IA | |
| Average AMD Ryzen 7 4700U (1101 - 1168, n=8) | |
| Lenovo IdeaPad 5 14ARE05 | |
| Acer Swift 3 SF314-42-R27B | |
| Honor Magicbook 14 | |
| Geekbench 5.5 / Multi-Core | |
| Average AMD Ryzen 7 4700U (4792 - 6502, n=8) | |
| Asus VivoBook Flip 14 TM420IA | |
| Lenovo IdeaPad 5 14ARE05 | |
| Asus VivoBook S14 S433FL | |
| Acer Swift 3 SF314-42-R27B | |
| Honor Magicbook 14 | |
| HWBOT x265 Benchmark v2.2 / 4k Preset | |
| Asus VivoBook Flip 14 TM420IA | |
| Average AMD Ryzen 7 4700U (6.79 - 10.1, n=8) | |
| Lenovo IdeaPad 5 14ARE05 | |
| Dell XPS 13 7390 Core i7-10710U | |
| Asus VivoBook 14 X403FA | |
| Asus VivoBook S14 S433FL | |
| Acer Swift 3 SF314-42-R27B | |
| Honor Magicbook 14 | |
| LibreOffice / 20 Documents To PDF | |
| Average AMD Ryzen 7 4700U (55.5 - 115.7, n=8) | |
| Acer Swift 3 SF314-42-R27B | |
| Lenovo IdeaPad 5 14ARE05 | |
| Asus VivoBook Flip 14 TM420IA | |
| Asus VivoBook S14 S433FL | |
| R Benchmark 2.5 / Overall mean | |
| Honor Magicbook 14 | |
| Acer Swift 3 SF314-42-R27B | |
| Lenovo IdeaPad 5 14ARE05 | |
| Asus VivoBook S14 S433FL | |
| Average AMD Ryzen 7 4700U (0.598 - 0.651, n=8) | |
| Asus VivoBook Flip 14 TM420IA | |
* ... smaller is better
System Performance
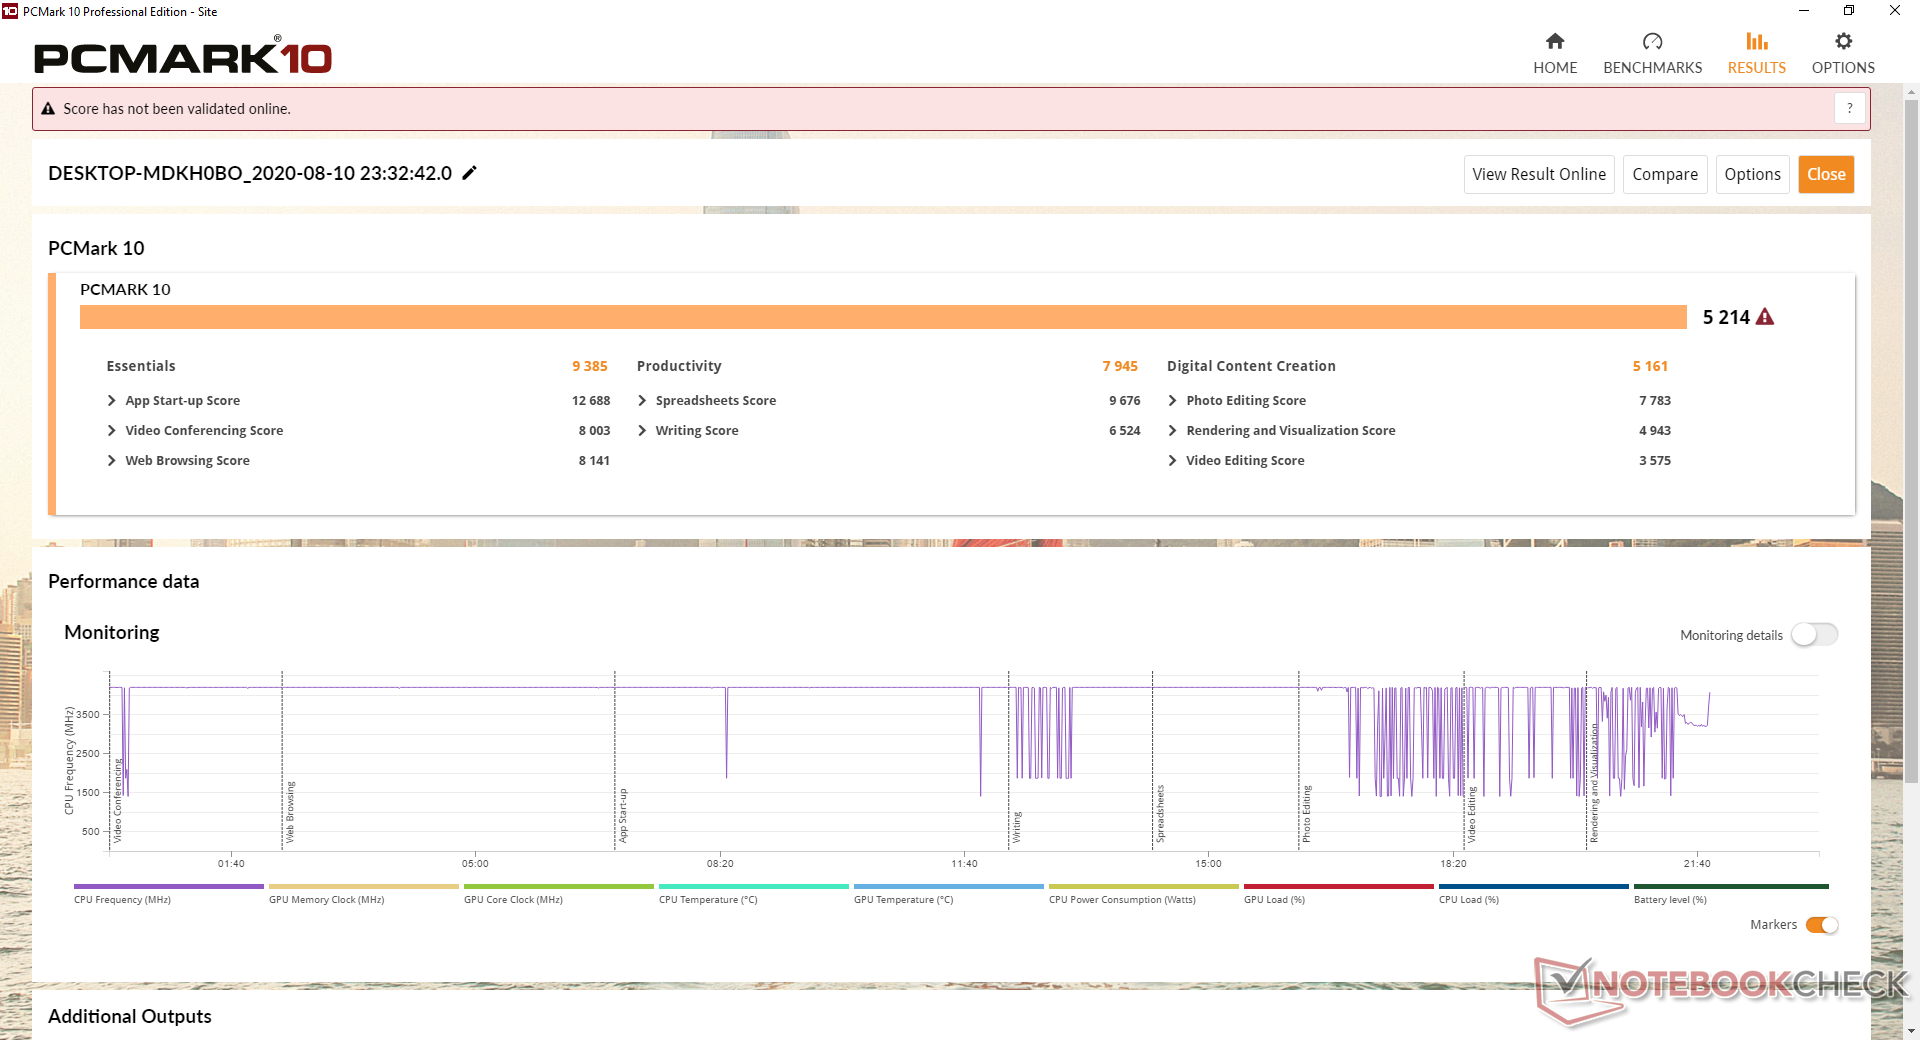
PCMark results are strong and consistently ahead of many 14-inch Intel Ice Lake or Comet lake-U Ultrabooks. We didn't experience any issues with our unit save for it being unable to wake from sleep one time that we weren't able to reliably reproduce.
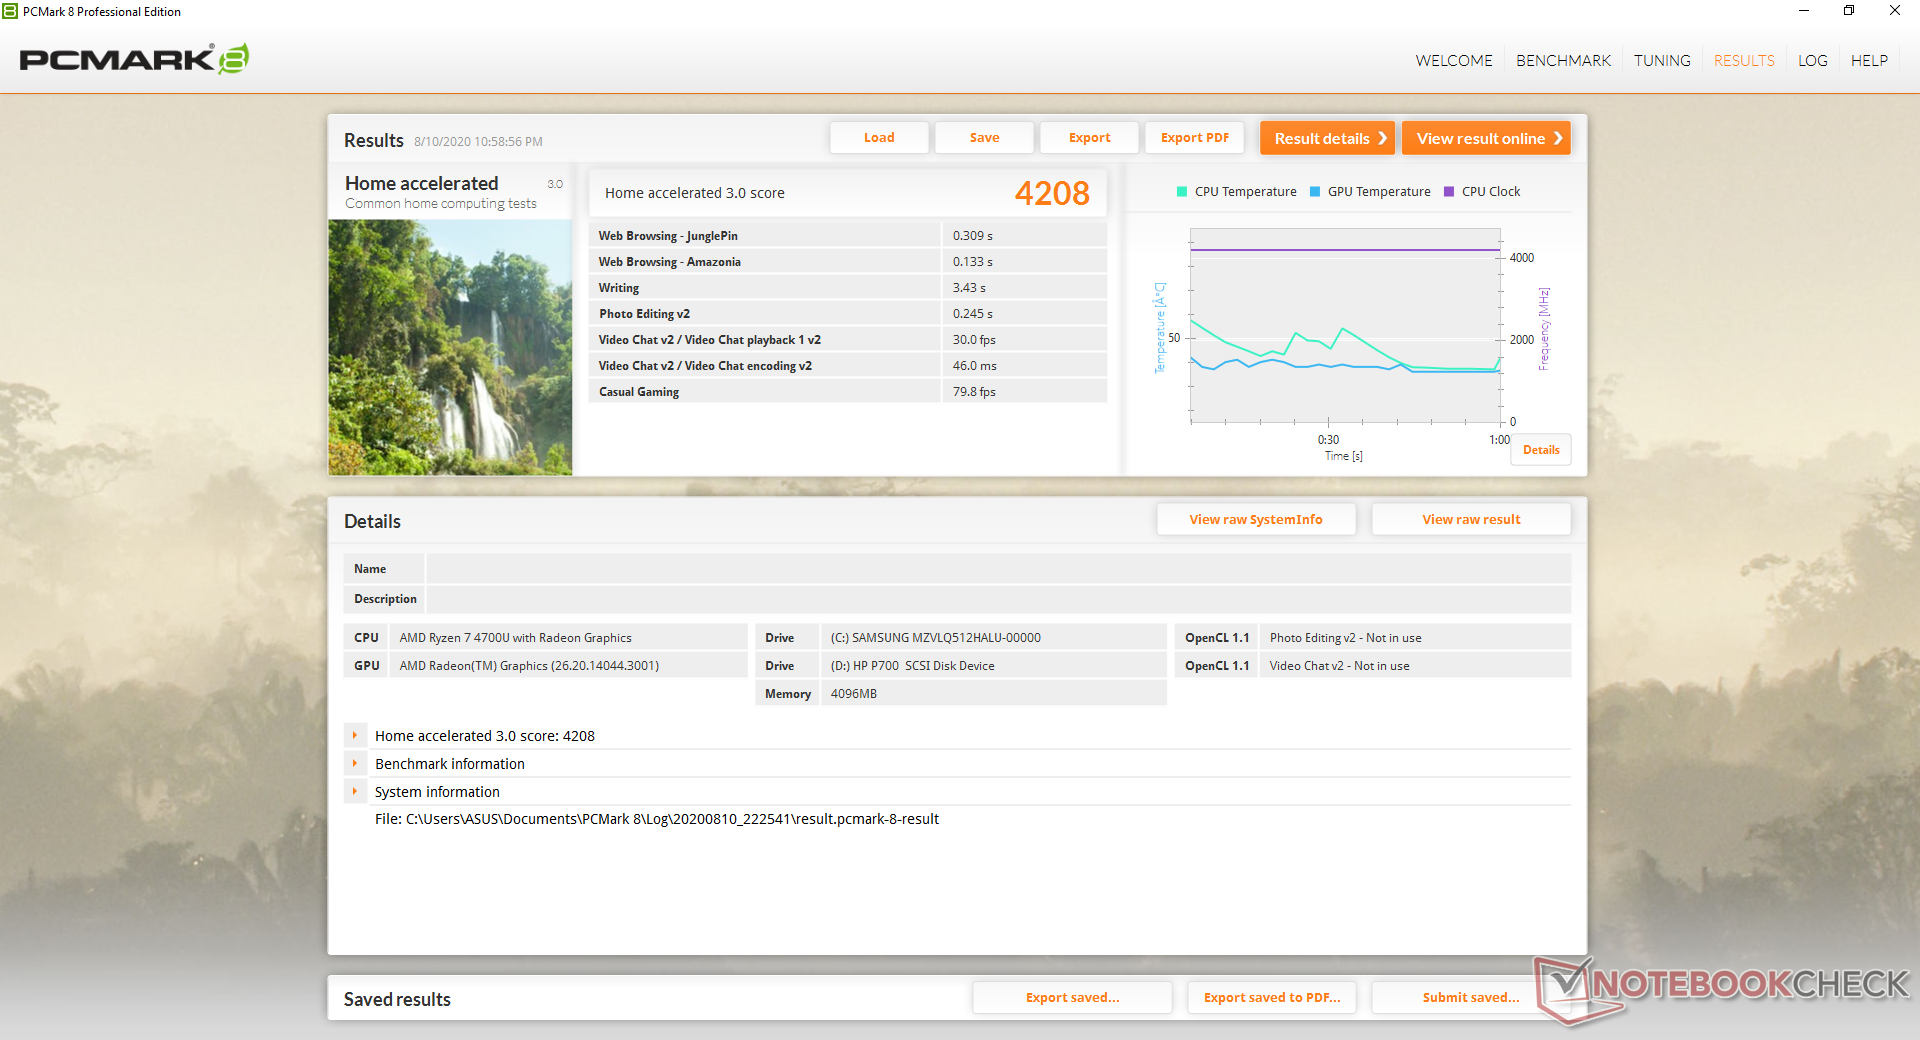
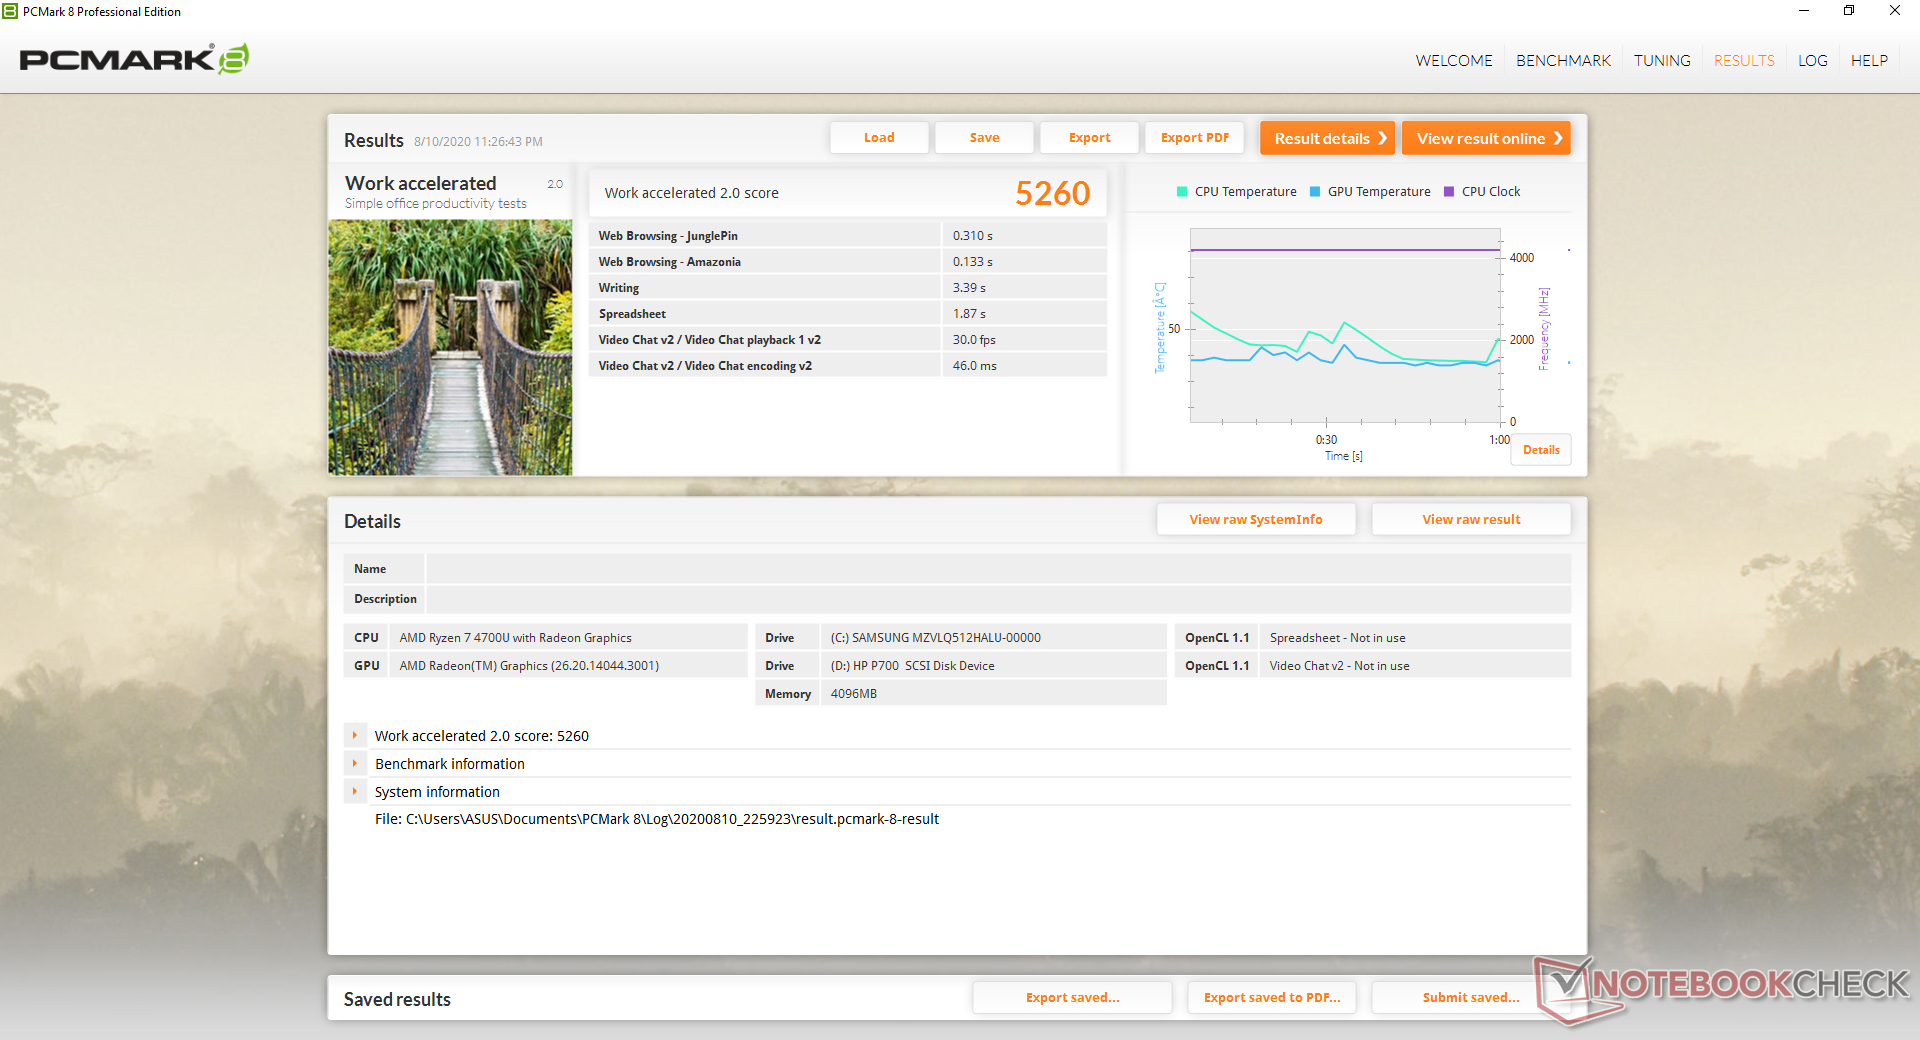
| PCMark 8 Home Score Accelerated v2 | 4208 points | |
| PCMark 8 Work Score Accelerated v2 | 5260 points | |
| PCMark 10 Score | 5214 points | |
Help | ||
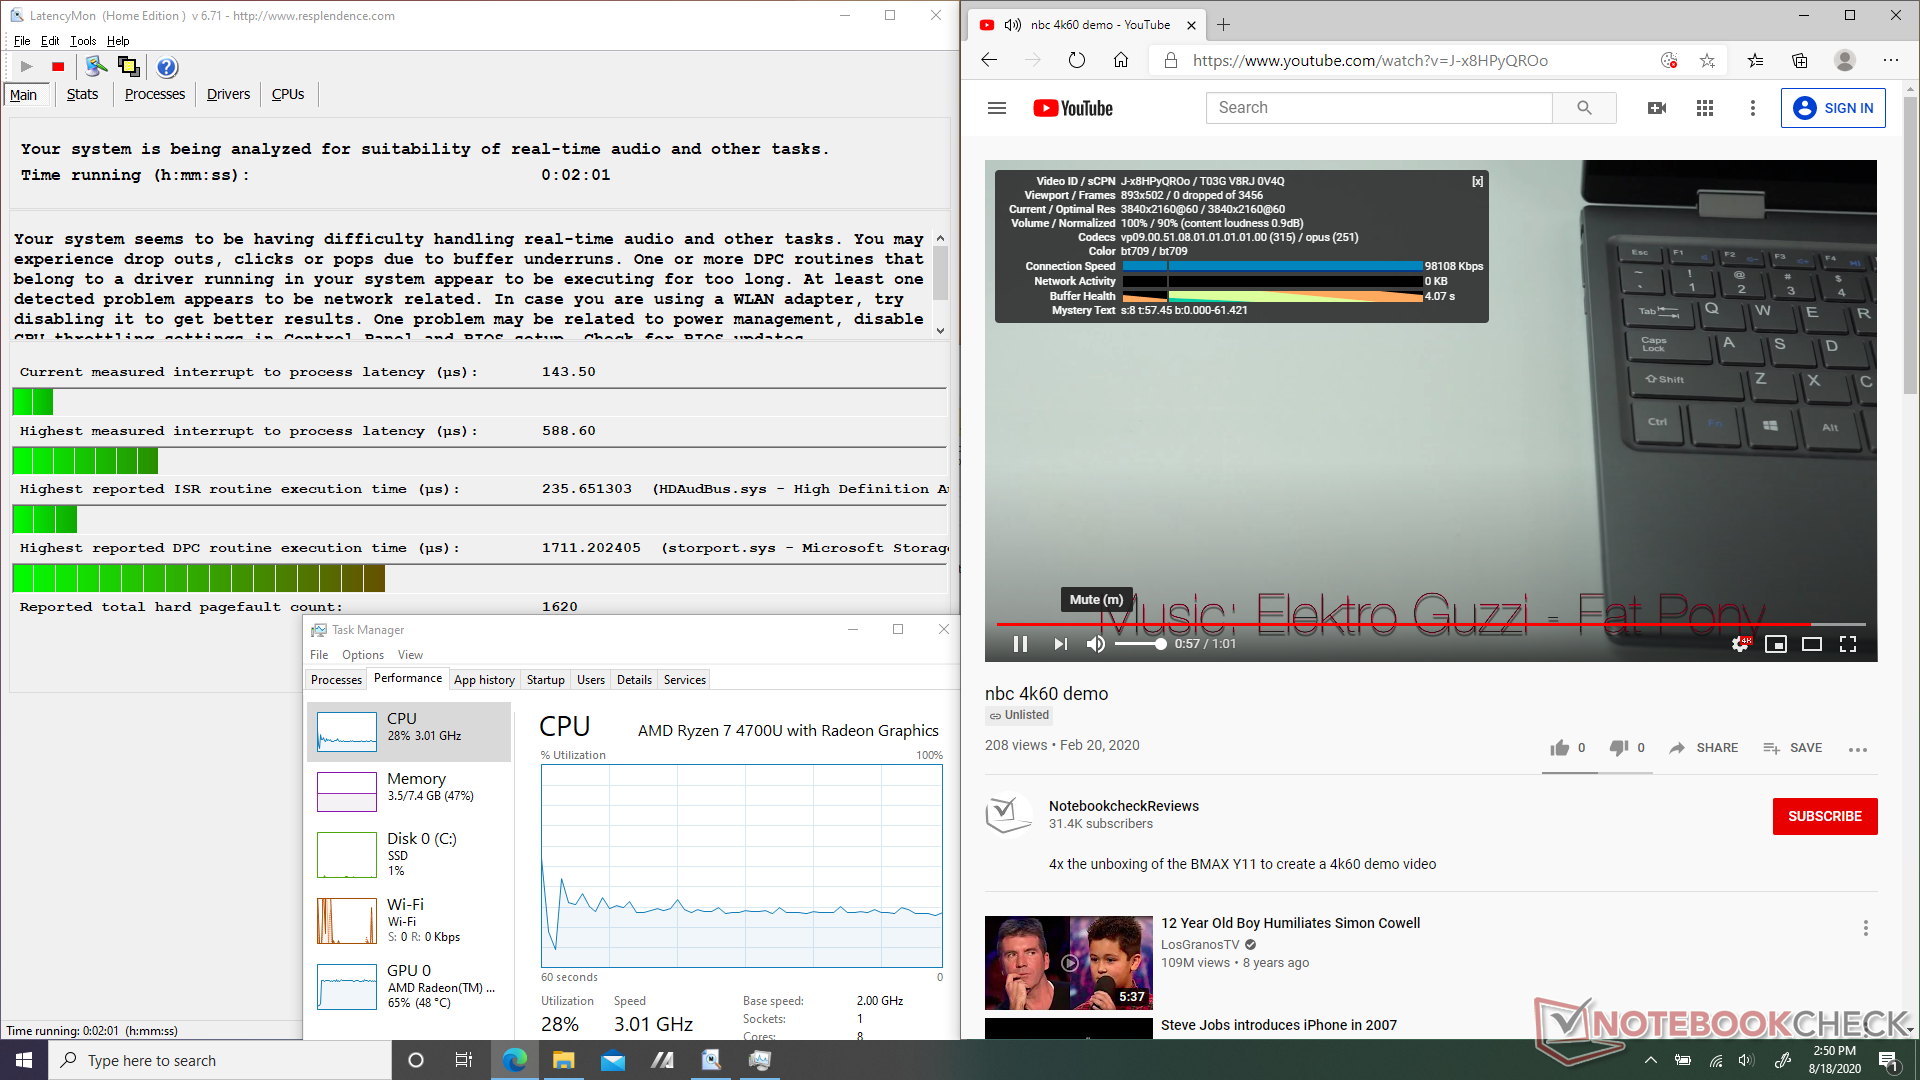
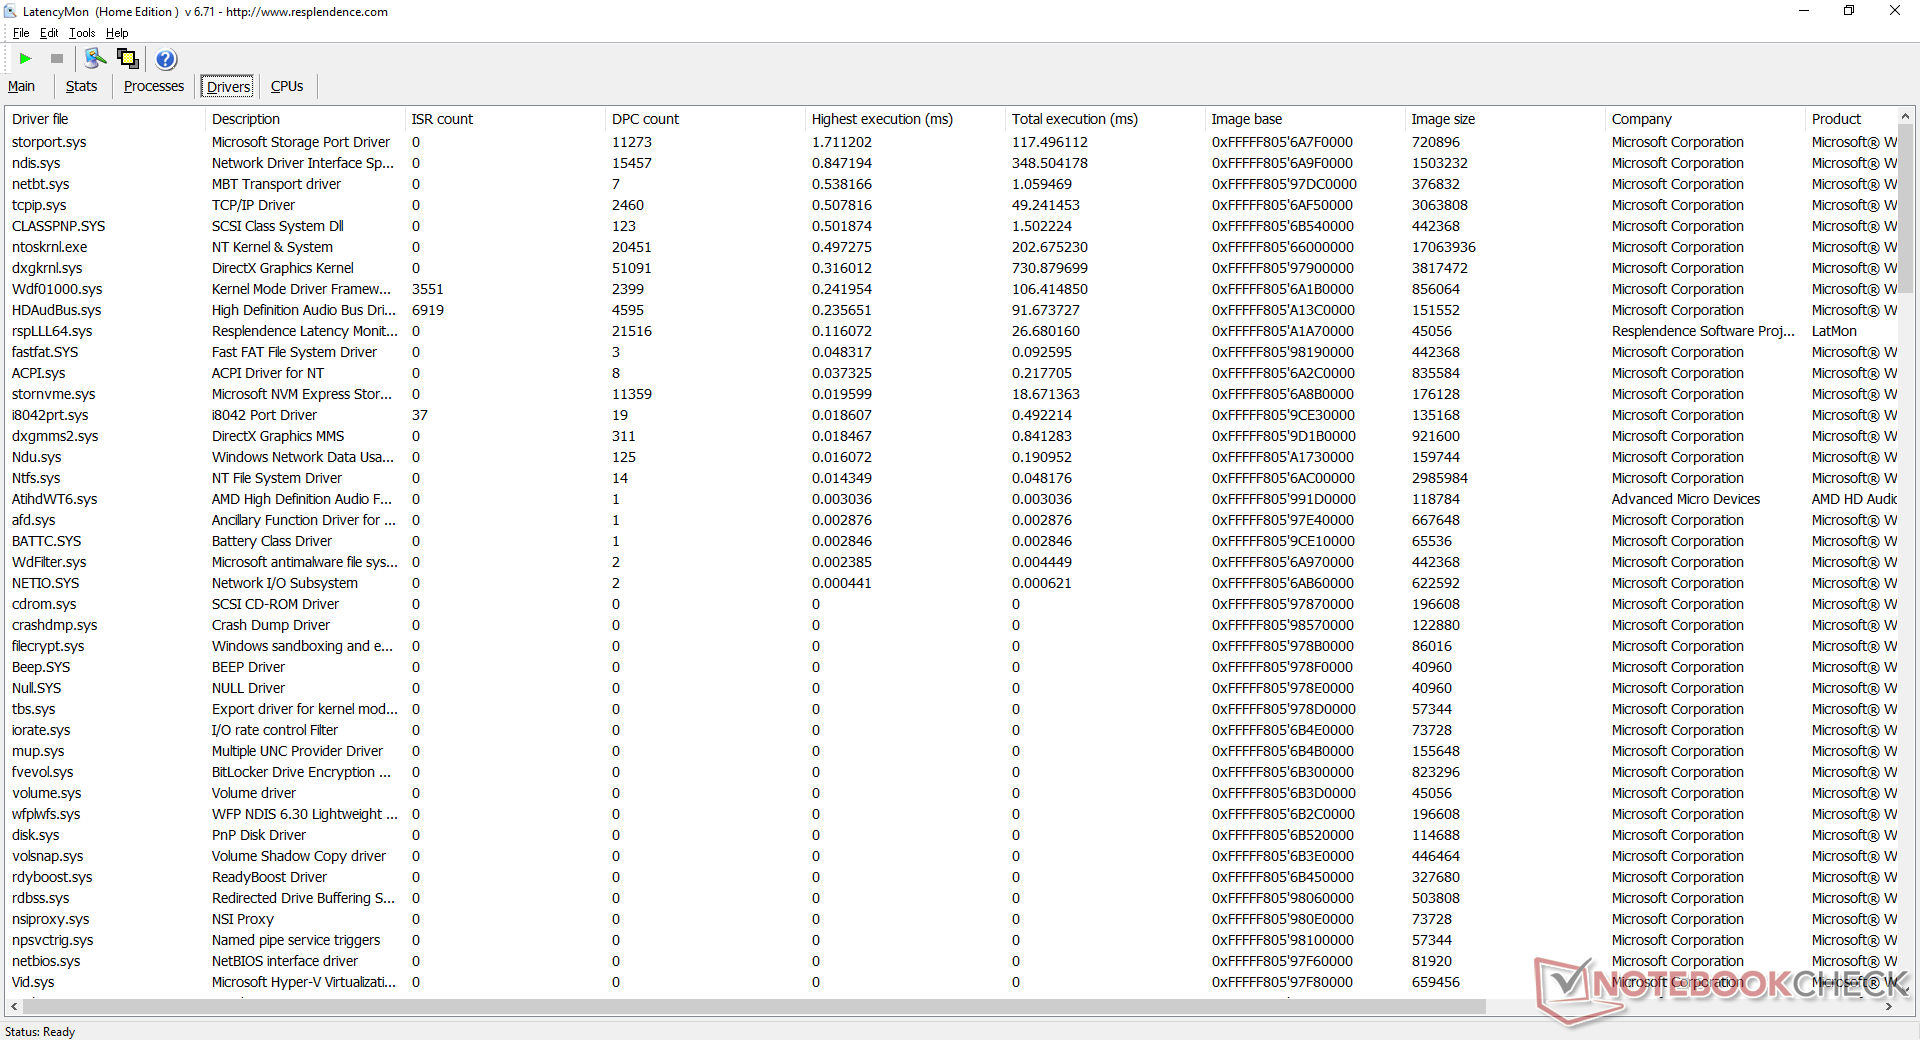
DPC Latency
LatencyMon shows DPC latency issues related to storport.sys. 4K60 playback on YouTube is otherwise smooth and with no dropped frames.
| DPC Latencies / LatencyMon - interrupt to process latency (max), Web, Youtube, Prime95 | |
| Honor Magicbook 14 | |
| Acer Swift 3 SF314-42-R27B | |
| Lenovo IdeaPad 3 14IIL05 | |
| Asus VivoBook Flip 14 TM420IA | |
| Lenovo ThinkPad X1 Yoga 2020-20UCS03S00 | |
| Asus VivoBook S14 S433FL | |
| Asus ZenBook Flip 14 UX463FA-AI039T | |
* ... smaller is better
Storage Devices
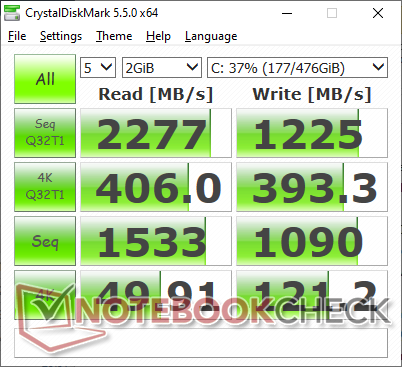
The Samsung PM991 is a budget mid-range NVMe SSD that pairs well with the budget mid-range VivoBook. Its drawback is the relatively slow average sequential write rate of about 800 MB/s whereas pricier NVMe drives like the PM981a can be 2x to 3x faster.
See our table of HDDs and SSDs for more benchmark comparisons.
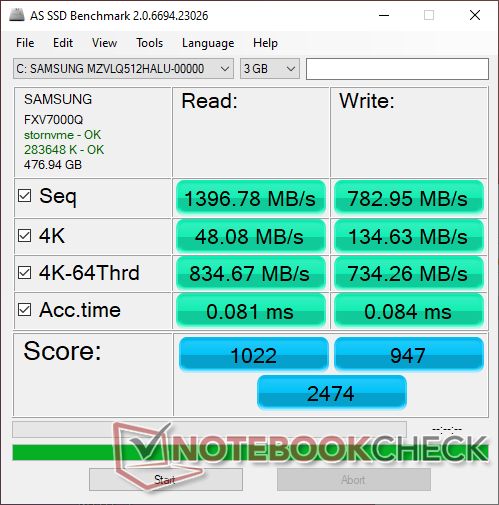
| Asus VivoBook Flip 14 TM420IA Samsung PM991 MZVLQ512HALU | Lenovo IdeaPad 3 14IIL05 WDC PC SN520 SDAPMUW-256G | Acer Swift 3 SF314-42-R27B SK hynix BC511 HFM256GDJTNI-82A0 | Asus ZenBook Flip 14 UX463FA-AI039T Kingston RBUSNS8154P3512GJ1 | Honor Magicbook 14 Samsung SSD PM981a MZVLB256HBHQ | |
|---|---|---|---|---|---|
| AS SSD | -15% | -11% | -22% | 18% | |
| Seq Read | 1397 | 1535 10% | 1682 20% | 1336 -4% | 2591 85% |
| Seq Write | 783 | 1215 55% | 931 19% | 653 -17% | 2133 172% |
| 4K Read | 48.08 | 35.93 -25% | 41.53 -14% | 26.65 -45% | 50 4% |
| 4K Write | 134.6 | 138.3 3% | 109.1 -19% | 52.7 -61% | 95.7 -29% |
| 4K-64 Read | 835 | 467.7 -44% | 603 -28% | 644 -23% | 607 -27% |
| 4K-64 Write | 734 | 399.6 -46% | 713 -3% | 482.9 -34% | 482.6 -34% |
| Access Time Read * | 0.081 | 0.104 -28% | 0.074 9% | 0.075 7% | |
| Access Time Write * | 0.084 | 0.029 65% | 0.035 58% | 0.072 14% | 0.034 60% |
| Score Read | 1022 | 657 -36% | 813 -20% | 804 -21% | 916 -10% |
| Score Write | 947 | 659 -30% | 915 -3% | 601 -37% | 792 -16% |
| Score Total | 2474 | 1647 -33% | 2118 -14% | 1786 -28% | 2168 -12% |
| Copy ISO MB/s | 1212 | 754 -38% | 692 -43% | ||
| Copy Program MB/s | 374.3 | 253.1 -32% | 226.5 -39% | ||
| Copy Game MB/s | 829 | 546 -34% | 391.5 -53% | ||
| CrystalDiskMark 5.2 / 6 | 7% | -12% | -29% | 34% | |
| Write 4K | 121.2 | 173.1 43% | 96.3 -21% | 54.6 -55% | 137.7 14% |
| Read 4K | 49.91 | 49.32 -1% | 35.06 -30% | 28.19 -44% | 42.49 -15% |
| Write Seq | 1090 | 1188 9% | 1001 -8% | 840 -23% | 2341 115% |
| Read Seq | 1533 | 1278 -17% | 1072 -30% | 905 -41% | 2436 59% |
| Write 4K Q32T1 | 393.3 | 457.4 16% | 423.9 8% | 409.5 4% | 261 -34% |
| Read 4K Q32T1 | 406 | 505 24% | 464.7 14% | 292.4 -28% | 335.4 -17% |
| Write Seq Q32T1 | 1225 | 1258 3% | 967 -21% | 1038 -15% | 2343 91% |
| Read Seq Q32T1 | 2277 | 1742 -23% | 2179 -4% | 1607 -29% | 3569 57% |
| Total Average (Program / Settings) | -4% /
-7% | -12% /
-11% | -26% /
-25% | 26% /
25% |
* ... smaller is better

Disk Throttling: DiskSpd Read Loop, Queue Depth 8
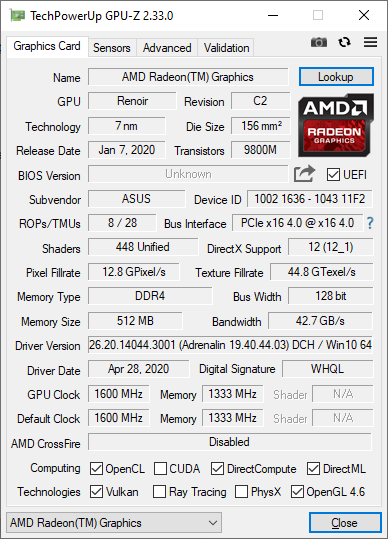
GPU Performance
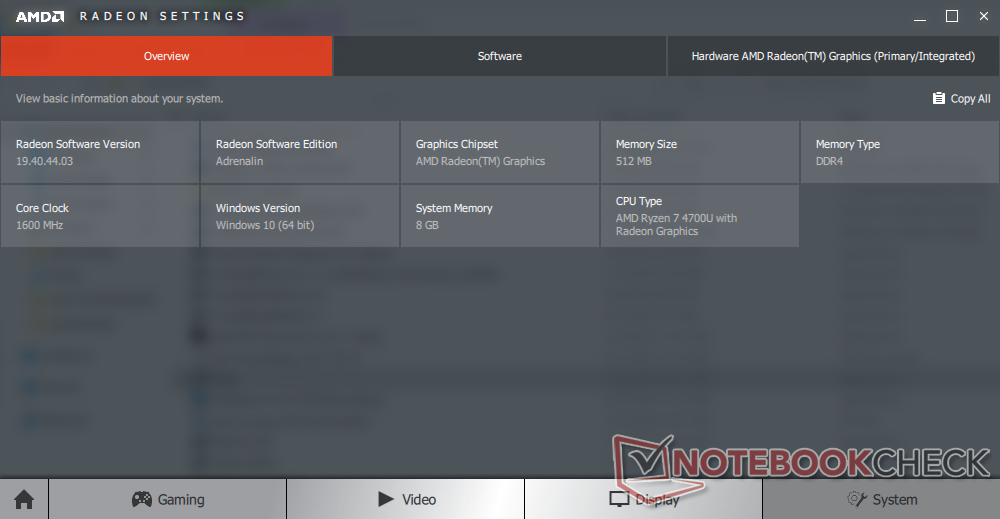
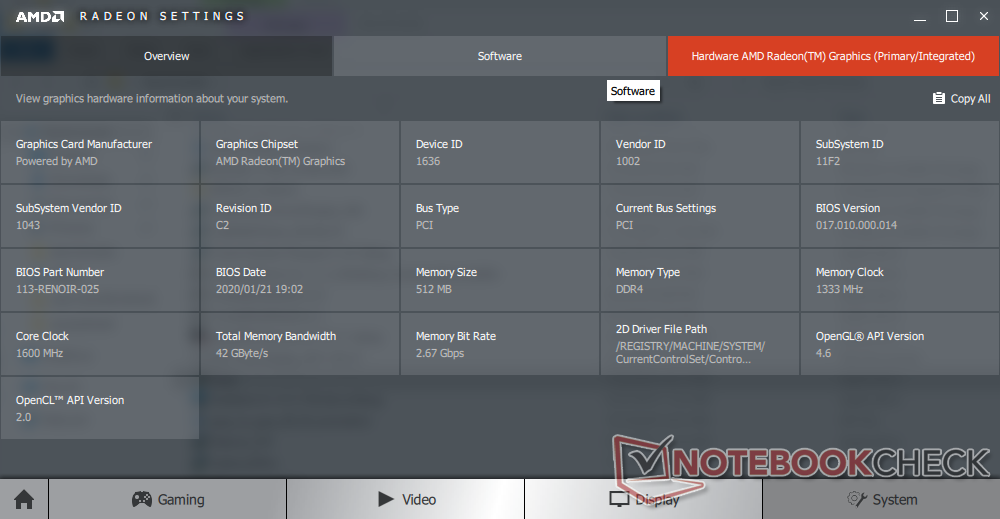
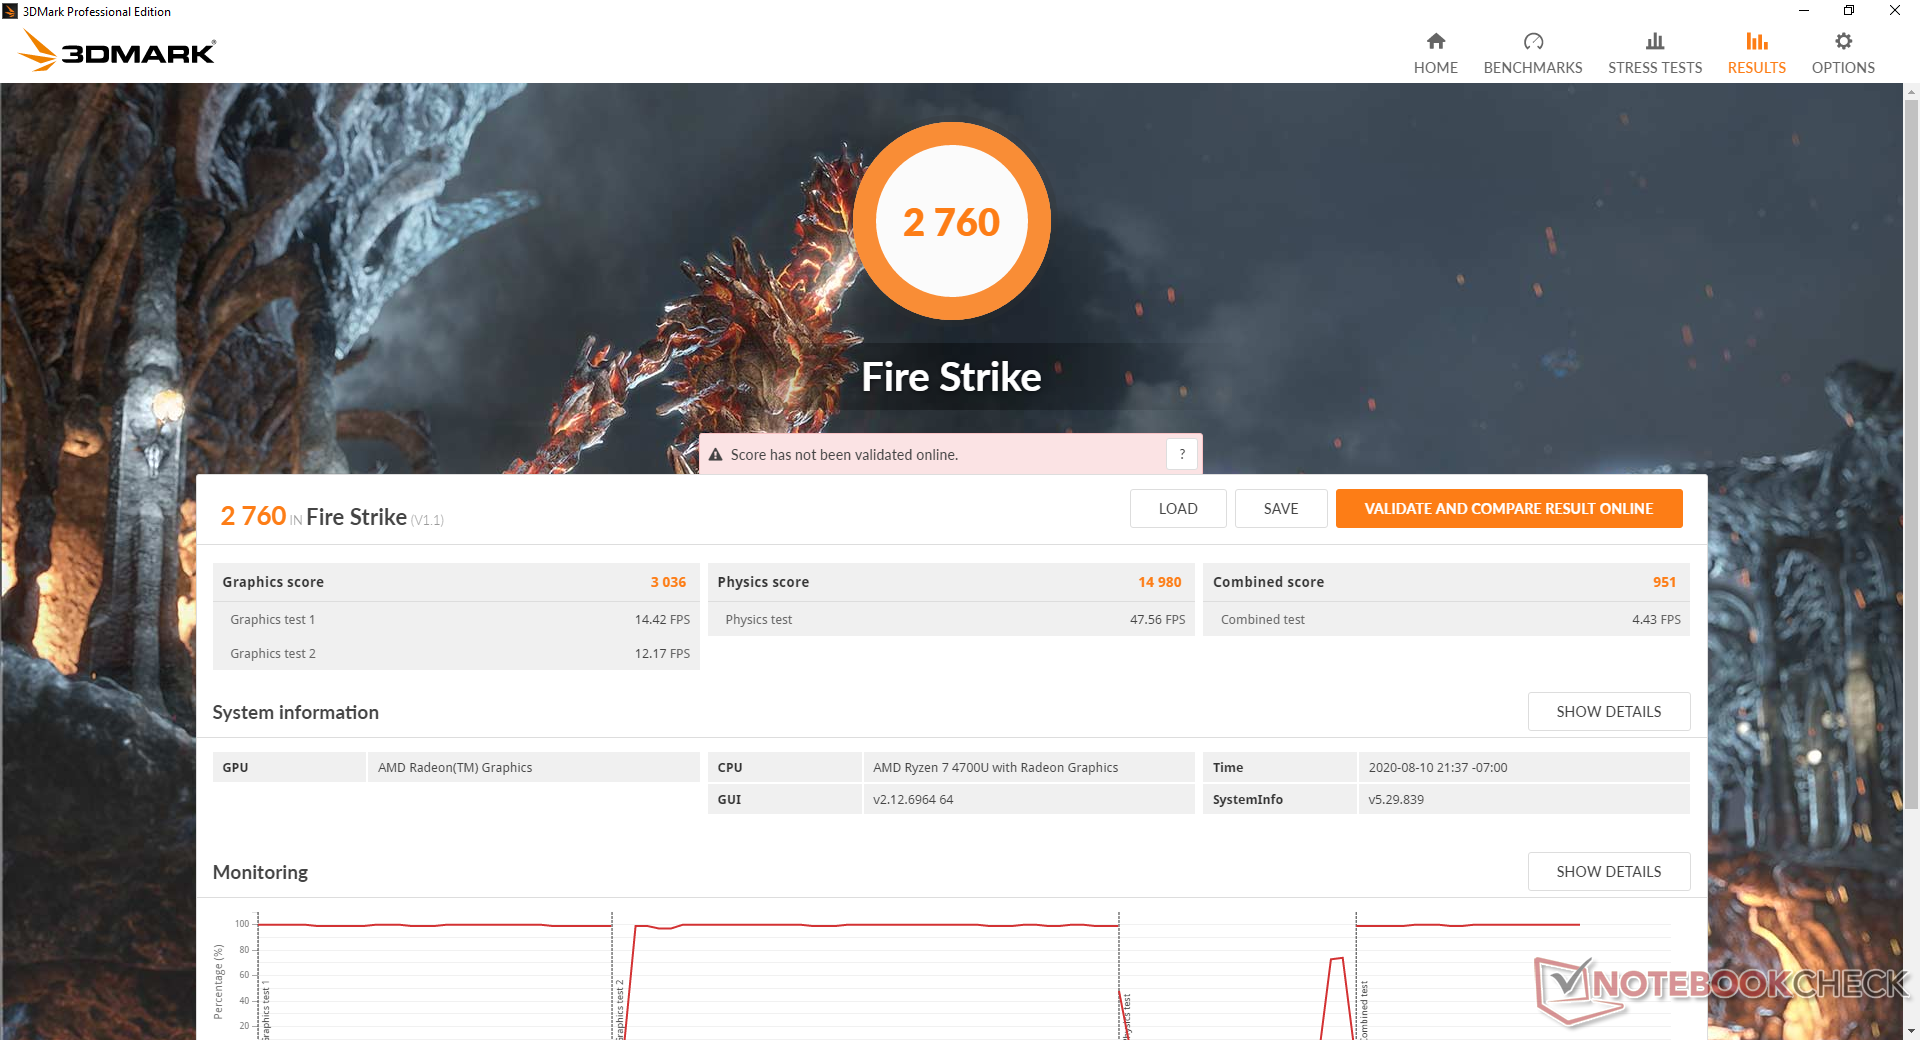
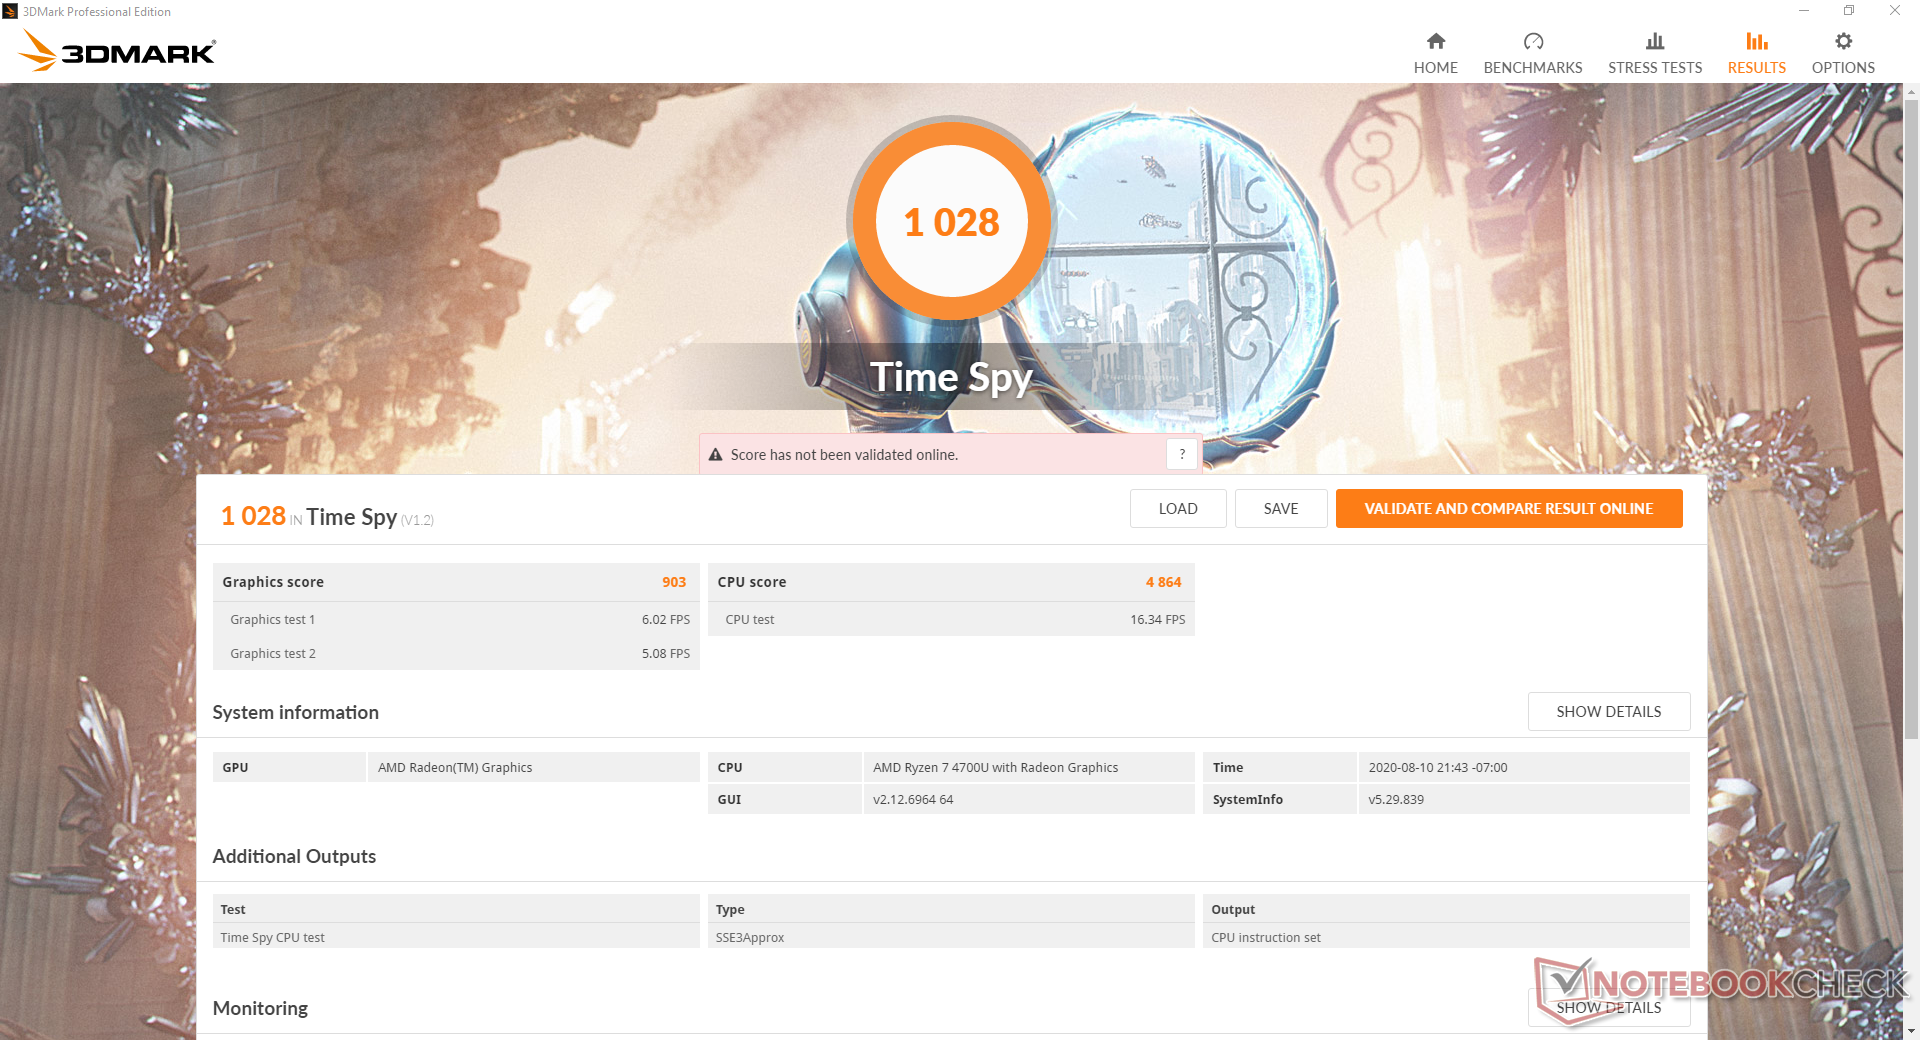
According to 3DMark, the integrated Radeon RX Vega 7 performs as well as most laptops equipped with the 10 W GeForce MX150 while being about 10 to 15 percent faster than the Core i7-1065G7 and its integrated Iris Plus G7. Real-world gaming performance still favors the GeForce GPU due to its more mature drivers, but AMD has been steadily optimizing its drivers to narrow the gap.
See our dedicated page on the Radeon RX Vega 7 for more technical information and benchmarks.
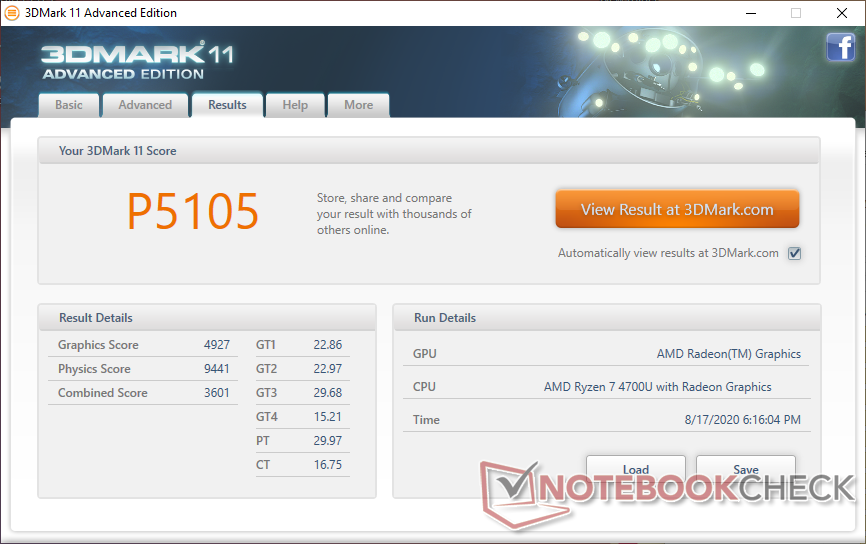
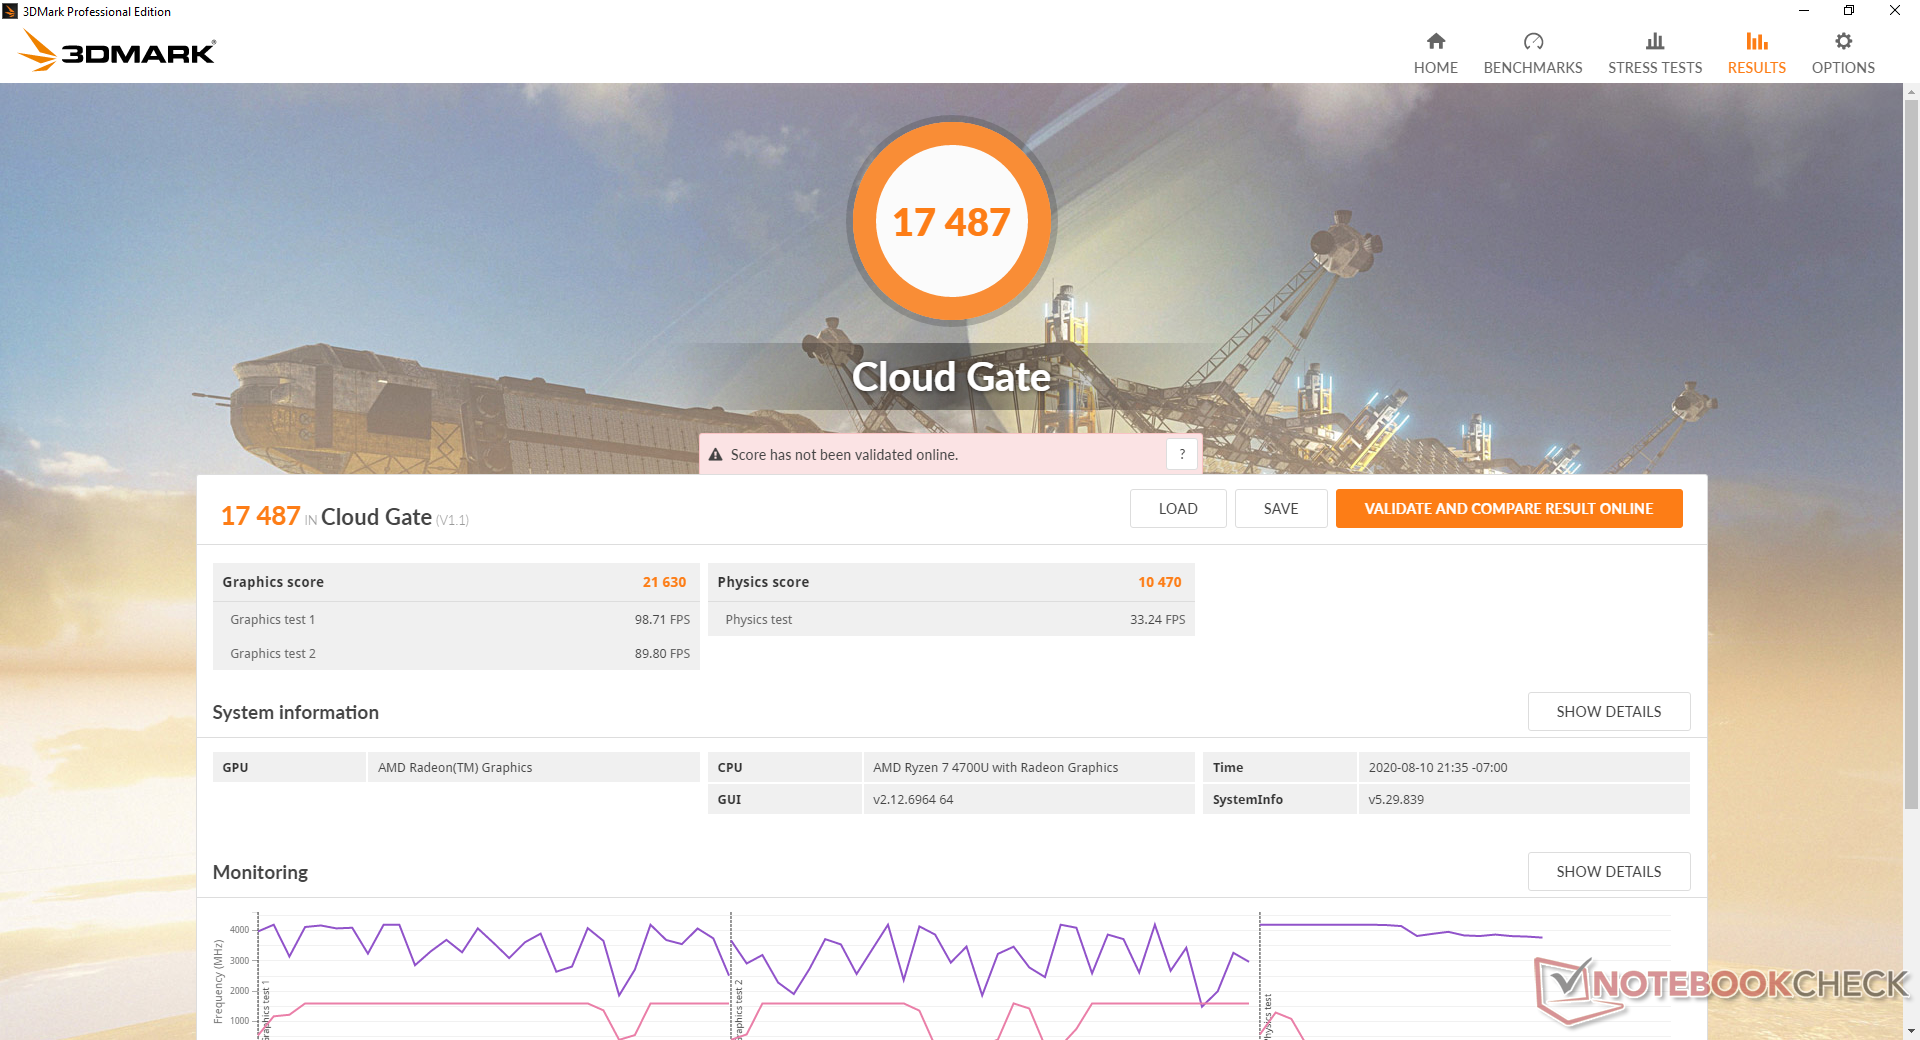
| 3DMark 11 Performance | 5105 points | |
| 3DMark Cloud Gate Standard Score | 17487 points | |
| 3DMark Fire Strike Score | 2760 points | |
| 3DMark Time Spy Score | 1028 points | |
Help | ||
| Final Fantasy XV Benchmark - 1280x720 Lite Quality | |
| Asus VivoBook Flip 14 TM420IA | |
| Beelink GTR35 II-G-16512D00W64PRO-1T | |
| Xiaomi RedmiBook 16 R5 | |
| Huawei MateBook D 15-53010TUY | |
| Asus ZenBook 14 UM431DA-AM020T | |
| HP 14s-dq1431ng | |
| Lenovo ThinkPad X13-20T20033GE | |
| low | med. | high | ultra | |
| The Witcher 3 (2015) | 61.4 | 38.6 | 20.2 | 13.2 |
| Dota 2 Reborn (2015) | 93.9 | 70.3 | 44.5 | 41.5 |
| Final Fantasy XV Benchmark (2018) | 30.2 | 15.2 | 9.86 | |
| X-Plane 11.11 (2018) | 40.6 | 32.5 | 28.6 |
Emissions
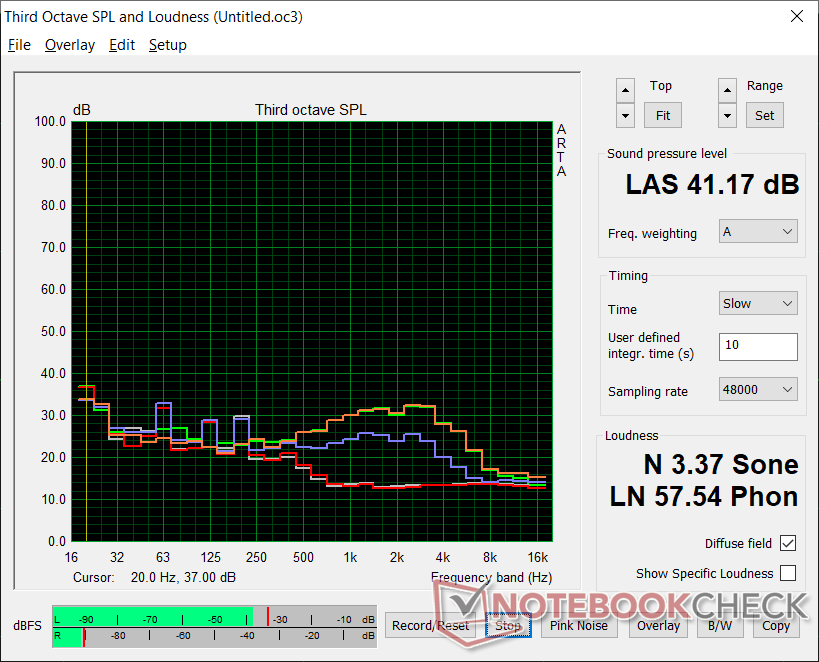
System Noise
Day-to-day loads like browsing or word processing will not induce any bothersome pulsing behavior. At most, we're able to record a high of just 31.7 dB(A) which is just barely audible in most environments. Higher loads like gaming will induce a fan noise of 41.3 dB(A) to be louder than most Ultrabooks with slower Intel UHD Graphics only.
| Asus VivoBook Flip 14 TM420IA Vega 7, R7 4700U, Samsung PM991 MZVLQ512HALU | Lenovo IdeaPad 3 14IIL05 UHD Graphics G1 (Ice Lake 32 EU), i3-1005G1, WDC PC SN520 SDAPMUW-256G | Acer Swift 3 SF314-42-R27B Vega 5, R3 4300U, SK hynix BC511 HFM256GDJTNI-82A0 | Asus ZenBook Flip 14 UX463FA-AI039T UHD Graphics 620, i5-10210U, Kingston RBUSNS8154P3512GJ1 | Honor Magicbook 14 Vega 8, R5 3500U, Samsung SSD PM981a MZVLB256HBHQ | Asus VivoBook S14 S433FL GeForce MX250, i7-10510U, Intel Optane Memory H10 with Solid State Storage 32GB + 512GB HBRPEKNX0202A(L/H) | |
|---|---|---|---|---|---|---|
| Noise | -4% | -5% | -1% | -2% | -12% | |
| off / environment * | 27.1 | 30.7 -13% | 30.3 -12% | 30.1 -11% | 29.6 -9% | 30.7 -13% |
| Idle Minimum * | 27.1 | 30.7 -13% | 30.3 -12% | 30.1 -11% | 29.6 -9% | 31 -14% |
| Idle Average * | 27.1 | 30.7 -13% | 30.3 -12% | 30.1 -11% | 29.6 -9% | 31 -14% |
| Idle Maximum * | 27.1 | 30.7 -13% | 30.3 -12% | 30.1 -11% | 29.6 -9% | 31.3 -15% |
| Load Average * | 35 | 31.6 10% | 32.6 7% | 30.1 14% | 30.8 12% | 43.4 -24% |
| Witcher 3 ultra * | 41.3 | 42.8 -4% | ||||
| Load Maximum * | 41.3 | 33.6 19% | 35.6 14% | 32.02 22% | 35.3 15% | 41.5 -0% |
* ... smaller is better
Noise Level
| Idle |
| 27.1 / 27.1 / 27.1 dB(A) |
| Load |
| 35 / 41.3 dB(A) |
 | ||
30 dB silent 40 dB(A) audible 50 dB(A) loud |
||
min: | ||
Temperature
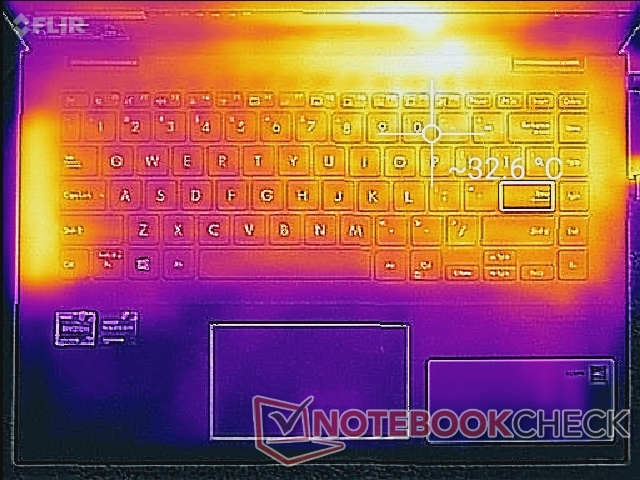
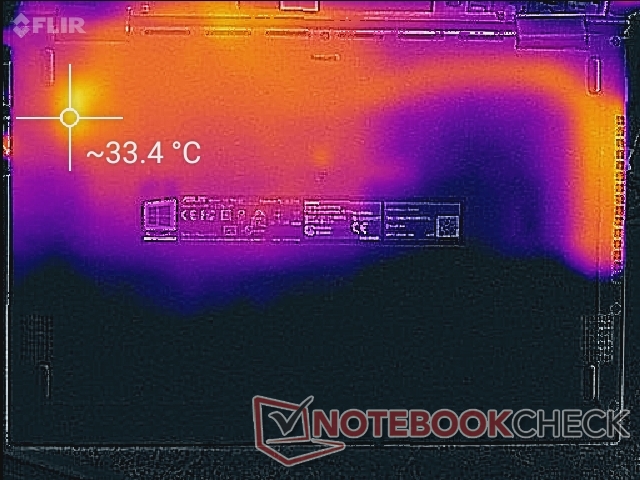
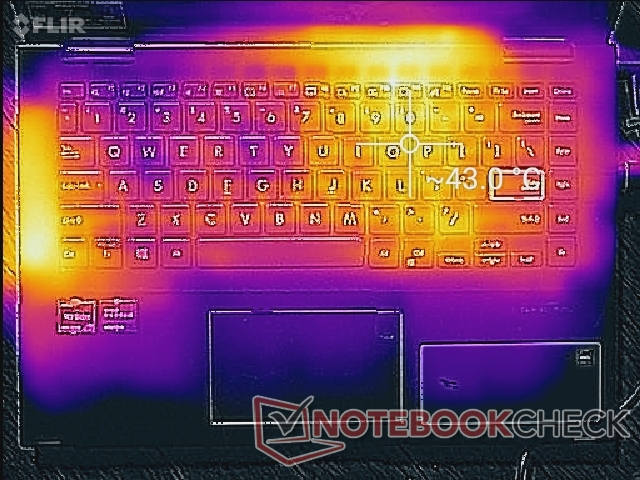
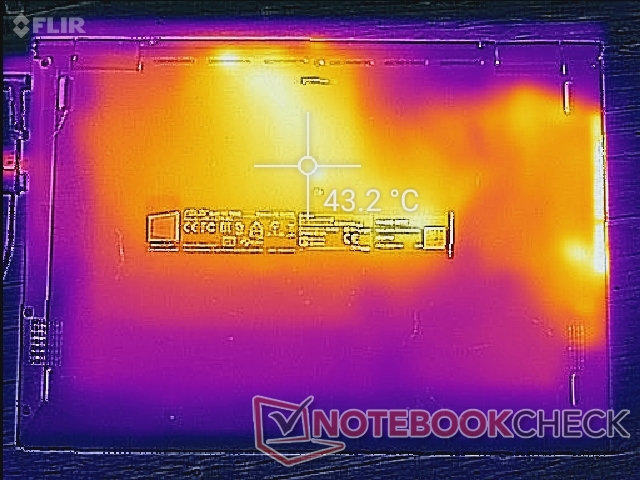
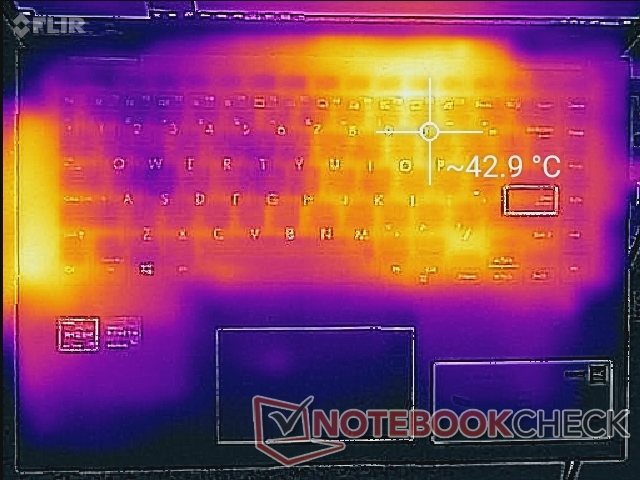
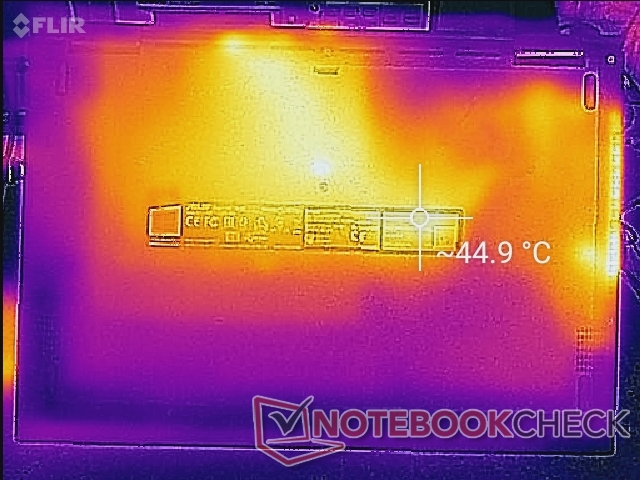
Surface temperatures are noticeably warmer on the keyboard keys and along the left edge near the exhaust grilles as shown by our temperature maps below. The bottom panel can become quite warm at 43 C when under high processing loads partly because there are no ventilation grilles on the bottom panel.
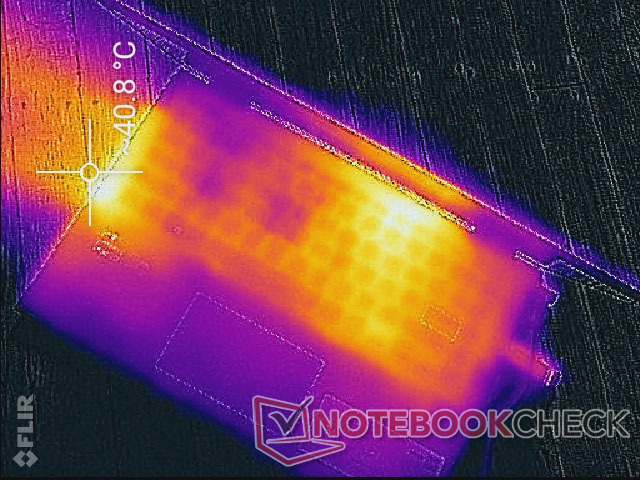
(±) The maximum temperature on the upper side is 44.6 °C / 112 F, compared to the average of 35.3 °C / 96 F, ranging from 19.6 to 55.7 °C for the class Convertible.
(-) The bottom heats up to a maximum of 46 °C / 115 F, compared to the average of 36.8 °C / 98 F
(+) In idle usage, the average temperature for the upper side is 31 °C / 88 F, compared to the device average of 30.2 °C / 86 F.
(±) Playing The Witcher 3, the average temperature for the upper side is 36.3 °C / 97 F, compared to the device average of 30.2 °C / 86 F.
(+) The palmrests and touchpad are cooler than skin temperature with a maximum of 30.6 °C / 87.1 F and are therefore cool to the touch.
(-) The average temperature of the palmrest area of similar devices was 28.1 °C / 82.6 F (-2.5 °C / -4.5 F).
Stress Test
Running Prime95 would boost CPU clock rates to 4.9 GHz for just a couple of seconds before stabilizing at 3.5 GHz and 76 C for a few minutes thereafter. Clock rates and temperature eventually settle at 3 GHz and 69 C, respectively. Faster stable clock rates may have been possible, but it would have likely caused skin temperatures or fan noise to be higher than what Asus was aiming for.
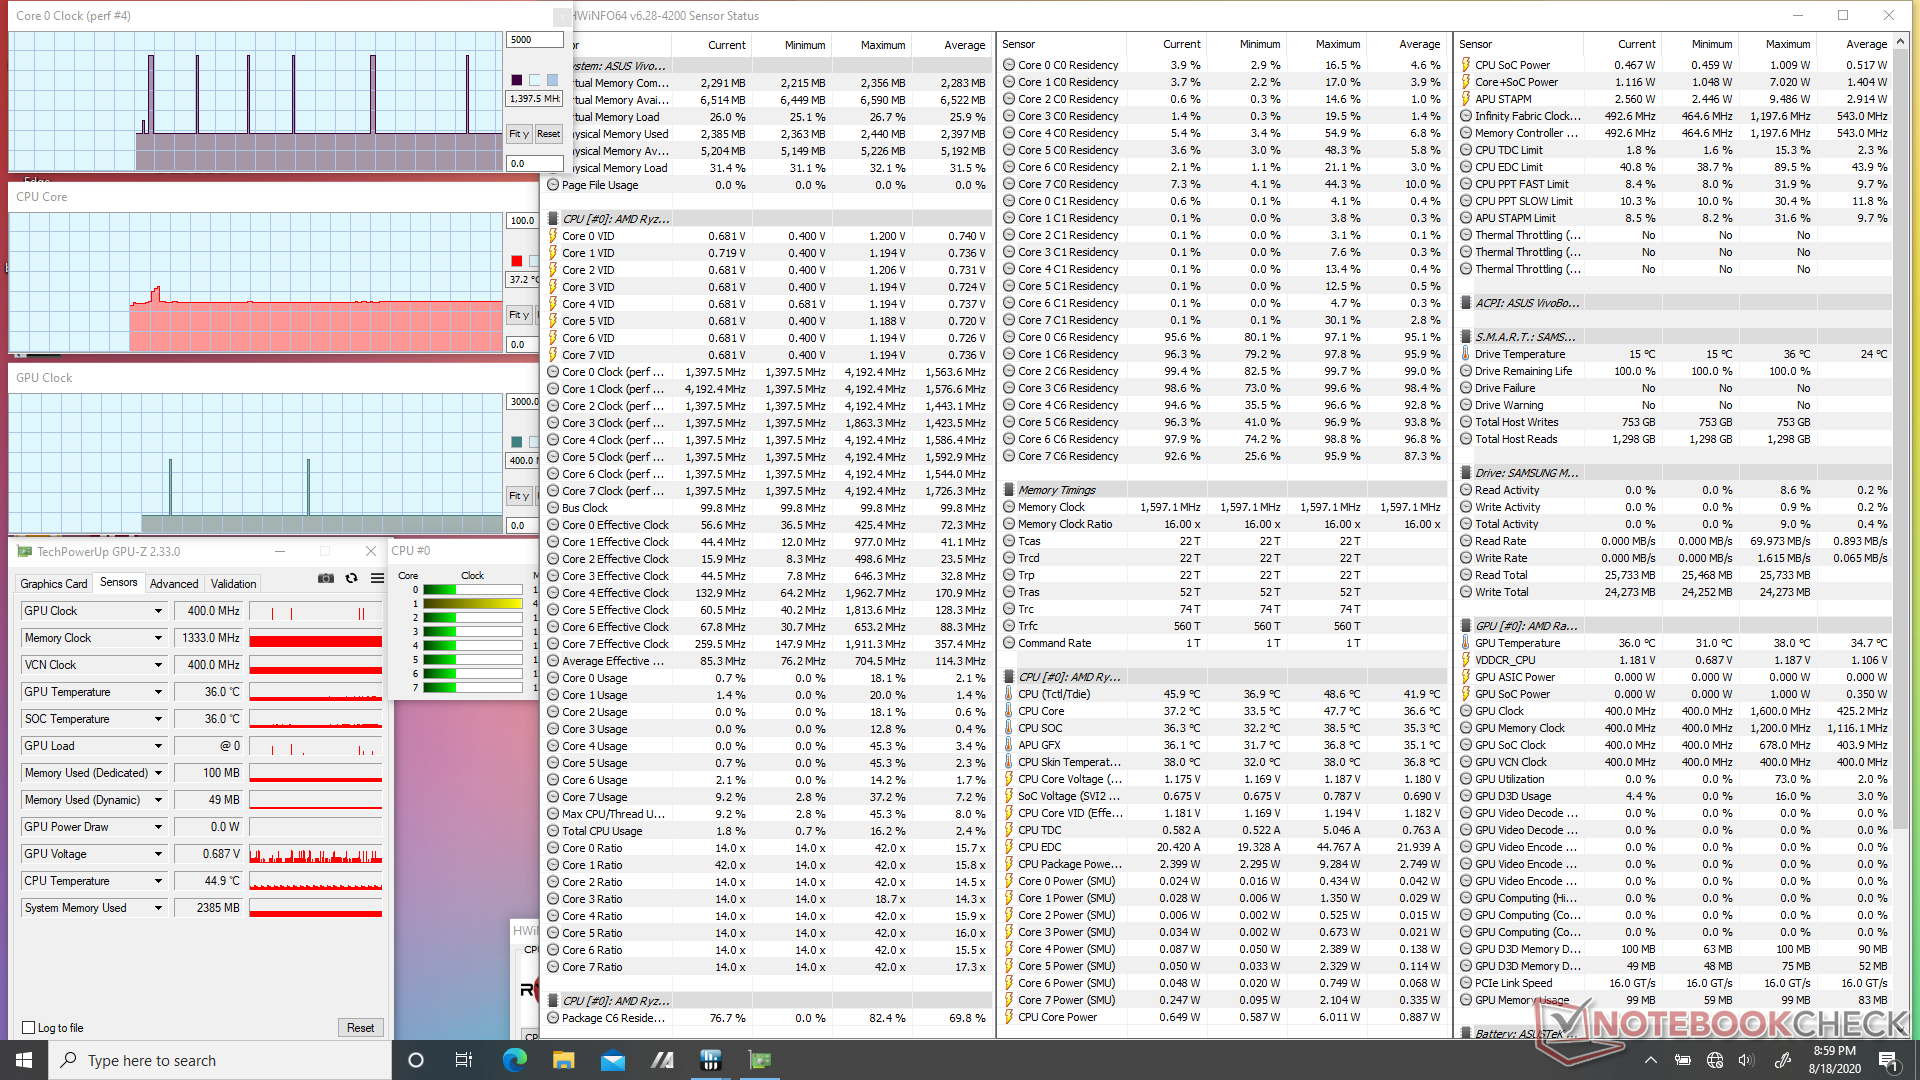
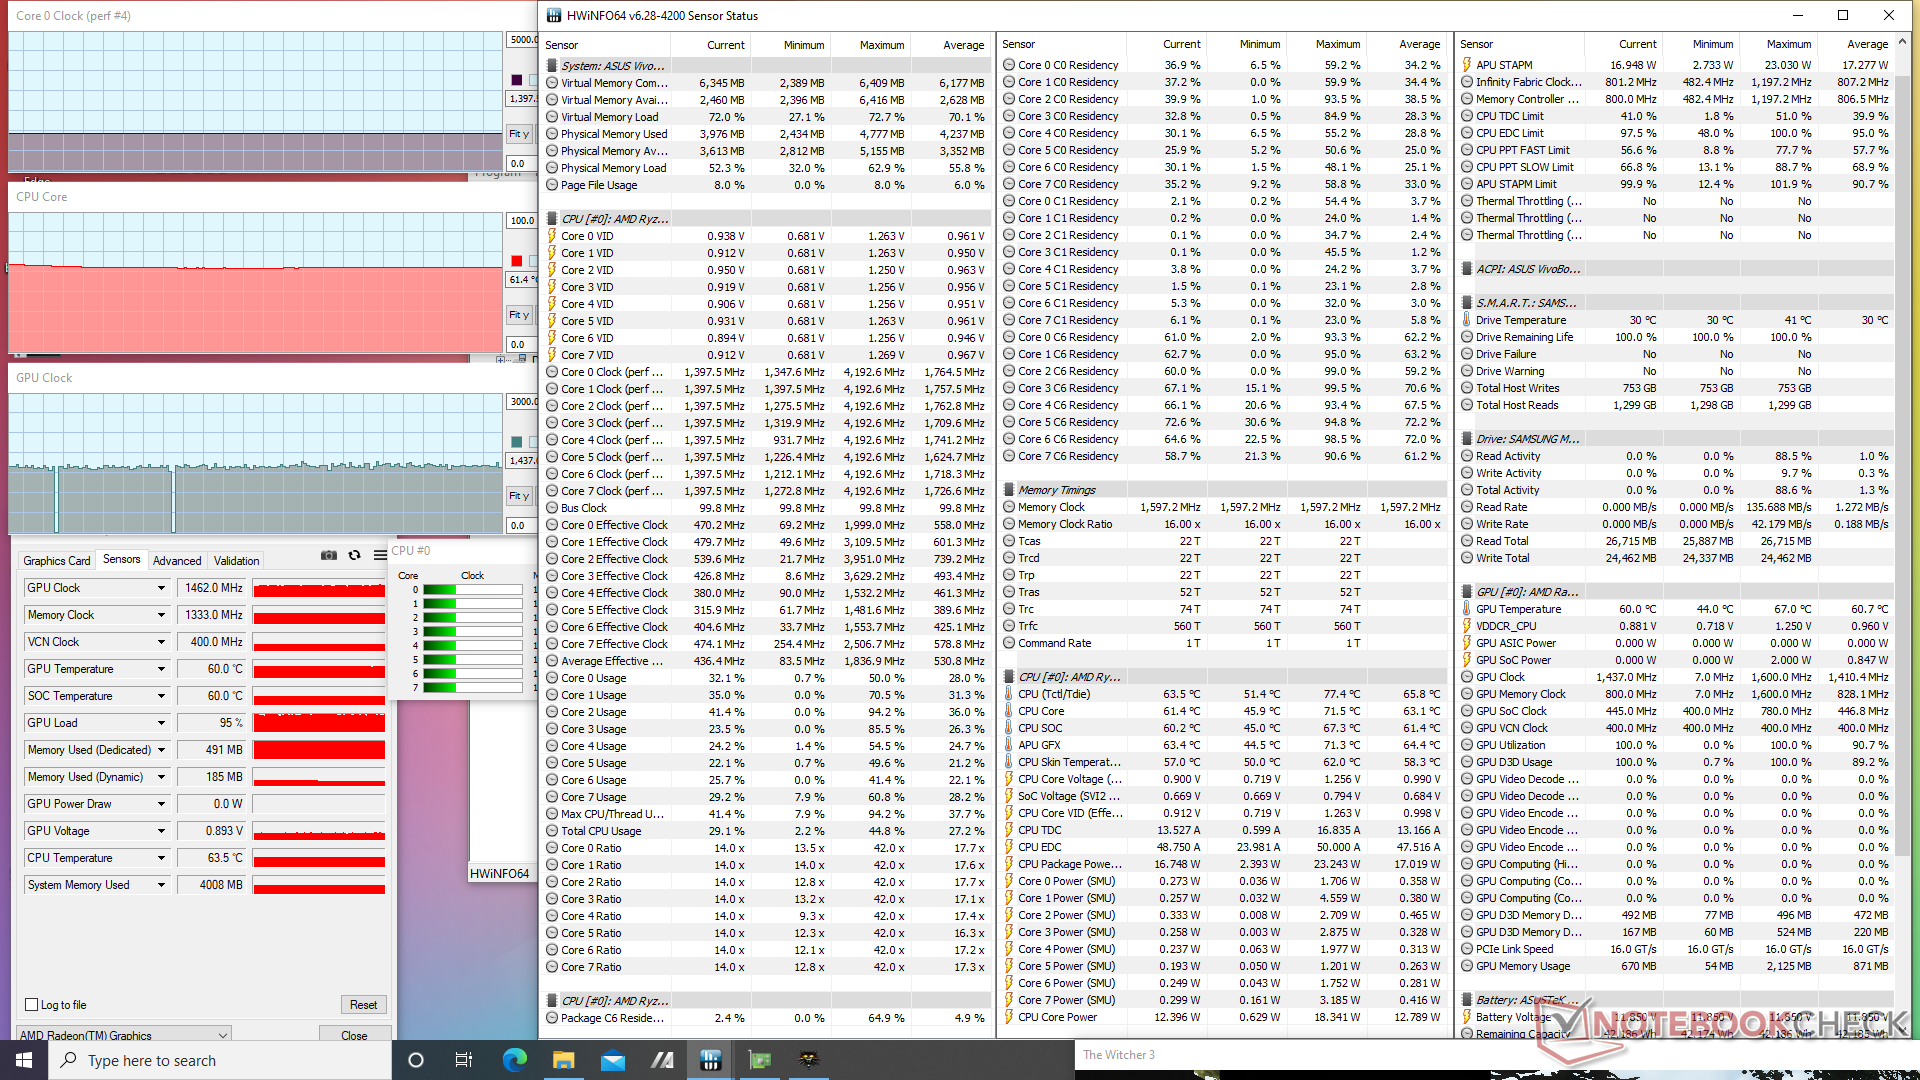
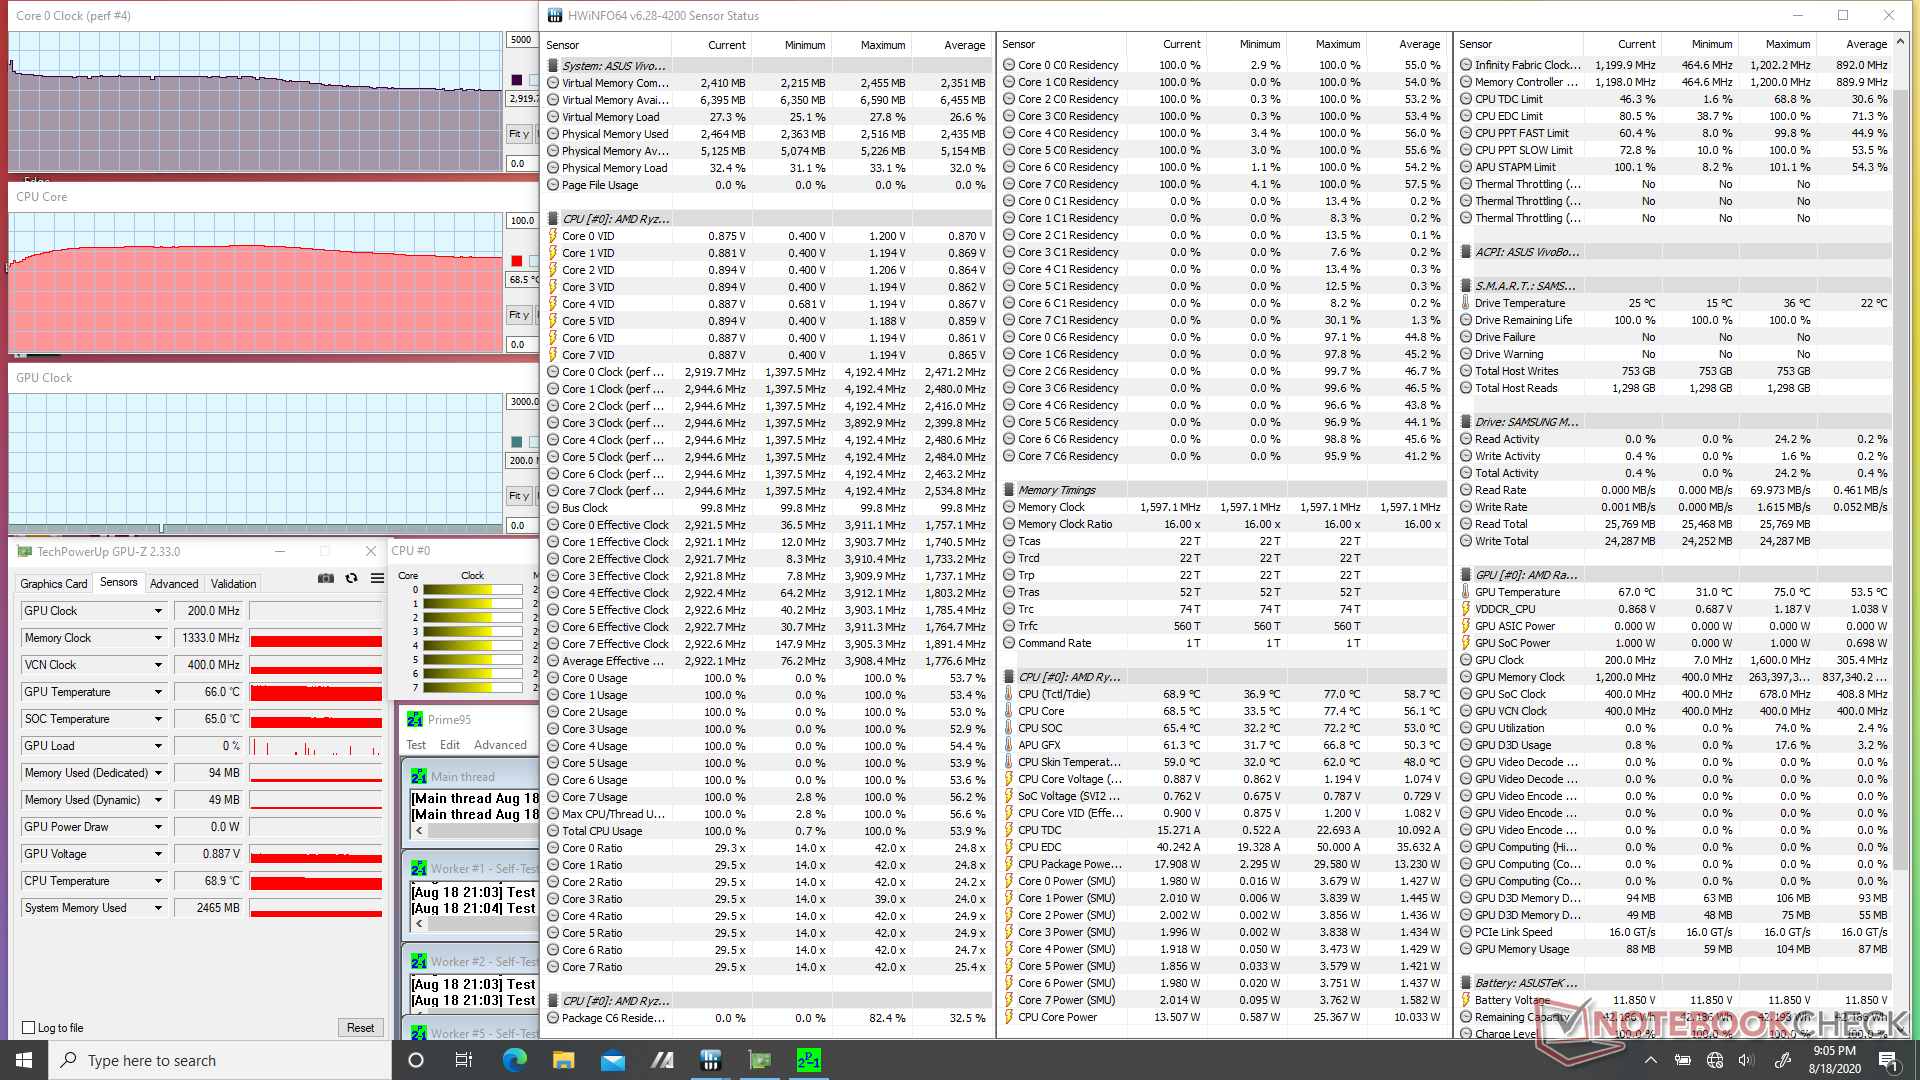
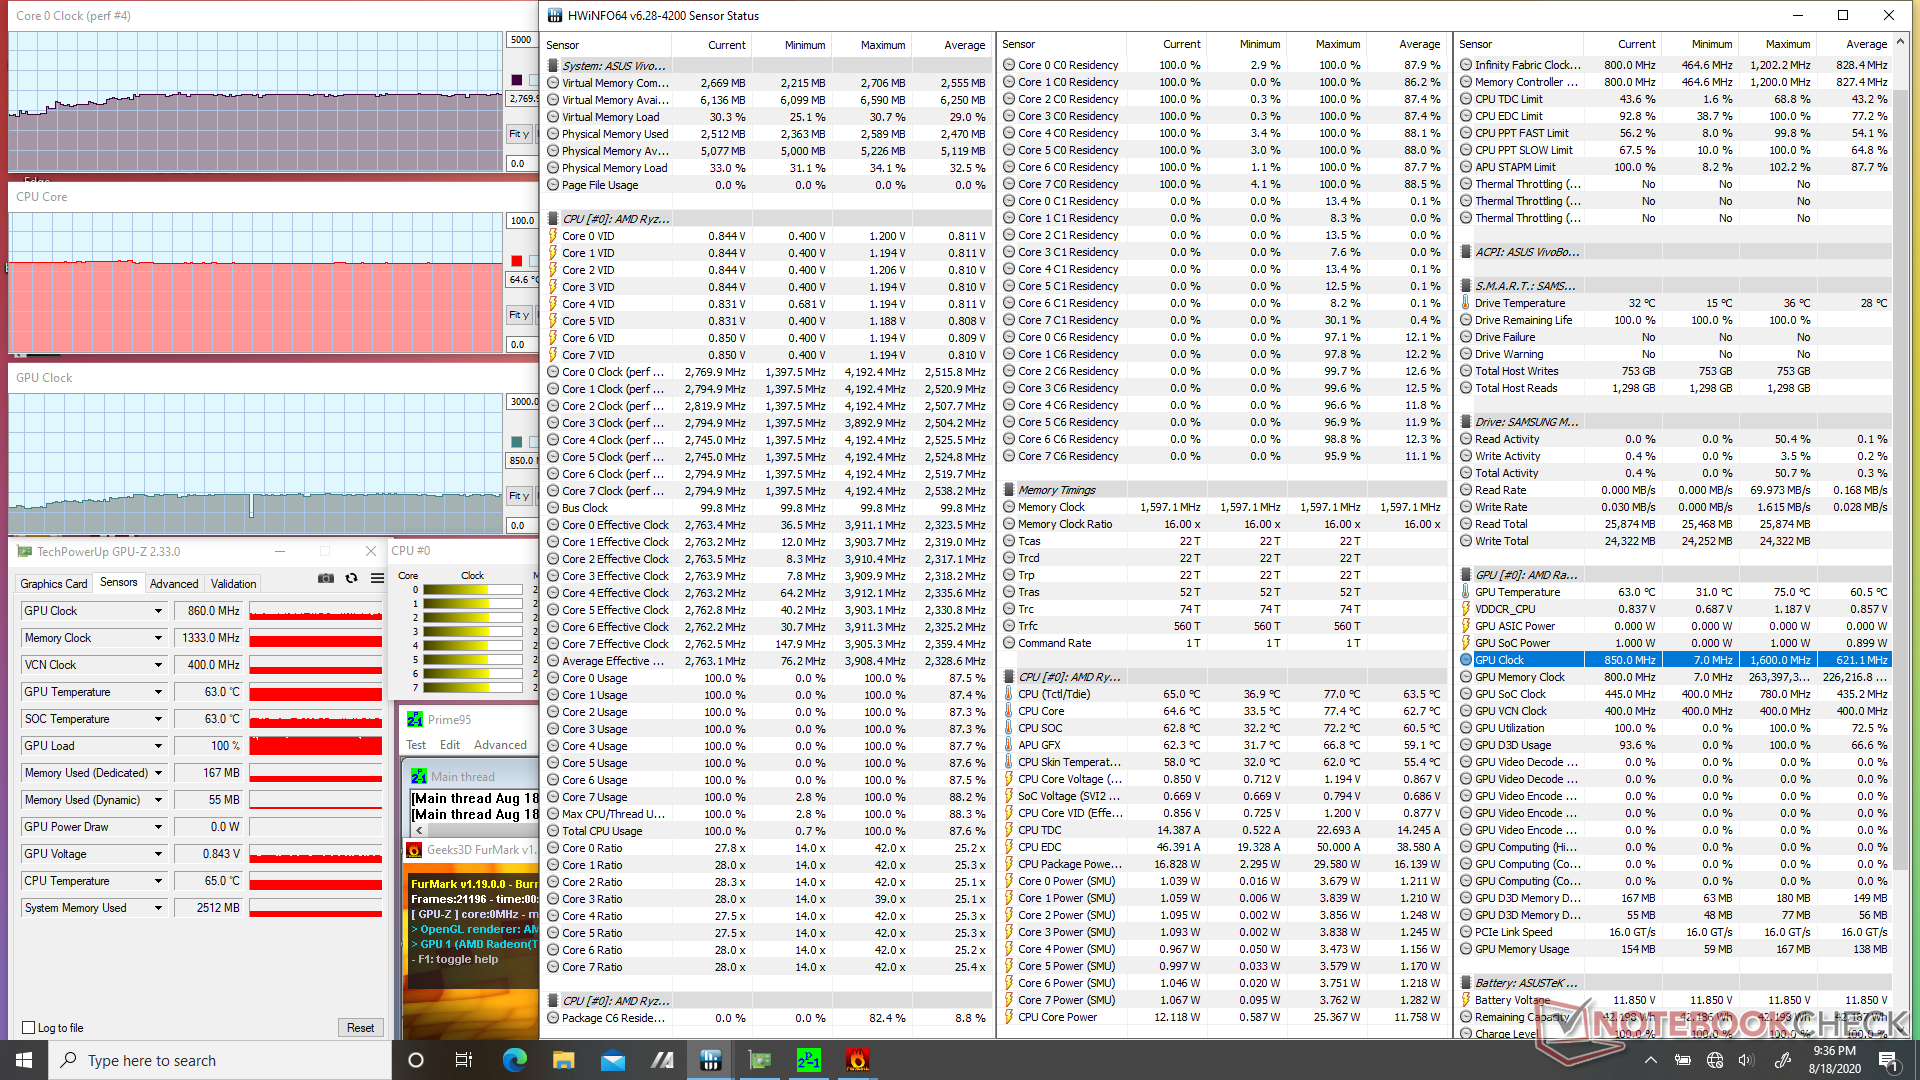
| CPU Clock (GHz) | GPU Clock (MHz) | Average CPU Temperature (°C) | |
| System Idle | -- | -- | 37 |
| Prime95 Stress | 2.9 | -- | 69 |
| Prime95 + FurMark Stress | 2.0 - 2.8 | 550 - 860 | 65 |
| Witcher 3 Stress | 1.4 | 1462 | 61 |
Speakers


Asus VivoBook Flip 14 TM420IA audio analysis
(±) | speaker loudness is average but good (79.2 dB)
Bass 100 - 315 Hz
(±) | reduced bass - on average 13.2% lower than median
(±) | linearity of bass is average (9.8% delta to prev. frequency)
Mids 400 - 2000 Hz
(+) | balanced mids - only 1.8% away from median
(+) | mids are linear (4.5% delta to prev. frequency)
Highs 2 - 16 kHz
(+) | balanced highs - only 3% away from median
(+) | highs are linear (2.9% delta to prev. frequency)
Overall 100 - 16.000 Hz
(+) | overall sound is linear (11.5% difference to median)
Compared to same class
» 7% of all tested devices in this class were better, 3% similar, 90% worse
» The best had a delta of 6%, average was 21%, worst was 57%
Compared to all devices tested
» 5% of all tested devices were better, 2% similar, 93% worse
» The best had a delta of 4%, average was 25%, worst was 134%
Apple MacBook 12 (Early 2016) 1.1 GHz audio analysis
(+) | speakers can play relatively loud (83.6 dB)
Bass 100 - 315 Hz
(±) | reduced bass - on average 11.3% lower than median
(±) | linearity of bass is average (14.2% delta to prev. frequency)
Mids 400 - 2000 Hz
(+) | balanced mids - only 2.4% away from median
(+) | mids are linear (5.5% delta to prev. frequency)
Highs 2 - 16 kHz
(+) | balanced highs - only 2% away from median
(+) | highs are linear (4.5% delta to prev. frequency)
Overall 100 - 16.000 Hz
(+) | overall sound is linear (10.2% difference to median)
Compared to same class
» 5% of all tested devices in this class were better, 2% similar, 93% worse
» The best had a delta of 5%, average was 19%, worst was 53%
Compared to all devices tested
» 3% of all tested devices were better, 1% similar, 96% worse
» The best had a delta of 4%, average was 25%, worst was 134%
Energy Management
Power Consumption
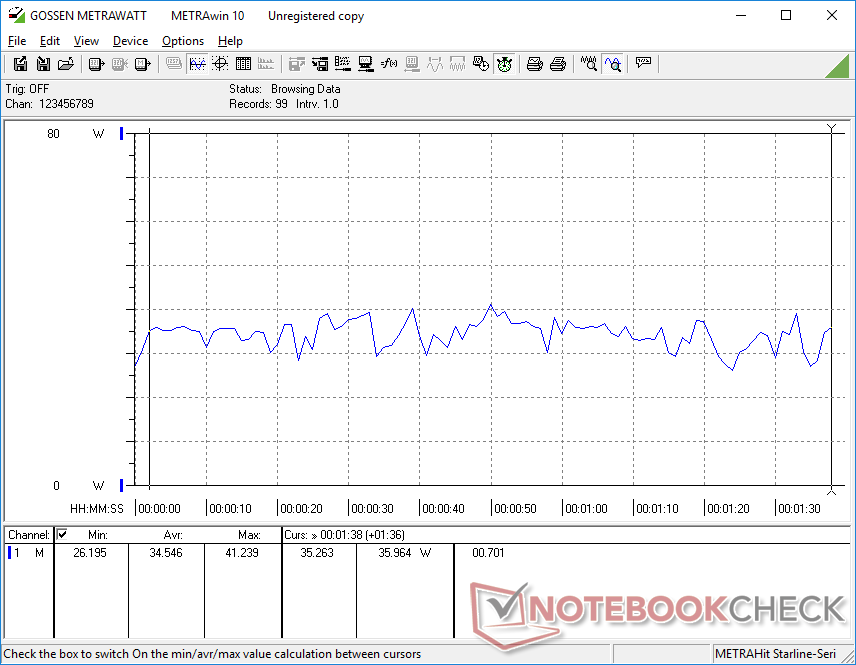
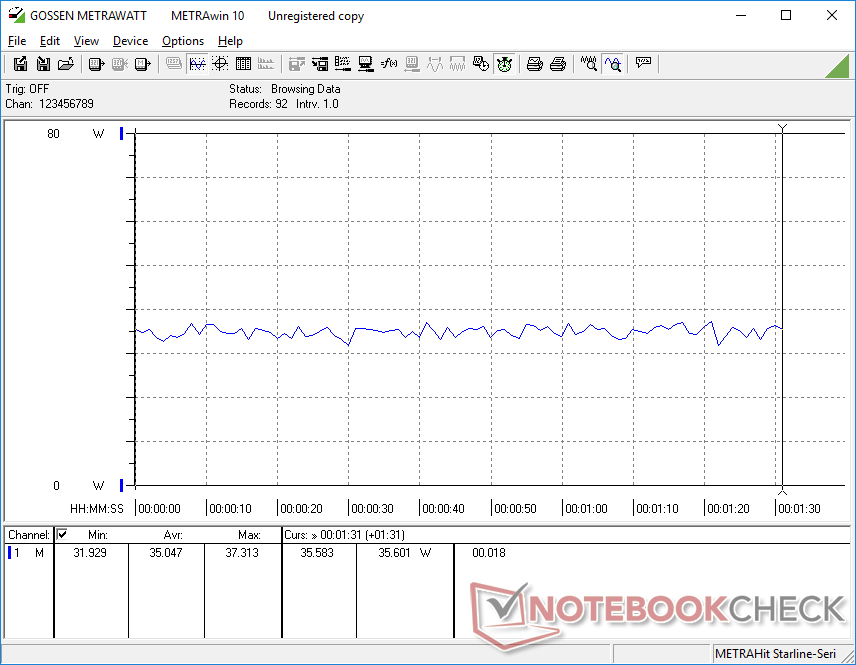
The latest Ryzen laptops are able to offer higher performance-per-Watt than any Intel Core U-series laptop at the moment especially when it comes to processor performance. Running Witcher 3, for example, consumes about 30 percent more than the Core i7-1065G7-powered Asus ZenBook 13 while offering both 15 percent higher graphics performance and over 100 percent faster CPU multi-thread performance.
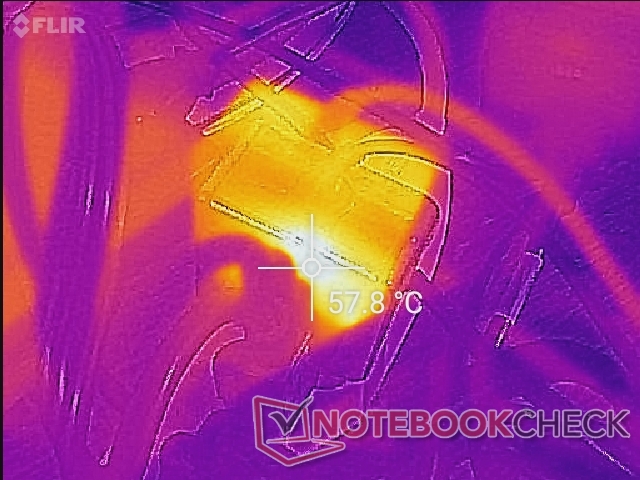
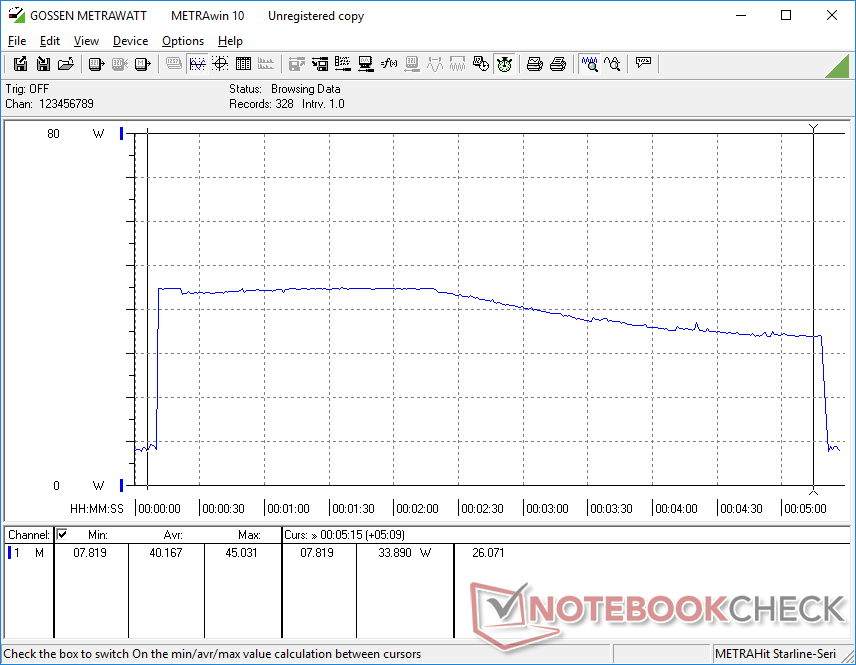
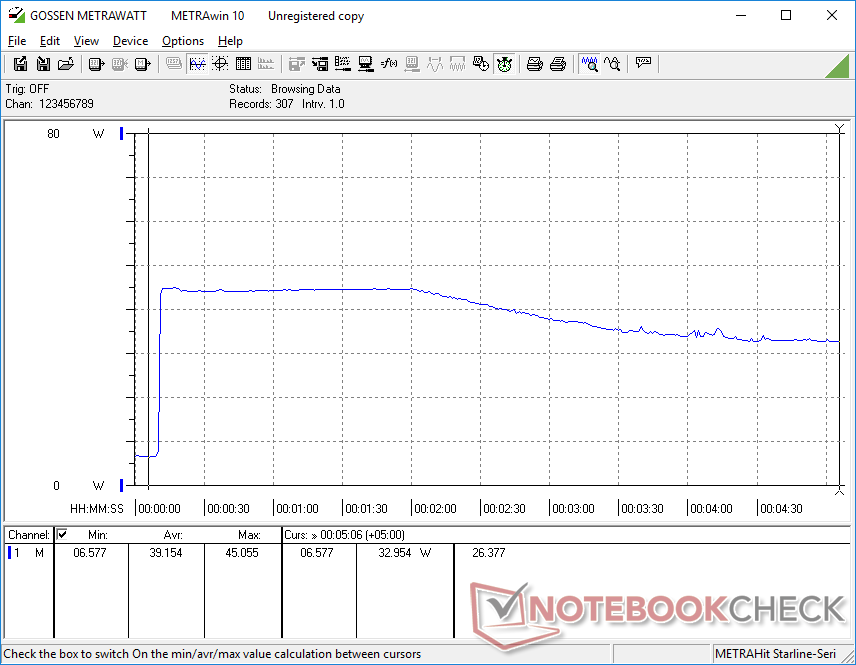
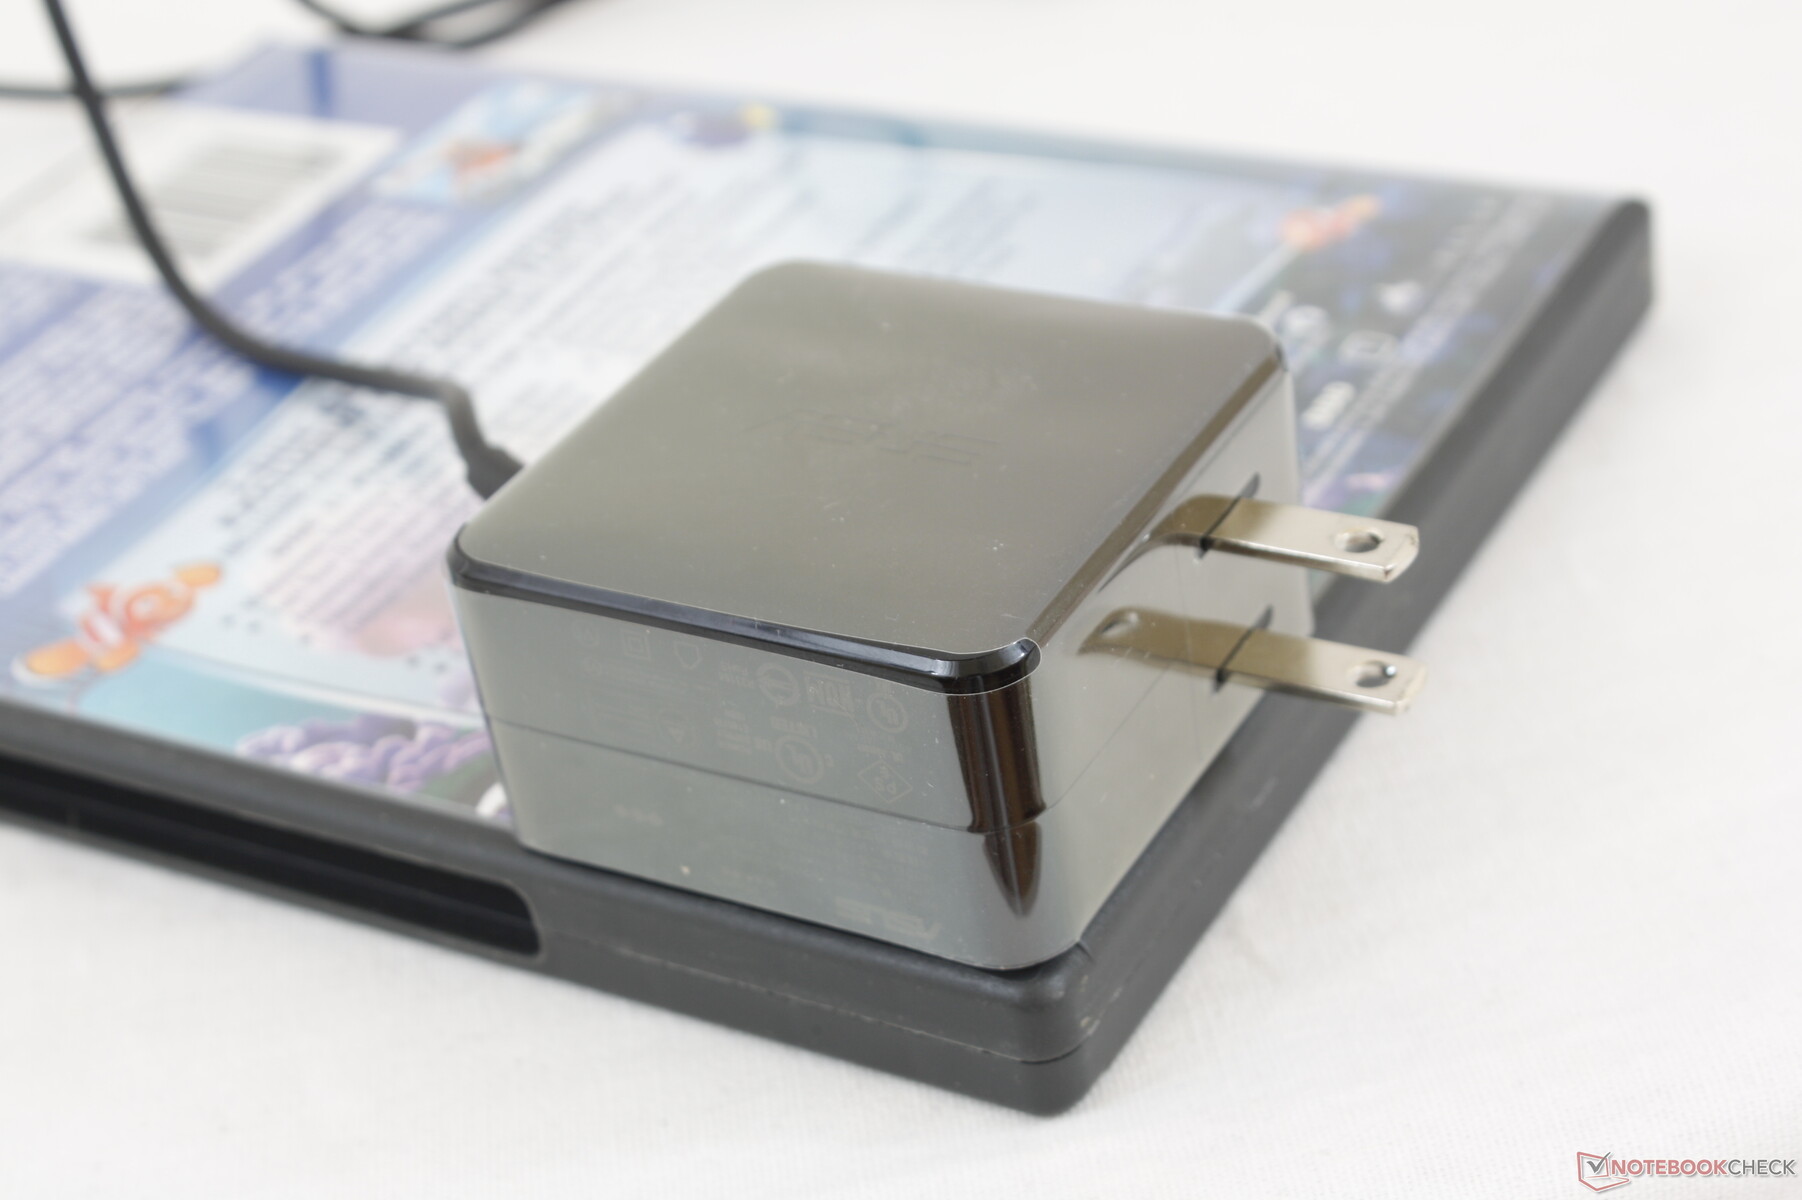
We're able to measure a temporary maximum consumption of 45 W from the small (~5.4 x 5.4 x 3 cm) 45 W AC adapter when running both Prime95 and FurMark simultaneously as shown by our graphs below. Consumption drops since maximum boost clock rates are not sustainable over long periods.
| Off / Standby | |
| Idle | |
| Load |
|
| Asus VivoBook Flip 14 TM420IA R7 4700U, Vega 7, Samsung PM991 MZVLQ512HALU, IPS, 1920x1080, 14.00 | Lenovo IdeaPad 3 14IIL05 i3-1005G1, UHD Graphics G1 (Ice Lake 32 EU), WDC PC SN520 SDAPMUW-256G, IPS, 1920x1080, 14.00 | Acer Swift 3 SF314-42-R27B R3 4300U, Vega 5, SK hynix BC511 HFM256GDJTNI-82A0, IPS, 1920x1080, 14.00 | Asus ZenBook Flip 14 UX463FA-AI039T i5-10210U, UHD Graphics 620, Kingston RBUSNS8154P3512GJ1, IPS, 1920x1080, 14.00 | Honor Magicbook 14 R5 3500U, Vega 8, Samsung SSD PM981a MZVLB256HBHQ, IPS, 1920x1080, 14.00 | Asus VivoBook S14 S433FL i7-10510U, GeForce MX250, Intel Optane Memory H10 with Solid State Storage 32GB + 512GB HBRPEKNX0202A(L/H), IPS, 1920x1080, 14.00 | |
|---|---|---|---|---|---|---|
| Power Consumption | 4% | 12% | -15% | -21% | -16% | |
| Idle Minimum * | 4 | 3.2 20% | 3.7 7% | 3.6 10% | 5.2 -30% | 2.4 40% |
| Idle Average * | 6.4 | 6.2 3% | 5.6 12% | 7.5 -17% | 7.7 -20% | 4.2 34% |
| Idle Maximum * | 7 | 7.2 -3% | 7.8 -11% | 9.4 -34% | 9.3 -33% | 7.8 -11% |
| Load Average * | 34.6 | 30 13% | 26.4 24% | 42 -21% | 40.3 -16% | 57 -65% |
| Witcher 3 ultra * | 35 | 52 -49% | ||||
| Load Maximum * | 45.1 | 50 -11% | 31.4 30% | 51 -13% | 48 -6% | 64 -42% |
* ... smaller is better
Battery Life
Runtimes are longer than expected despite the relatively small 42 Wh battery. Our system would last for 8 hours when looping web pages to be just enough for a full day of use.
Charging from empty to full capacity takes about 1.5 hours. Unfortunately, the USB-C port cannot be used to recharge the system.
| Asus VivoBook Flip 14 TM420IA R7 4700U, Vega 7, 42 Wh | Lenovo IdeaPad 3 14IIL05 i3-1005G1, UHD Graphics G1 (Ice Lake 32 EU), 35 Wh | Acer Swift 3 SF314-42-R27B R3 4300U, Vega 5, 48.85 Wh | Asus ZenBook Flip 14 UX463FA-AI039T i5-10210U, UHD Graphics 620, 50 Wh | Honor Magicbook 14 R5 3500U, Vega 8, 56 Wh | Asus VivoBook S14 S433FL i7-10510U, GeForce MX250, 50 Wh | |
|---|---|---|---|---|---|---|
| Battery Runtime | -25% | 51% | -4% | 19% | 7% | |
| WiFi v1.3 | 479 | 359 -25% | 724 51% | 461 -4% | 570 19% | 514 7% |
| Load | 100 |
Pros
Cons
Verdict
The AMD-powered 2020 VivoBook Flip couldn't have launched at a better time. Intel's 10th gen Ice Lake and Comet Lake-U platforms have already grown stale against the Zen 2 series in terms of raw performance and the generally lower starting prices of AMD laptops make Core i7 alternatives even less attractive at the moment. Intel is set to regain some lost momentum later this year when Tiger Lake becomes available, but AMD laptops like the our VivoBook will have free reign until then.
As for the laptop itself, users won't be sacrificing performance at all despite the affordable price point. Instead, the hardware will lack a few luxurious features like Thunderbolt 3, USB-C charging, Wi-Fi 6, and an IR camera. It's biggest cut corner is to the display and its narrow gamut which pales in comparison to the ZenBook series. Otherwise, this is a fast and well-built budget laptop fit for students, home multimedia use, and the occasional travel.
An inexpensive convertible that can perform faster than most others in its size category costing hundreds more. It's above average on almost all fronts save for the mediocre display.
Asus VivoBook Flip 14 TM420IA
-
08/20/2020 v7
Allen Ngo
More articles related to this device
Asus VivoBook Flip 14 TM420IA (VivoBook Flip 14 Series)Related Articles


Pricecompare
