 Deutsch
 English
 Español
 Français
 Italiano
 Nederlands
 Polski
 Português
 Русский
 Türkçe
 Svenska
 Chinese
 Magyar
Asus TUF A17 FA706IU Ryzen 7 Laptop Review: Core i9 Performance for $1100 USD
Unveiled at CES 2020, the 15.6-inch Asus TUF A15 FA506 and 17.3-inch TUF A17 FA706 series replace the older TUF FX505 and TUF FX705 series, respectively. These latest models are completely new in design and hardware when compared to the previous generation. The manufacturer is promising MIL-STD-810H chassis certification, FreeSync display options, more ports, and of course, the all-important AMD Ryzen Renoir processor.
Despite the new look and features, however, the TUF series is still aimed at budget-mainstream gamers in contrast to the flagship Zephyrus series. Users can choose between the Ryzen 5 4600H or Ryzen 7 4800H with GTX 1650 ot GTX 1660 Ti graphics whereas Zephyrus laptops may have Ryzen 9 and GeForce RTX options. Resolution options are fixed at 1080p at up to 120 Hz. Interestingly, the smaller 15.6-inch FA506 version comes with faster RTX 2060 graphics whereas the 17.3-inch FA706 does not at the moment.
The TUF A17 FA706IU SKU today retails for approximately $1100 USD to compete against other budget to mid-range gaming laptops like the HP Pavilion Gaming 17, Lenovo Legion Y540-17, MSI GP75, Acer Nitro series, or the Dell G7 series.
More Asus reviews:
Rating | Date | Model | Weight | Height | Size | Resolution | Best Price |
|---|---|---|---|---|---|---|---|
| 82.9 % | 05/2020 | Asus TUF A17 FA706IU-AS76 R7 4800H, GeForce GTX 1660 Ti Mobile | 2.6 kg | 26 mm | 17.30" | 1920x1080 | |
| 85.1 % | 06/2019 | MSI GP75 Leopard 9SD i7-9750H, GeForce GTX 1660 Ti Mobile | 2.6 kg | 29 mm | 17.30" | 1920x1080 | |
| 85.3 % | 06/2019 | Dell G7 17 7790 i7-8750H, GeForce RTX 2070 Max-Q | 3.2 kg | 25 mm | 17.30" | 1920x1080 | |
| 81.6 % | 07/2019 | HP Pavilion Gaming 17-cd0085cl i7-9750H, GeForce GTX 1660 Ti Max-Q | 2.8 kg | 25 mm | 17.30" | 1920x1080 | |
| 82.3 % | 07/2019 | Lenovo Legion Y540-17IRH i5-9300H, GeForce GTX 1660 Ti Mobile | 2.8 kg | 26.3 mm | 17.30" | 1920x1080 | |
| 77.8 % | 06/2019 | Asus TUF FX705DT-AU068T R5 3550H, GeForce GTX 1650 Mobile | 2.7 kg | 26.6 mm | 17.30" | 1920x1080 |
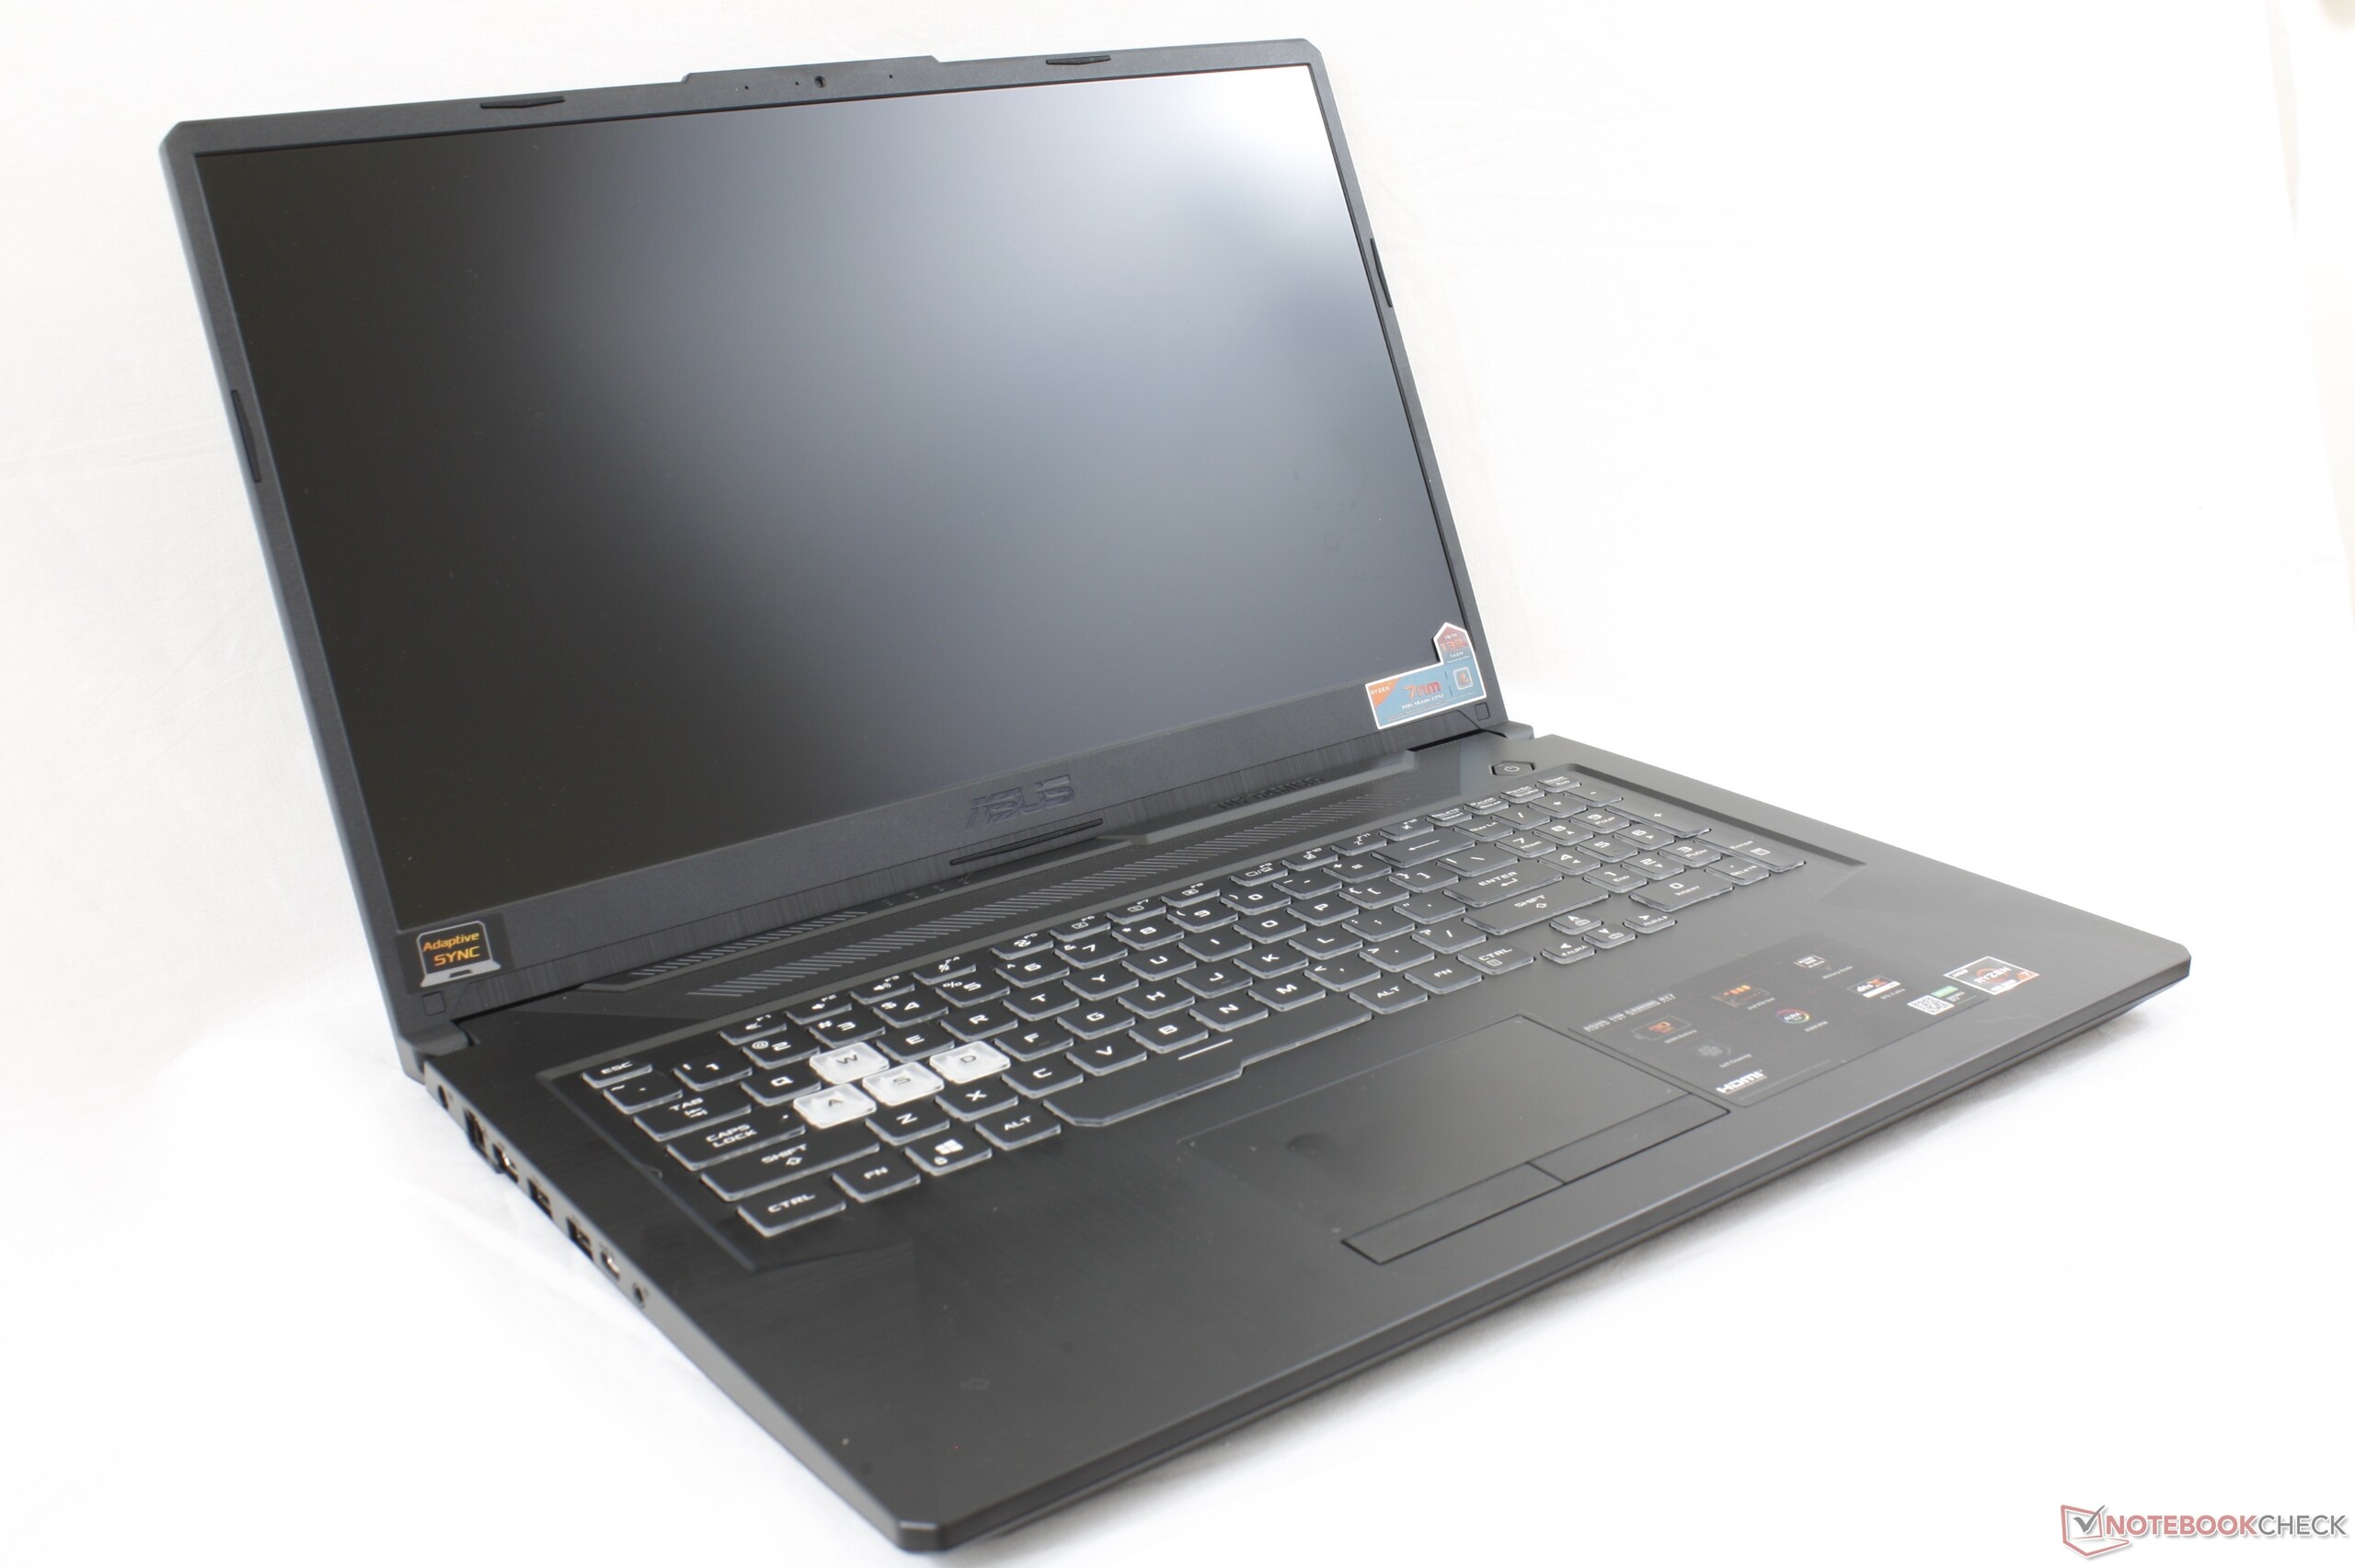
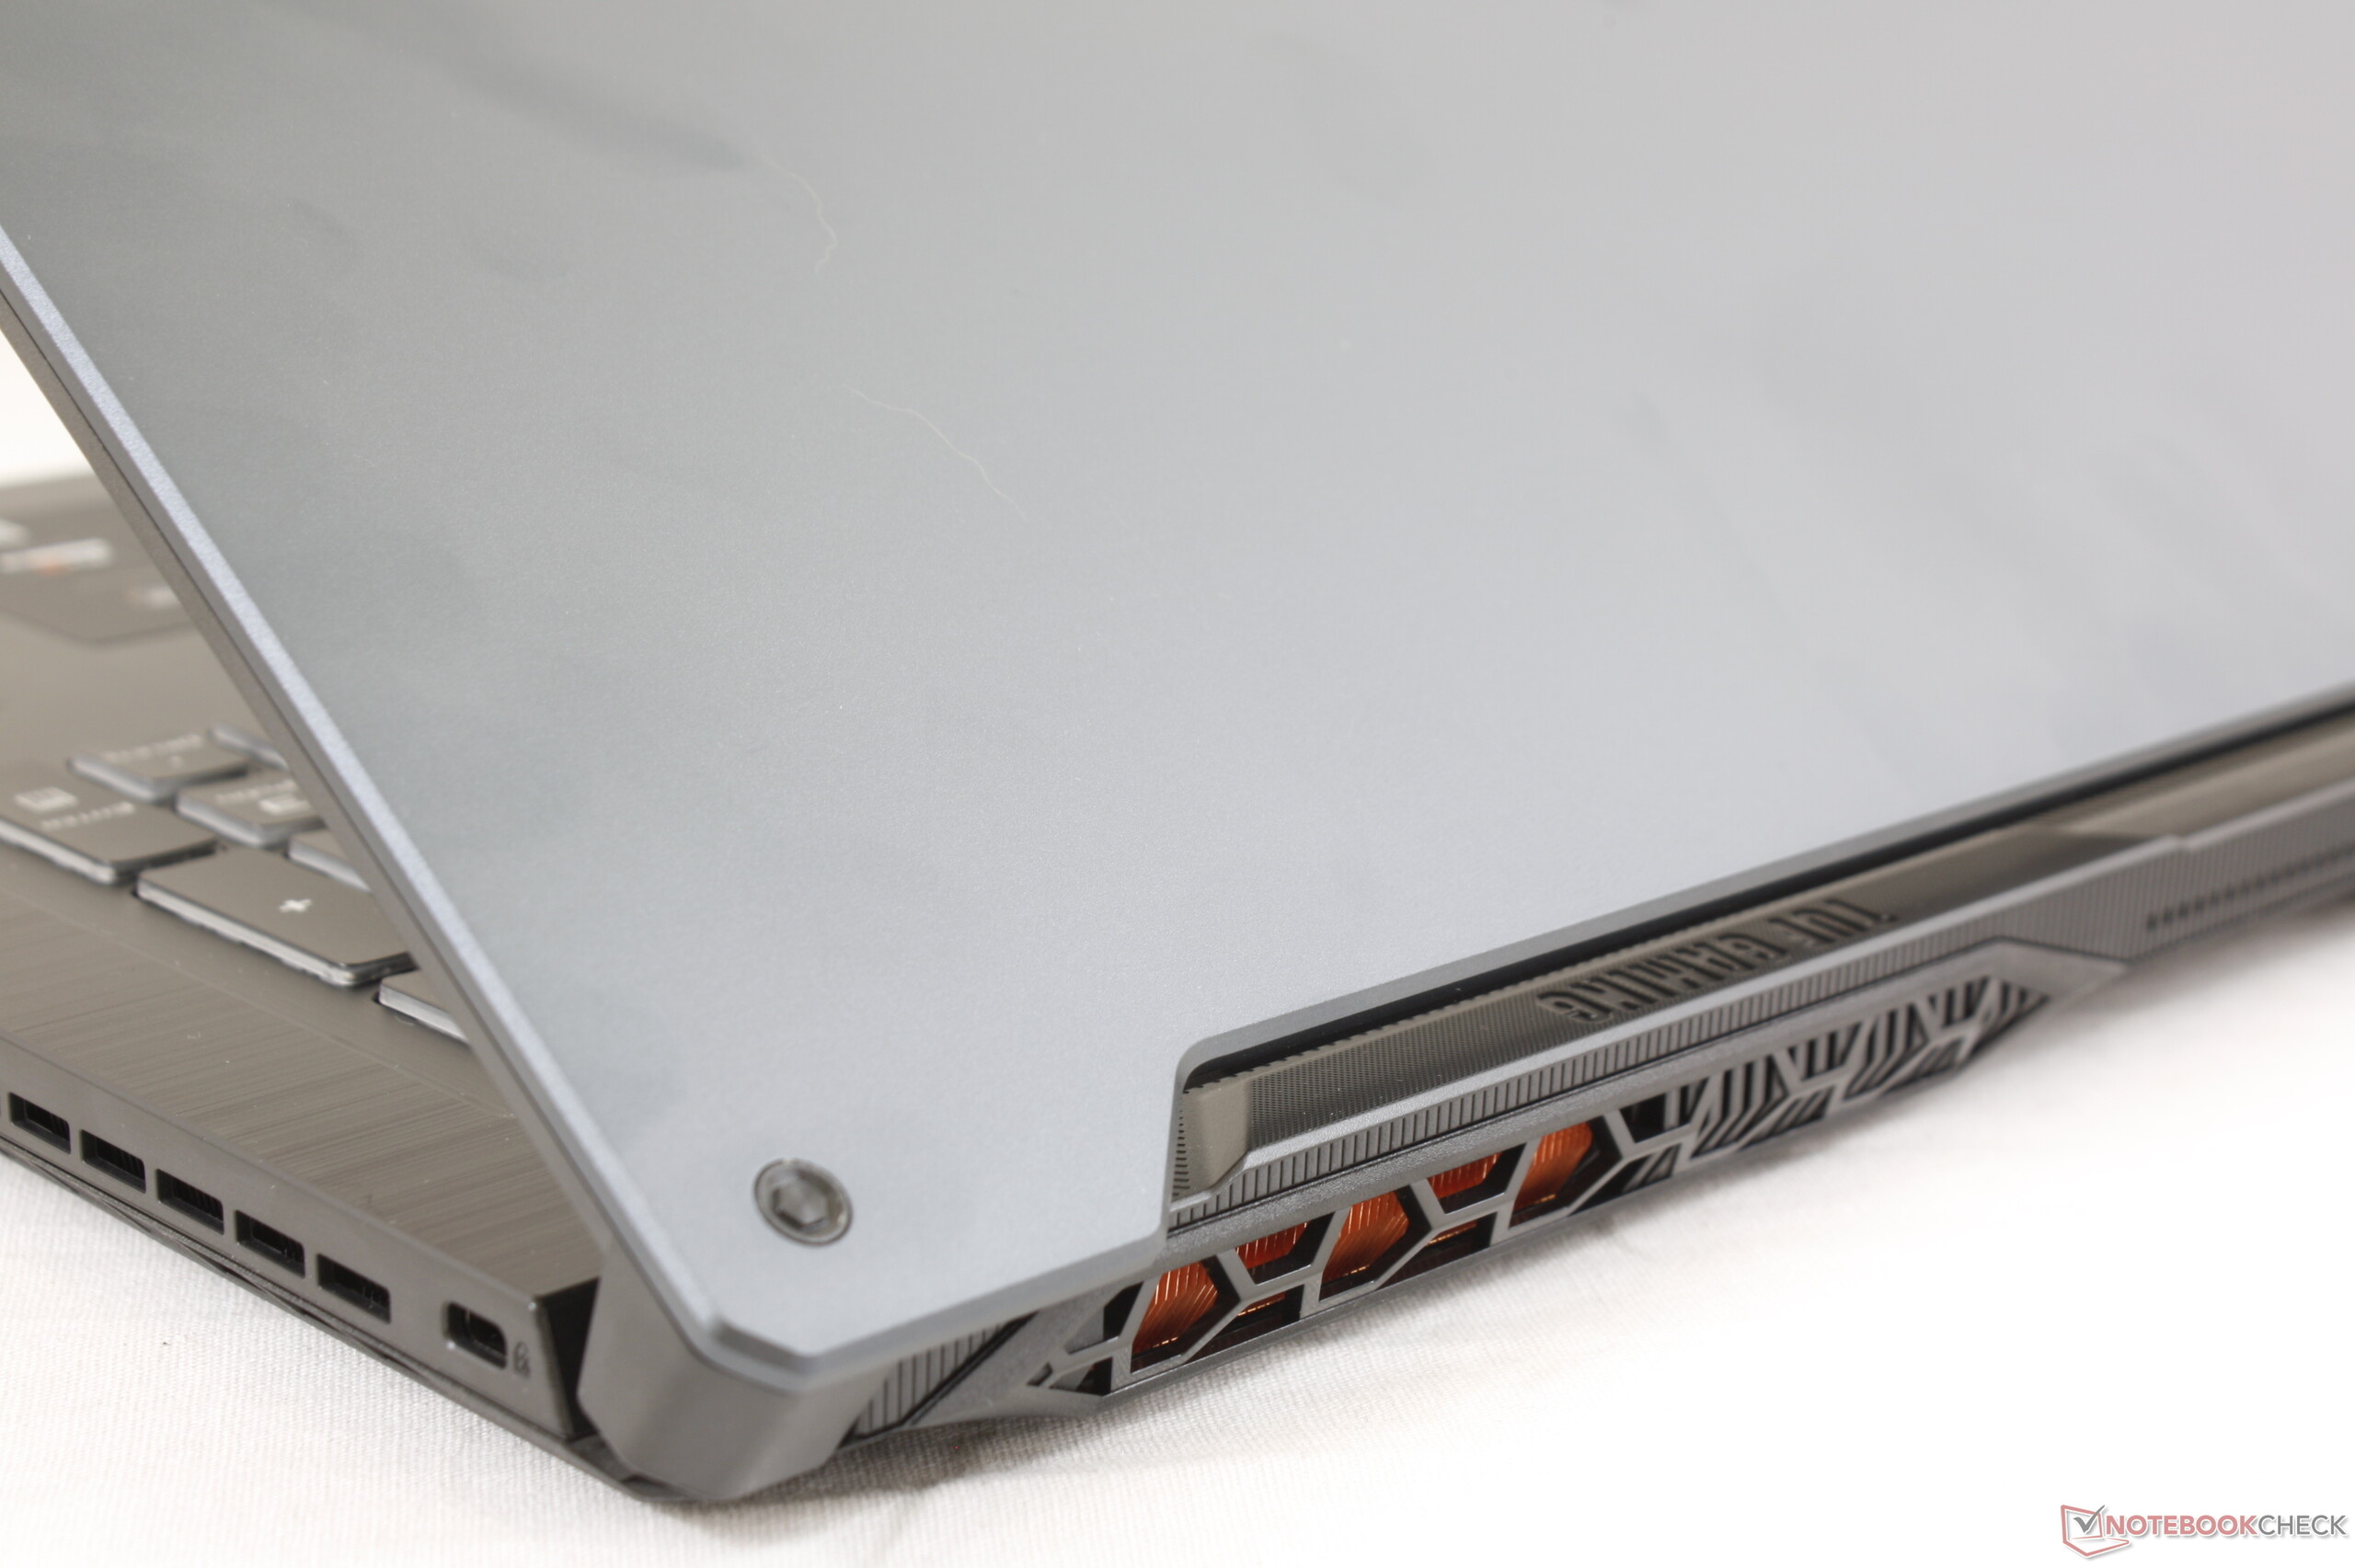
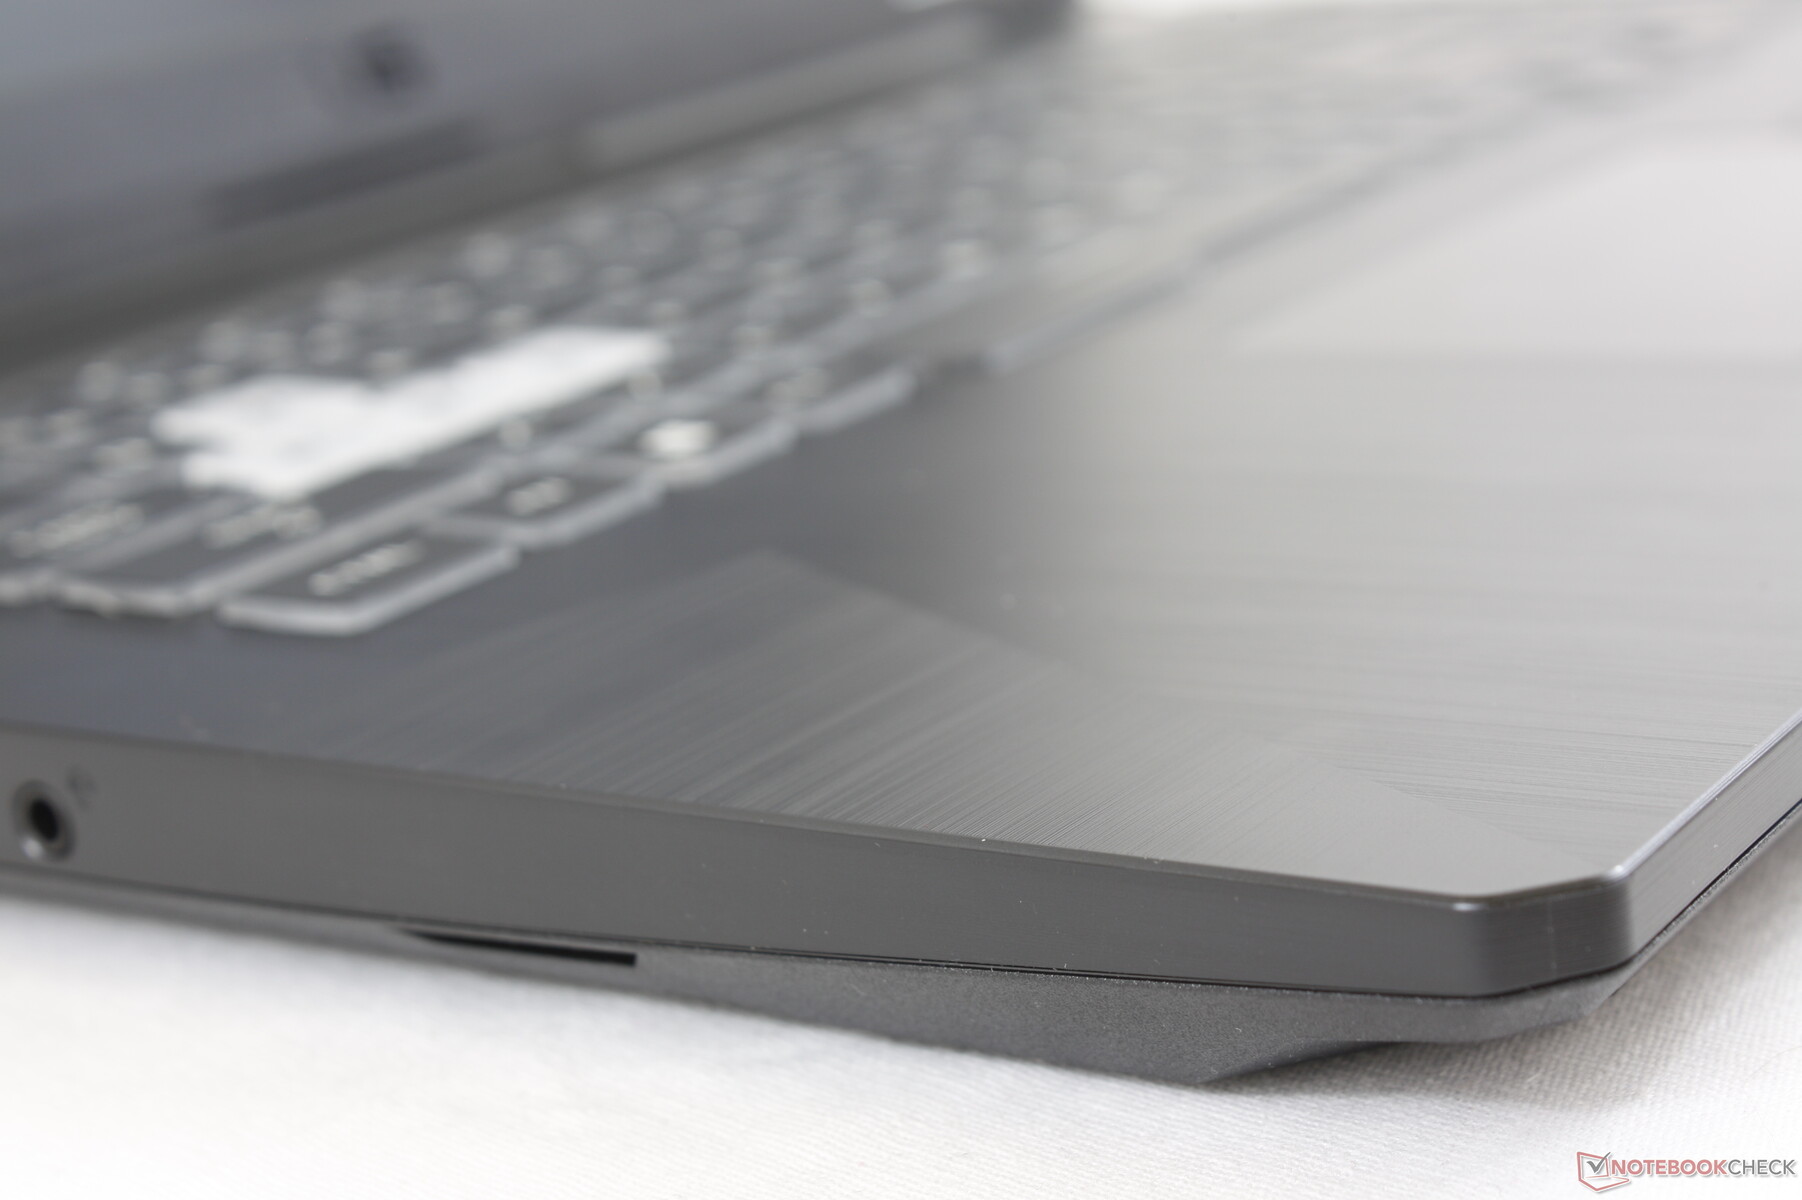
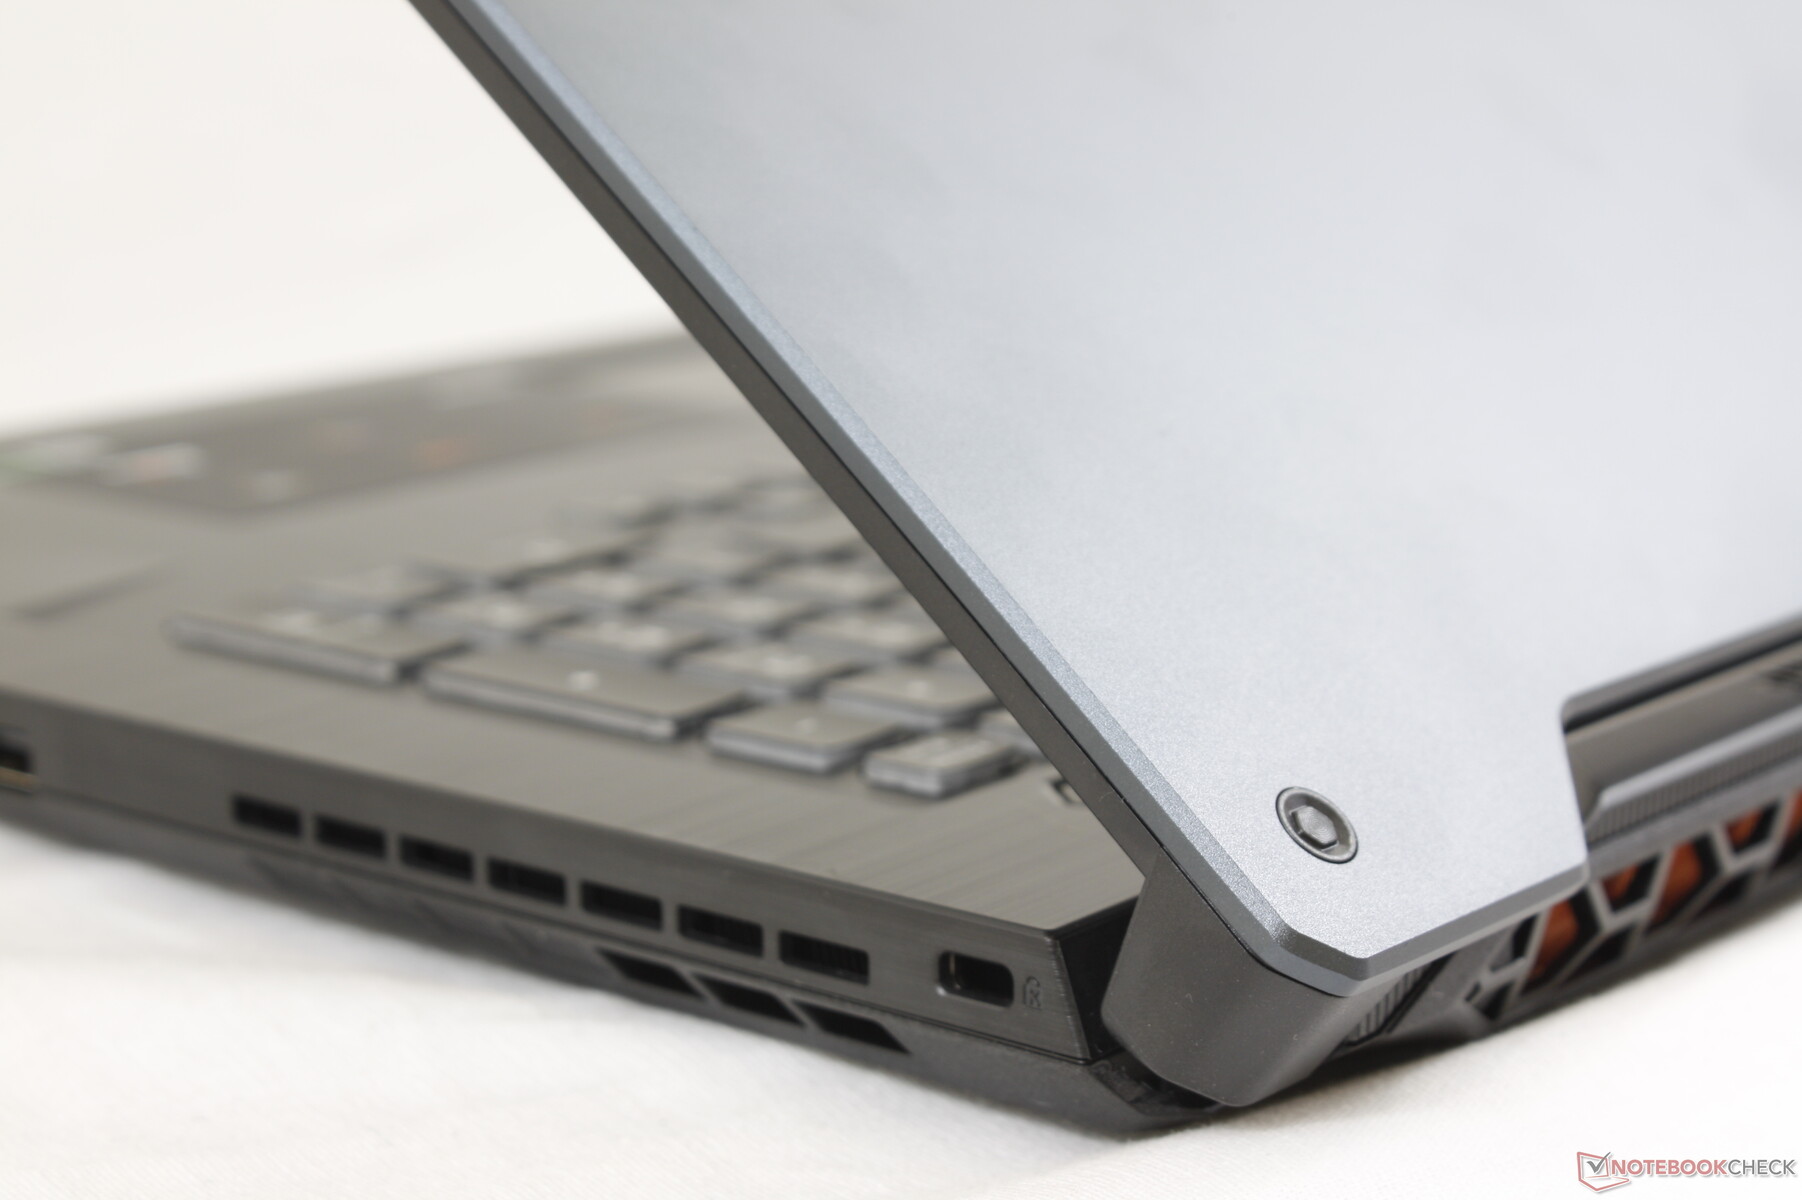
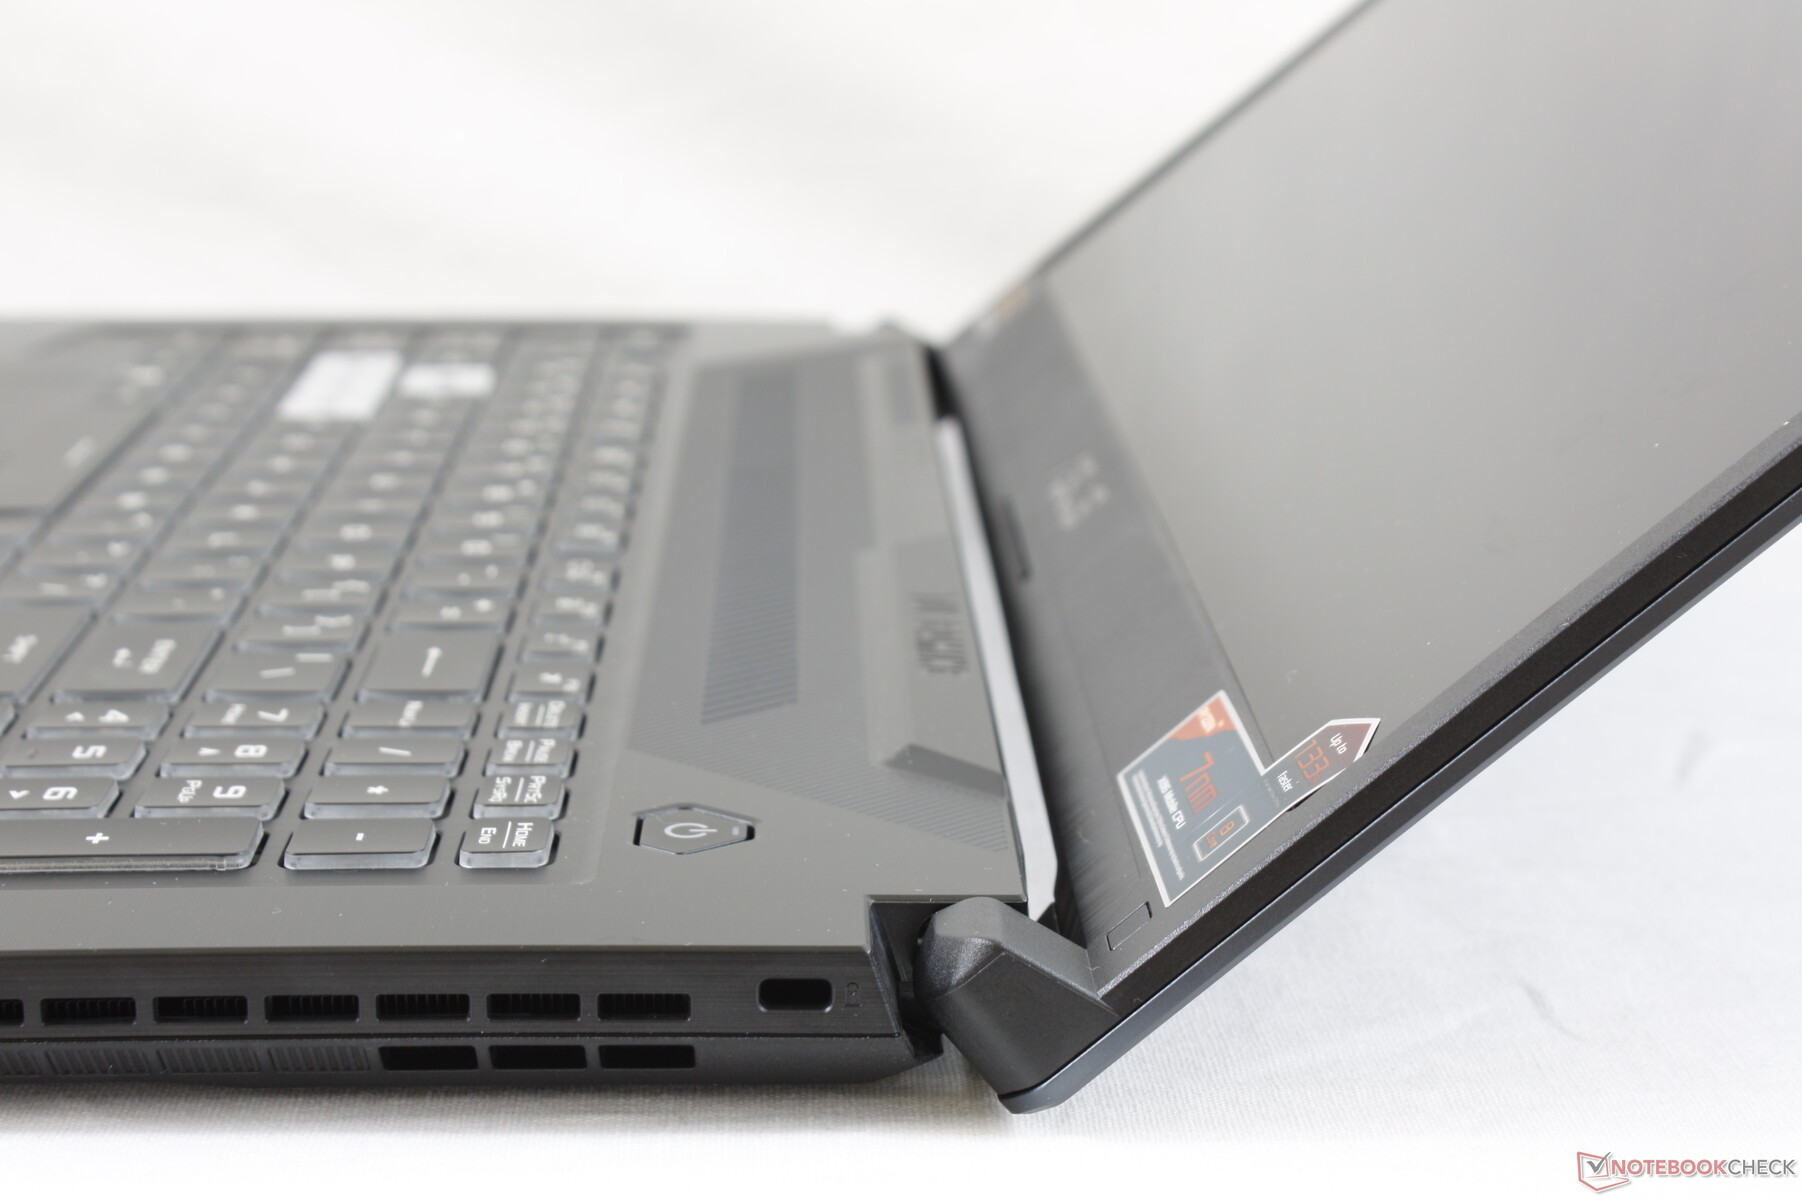
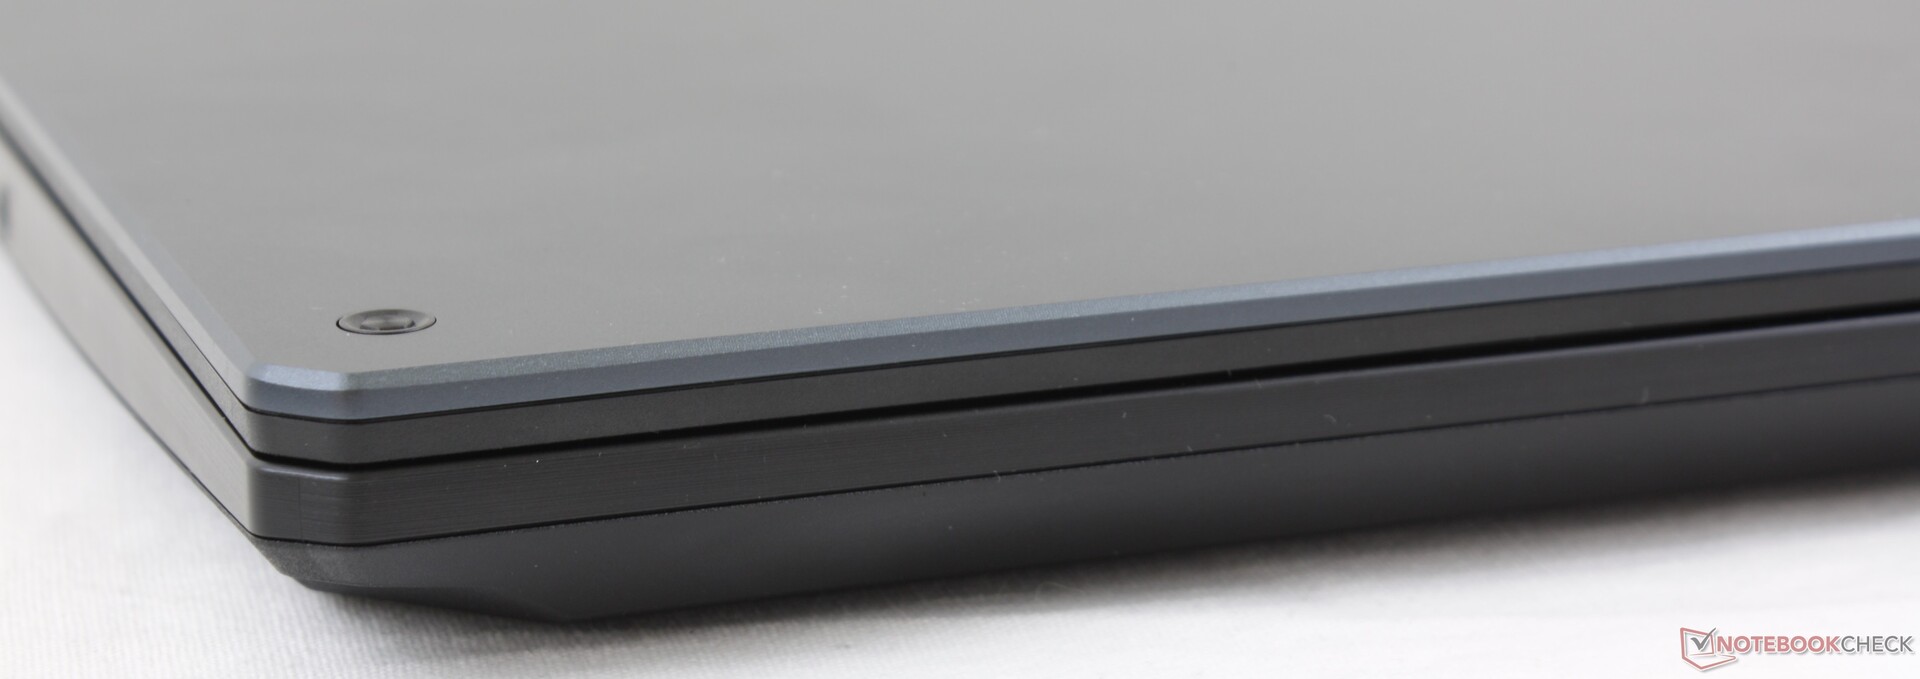
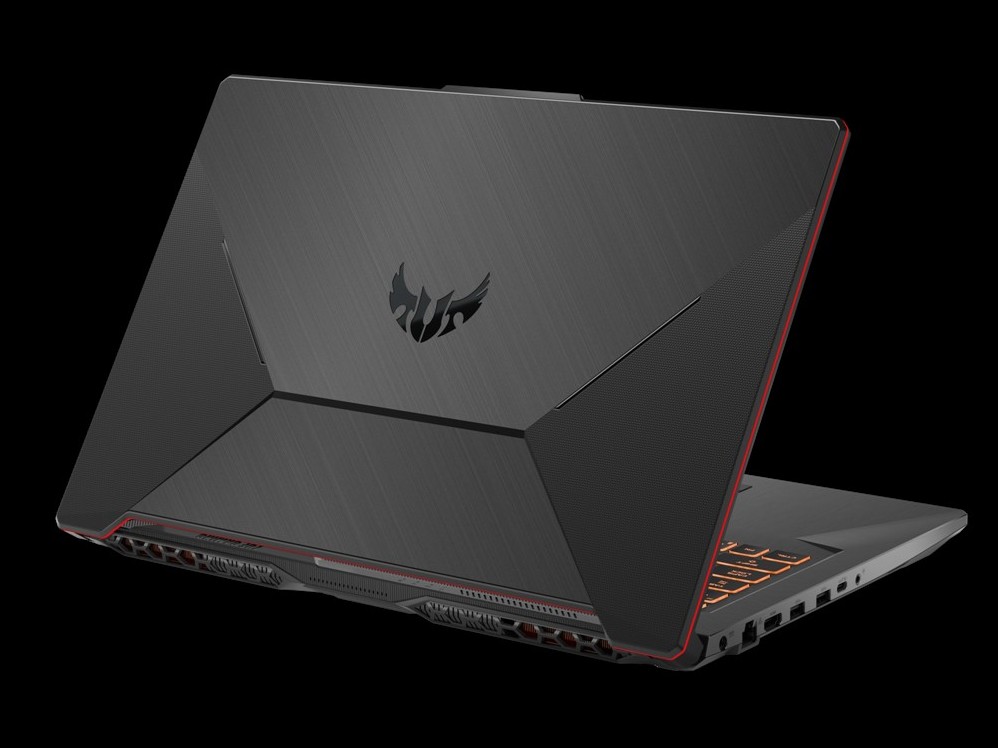
Case — More Metal
Asus has improved the chassis greatly especially in regards to the lid. Whereas the lid on the older FX705 was mostly plastic and prone to flexing, the lid on the FA706 is reinforced with a thick metal plate. Creaking, twisting, and warping are minimal when compared to other budget laptops like the Lenovo Legion Y540, MSI GP75, or HP Pavilion Gaming 17. We would love to see this kind of metal reinforcement on the lids of Zephyrus laptops, too.
The weakest area of the chassis is the center of the keyboard. Applying pressure on this region will visibly warp the surface more than we would like. The tougher and heavier ROG G703 series do not exhibit this issue.
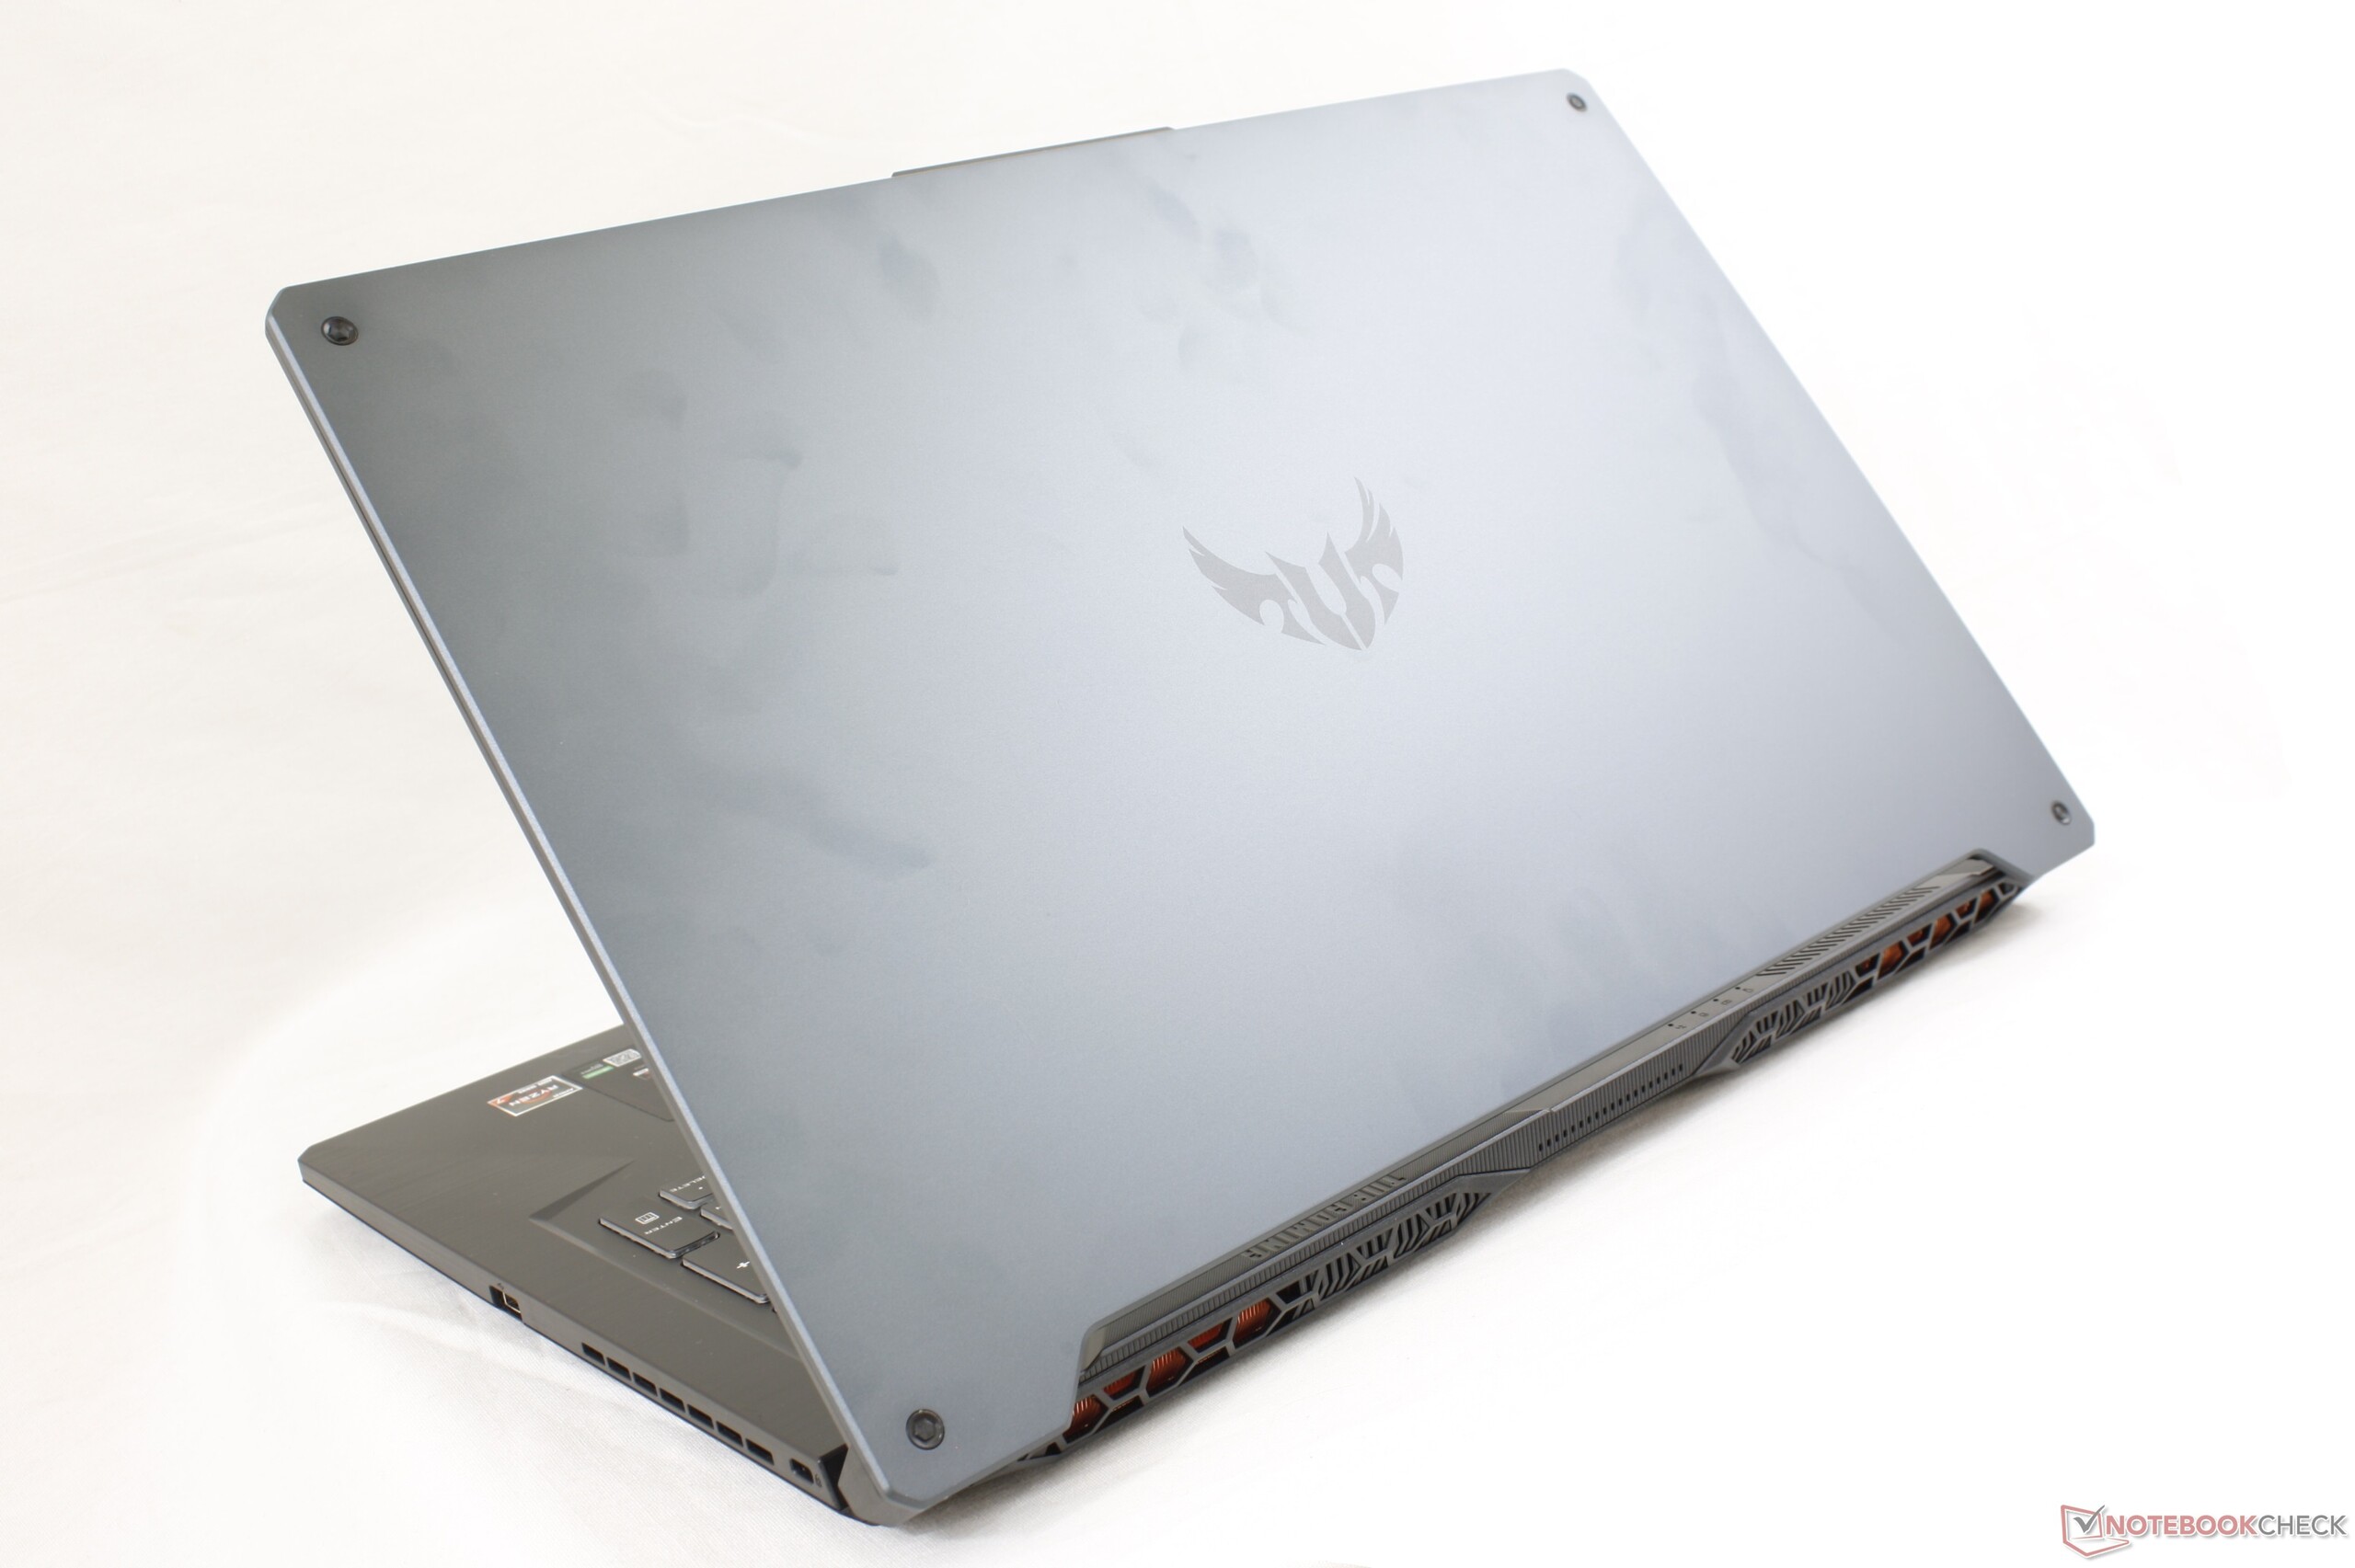
The new chassis is slightly thinner, lighter, and smaller than the last generation FX705. The minor size reduction is enough to make the FA706 one of the smaller and lighter 17.3-inch gaming laptops in its budget category.
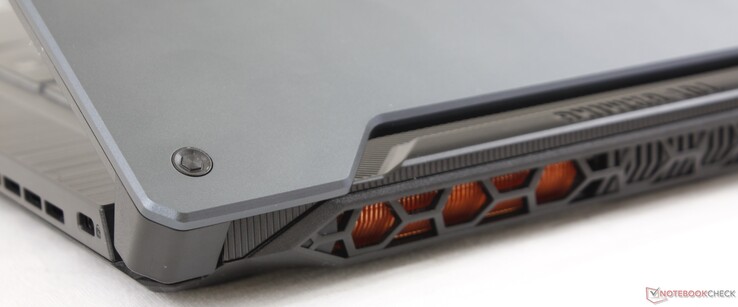
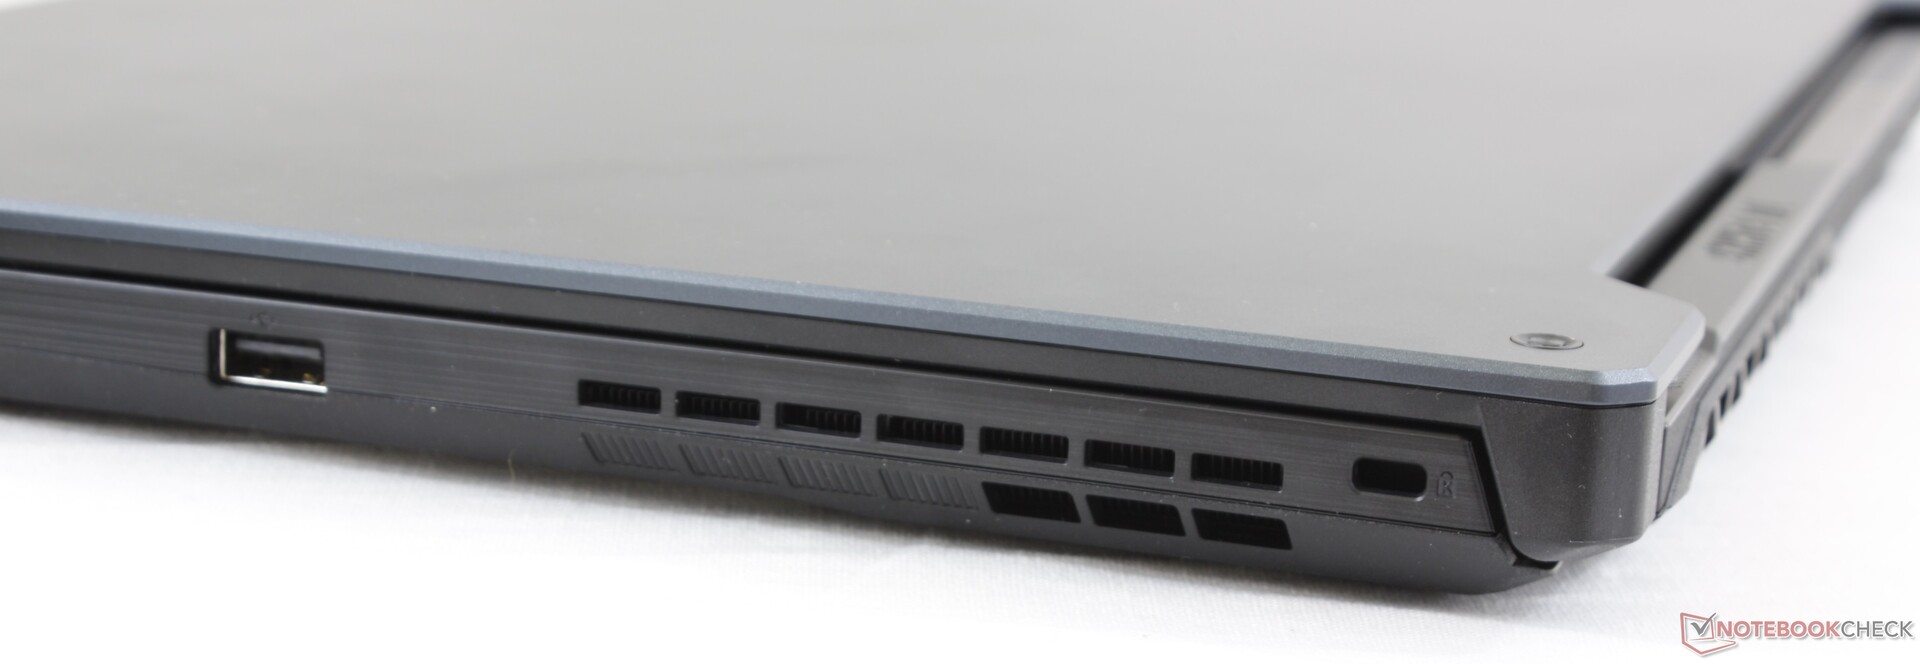
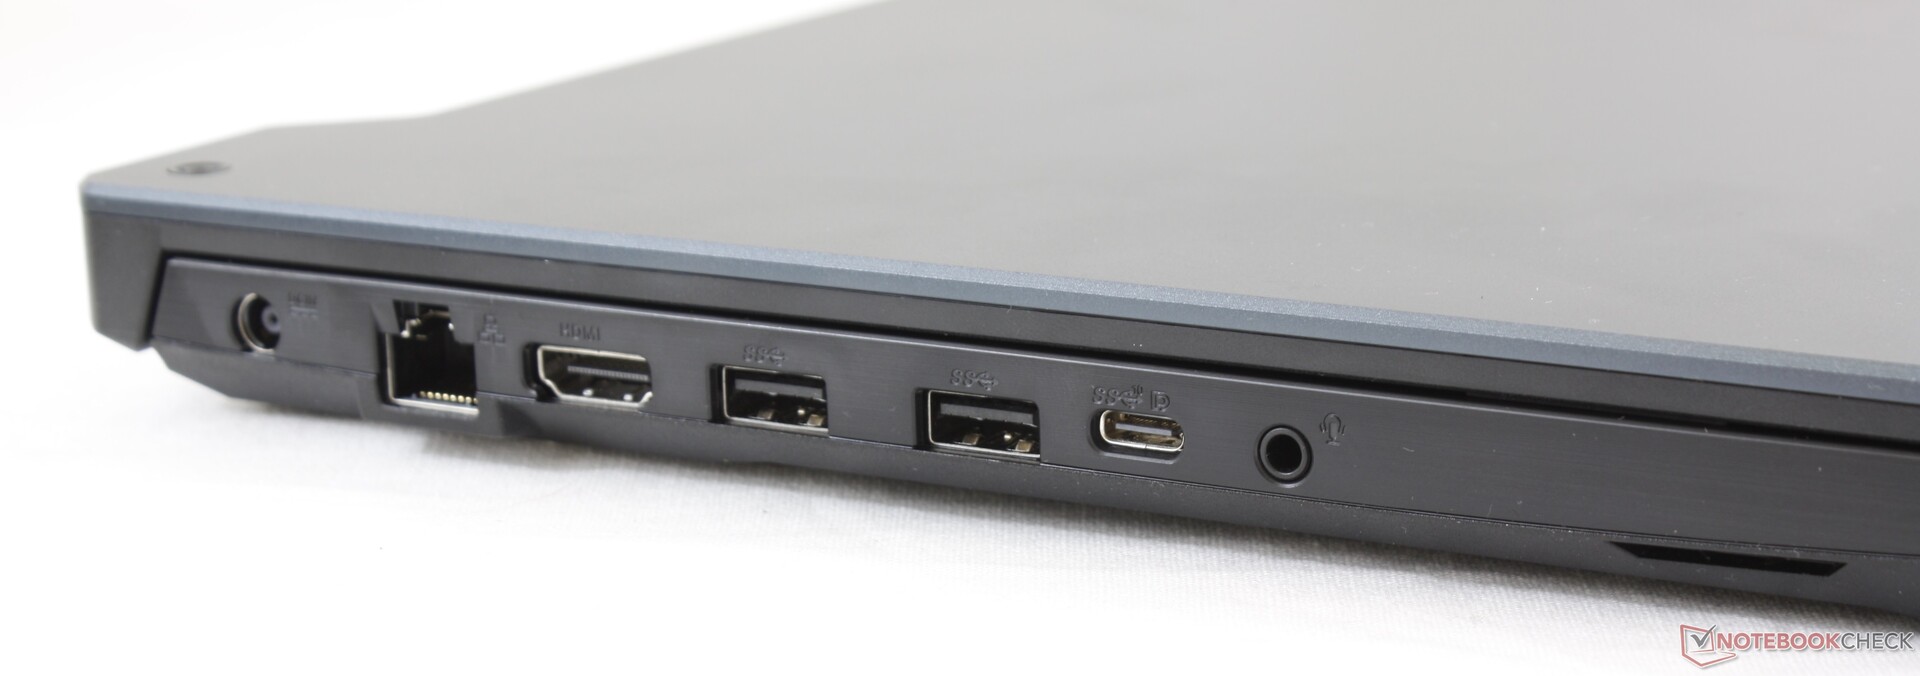
Connectivity — USB Type-C Now Standard
Port options include everything on last year's FX705 but with a couple of changes: the USB 2.0 port has been moved from the left edge to the right edge and there is now a USB Type-C port. Most of the ports are still along the left edge so expect this side of the laptop to be crowded with cables. Unsurprisingly, Thunderbolt 3 is not supported here.
It would have been great to see support for Asus Keystone to further expand the versatility of Asus' proprietary customization tool, but the feature remains exclusive to select ROG laptops only.
Communication
WLAN is limited to Wi-Fi 5 speeds whereas most newer Ultrabooks and higher-end laptops come standard with Wi-Fi 6. We experienced no issues when connected to our Netgear RAX200 test router.
| Networking | |
| iperf3 transmit AX12 | |
| Asus Zephyrus G14 GA401IV | |
| SCHENKER XMG Apex 15 NH57AF1 | |
| MSI GS66 10SGS | |
| Asus TUF A17 FA706IU-AS76 | |
| iperf3 receive AX12 | |
| MSI GS66 10SGS | |
| SCHENKER XMG Apex 15 NH57AF1 | |
| Asus Zephyrus G14 GA401IV | |
| Asus TUF A17 FA706IU-AS76 | |
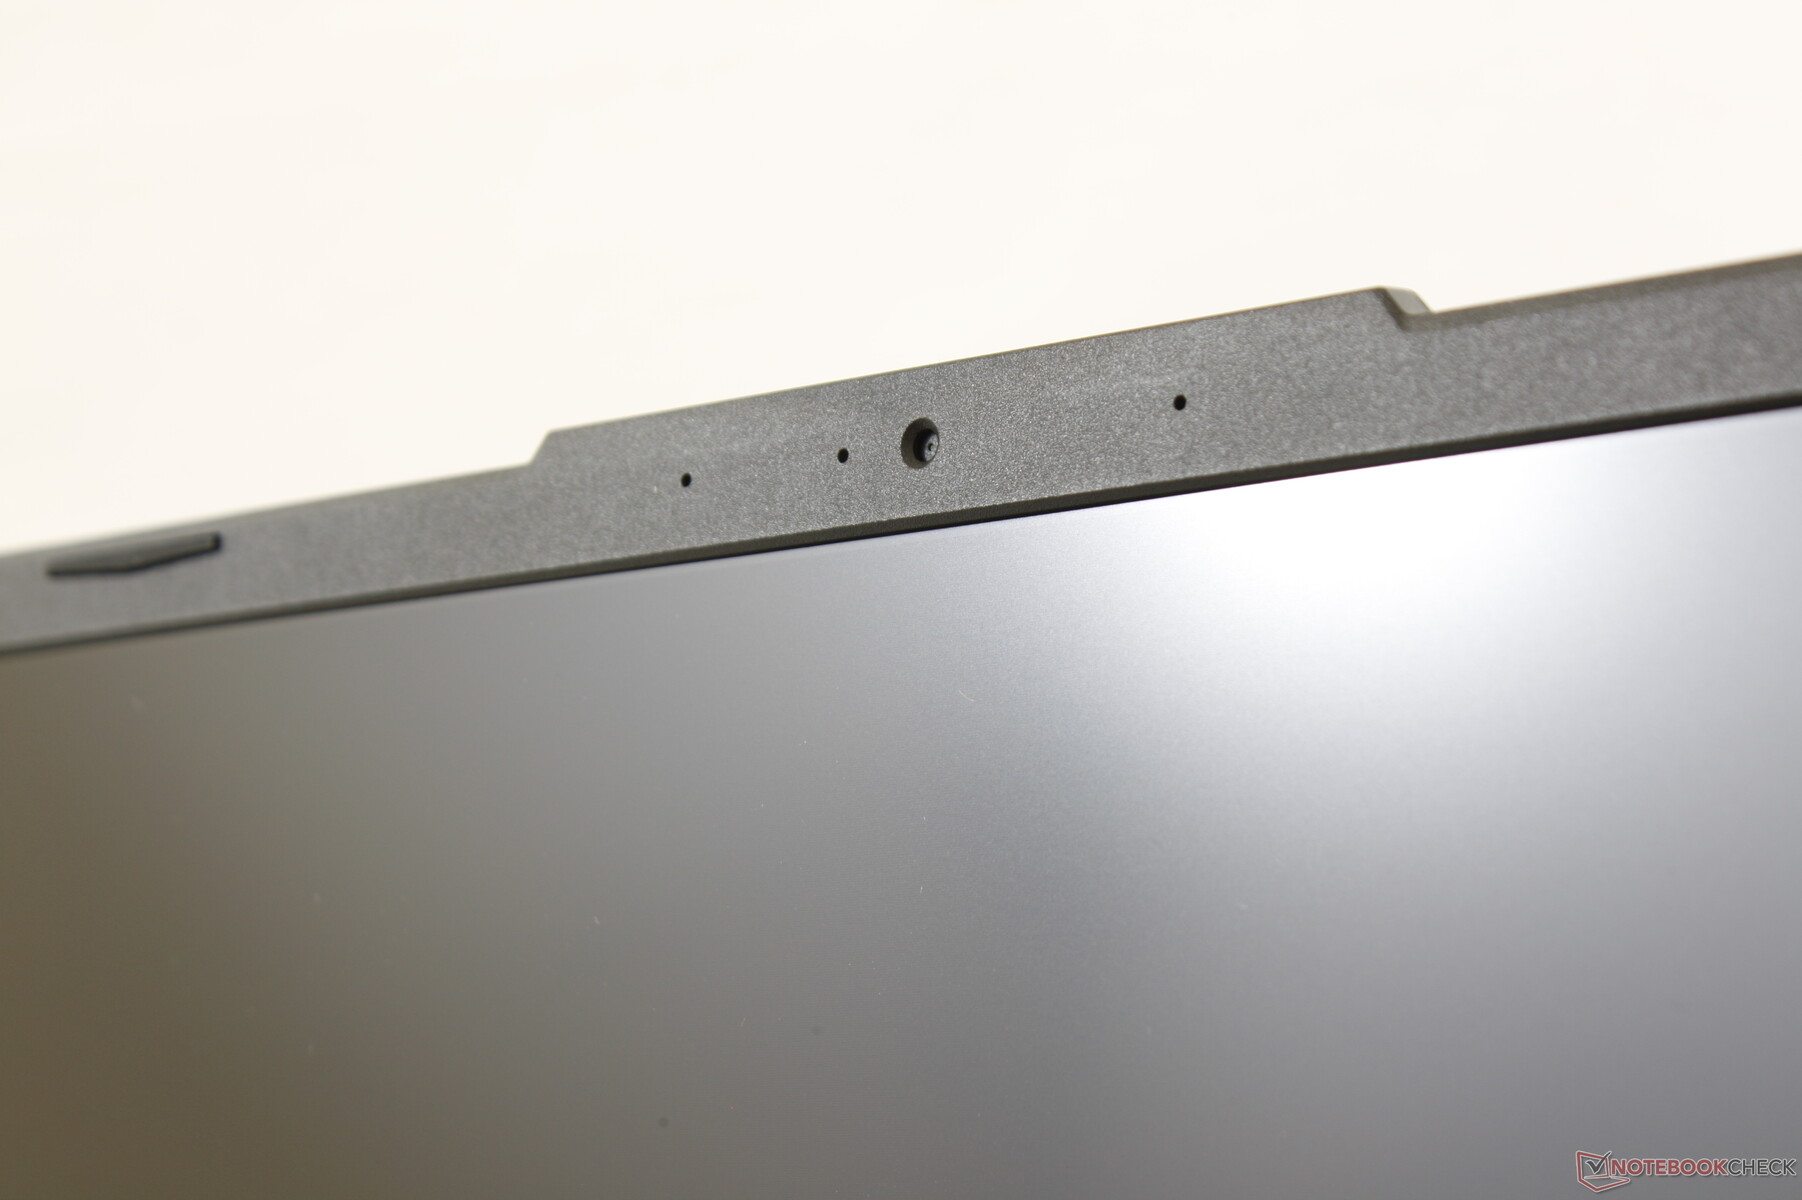
Webcam


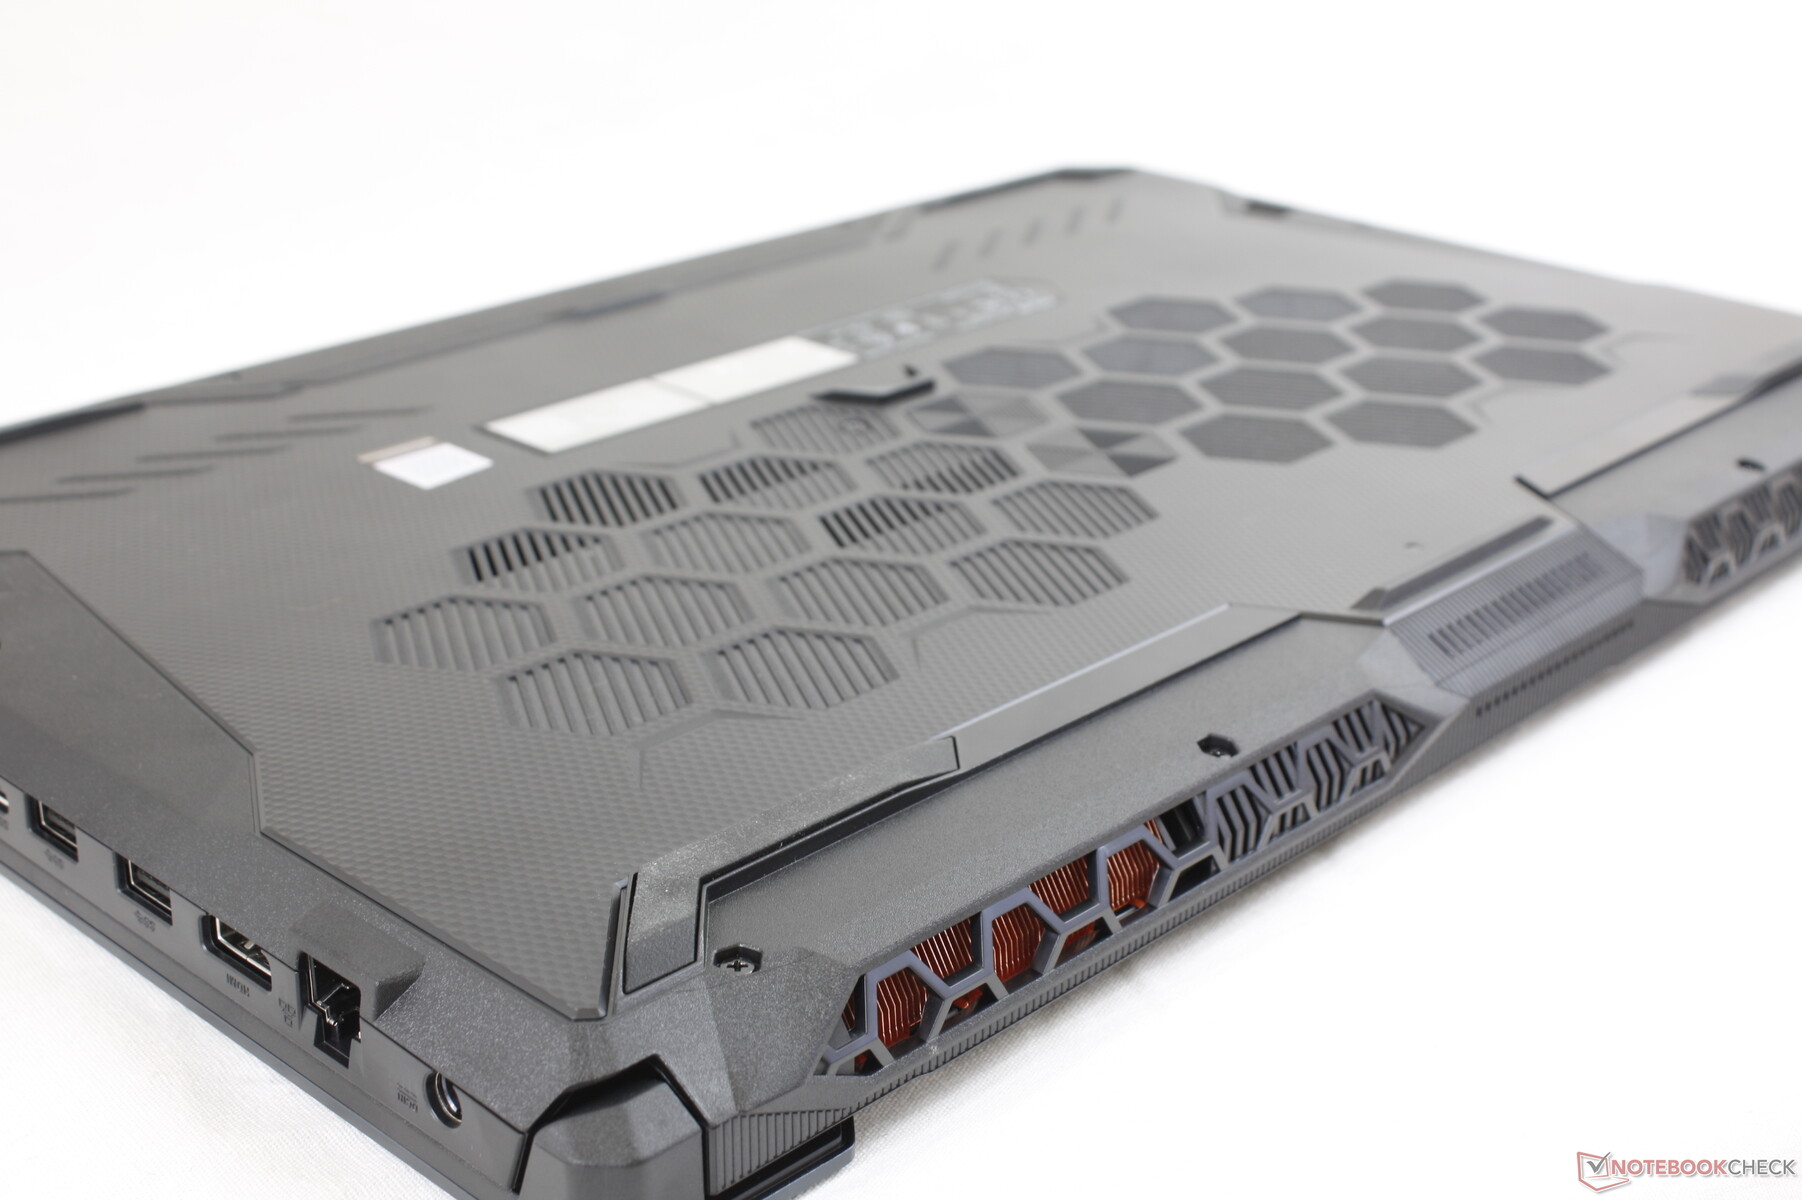
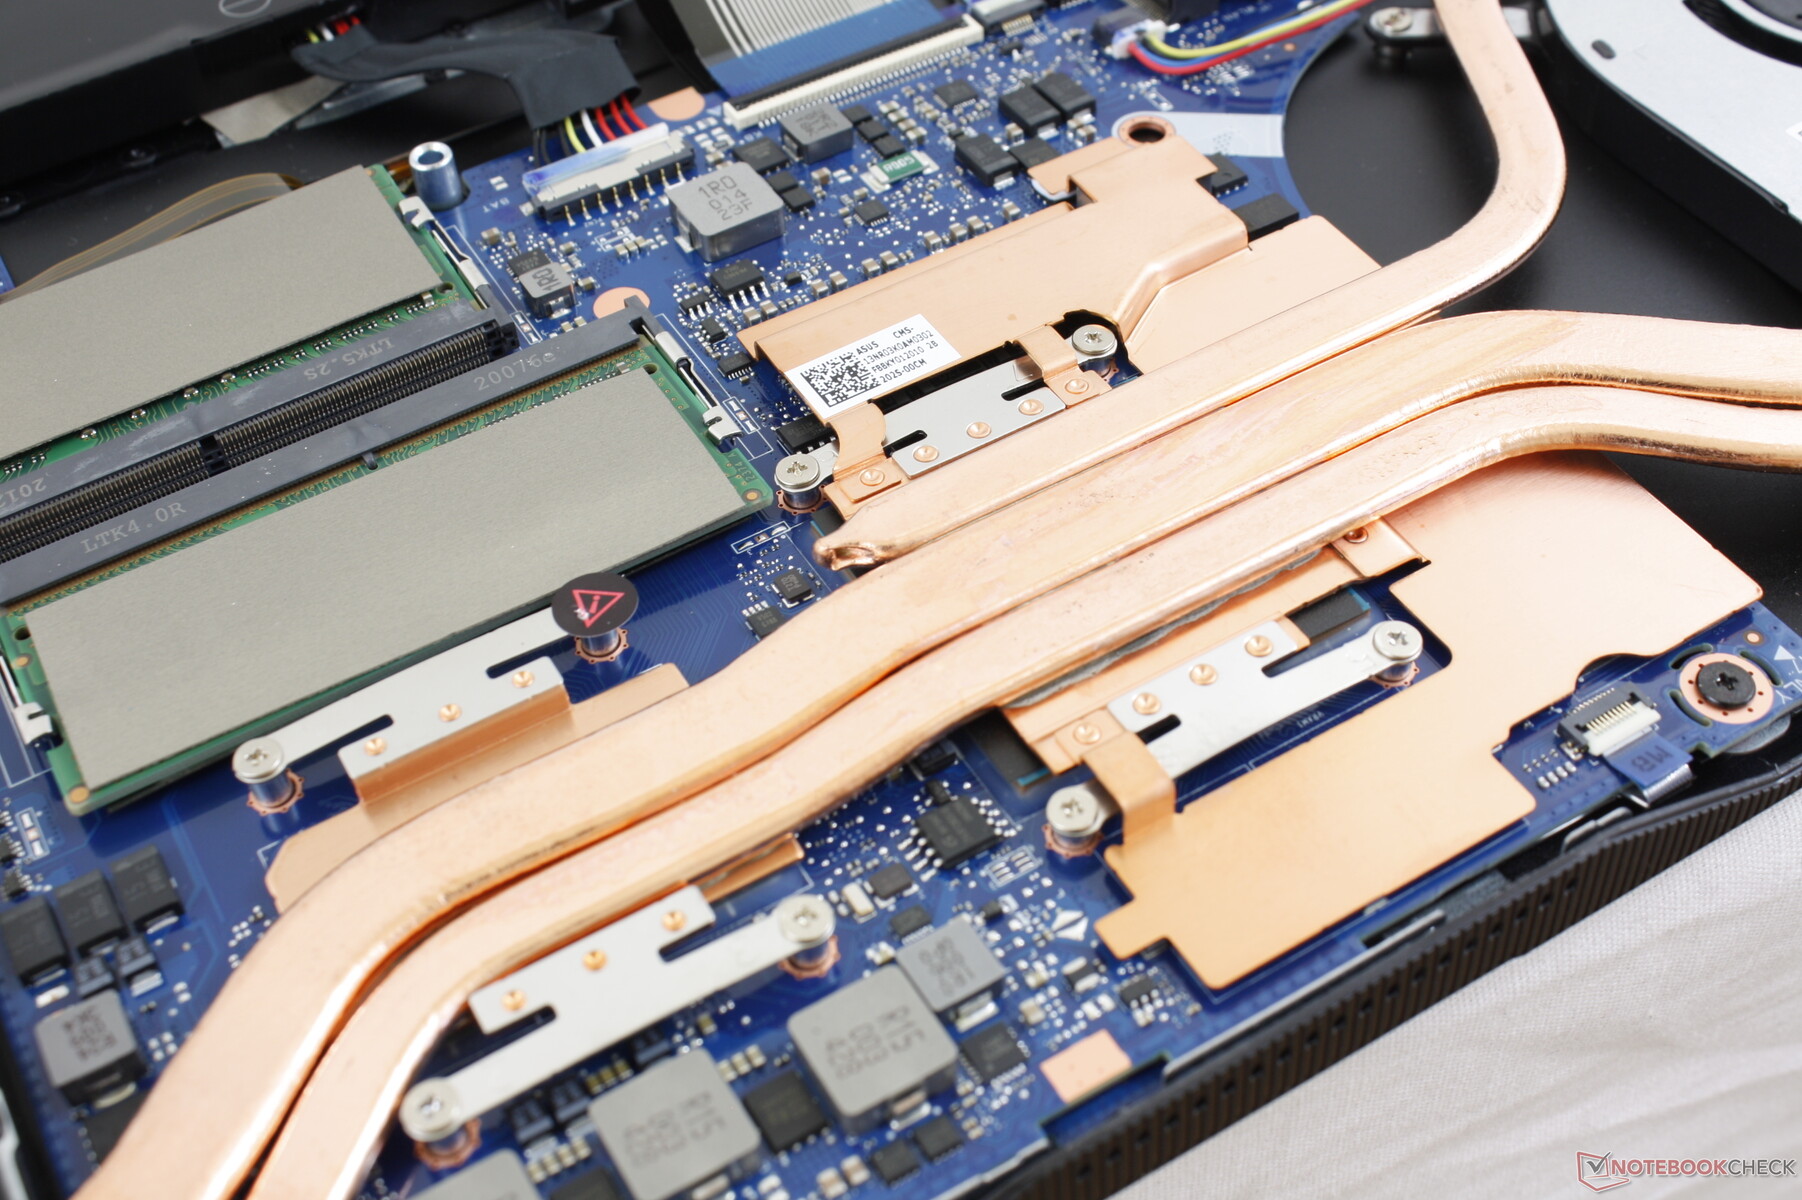
Maintenance
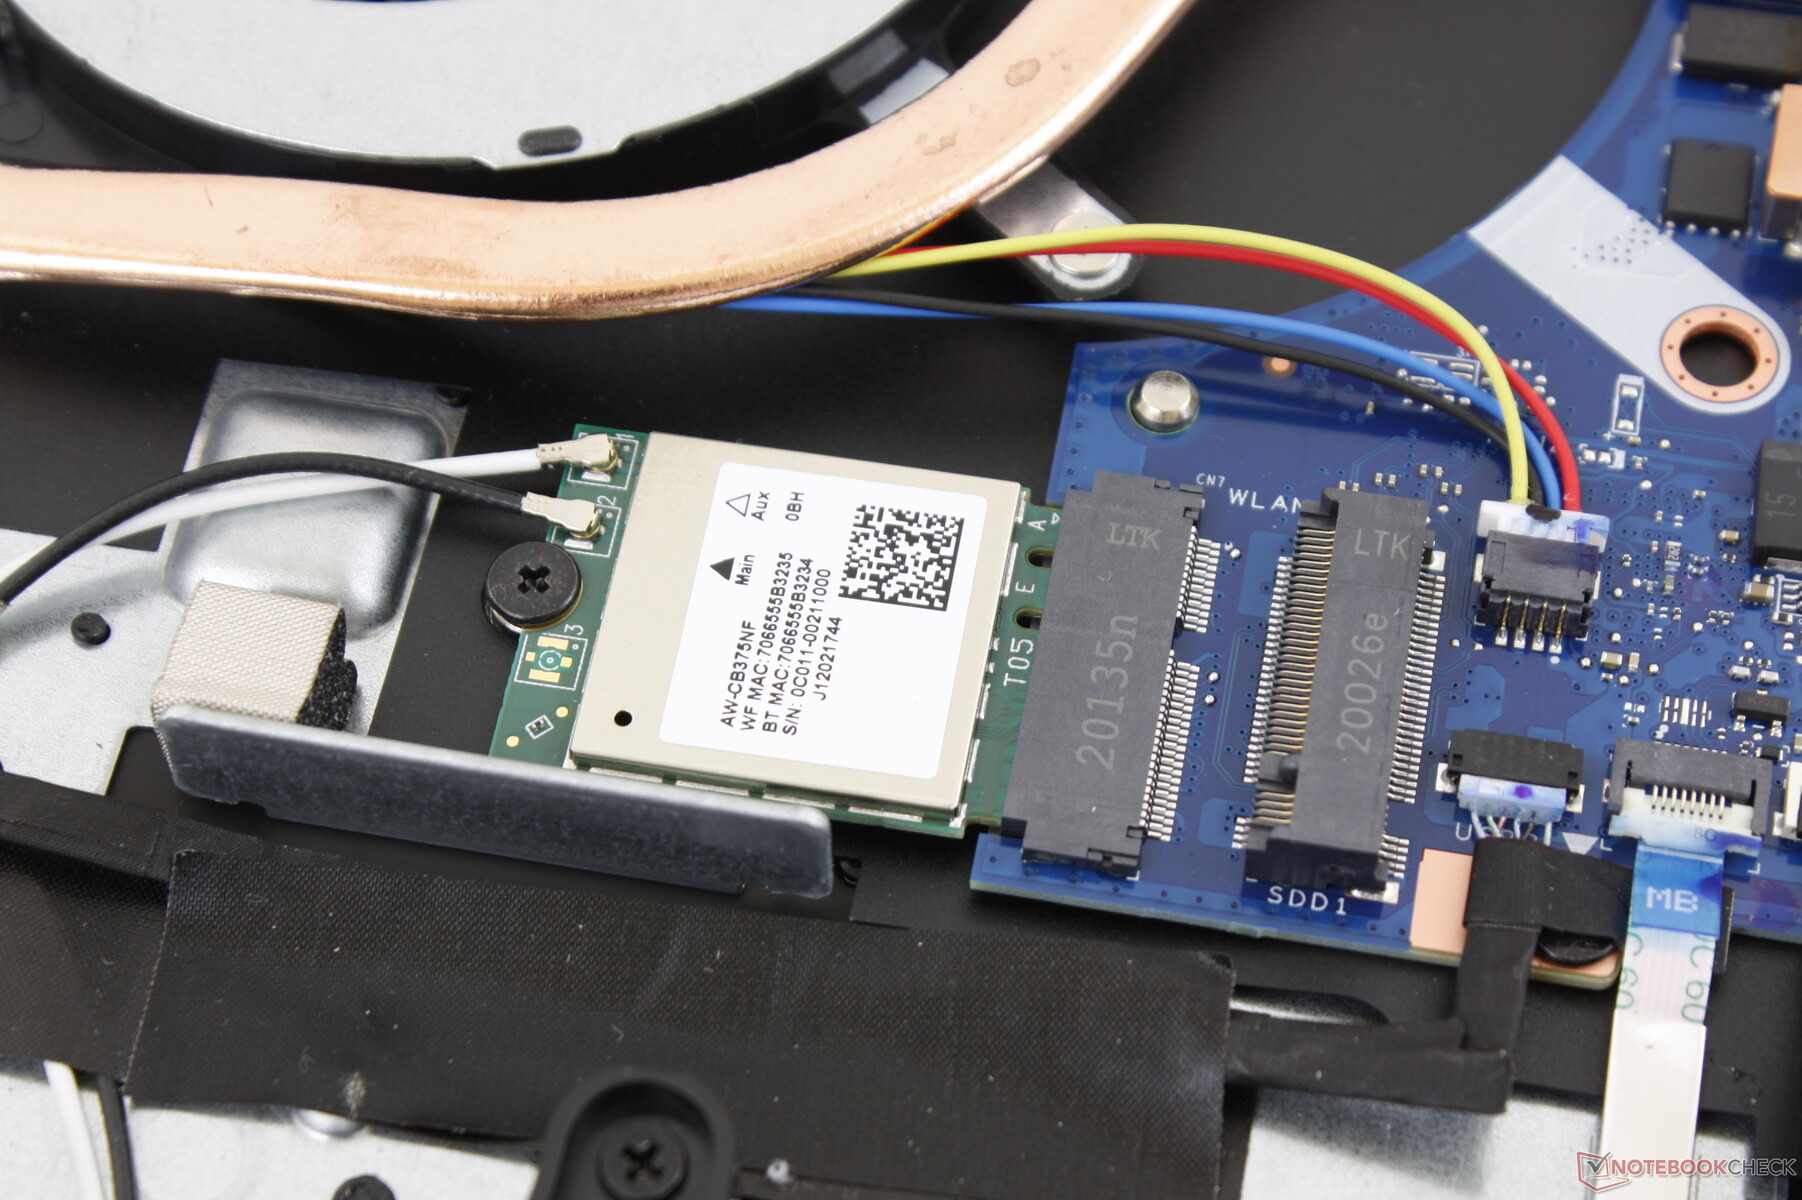
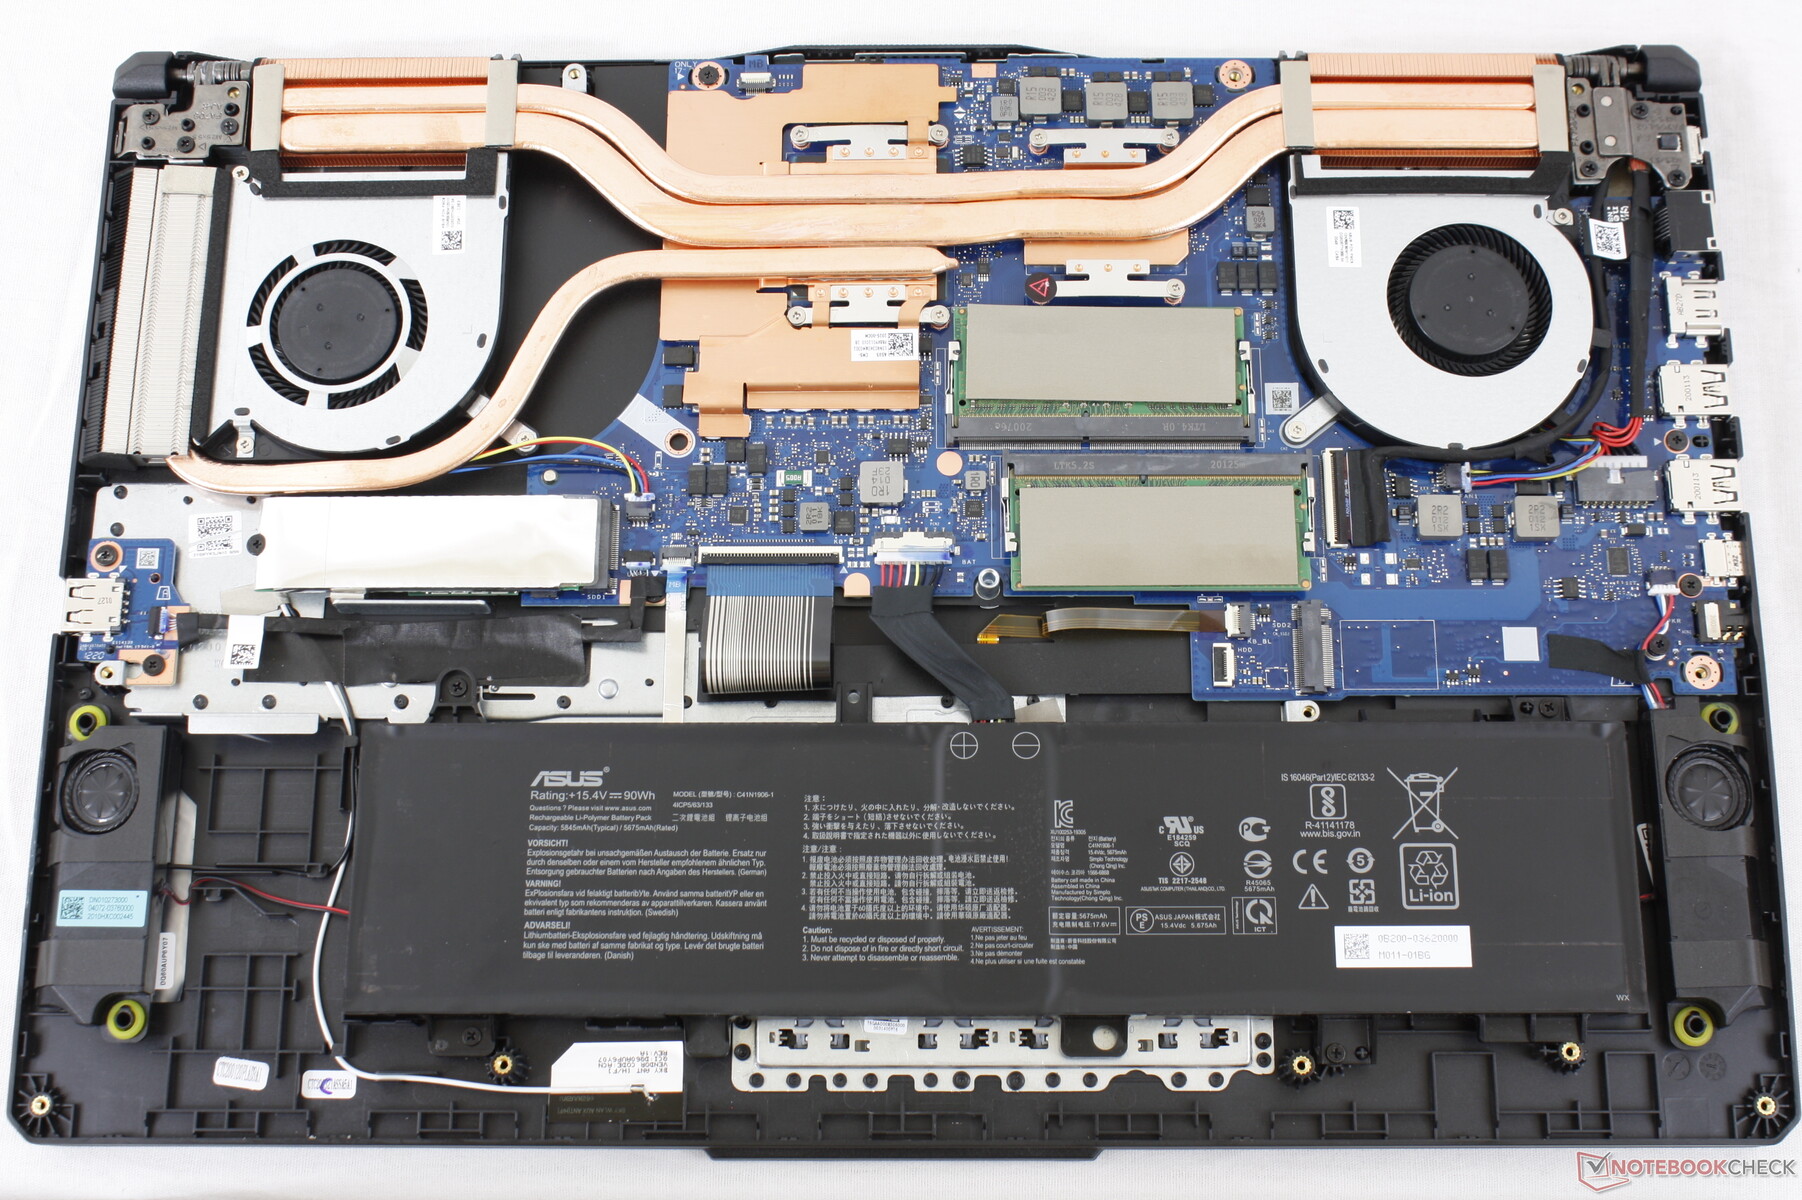
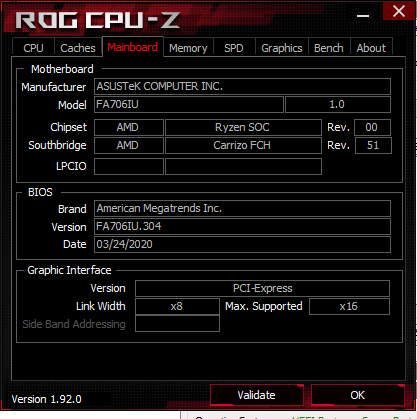
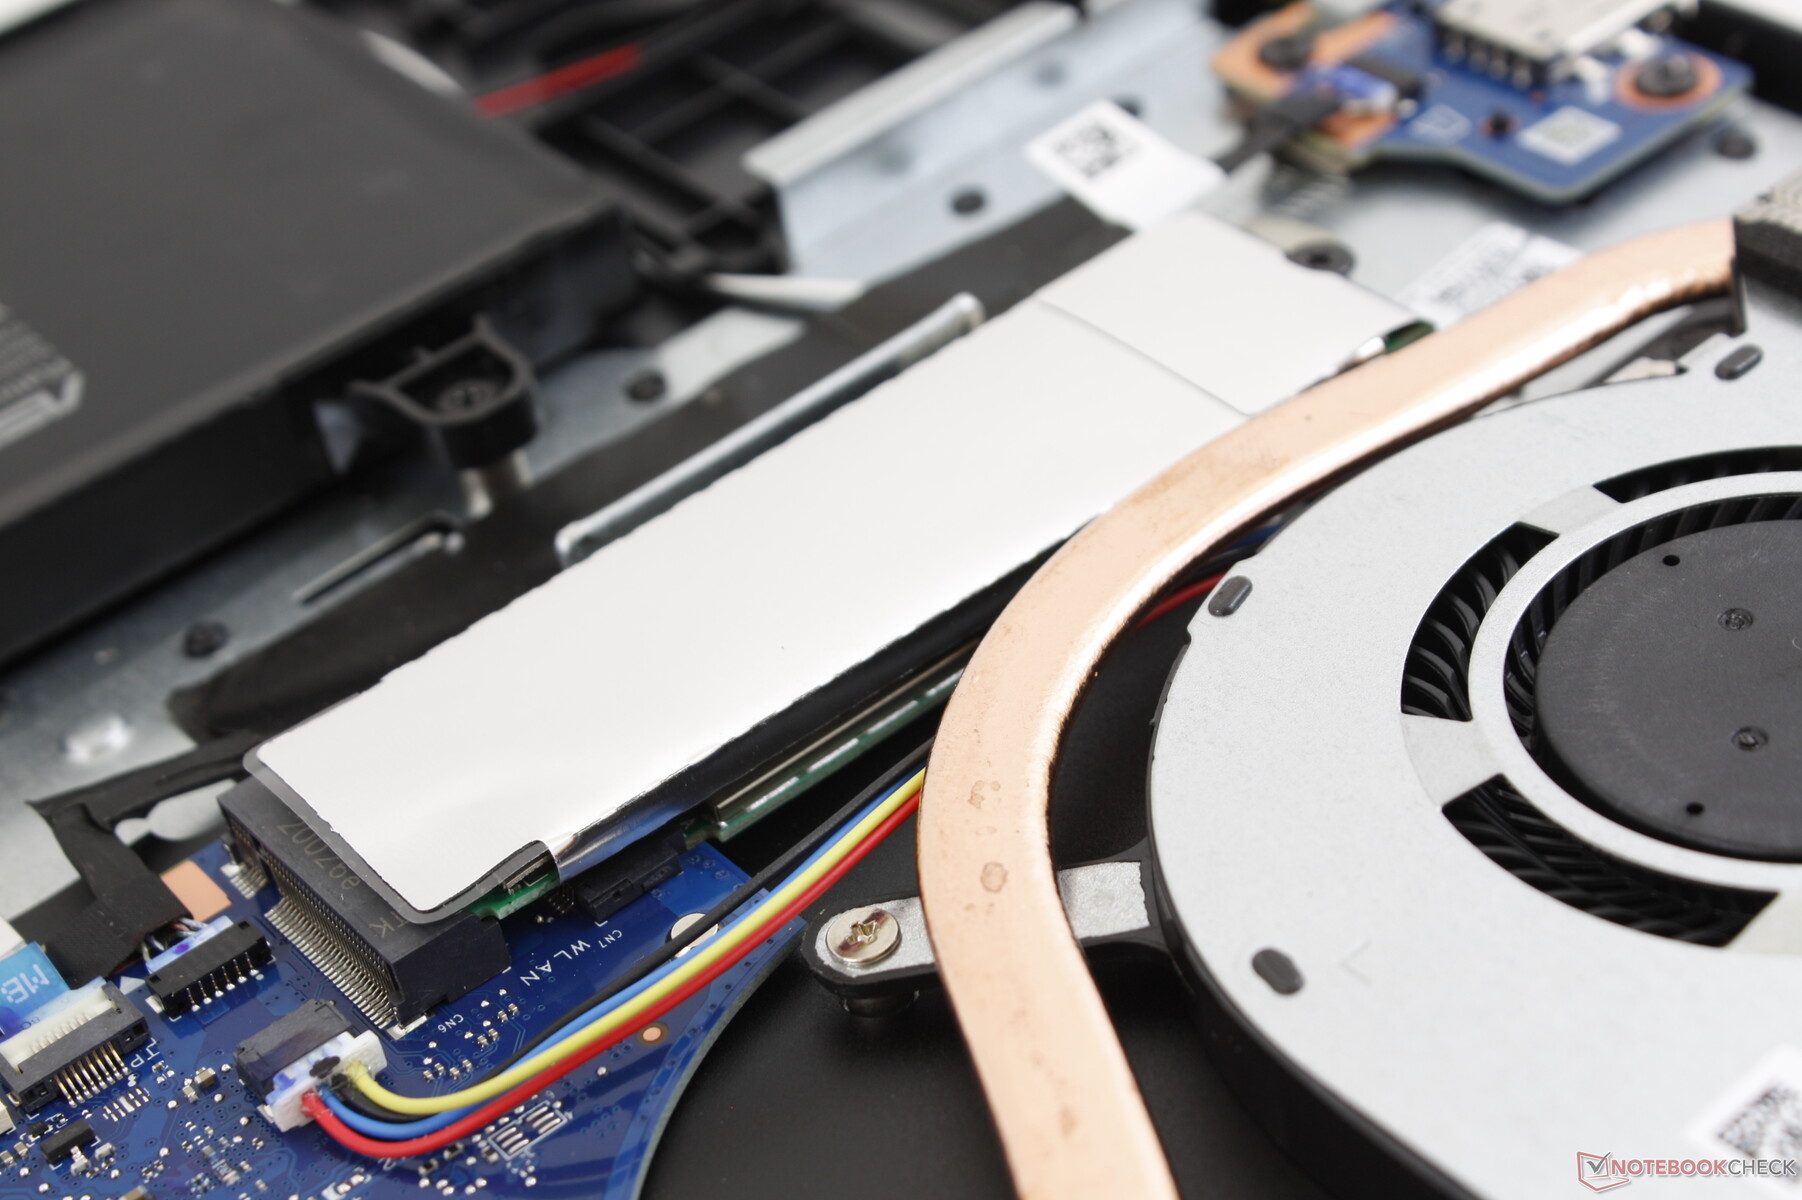
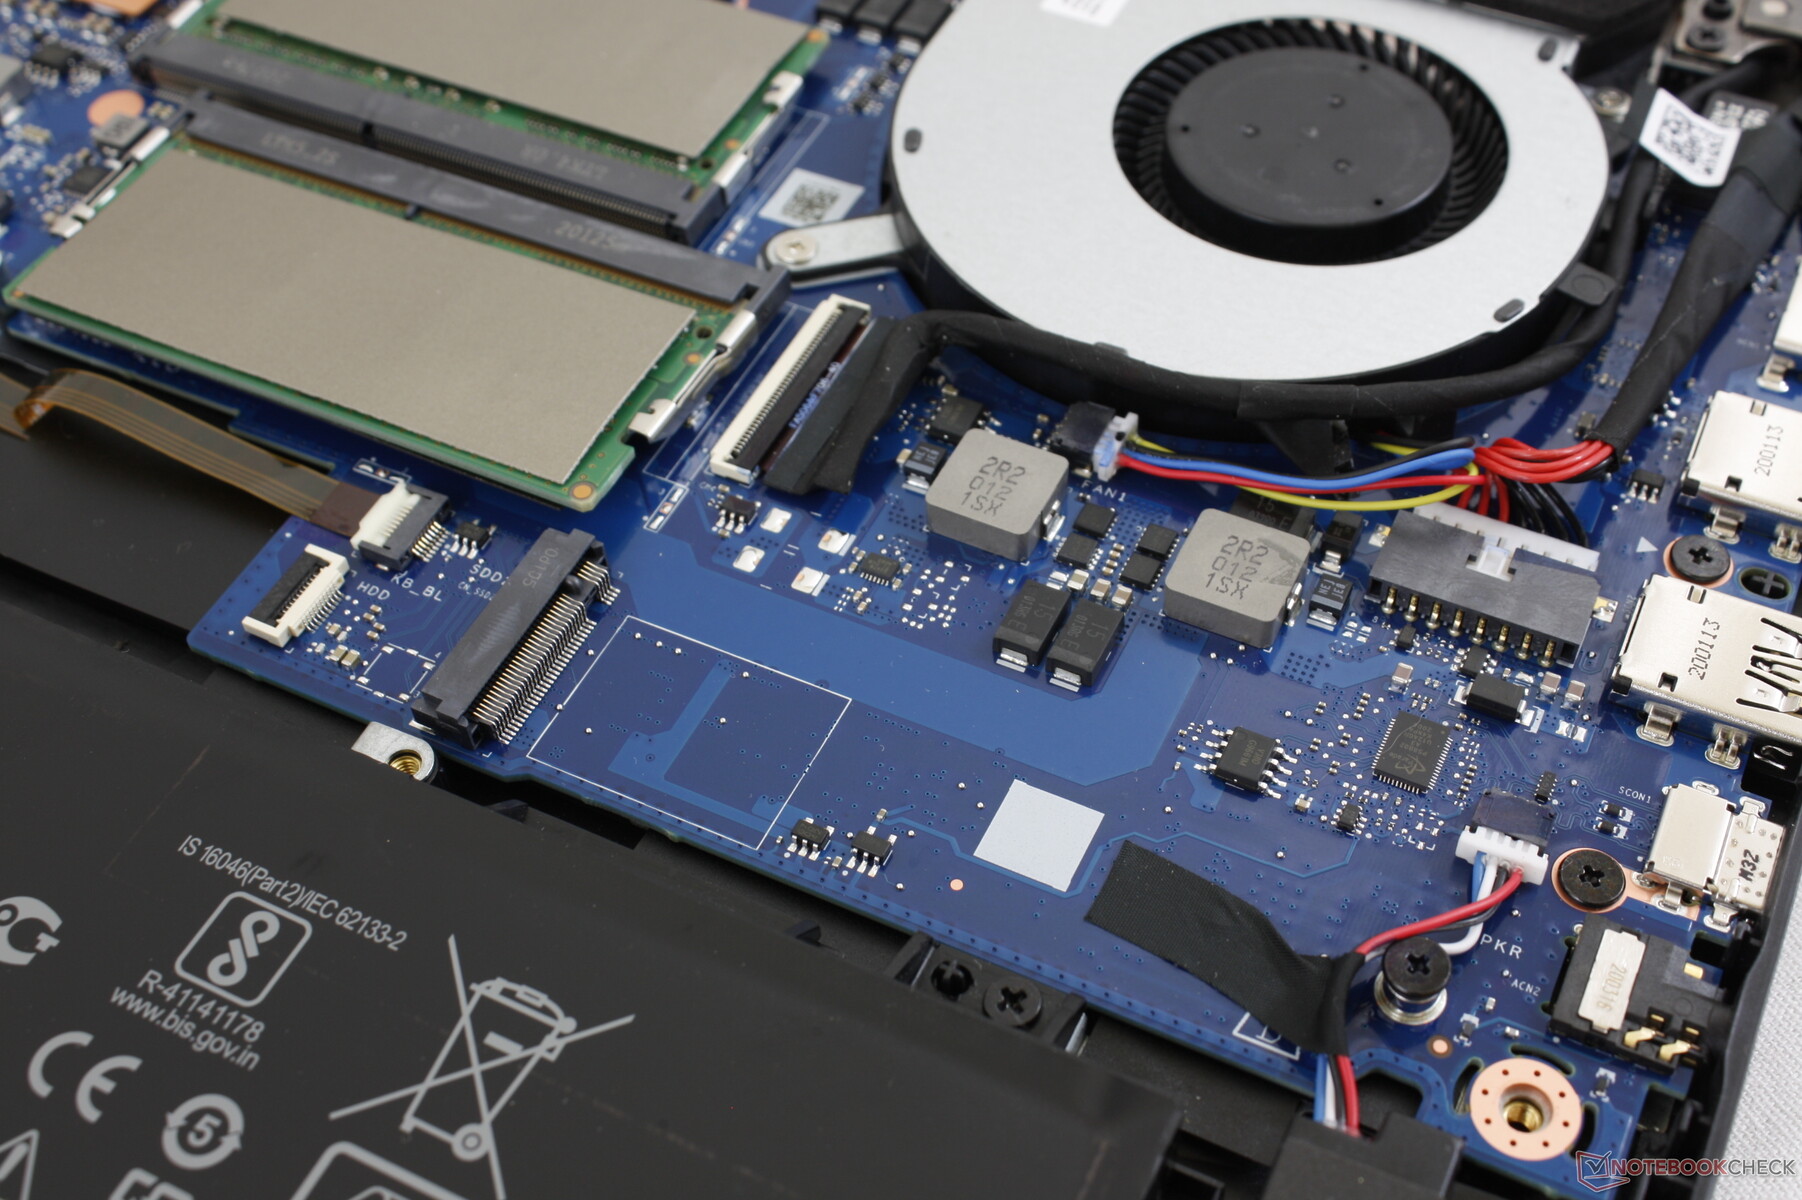
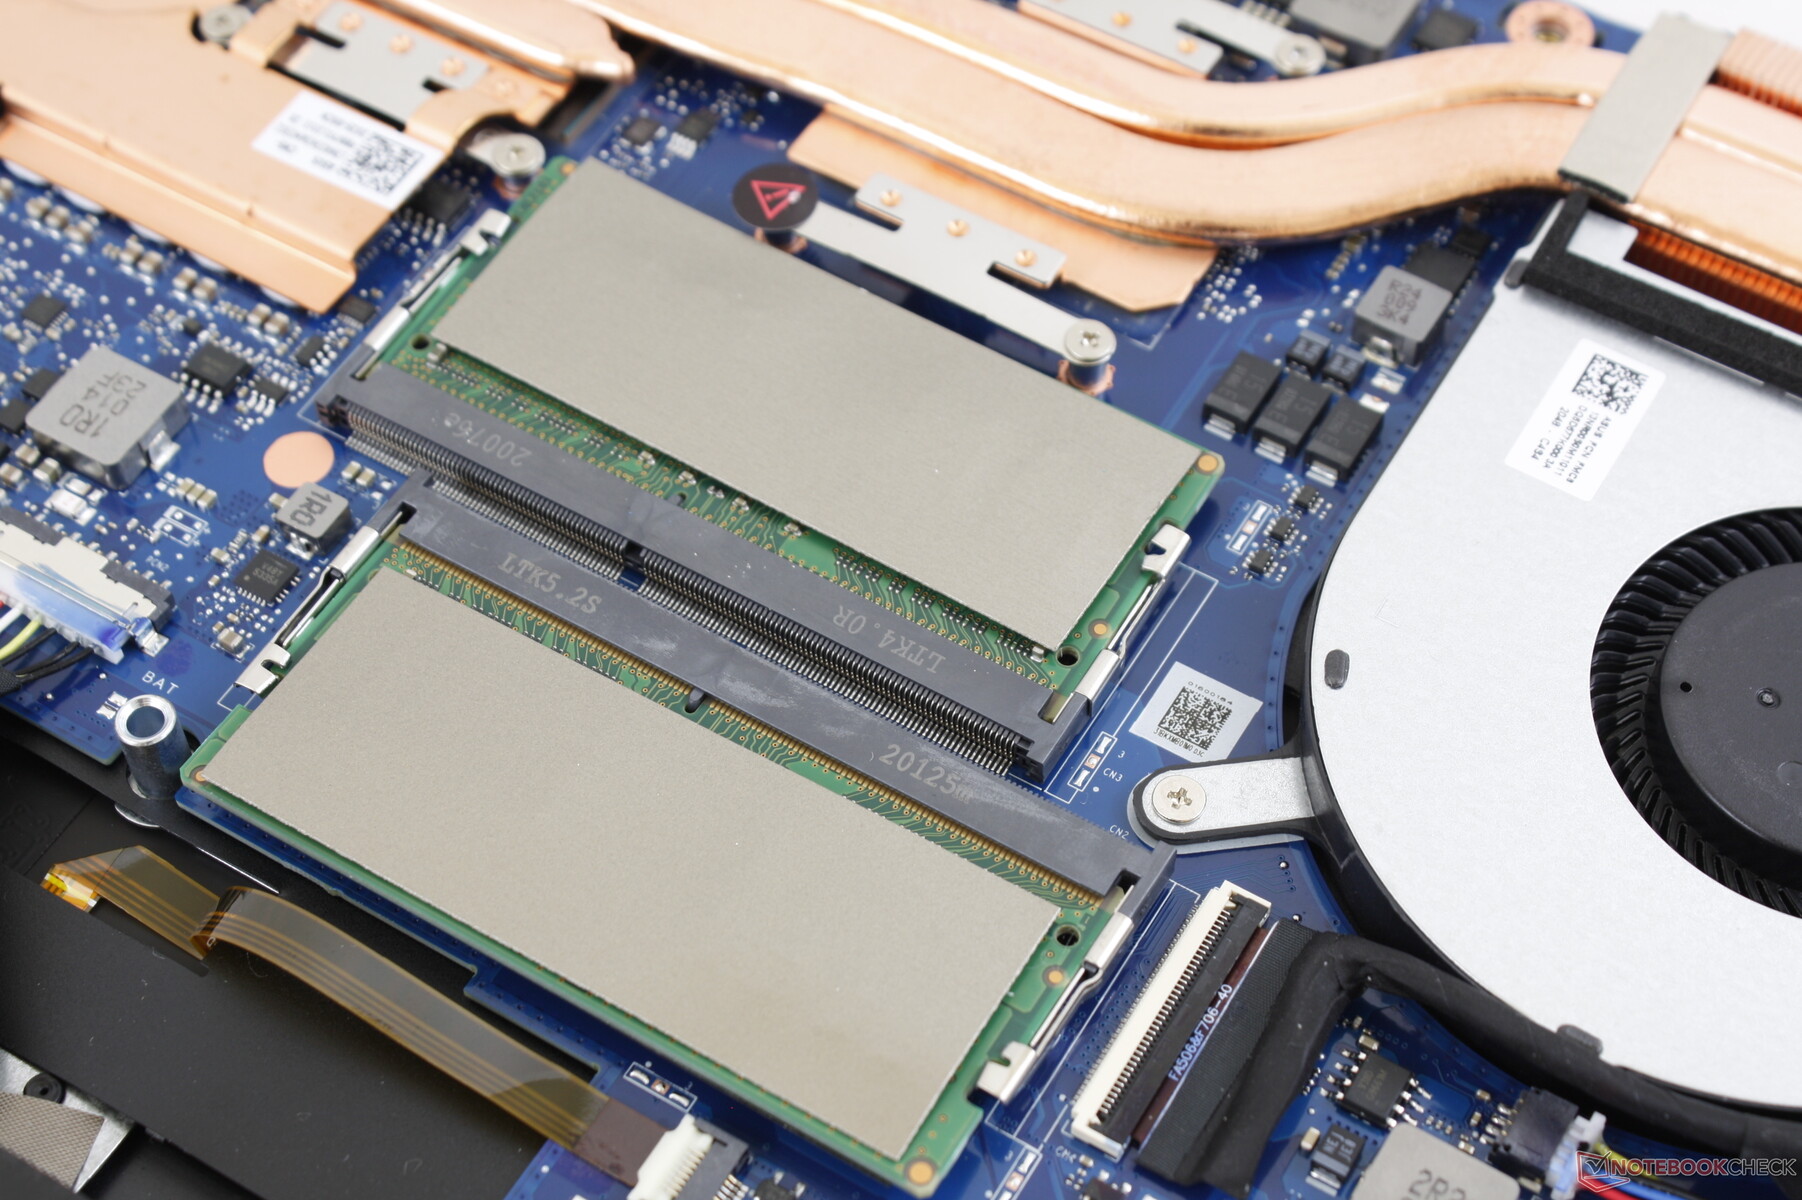
The bottom panel is secured by 11 Philips screws and it is easy to remove so long as you have a straight edge like a credit card. Once inside, users will have access to two SODIMM slots and two M.2 2280 slots. The WLAN module is also accessible but only after removing the M.2 SSD. Some SKUs will have a 2.5-inch SATA III bay and a smaller 48 Wh battery.
Accessories and Warranty
There are no extras in the box other than the AC adapter and small paperwork. The standard one-year limited warranty applies.
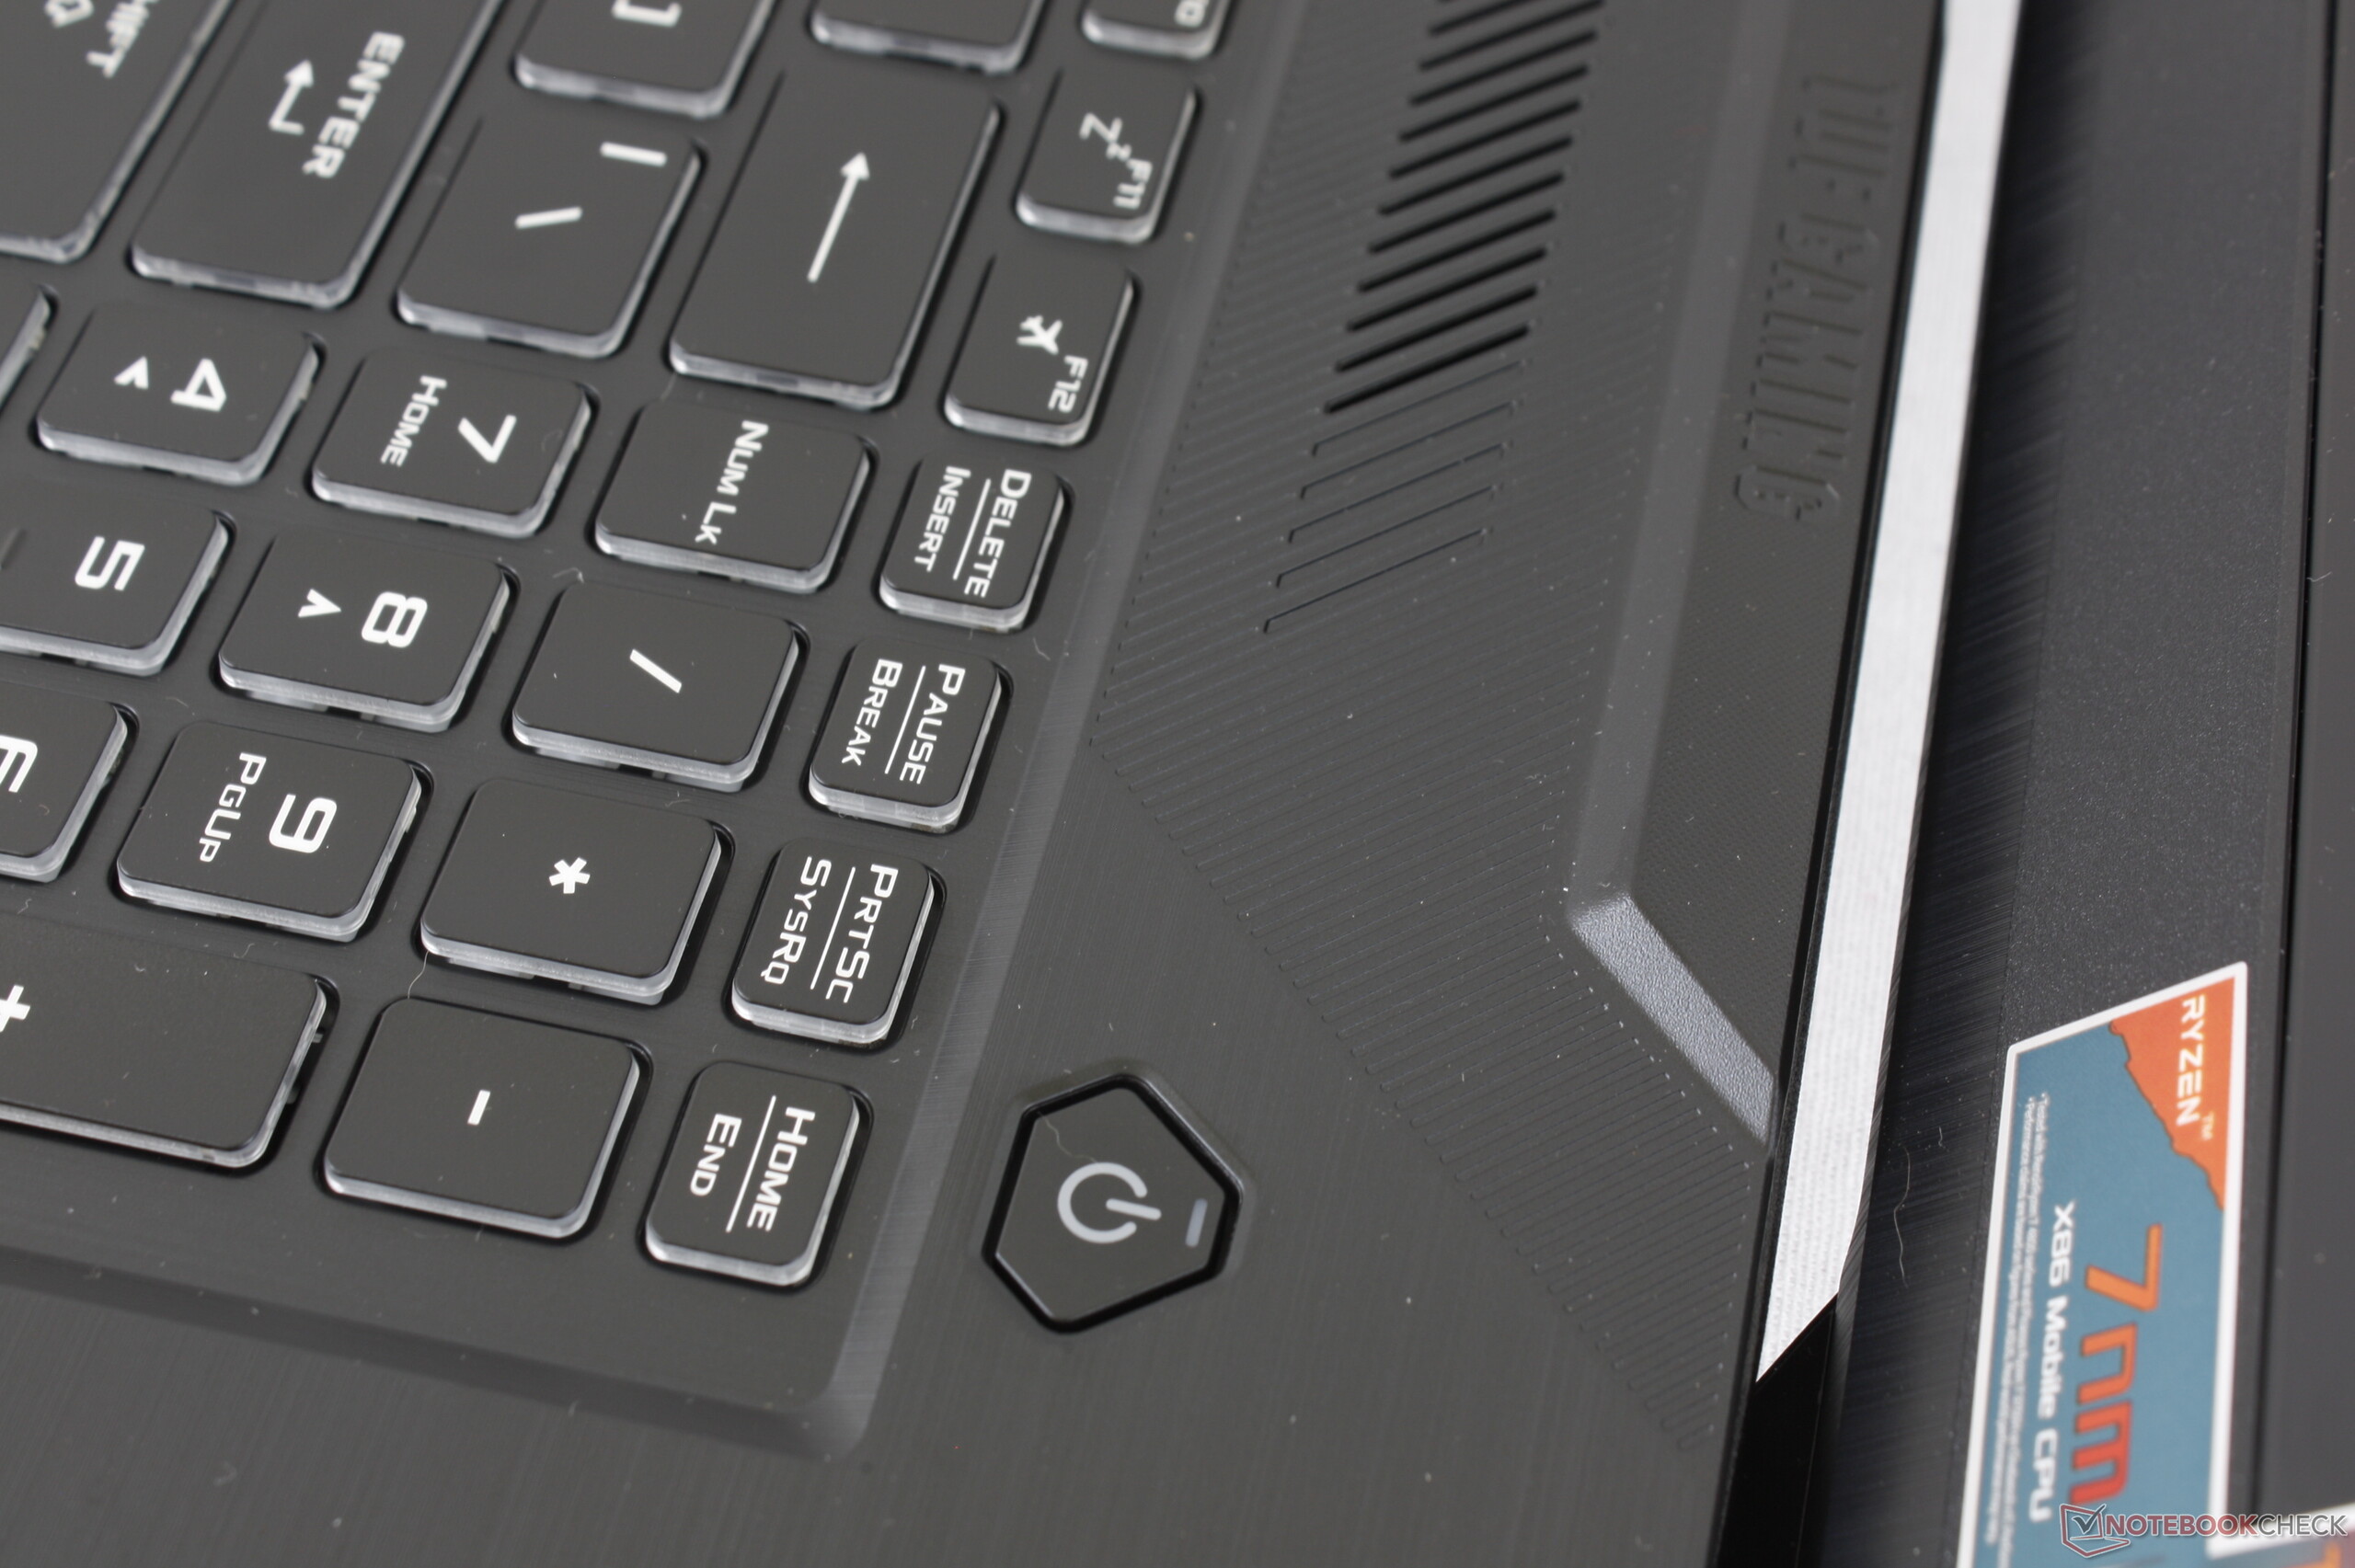
Input Devices — New Mouse Keys, Smaller Arrow Keys
Keyboard
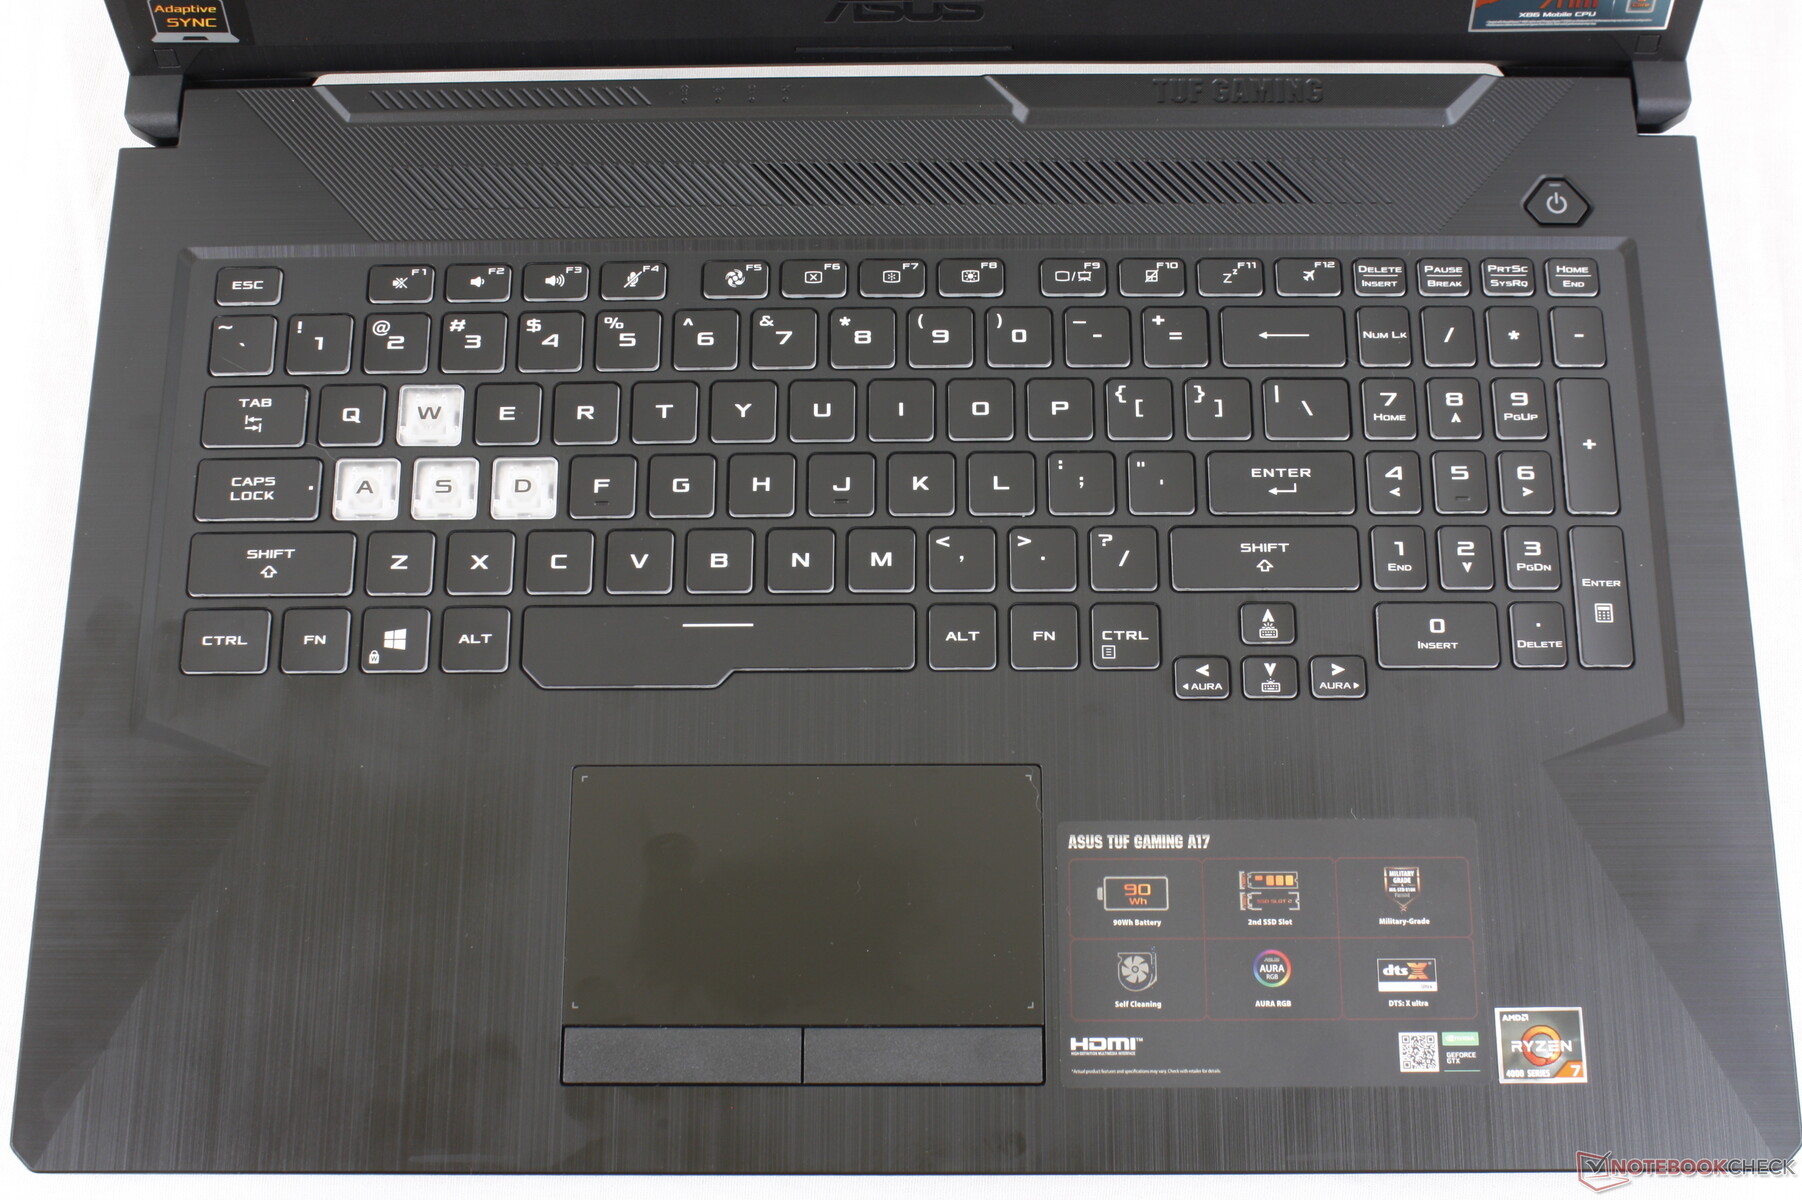
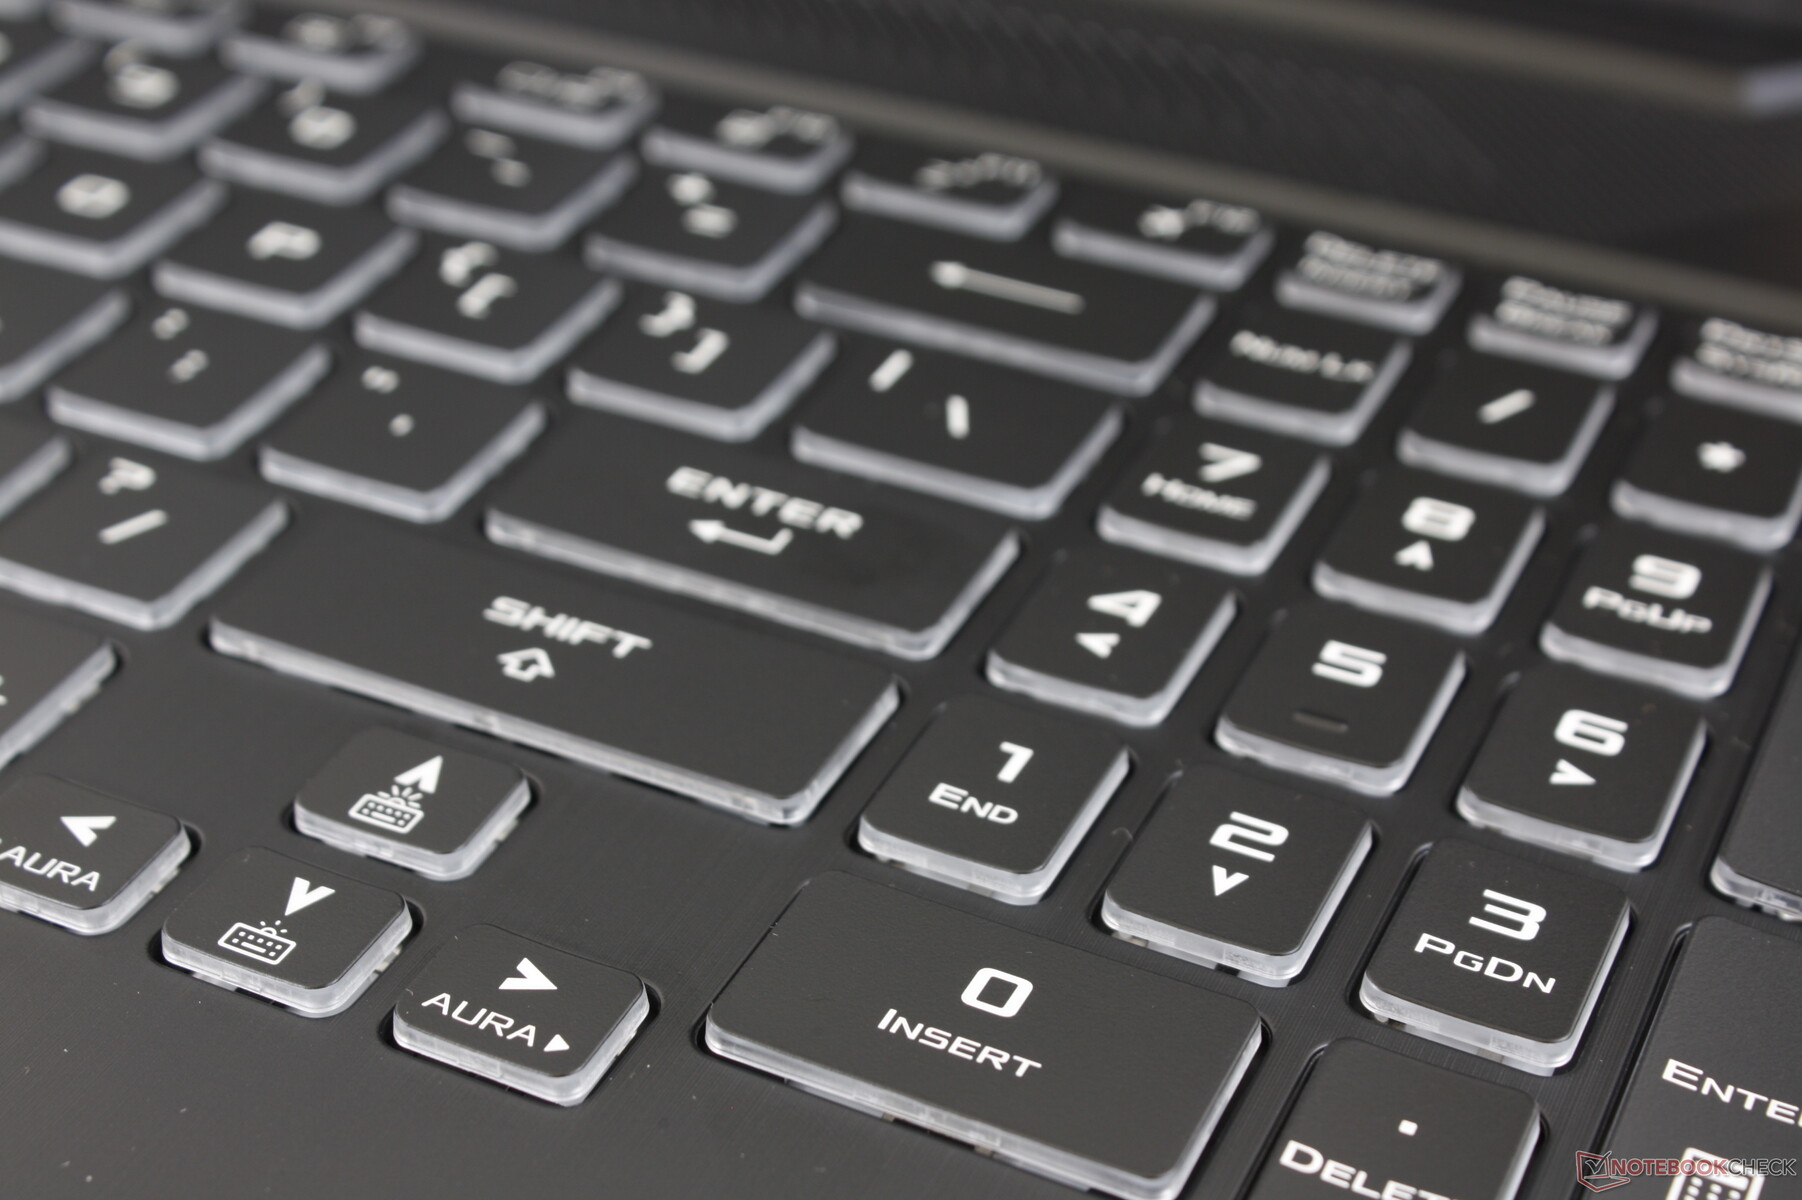
The keyboard keys have crisp feedback and moderate travel at the cost of slightly louder clatter when compared to the shallower and softer keyboard keys of the Zephyrus GX502 series or Razer Blade series.
Our least favorite aspect of the keyboard is the small size of the directional keys. There's absolutely no reason why a large 17.3-inch form factor should have some of the smallest arrow keys we've seen on any laptop. These keys are cramped, spongy, and just a pain to use as a result of their small size. Asus could certainly take some cues from the Lenovo Legion Y540 or Y740 keyboards in this regard.
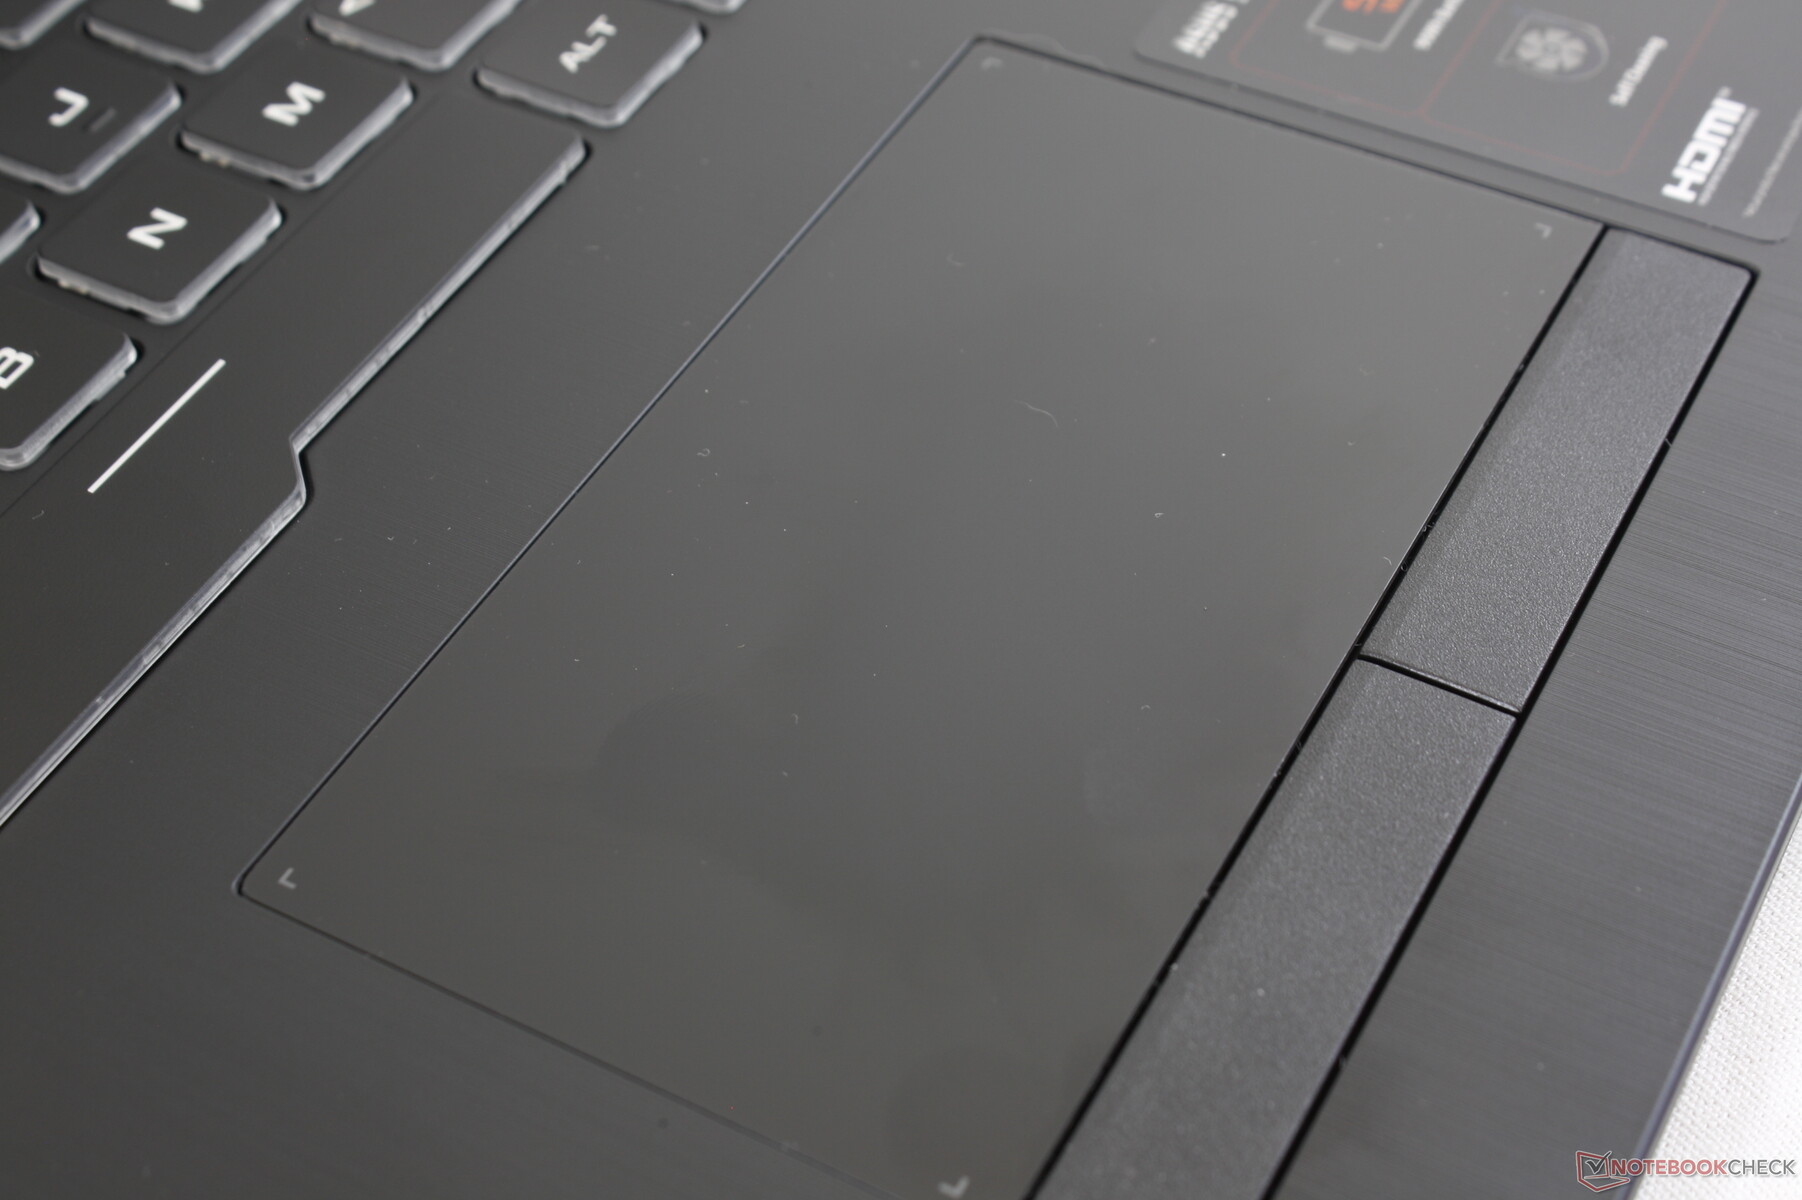
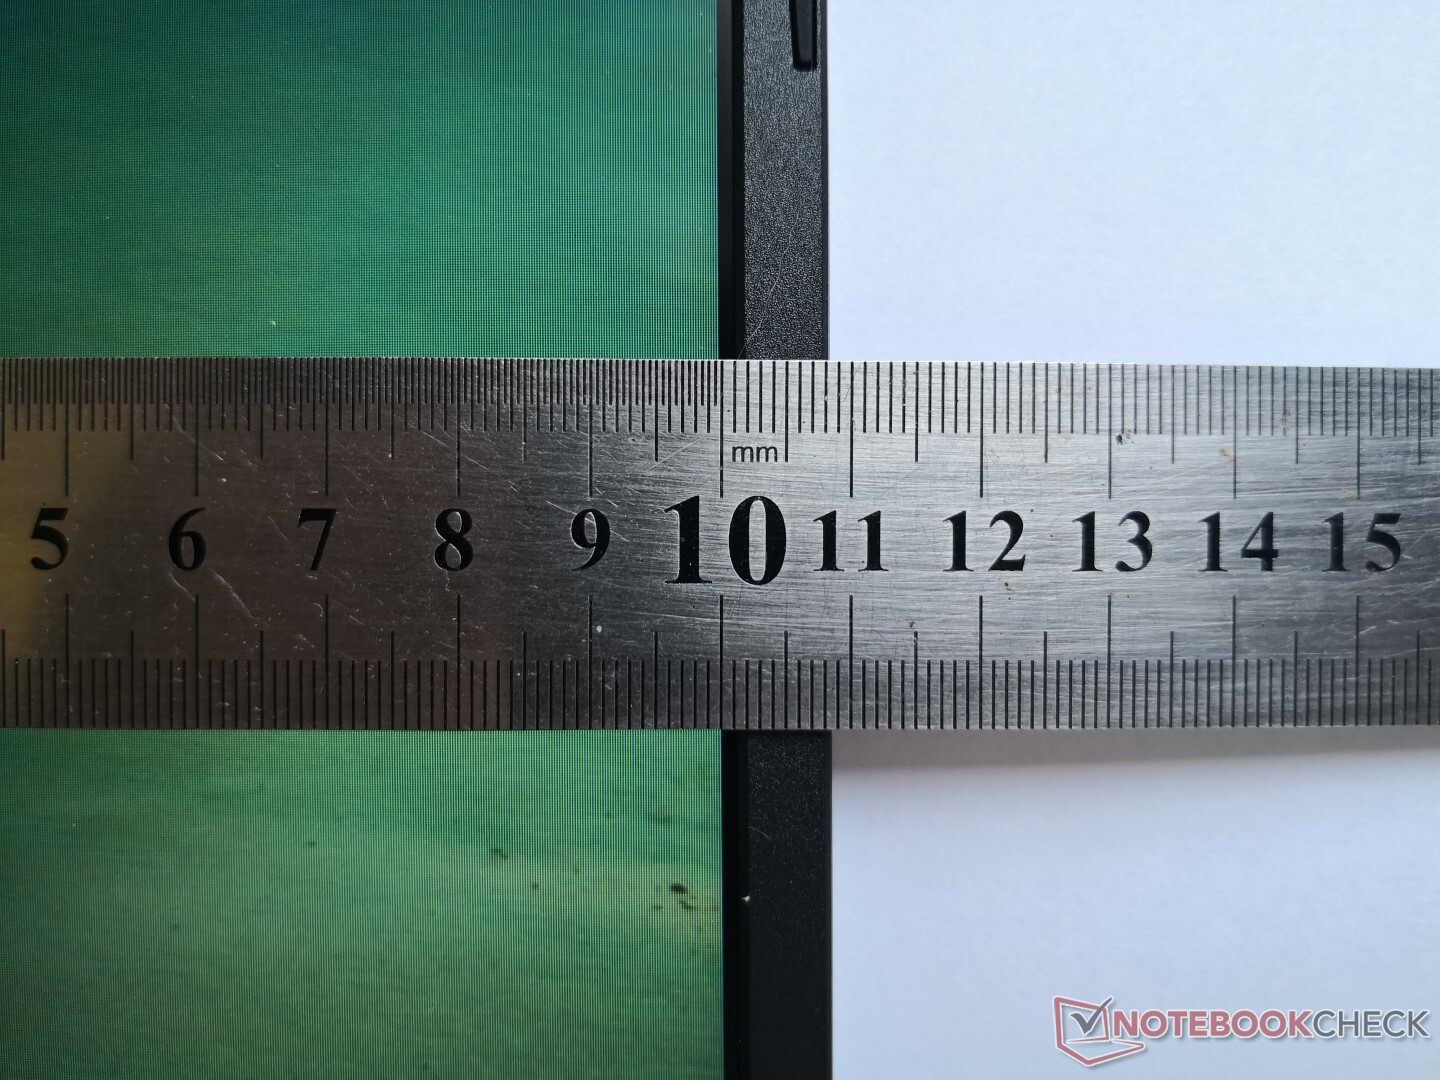
Touchpad
The touchpad is small (~10.9 x 5.9 cm) and so multi-touch inputs feel cramped. Cursor control, however, is otherwise smooth and reliable with excellent gliding properties and minimal sticking when moving slowly. The dedicated mouse keys are new for the series and they offer moderate travel, adequate feedback and a quiet auditory click when pressed in contrast to the louder mouse keys on the MSI GT or GE series. They get the job done if you don't have a mouse, but you're definitely still going to want a mouse whenever possible.
Expect unsightly fingerprint buildup on the touchpad surface since it is smooth plastic.

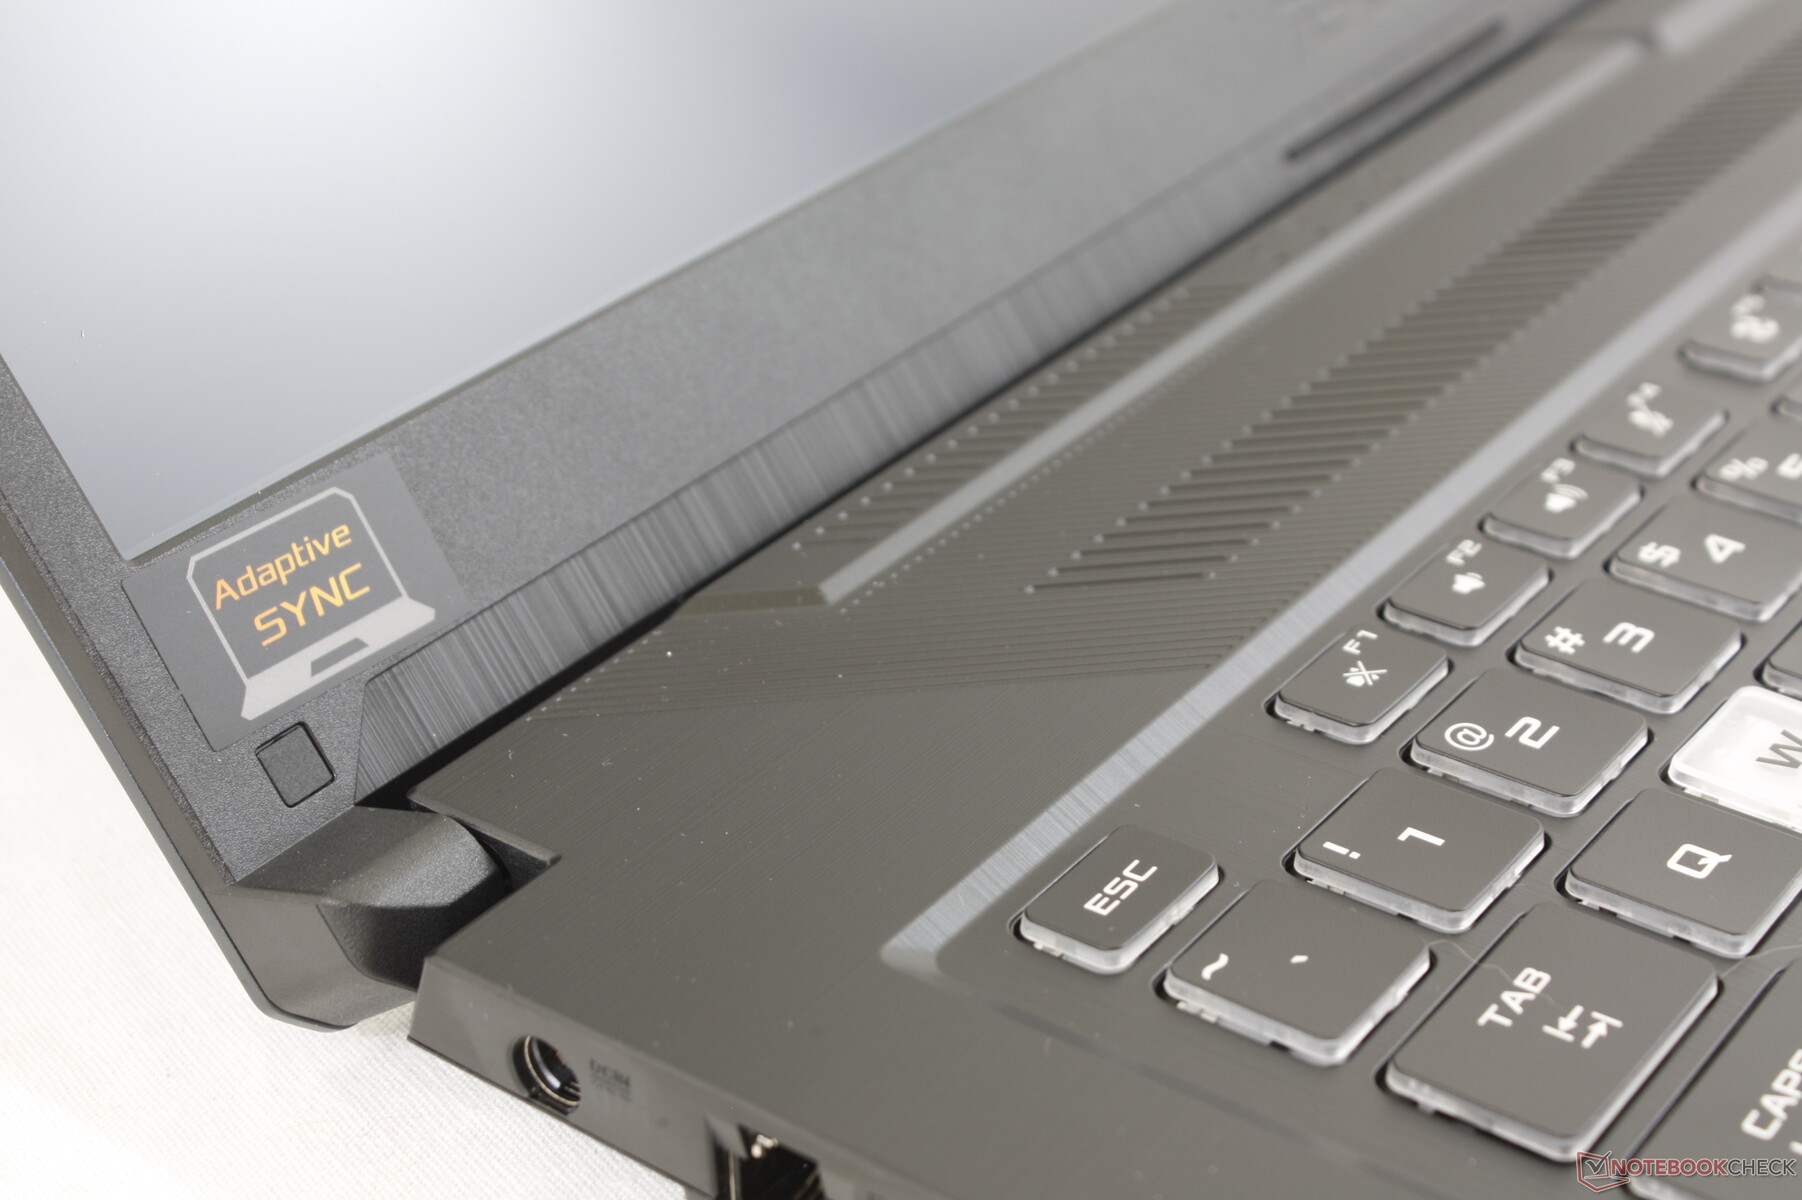
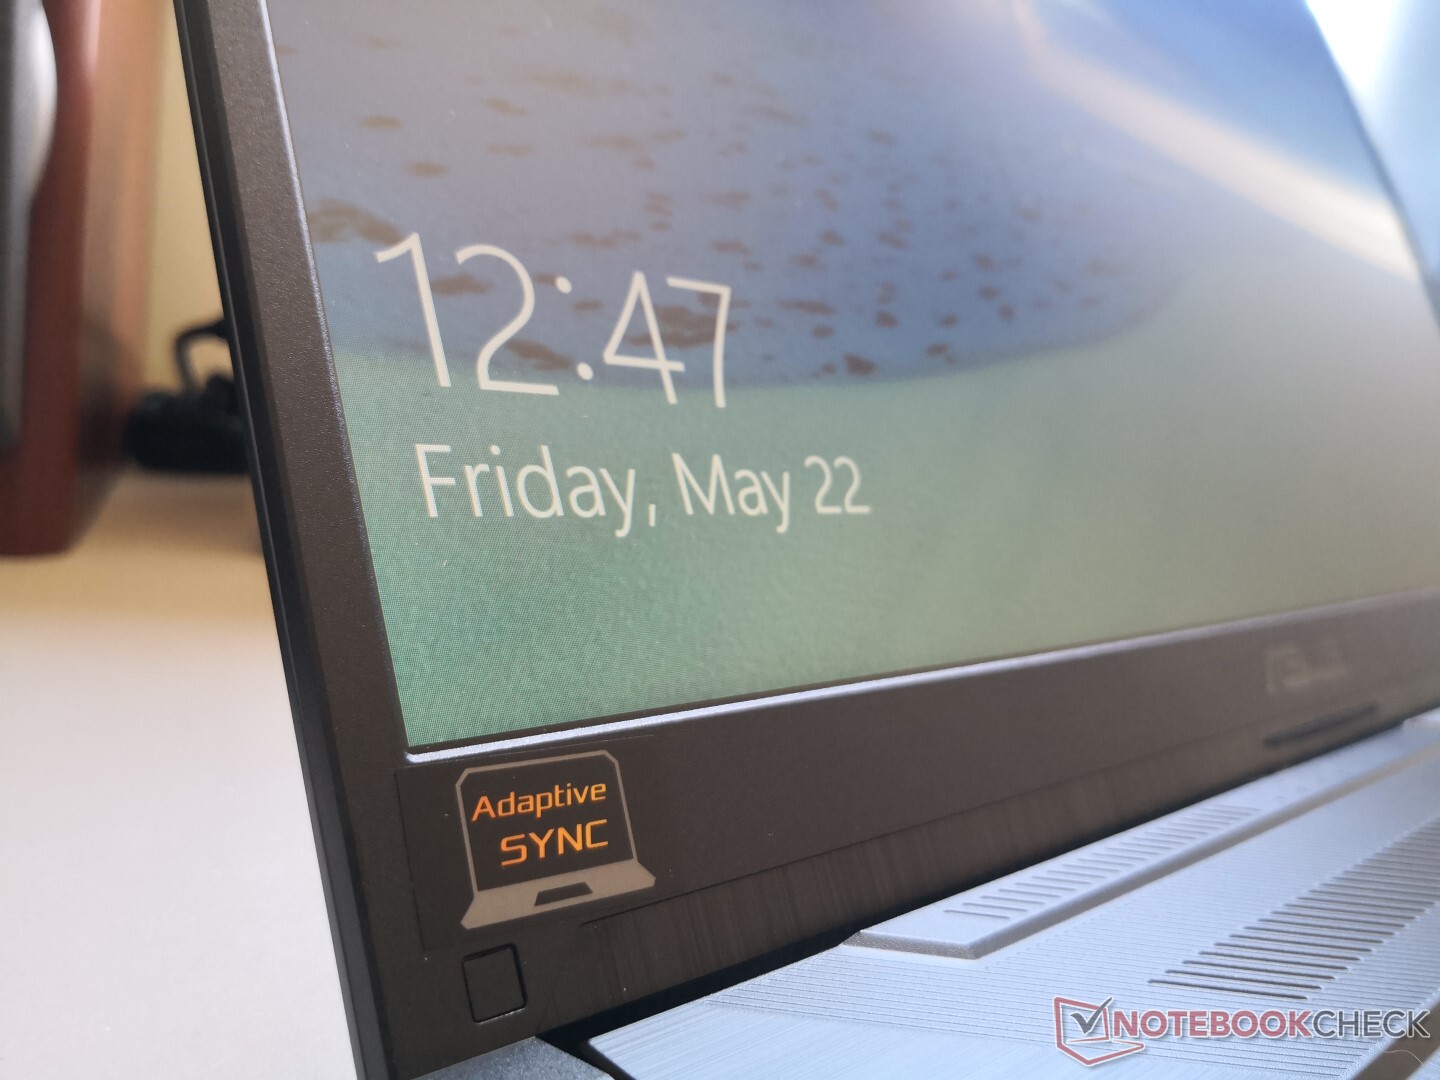
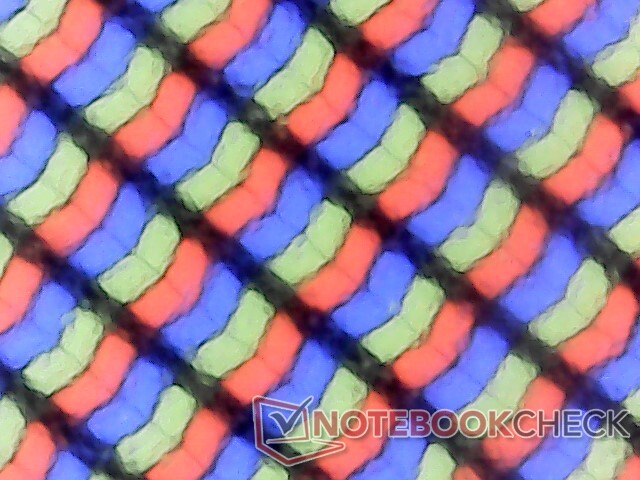
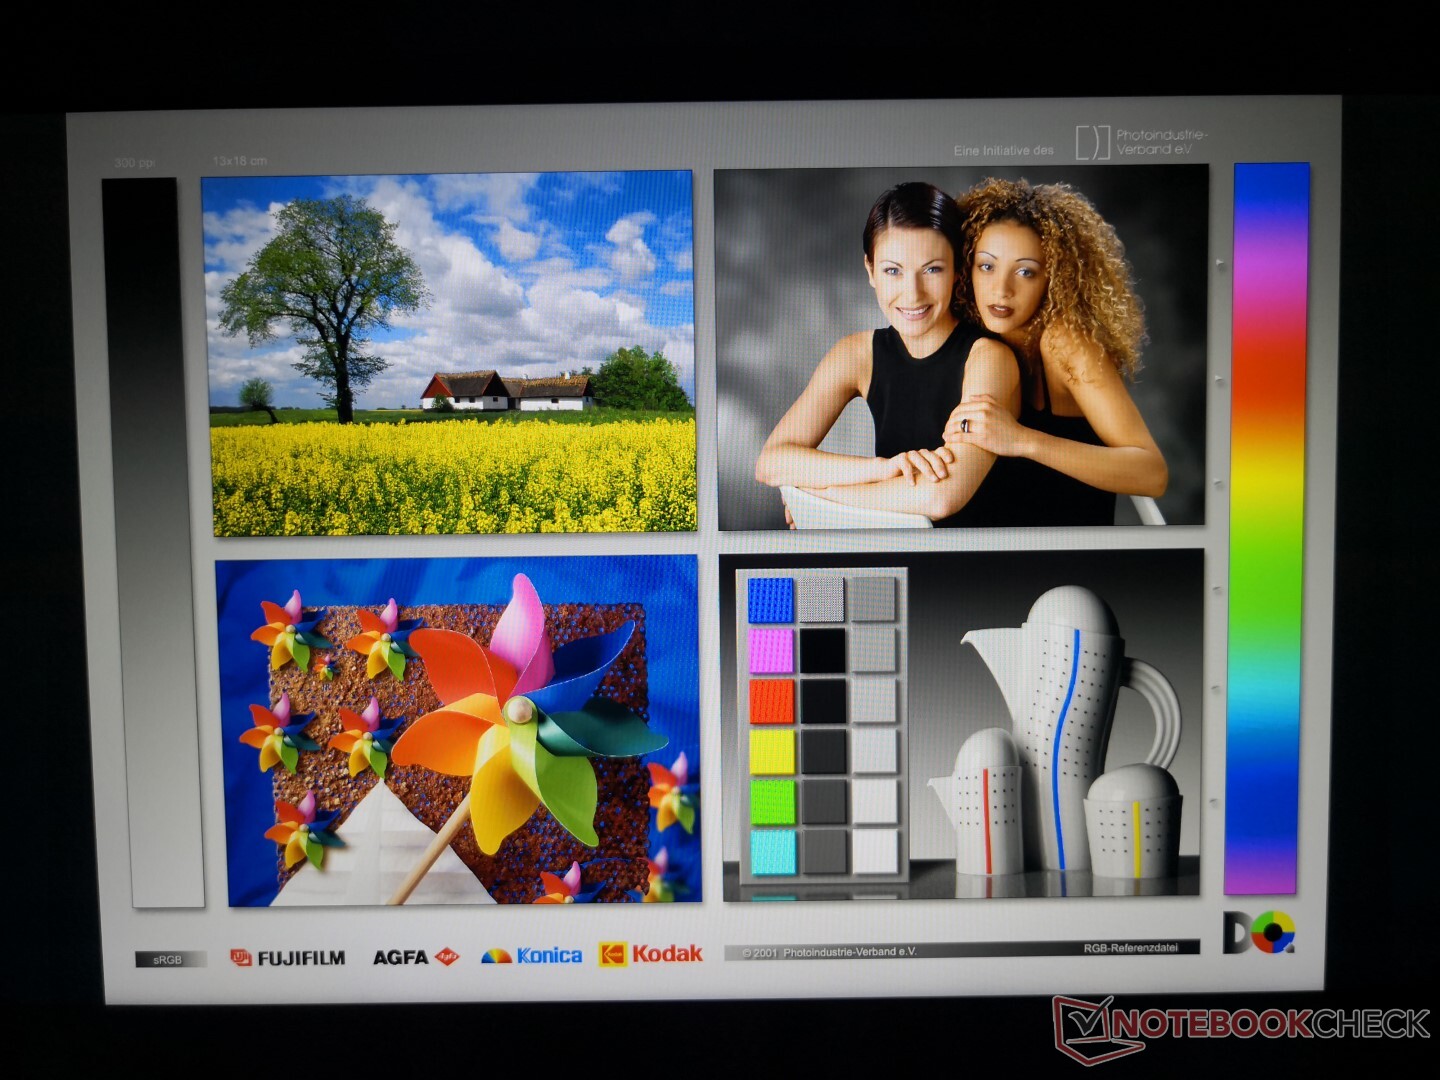
Display — 120 Hz With Optimus And Adaptive Sync
The 120 Hz BOE NV173FHM-NX1 panel can be found on no other laptop in our database, but the NV173FHM series is common on other white label 17.3-inch laptops like the Eurocom Nightsky RX17 or Schenker XMG Neo 17. The panel here supports adaptive sync to eliminate screen-tearing a la Nvidia G-Sync but likely at lower royalty fees.
Display quality is above average for a gaming laptop but still below that of more expensive alternatives. As shown by the table below, characteristics like brightness and response times are good but not quite up there with the best while other aspects like color space are very narrow for shallower colors. Nonetheless, it's a much better panel for gaming purposes when compared to the slower panel on the last generation Asus TUF FX705DT where ghosting was more prevalent.
| |||||||||||||||||||||||||
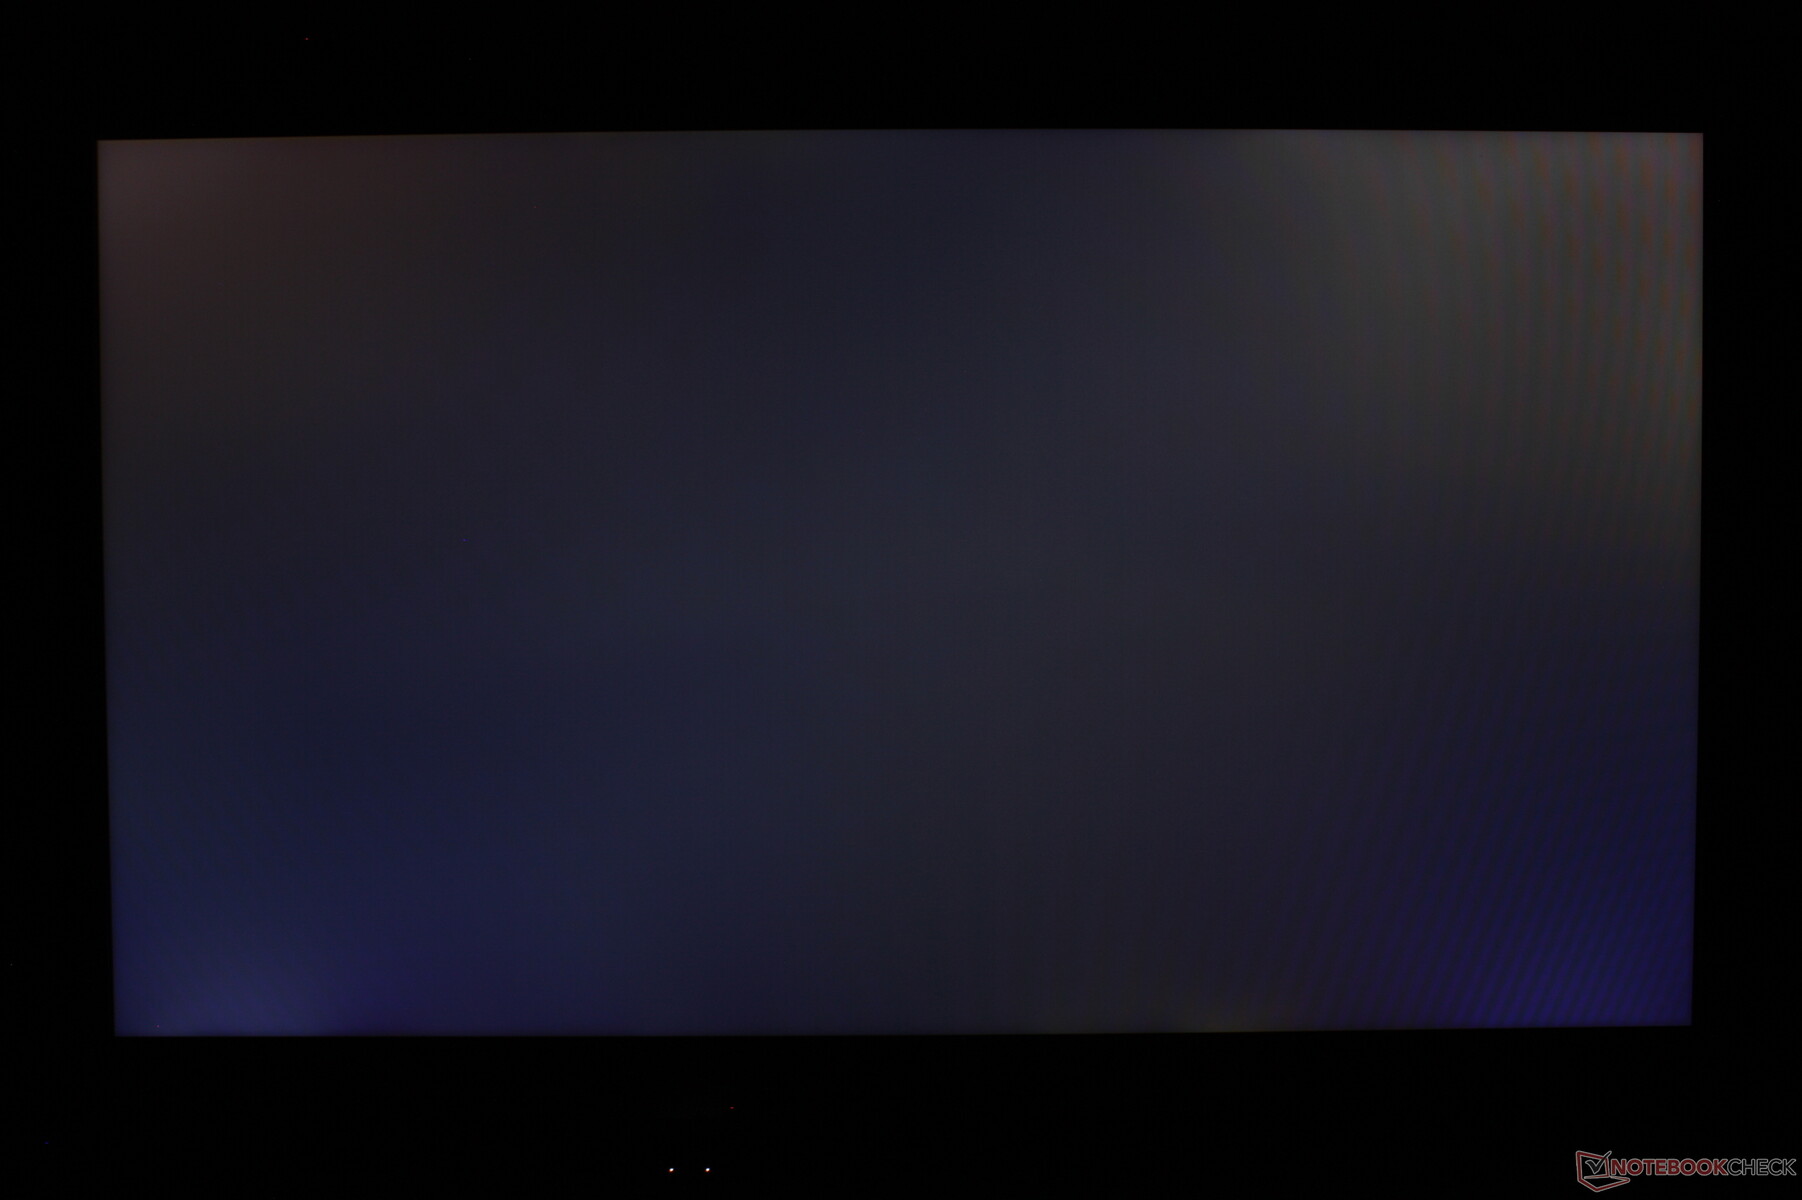
Brightness Distribution: 90 %
Center on Battery: 264.8 cd/m²
Contrast: 854:1 (Black: 0.31 cd/m²)
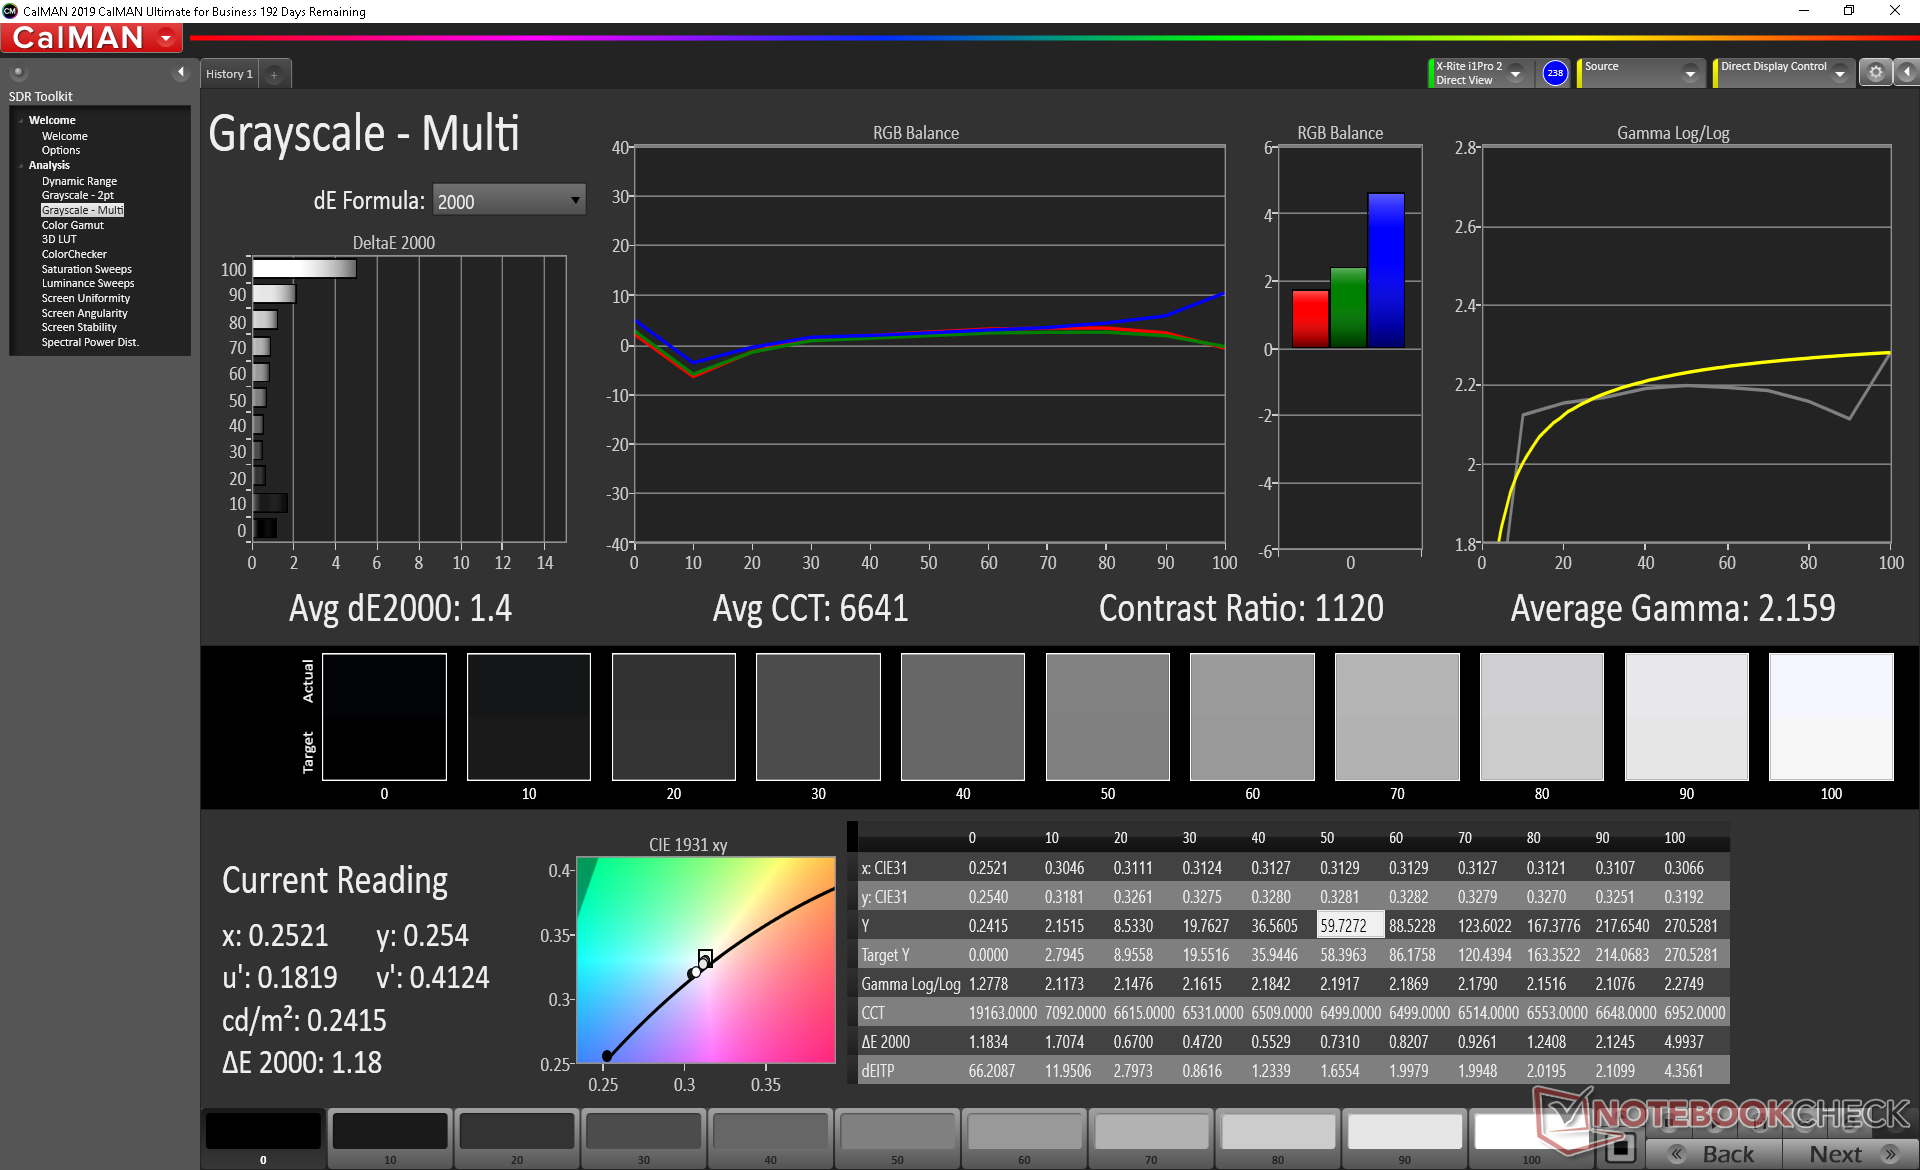
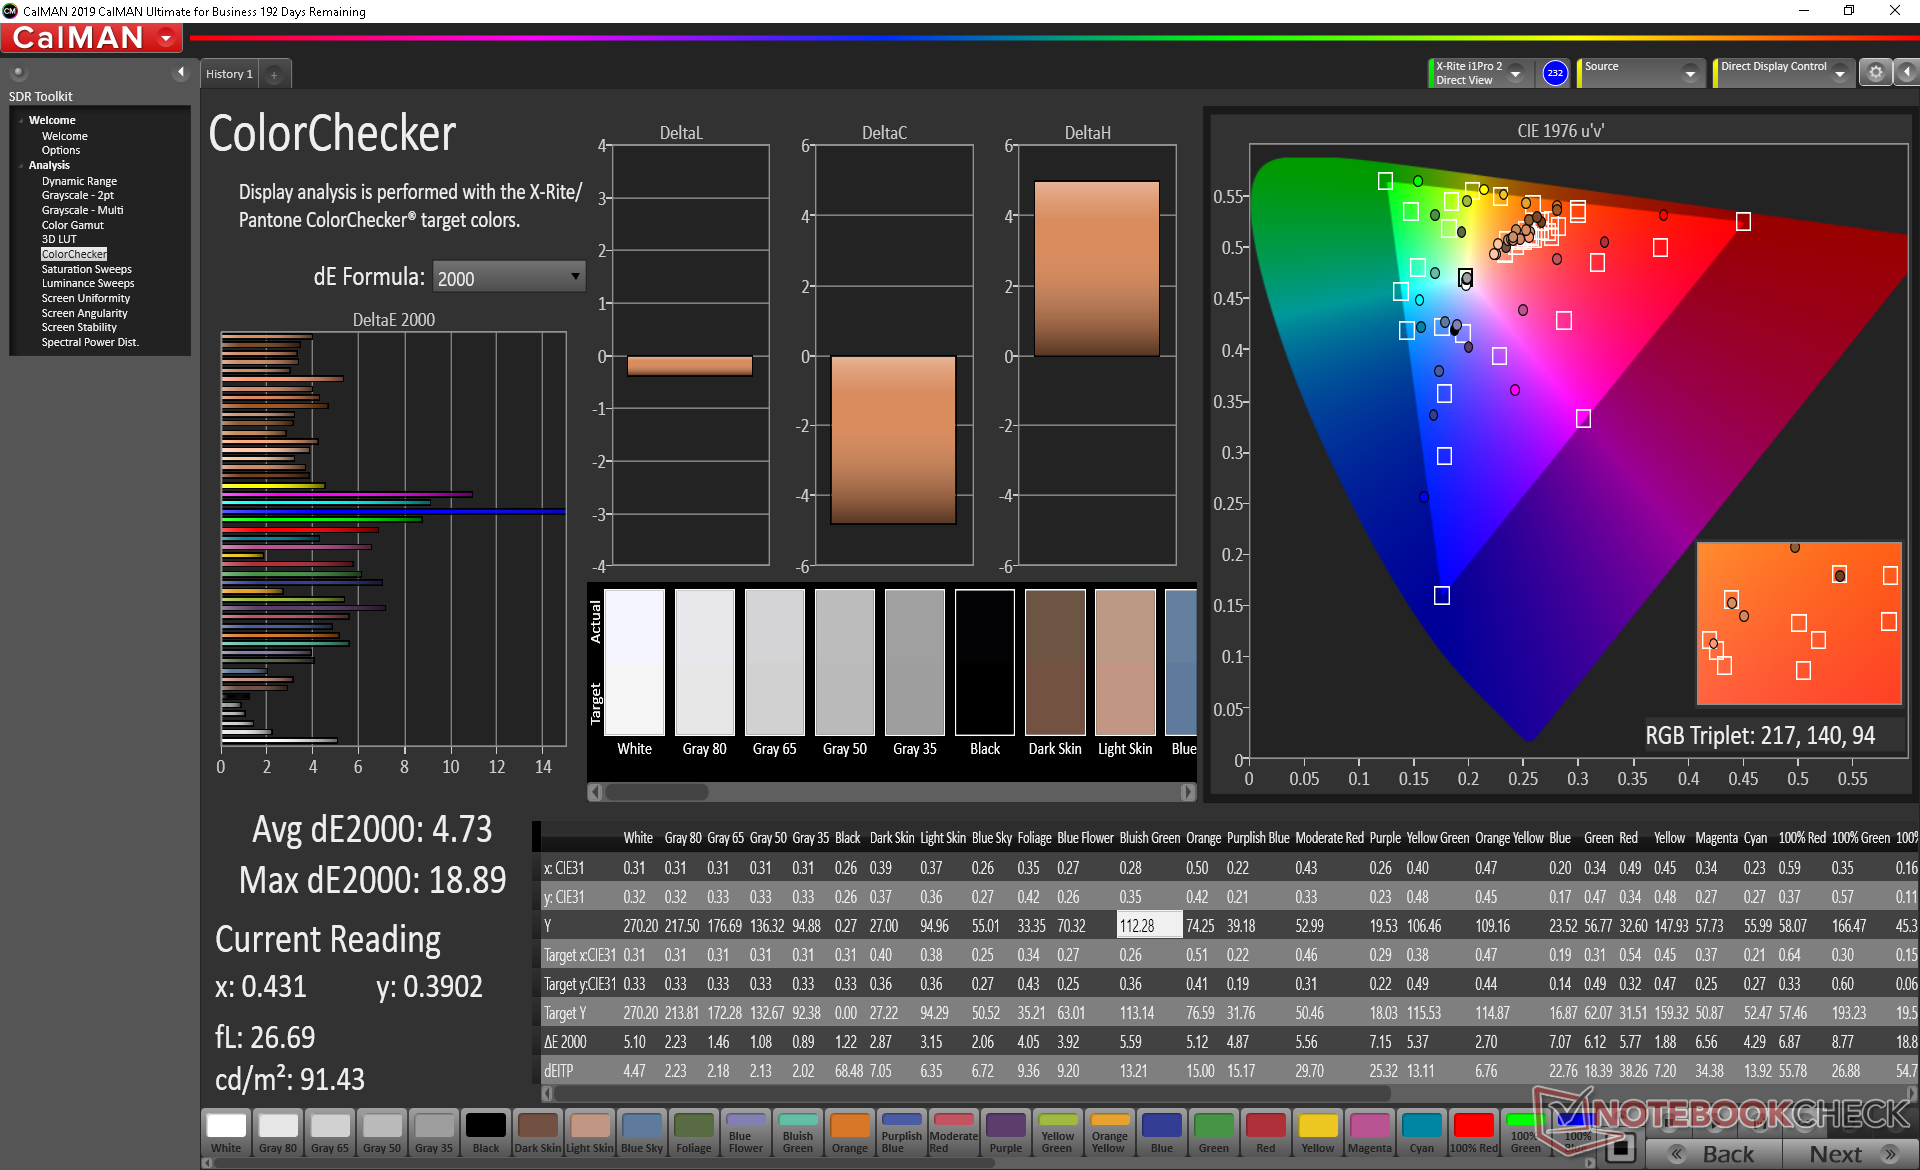
ΔE Color 4.73 | 0.5-29.43 Ø5, calibrated: 4.64
ΔE Greyscale 1.4 | 0.57-98 Ø5.3
59.3% sRGB (Argyll 1.6.3 3D)
38.4% AdobeRGB 1998 (Argyll 1.6.3 3D)
41.89% AdobeRGB 1998 (Argyll 2.2.0 3D)
59.7% sRGB (Argyll 2.2.0 3D)
40.55% Display P3 (Argyll 2.2.0 3D)
Gamma: 2.16
| Asus TUF A17 FA706IU-AS76 BOE NV173FHM-NX1, IPS, 17.30, 1920x1080 | MSI GP75 Leopard 9SD Chi Mei N173HCE-G33 (CMN175C), IPS, 17.30, 1920x1080 | Dell G7 17 7790 AU Optronics AUO409D, B173HAN, IPS, 17.30, 1920x1080 | HP Pavilion Gaming 17-cd0085cl BOE0825, IPS, 17.30, 1920x1080 | Lenovo Legion Y540-17IRH AU Optronics B173HAN04.4 (AUO449D), IPS, 17.30, 1920x1080 | Asus TUF FX705DT-AU068T AU Optronics B173HAN04.2, IPS, 17.30, 1920x1080 | |
|---|---|---|---|---|---|---|
| Display | 57% | 51% | 53% | 68% | 52% | |
| Display P3 Coverage | 40.55 | 63.4 56% | 61.9 53% | 63.3 56% | 69 70% | 62.3 54% |
| sRGB Coverage | 59.7 | 94.9 59% | 89.6 50% | 90.2 51% | 98.3 65% | 89.1 49% |
| AdobeRGB 1998 Coverage | 41.89 | 65.1 55% | 63.2 51% | 64.3 53% | 70.7 69% | 63.7 52% |
| Response Times | 59% | 30% | -22% | 27% | -70% | |
| Response Time Grey 50% / Grey 80% * | 22.4 ? | 8 ? 64% | 17.2 ? 23% | 31.6 ? -41% | 18 ? 20% | 41 ? -83% |
| Response Time Black / White * | 19.2 ? | 8.8 ? 54% | 12 ? 37% | 19.6 ? -2% | 12.8 ? 33% | 30 ? -56% |
| PWM Frequency | 25510 ? | |||||
| Screen | 26% | 2% | 6% | 18% | 14% | |
| Brightness middle | 264.8 | 420 59% | 308.6 17% | 299.6 13% | 286 8% | 316 19% |
| Brightness | 253 | 393 55% | 299 18% | 285 13% | 282 11% | 294 16% |
| Brightness Distribution | 90 | 91 1% | 92 2% | 86 -4% | 87 -3% | 84 -7% |
| Black Level * | 0.31 | 0.32 -3% | 0.29 6% | 0.33 -6% | 0.19 39% | 0.32 -3% |
| Contrast | 854 | 1313 54% | 1064 25% | 908 6% | 1505 76% | 988 16% |
| Colorchecker dE 2000 * | 4.73 | 3.04 36% | 4.26 10% | 3.68 22% | 3.57 25% | 3.39 28% |
| Colorchecker dE 2000 max. * | 18.89 | 7.22 62% | 7.83 59% | 8.05 57% | 7.5 60% | 5.56 71% |
| Colorchecker dE 2000 calibrated * | 4.64 | 0.89 81% | 2.93 37% | 3.15 32% | 1.31 72% | 2.14 54% |
| Greyscale dE 2000 * | 1.4 | 3.91 -179% | 5 -257% | 3.8 -171% | 4.51 -222% | 3.17 -126% |
| Gamma | 2.16 102% | 2.26 97% | 2.07 106% | 2.12 104% | 2.36 93% | 2.39 92% |
| CCT | 6641 98% | 7138 91% | 7488 87% | 7240 90% | 7411 88% | 7098 92% |
| Color Space (Percent of AdobeRGB 1998) | 38.4 | 60 56% | 57.8 51% | 58.1 51% | 64 67% | 51 33% |
| Color Space (Percent of sRGB) | 59.3 | 95 60% | 89.2 50% | 89.8 51% | 98 65% | 89 50% |
| Total Average (Program / Settings) | 47% /
36% | 28% /
15% | 12% /
11% | 38% /
28% | -1% /
10% |
* ... smaller is better
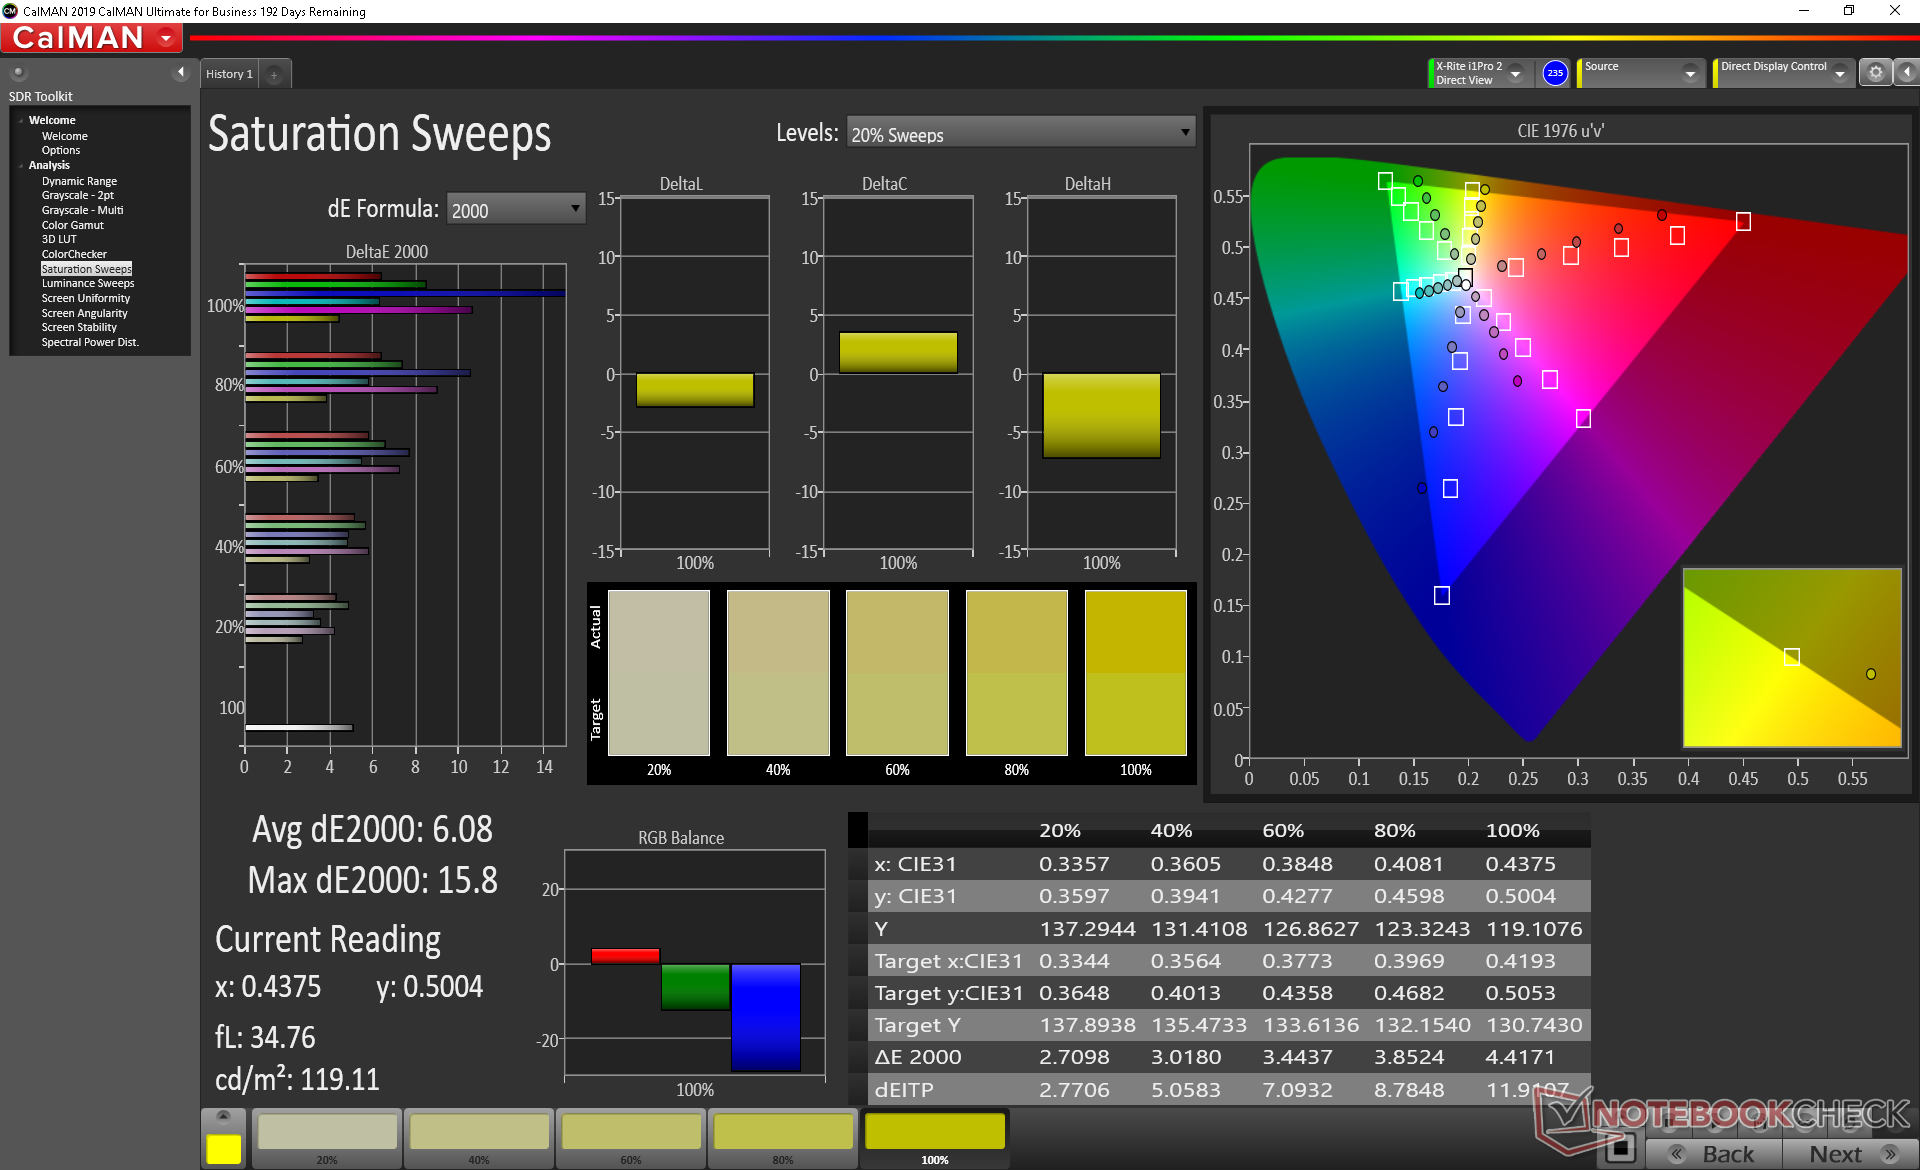
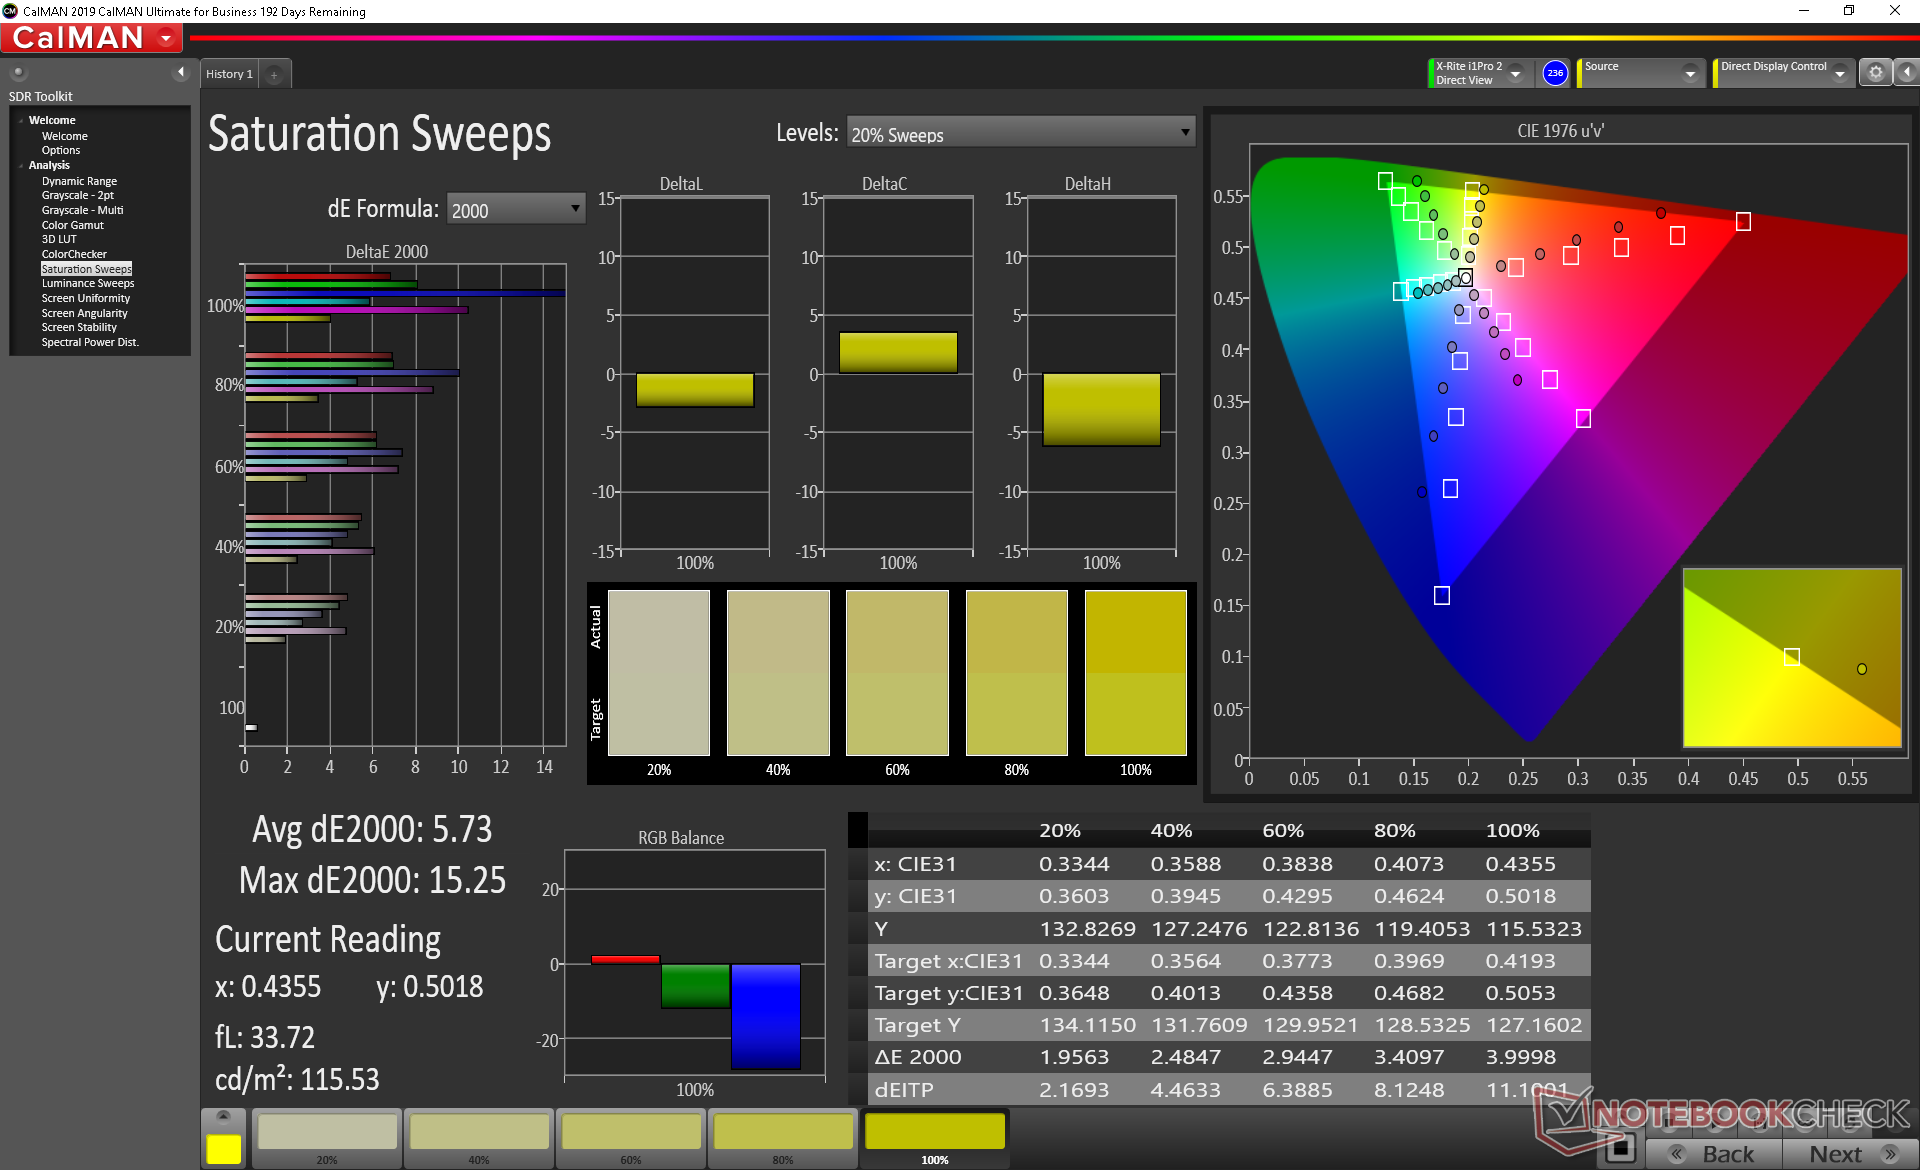
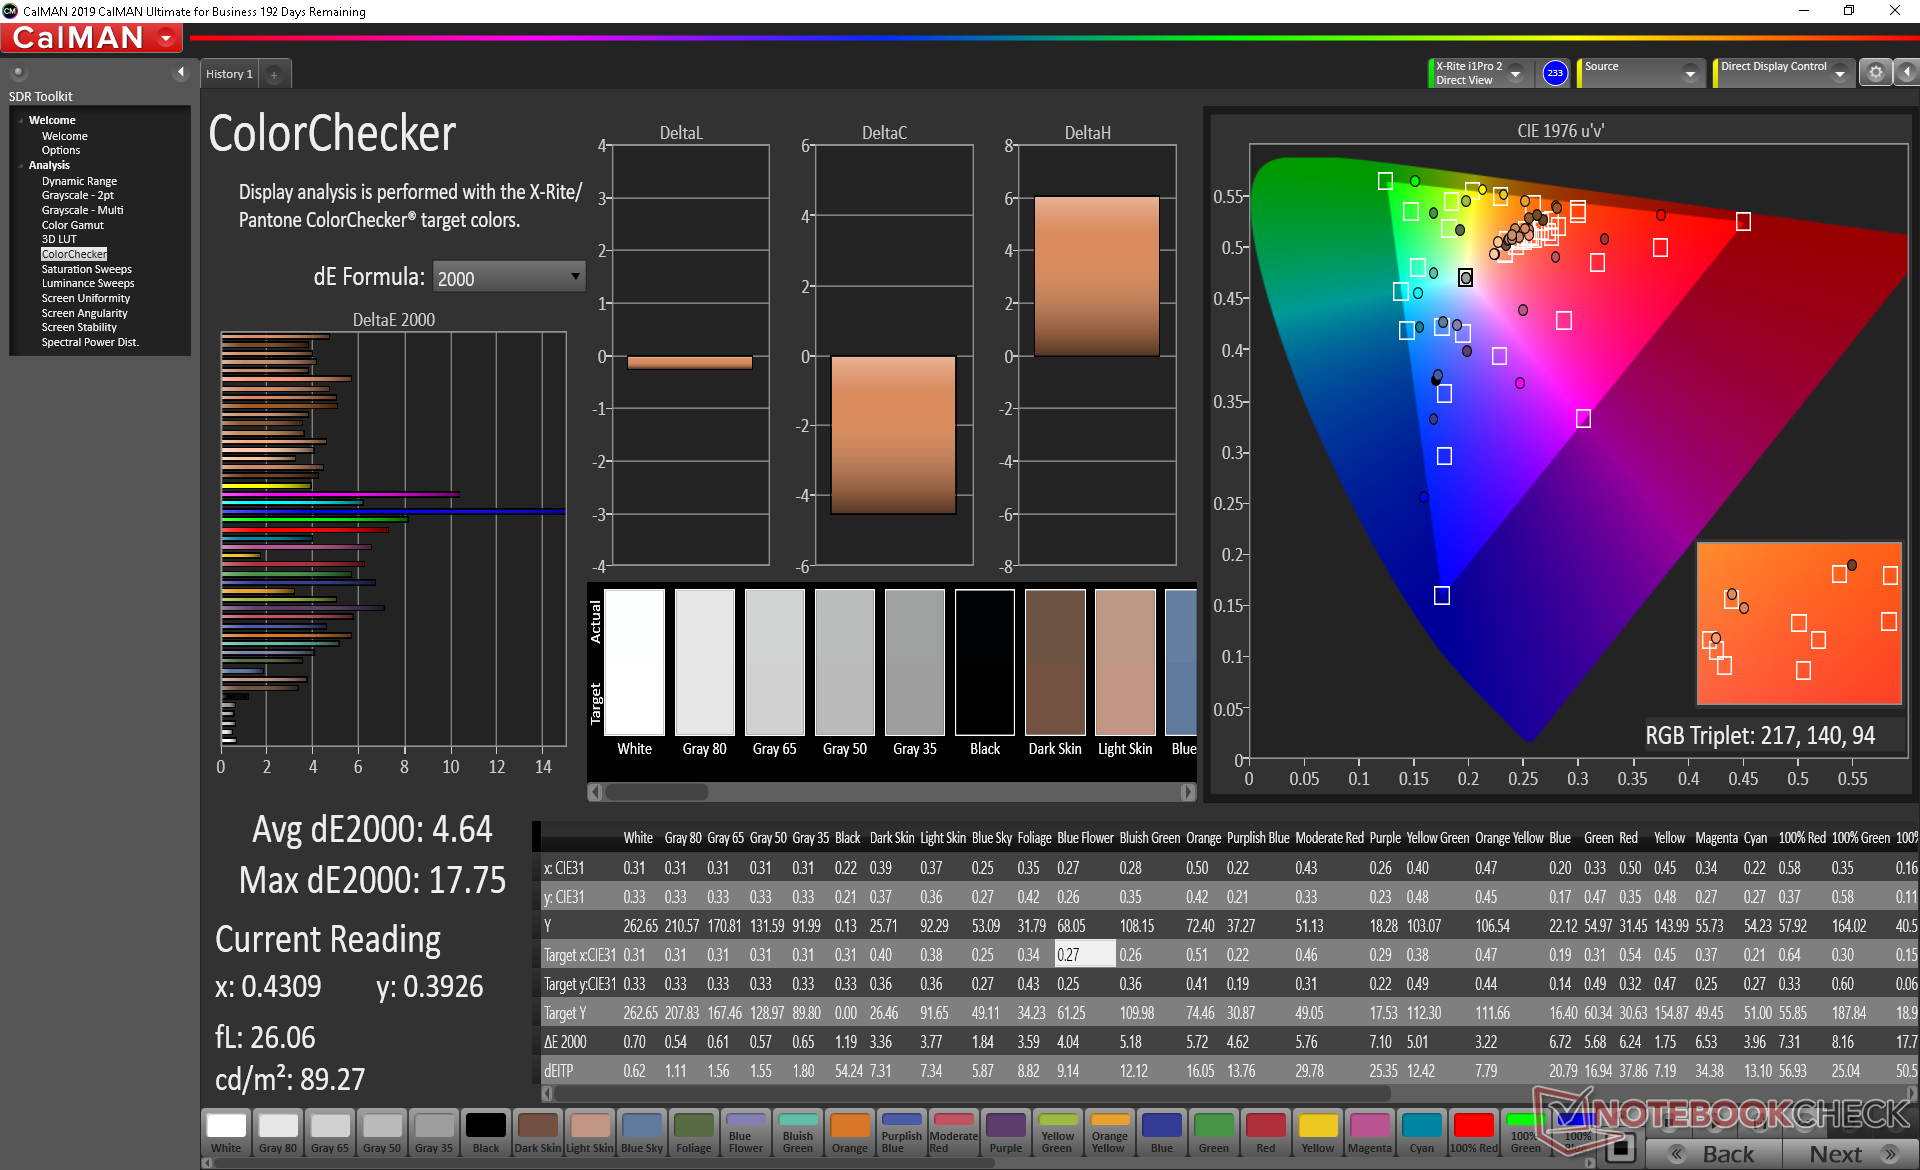
Color space covers just 59 percent of sRGB compared to >90 percent on most Ultrabooks and pricier gaming laptops including Asus' own ROG Zephyrus models. It's a cut corner in order to keep prices low for the budget-oriented TUF series. Digital artists will want to invest in the ZenBook Pro, Zephyrus series, or ProArt StudioBook series instead where more color-accurate options are available.
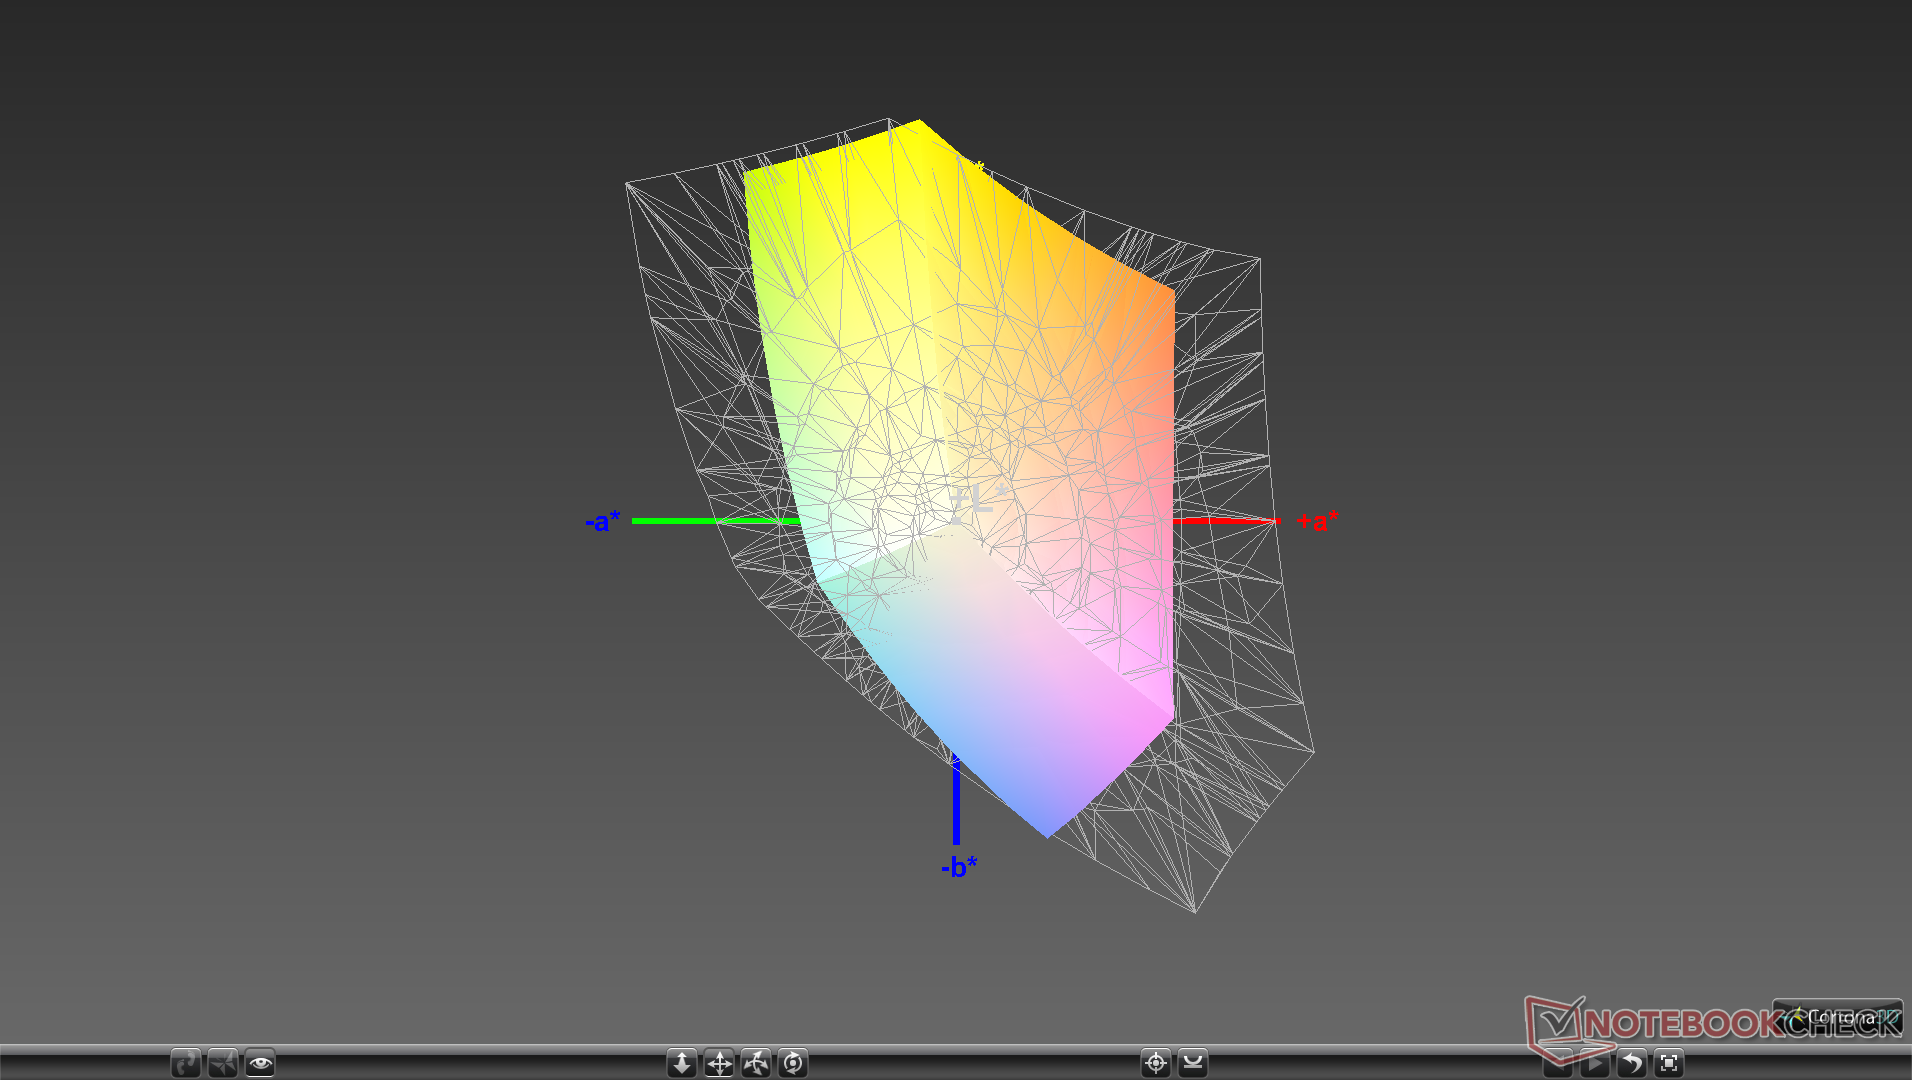
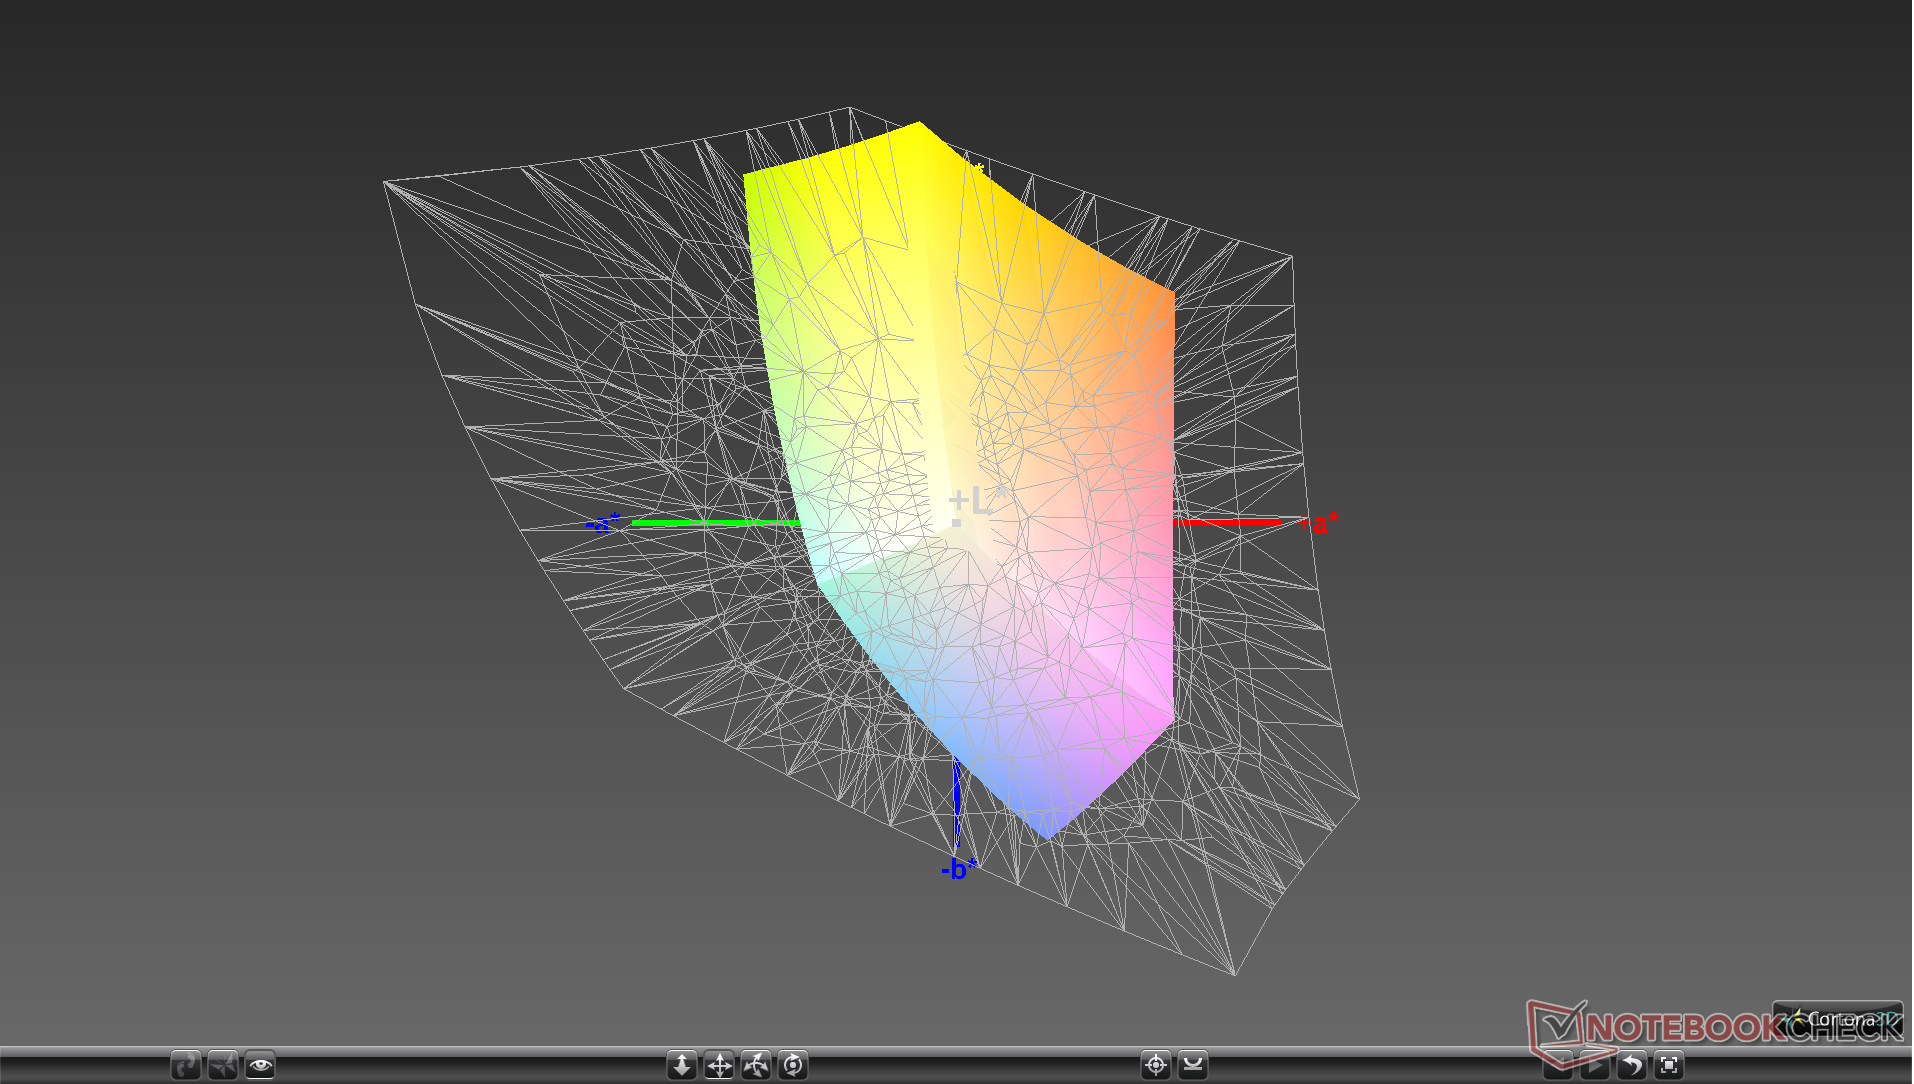
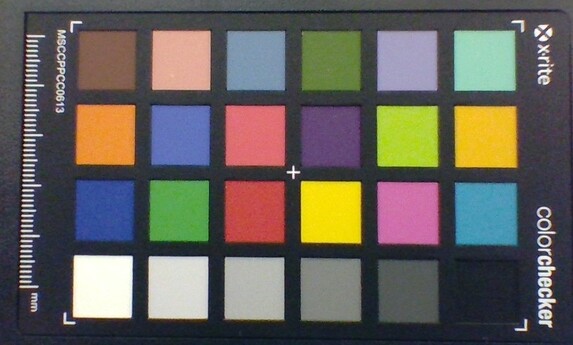
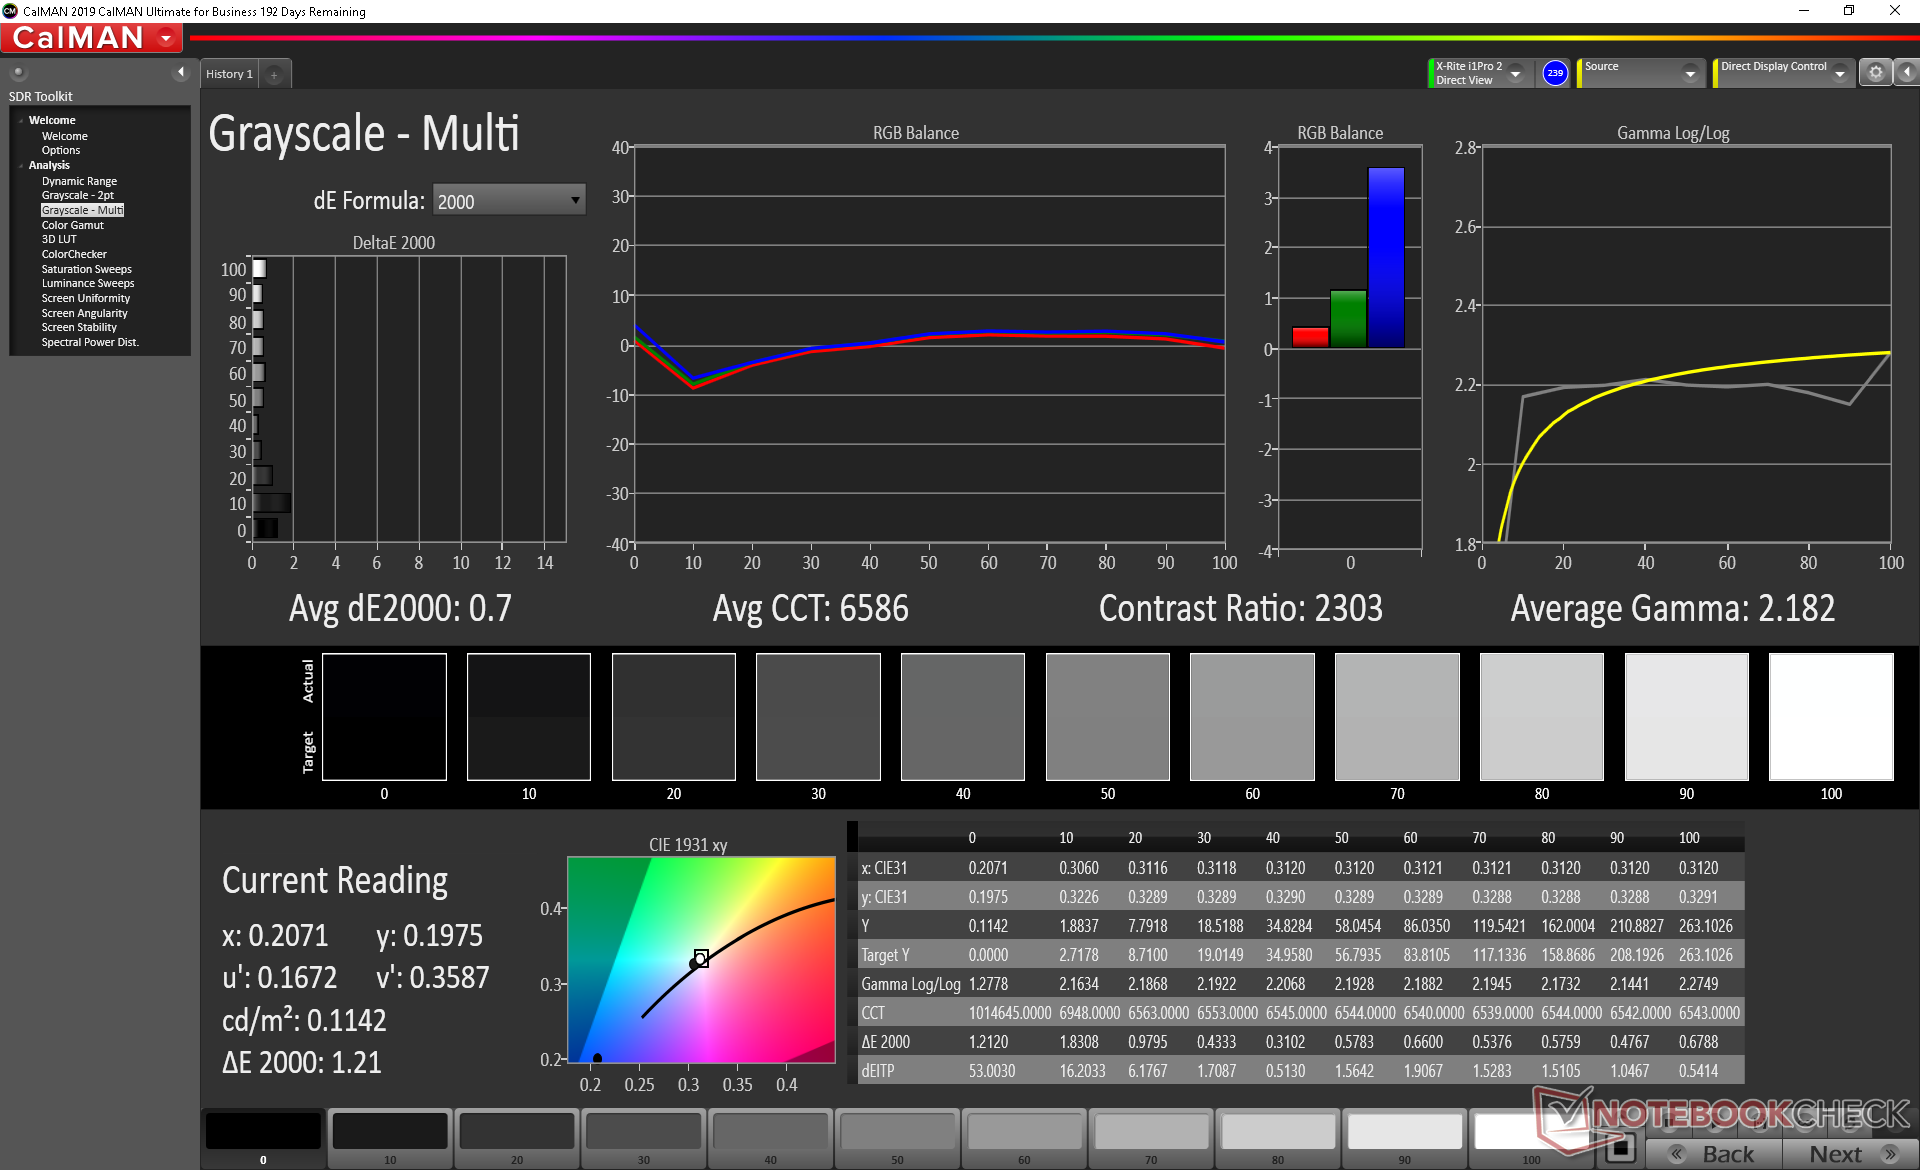
Further measurements with an X-Rite colorimeter show a well-calibrated display out-of-the-box. Calibrating the display even further ourselves would result in only minimal changes in DeltaE values. Keep in mind that colors become increasingly inaccurate at higher saturation levels since the color space of the panel is so narrow. Blue is represented least accurately out of all the tested colors.
Display Response Times
| ↔ Response Time Black to White | ||
|---|---|---|
| 19.2 ms ... rise ↗ and fall ↘ combined | ↗ 9.6 ms rise | 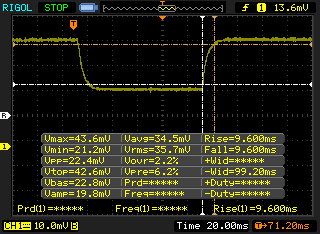 |
| ↘ 9.6 ms fall | ||
| The screen shows good response rates in our tests, but may be too slow for competitive gamers. In comparison, all tested devices range from 0.1 (minimum) to 240 (maximum) ms. » 36 % of all devices are better. This means that the measured response time is better than the average of all tested devices (21.5 ms). | ||
| ↔ Response Time 50% Grey to 80% Grey | ||
| 22.4 ms ... rise ↗ and fall ↘ combined | ↗ 11.6 ms rise | 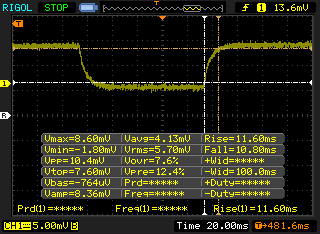 |
| ↘ 10.8 ms fall | ||
| The screen shows good response rates in our tests, but may be too slow for competitive gamers. In comparison, all tested devices range from 0.2 (minimum) to 636 (maximum) ms. » 28 % of all devices are better. This means that the measured response time is better than the average of all tested devices (33.7 ms). | ||
Screen Flickering / PWM (Pulse-Width Modulation)
| Screen flickering / PWM not detected | 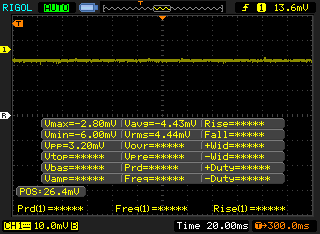 | ||
In comparison: 53 % of all tested devices do not use PWM to dim the display. If PWM was detected, an average of 17900 (minimum: 5 - maximum: 3846000) Hz was measured. | |||
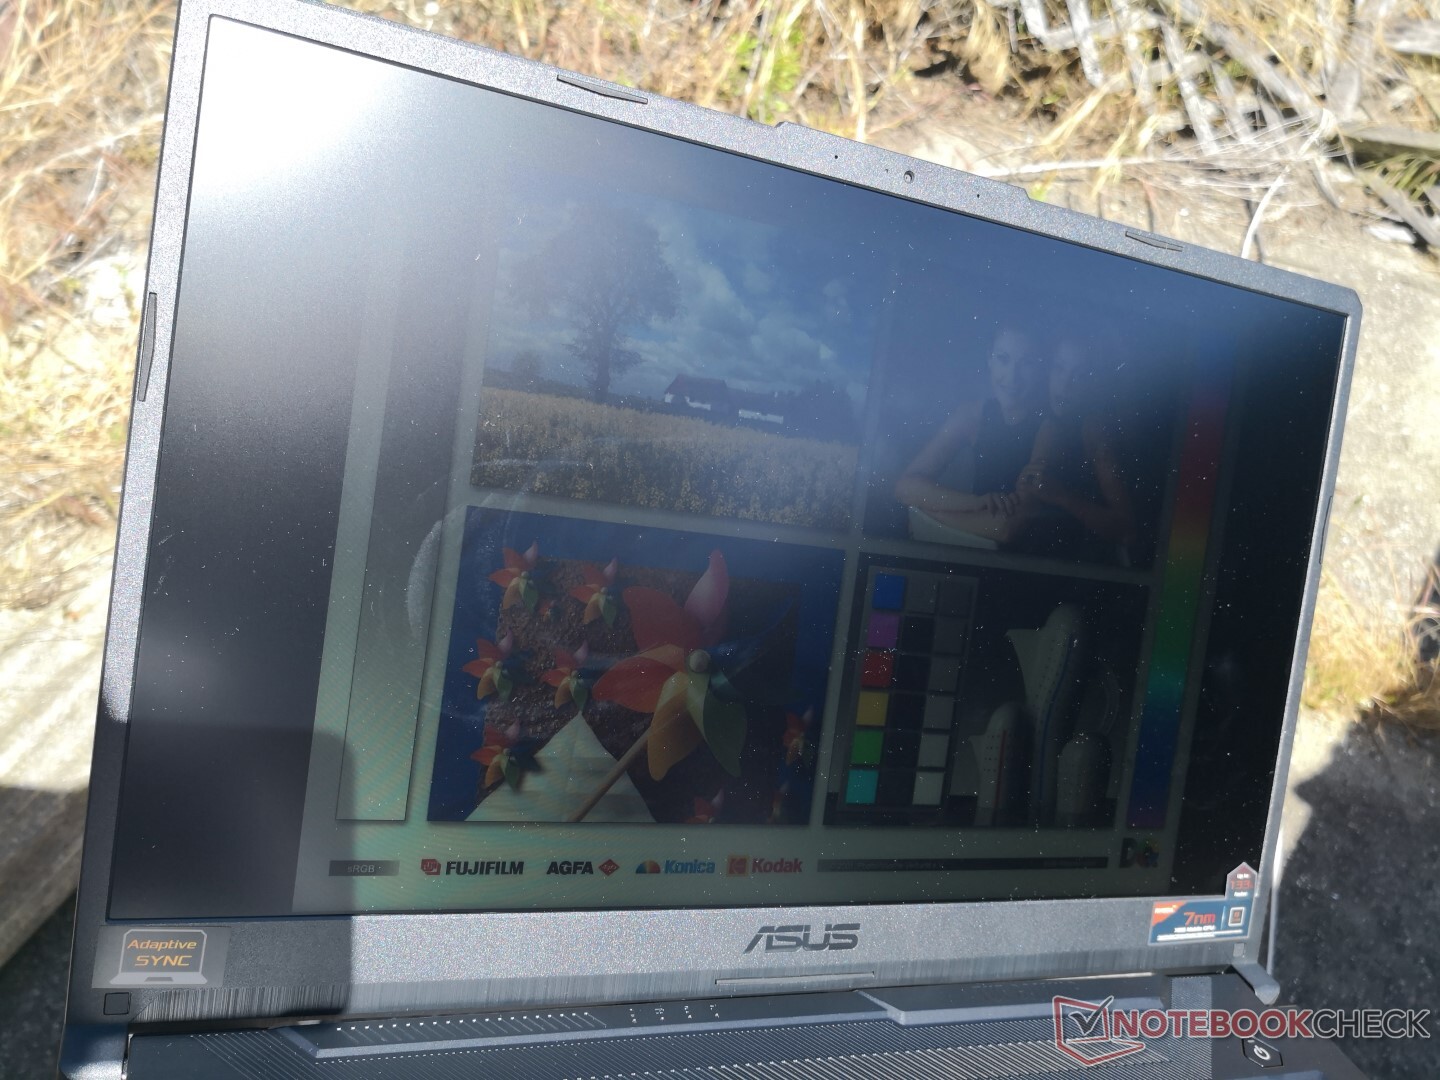
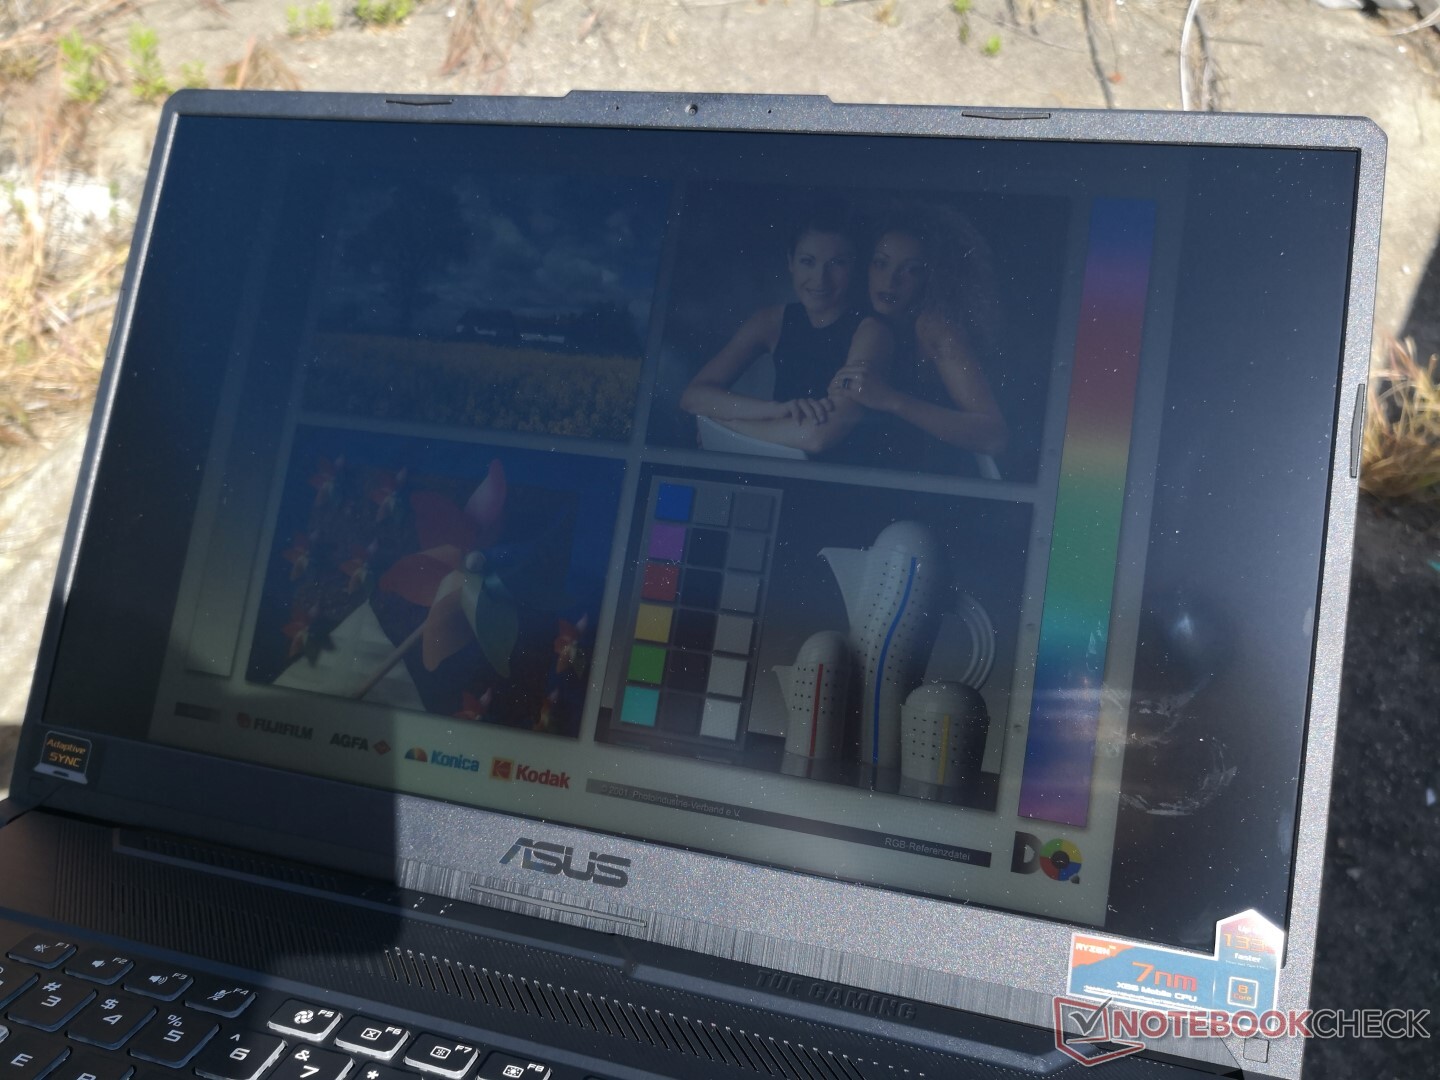
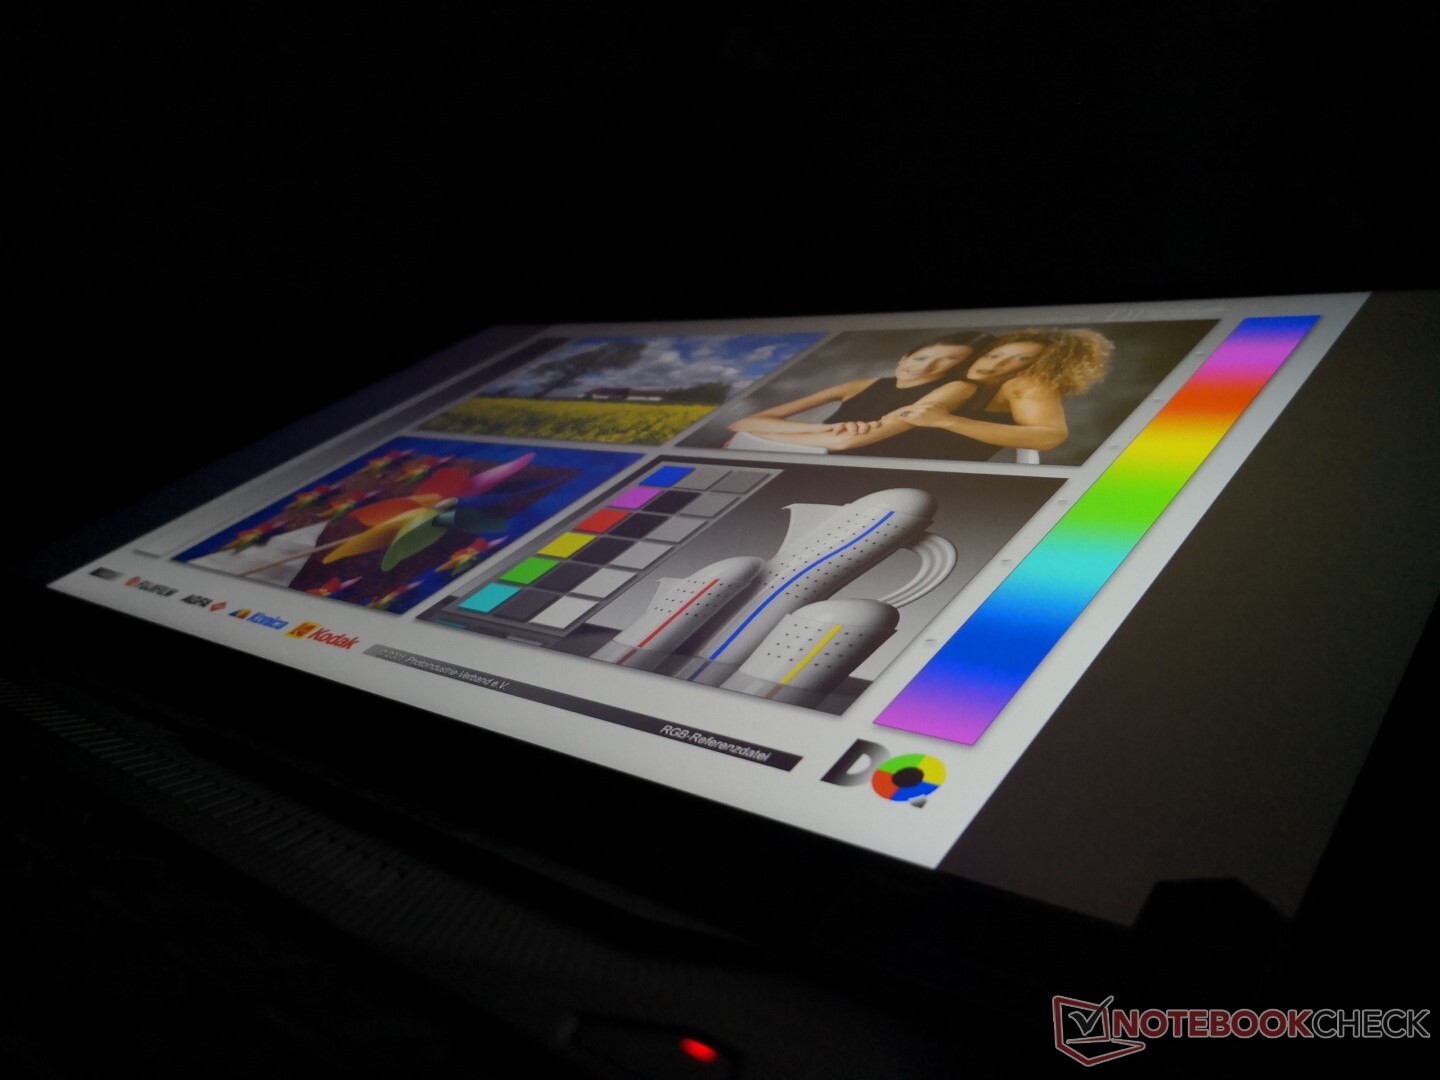
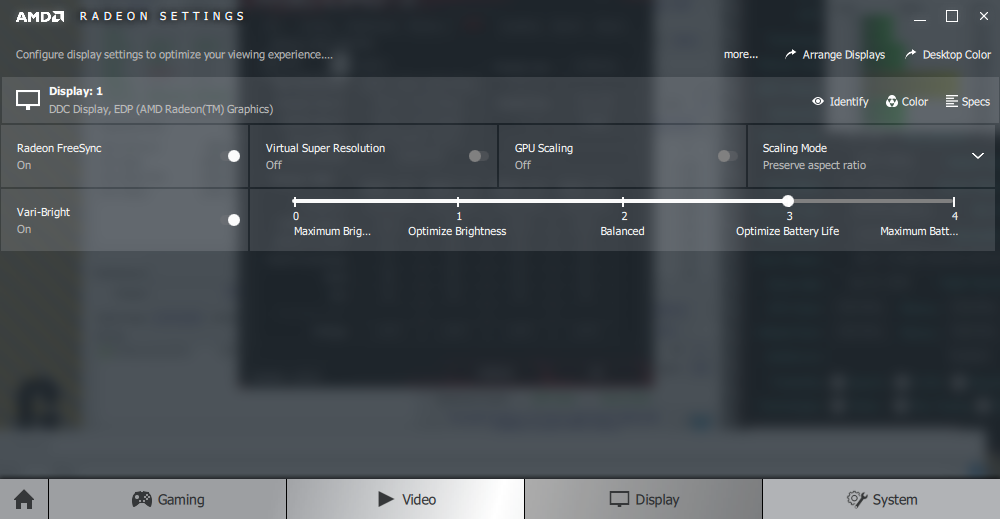
Outdoor visibility is average at best not unlike most other 17.3-inch gaming laptops. Remember to disable AMD Vari-Bright or else the maximum brightness of the display will drop to just 155 nits when running on battery power. You're going to want the display to be as bright as it can be if working outside.

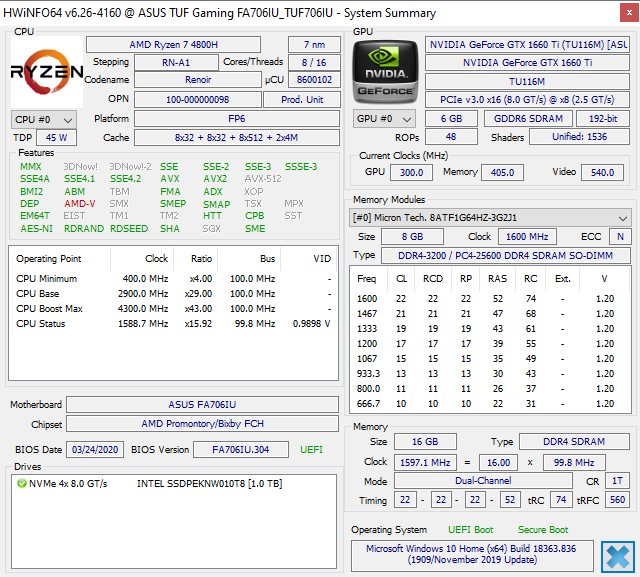
Performance — Like a Core i9 But Much Cheaper
Whereas the 12 nm Zen+ Ryzen 5 3550H and Ryzen 7 3750H on older TUF laptops were only comparable to the Intel Core i5 series, the new 7 nm Renoir Ryzen 5 4600H and Ryzen 7 4800H are much more powerful to the point where they can outperform the Intel Core i7 and even Core i9 in some cases. These are extremely fast CPU options relative to the budget GTX 1650 or GTX 1660 Ti graphics that power the 17.3-inch TUF series.
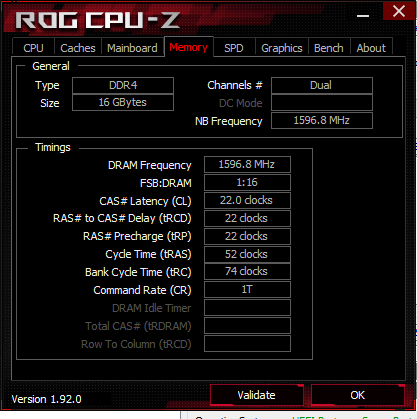
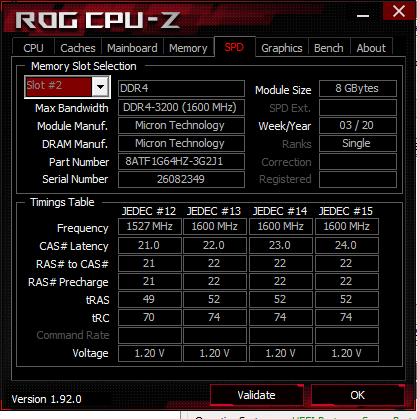
RAM is configurable up to 32 GB of DDR4-3200. Both Nvidia Optimus and adaptive sync are supported simultaneously. The integrated Radeon GPU is actually quite fast, but it's power is largely useless since you will be gaming on the discrete GPU anyway.
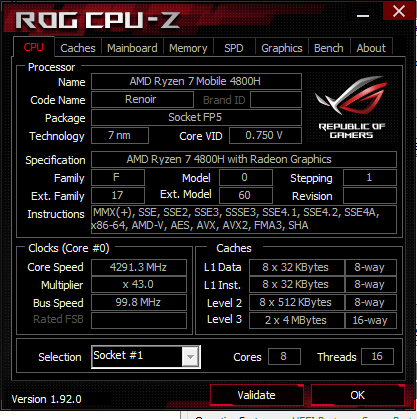
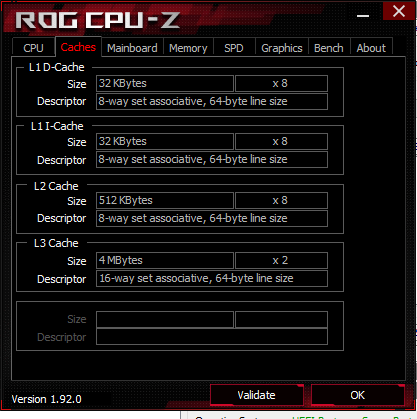
Processor
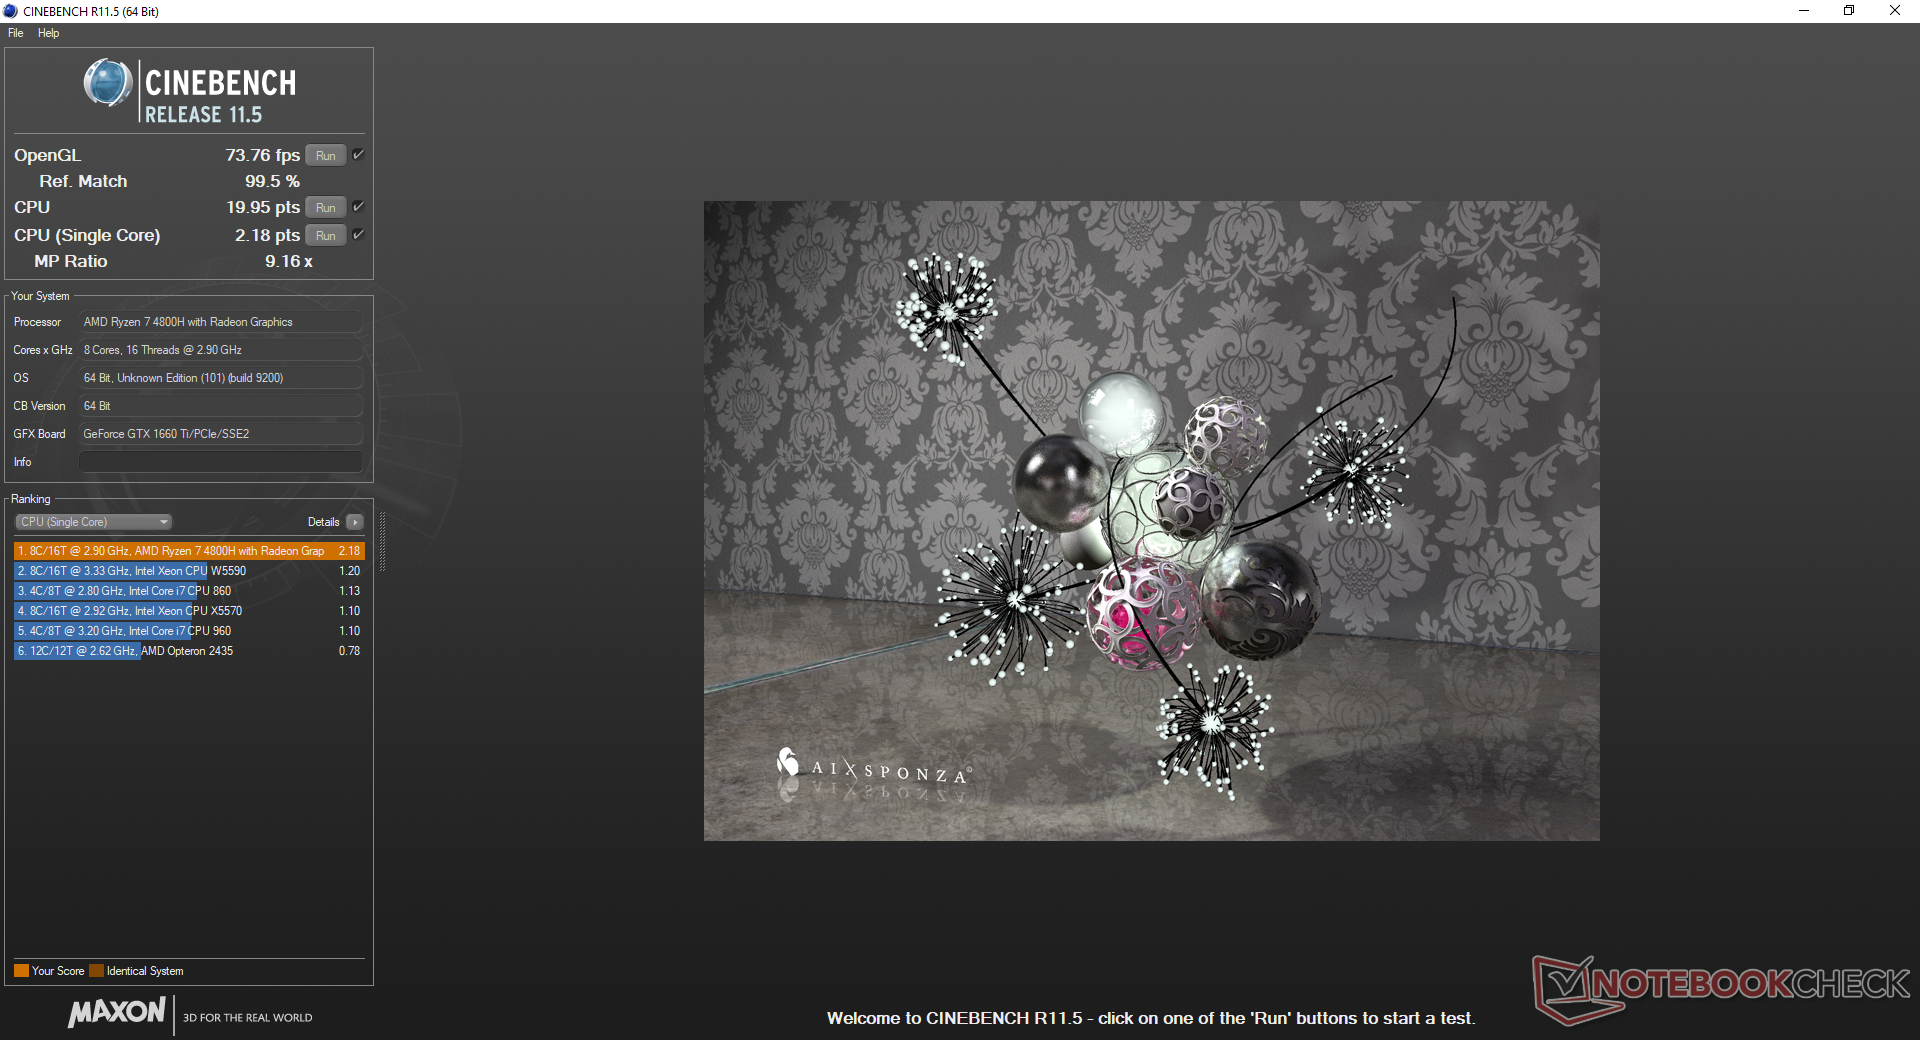
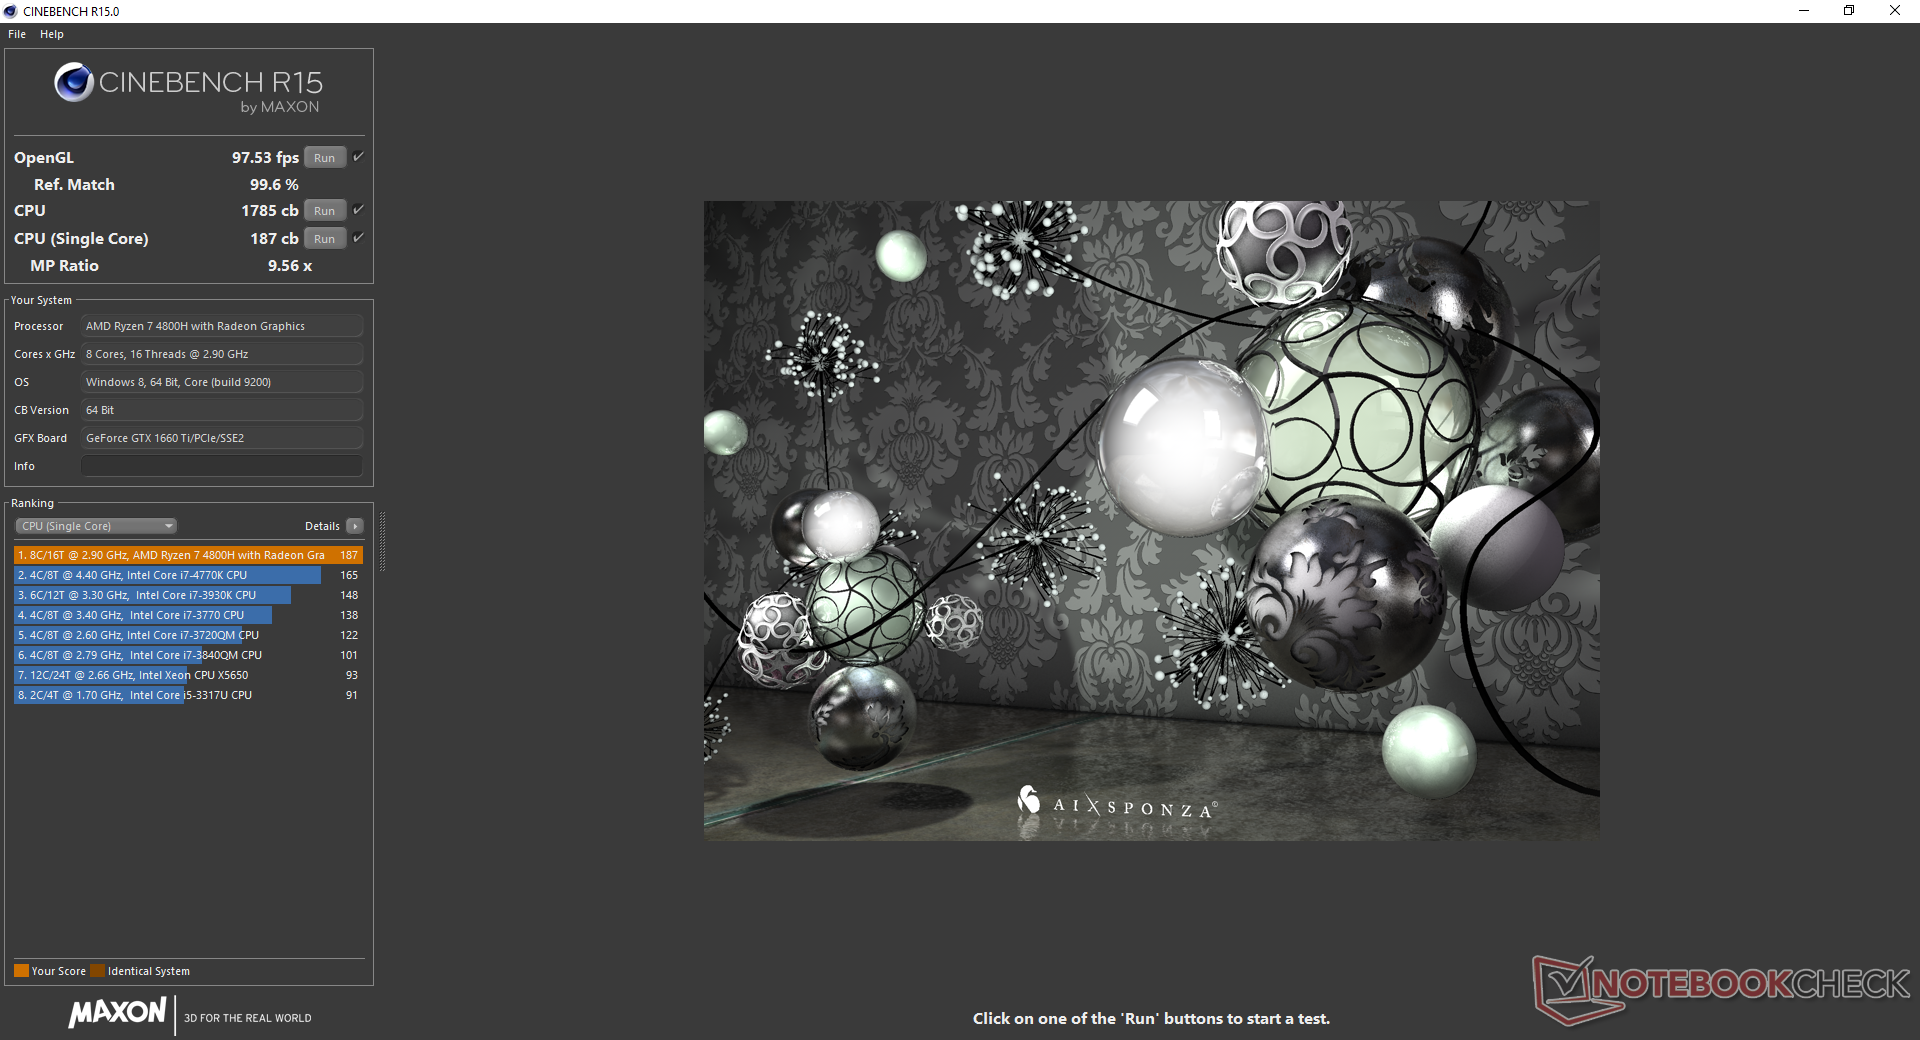
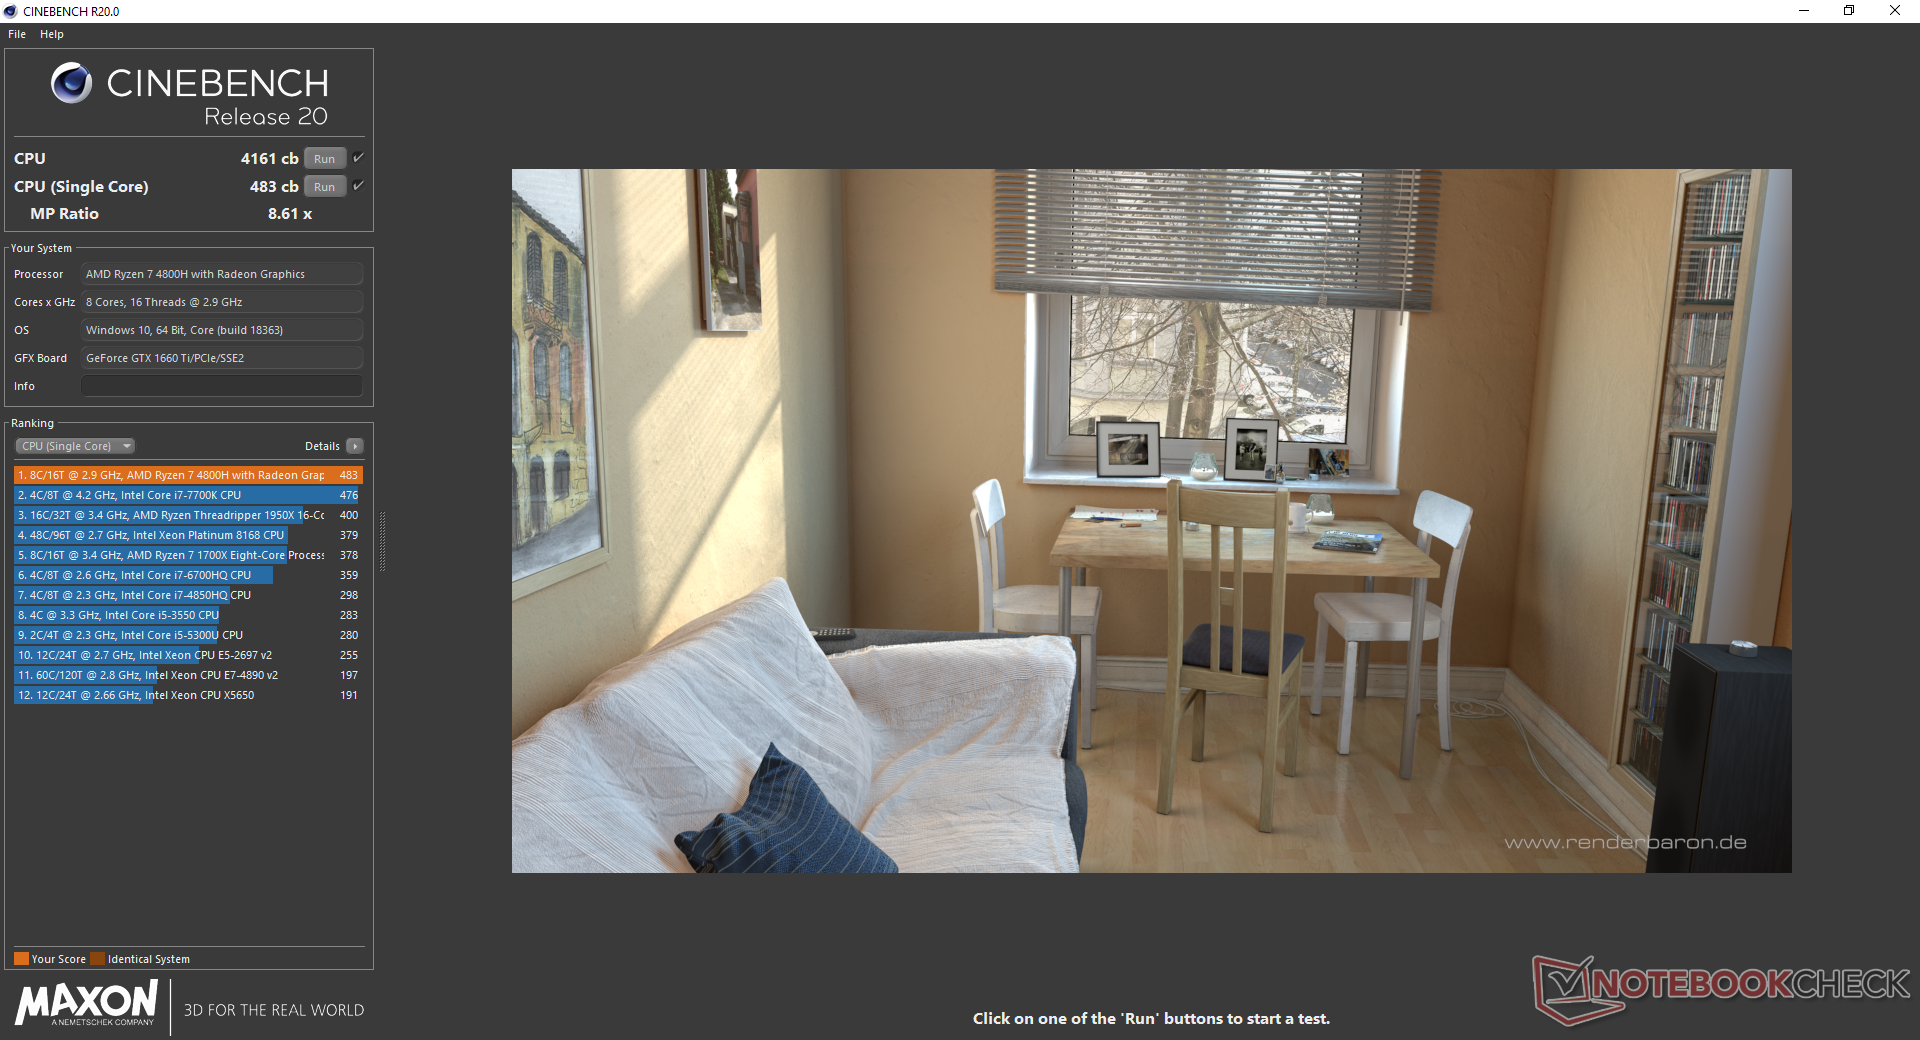
AMD's octa-core Ryzen 7 4800H competes directly with Intel's 10th gen Comet lake-H Core i7-10875H as found on some high-end multimedia/gaming laptops like the Gigabyte Aero 17 or Razer Blade 15. Though it's still too soon for an overall verdict, results from early retail units show the AMD chip outperforming the Intel part by 7 to 20 percent in multi-threaded workloads while running slower in single-threaded workloads by about 5 to 10 percent. Results are even faster or on par with the Core i9-10980HK or Core i9-9880H in some cases. We would need a lot more samples to get a bigger picture in the months to come, but there's no denying AMD's strong start out of the gate.
When compared to the Core i7-9750H, Core i7-10750H, or Ryzen 7 3750H, the Ryzen 7 4800H outperforms them all even in single-threaded loads and with excellent performance sustainability over long periods as well. See our dedicated page on the Ryzen 7 4800H for more technical information and benchmarks.
Cinebench R15: CPU Multi 64Bit | CPU Single 64Bit
Blender: v2.79 BMW27 CPU
7-Zip 18.03: 7z b 4 -mmt1 | 7z b 4
Geekbench 5.5: Single-Core | Multi-Core
HWBOT x265 Benchmark v2.2: 4k Preset
LibreOffice : 20 Documents To PDF
R Benchmark 2.5: Overall mean
| Cinebench R20 / CPU (Multi Core) | |
| Eurocom Sky X4C i9-9900KS | |
| Asus Zephyrus G14 GA401IV | |
| Average AMD Ryzen 7 4800H (3692 - 4663, n=18) | |
| Asus TUF A17 FA706IU-AS76 | |
| MSI GS66 Stealth 10SFS | |
| MSI GE65 Raider 9SF-049US | |
| Intel Core i5-10600K | |
| Gigabyte Aero 17 HDR XB | |
| MSI GS66 10SGS | |
| Average Intel Core i7-9750H (2017 - 3133, n=55) | |
| Gigabyte Aero 15-Y9 | |
| Asus ROG Zephyrus S GX701GXR | |
| Asus ROG Zephyrus G15 GA502DU | |
| MSI GF63 Thin 9SC | |
| Asus TUF FX705DT-AU068T | |
| Cinebench R20 / CPU (Single Core) | |
| Eurocom Sky X4C i9-9900KS | |
| Gigabyte Aero 17 HDR XB | |
| Asus Zephyrus G14 GA401IV | |
| Average AMD Ryzen 7 4800H (462 - 491, n=17) | |
| MSI GS66 Stealth 10SFS | |
| Asus TUF A17 FA706IU-AS76 | |
| MSI GE65 Raider 9SF-049US | |
| Intel Core i5-10600K | |
| MSI GS66 10SGS | |
| Average Intel Core i7-9750H (416 - 486, n=55) | |
| Asus ROG Zephyrus S GX701GXR | |
| MSI GF63 Thin 9SC | |
| Gigabyte Aero 15-Y9 | |
| Asus TUF FX705DT-AU068T | |
| Asus ROG Zephyrus G15 GA502DU | |
| Cinebench R15 / CPU Multi 64Bit | |
| Eurocom Sky X4C i9-9900KS | |
| Asus Zephyrus G14 GA401IV | |
| Average AMD Ryzen 7 4800H (1652 - 1995, n=21) | |
| Asus TUF A17 FA706IU-AS76 | |
| Gigabyte Aero 17 HDR XB | |
| MSI GS66 Stealth 10SFS | |
| MSI GE65 Raider 9SF-049US | |
| Intel Core i5-10600K | |
| MSI GS66 10SGS | |
| Gigabyte Aero 15-Y9 | |
| Average Intel Core i7-9750H (952 - 1306, n=85) | |
| Asus ROG Zephyrus S GX701GXR | |
| Asus ROG Zephyrus G15 GA502DU | |
| MSI GF63 Thin 9SC | |
| Asus TUF FX705DT-AU068T | |
| Cinebench R15 / CPU Single 64Bit | |
| Eurocom Sky X4C i9-9900KS | |
| Gigabyte Aero 17 HDR XB | |
| Intel Core i5-10600K | |
| MSI GS66 Stealth 10SFS | |
| MSI GE65 Raider 9SF-049US | |
| Gigabyte Aero 15-Y9 | |
| Asus Zephyrus G14 GA401IV | |
| Asus TUF A17 FA706IU-AS76 | |
| MSI GS66 10SGS | |
| Average AMD Ryzen 7 4800H (186 - 191, n=15) | |
| Average Intel Core i7-9750H (170 - 194, n=82) | |
| Asus ROG Zephyrus S GX701GXR | |
| MSI GF63 Thin 9SC | |
| Asus TUF FX705DT-AU068T | |
| Asus ROG Zephyrus G15 GA502DU | |
| Blender / v2.79 BMW27 CPU | |
| Asus ROG Zephyrus G15 GA502DU | |
| Average Intel Core i7-9750H (342 - 495, n=21) | |
| MSI GS66 10SGS | |
| Gigabyte Aero 17 HDR XB | |
| Intel Core i5-10600K | |
| Asus Zephyrus G14 GA401IV | |
| MSI GS66 Stealth 10SFS | |
| Asus TUF A17 FA706IU-AS76 | |
| Average AMD Ryzen 7 4800H (248 - 299, n=15) | |
| Eurocom Sky X4C i9-9900KS | |
| 7-Zip 18.03 / 7z b 4 -mmt1 | |
| Eurocom Sky X4C i9-9900KS | |
| Gigabyte Aero 17 HDR XB | |
| Intel Core i5-10600K | |
| MSI GS66 Stealth 10SFS | |
| MSI GS66 10SGS | |
| Average Intel Core i7-9750H (4580 - 5090, n=21) | |
| Asus TUF A17 FA706IU-AS76 | |
| Average AMD Ryzen 7 4800H (4575 - 4743, n=15) | |
| Asus Zephyrus G14 GA401IV | |
| Asus ROG Zephyrus G15 GA502DU | |
| 7-Zip 18.03 / 7z b 4 | |
| Eurocom Sky X4C i9-9900KS | |
| Average AMD Ryzen 7 4800H (44827 - 53883, n=15) | |
| Asus TUF A17 FA706IU-AS76 | |
| Asus Zephyrus G14 GA401IV | |
| Gigabyte Aero 17 HDR XB | |
| MSI GS66 Stealth 10SFS | |
| Intel Core i5-10600K | |
| MSI GS66 10SGS | |
| Average Intel Core i7-9750H (28512 - 35174, n=21) | |
| Asus ROG Zephyrus G15 GA502DU | |
| Geekbench 5.5 / Single-Core | |
| Eurocom Sky X4C i9-9900KS | |
| Intel Core i5-10600K | |
| MSI GS66 Stealth 10SFS | |
| Gigabyte Aero 17 HDR XB | |
| Asus Zephyrus G14 GA401IV | |
| MSI GS66 10SGS | |
| Average Intel Core i7-9750H (1117 - 1251, n=13) | |
| Asus TUF A17 FA706IU-AS76 | |
| Average AMD Ryzen 7 4800H (1154 - 1207, n=17) | |
| Geekbench 5.5 / Multi-Core | |
| Eurocom Sky X4C i9-9900KS | |
| Asus TUF A17 FA706IU-AS76 | |
| Average AMD Ryzen 7 4800H (5920 - 8672, n=17) | |
| Asus Zephyrus G14 GA401IV | |
| MSI GS66 Stealth 10SFS | |
| Gigabyte Aero 17 HDR XB | |
| Intel Core i5-10600K | |
| MSI GS66 10SGS | |
| Average Intel Core i7-9750H (4859 - 6262, n=13) | |
| HWBOT x265 Benchmark v2.2 / 4k Preset | |
| Eurocom Sky X4C i9-9900KS | |
| Average AMD Ryzen 7 4800H (10.8 - 14.1, n=16) | |
| MSI GS66 Stealth 10SFS | |
| Intel Core i5-10600K | |
| Asus TUF A17 FA706IU-AS76 | |
| Asus Zephyrus G14 GA401IV | |
| Gigabyte Aero 17 HDR XB | |
| MSI GS66 10SGS | |
| Average Intel Core i7-9750H (7.1 - 10.7, n=21) | |
| Asus ROG Zephyrus G15 GA502DU | |
| LibreOffice / 20 Documents To PDF | |
| Gigabyte Aero 17 HDR XB | |
| Average AMD Ryzen 7 4800H (28.6 - 95.8, n=14) | |
| Asus TUF A17 FA706IU-AS76 | |
| Average Intel Core i7-9750H (54.5 - 64.7, n=9) | |
| MSI GS66 10SGS | |
| MSI GS66 Stealth 10SFS | |
| Intel Core i5-10600K | |
| R Benchmark 2.5 / Overall mean | |
| Average Intel Core i7-9750H (0.608 - 0.695, n=14) | |
| MSI GS66 10SGS | |
| Asus TUF A17 FA706IU-AS76 | |
| Intel Core i5-10600K | |
| MSI GS66 Stealth 10SFS | |
| Average AMD Ryzen 7 4800H (0.562 - 0.603, n=15) | |
| Gigabyte Aero 17 HDR XB | |
Cinebench R15: CPU Multi 64Bit | CPU Single 64Bit
Blender: v2.79 BMW27 CPU
7-Zip 18.03: 7z b 4 -mmt1 | 7z b 4
Geekbench 5.5: Single-Core | Multi-Core
HWBOT x265 Benchmark v2.2: 4k Preset
LibreOffice : 20 Documents To PDF
R Benchmark 2.5: Overall mean
* ... smaller is better
System Performance
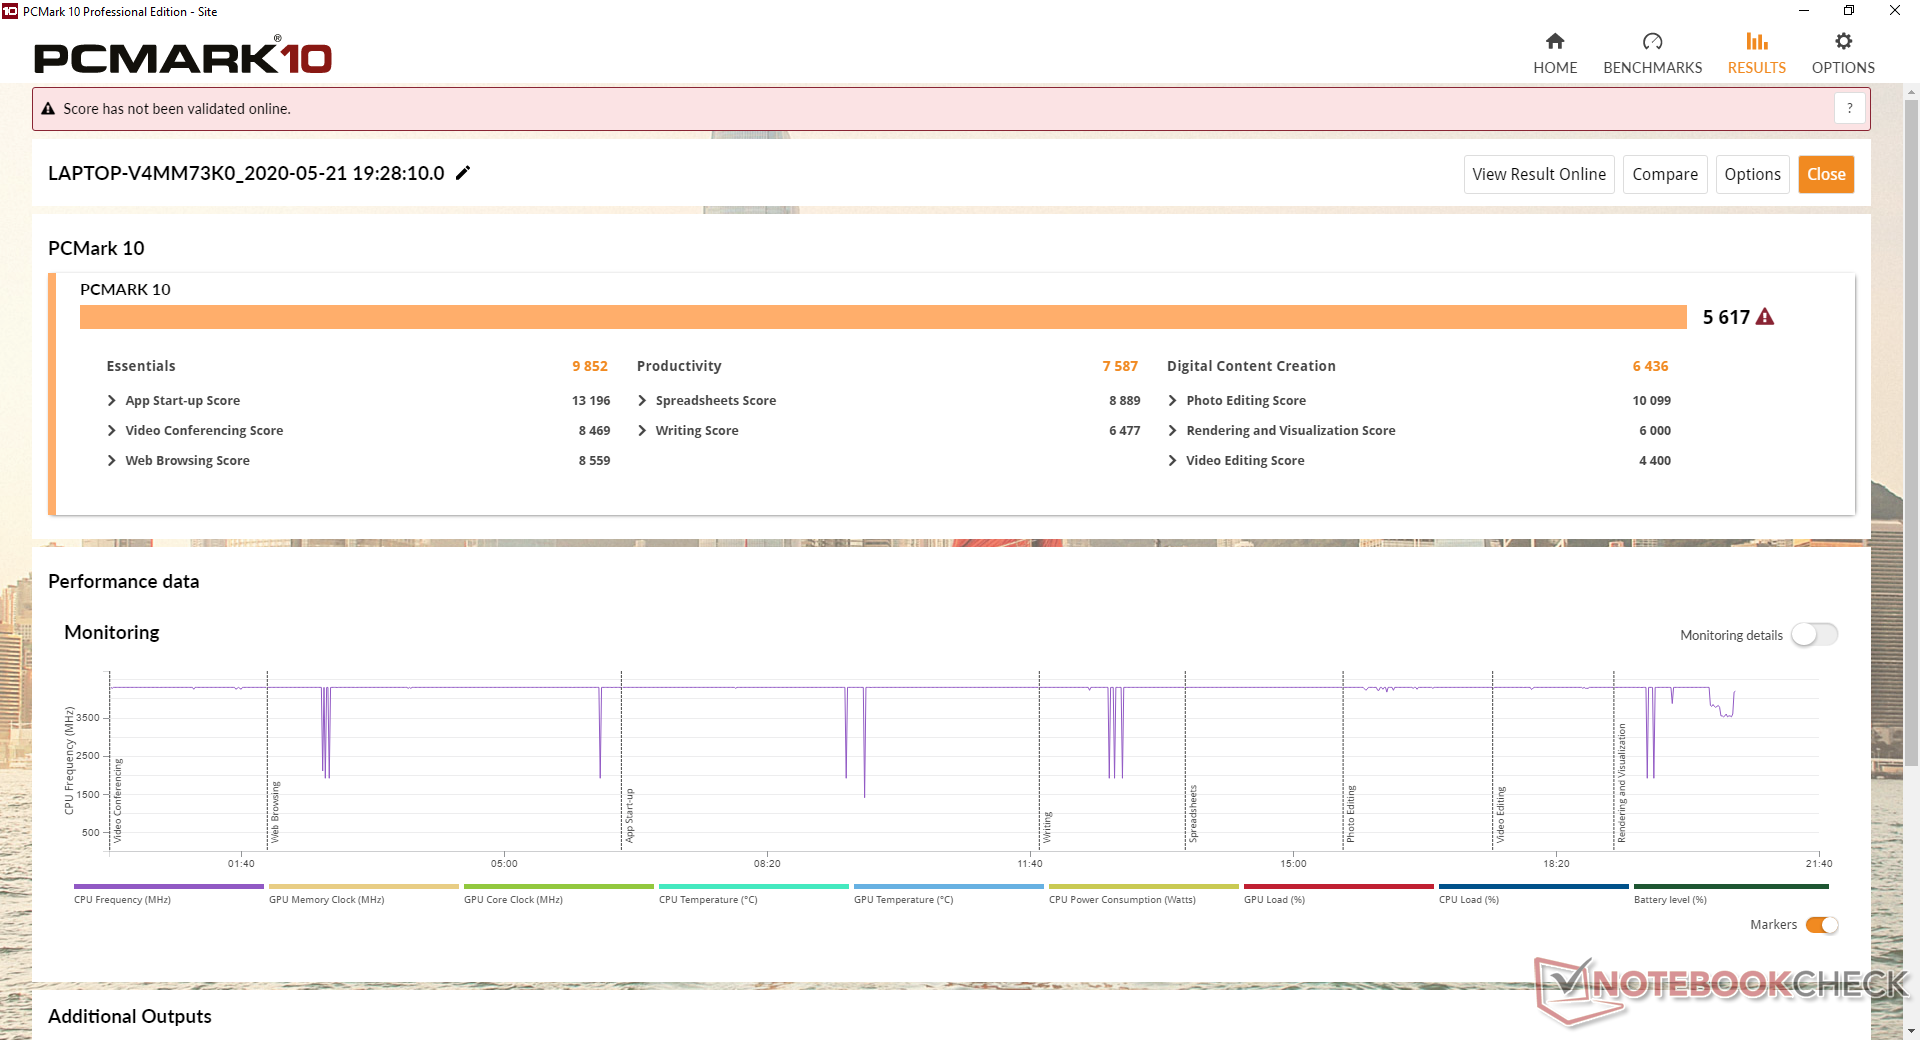
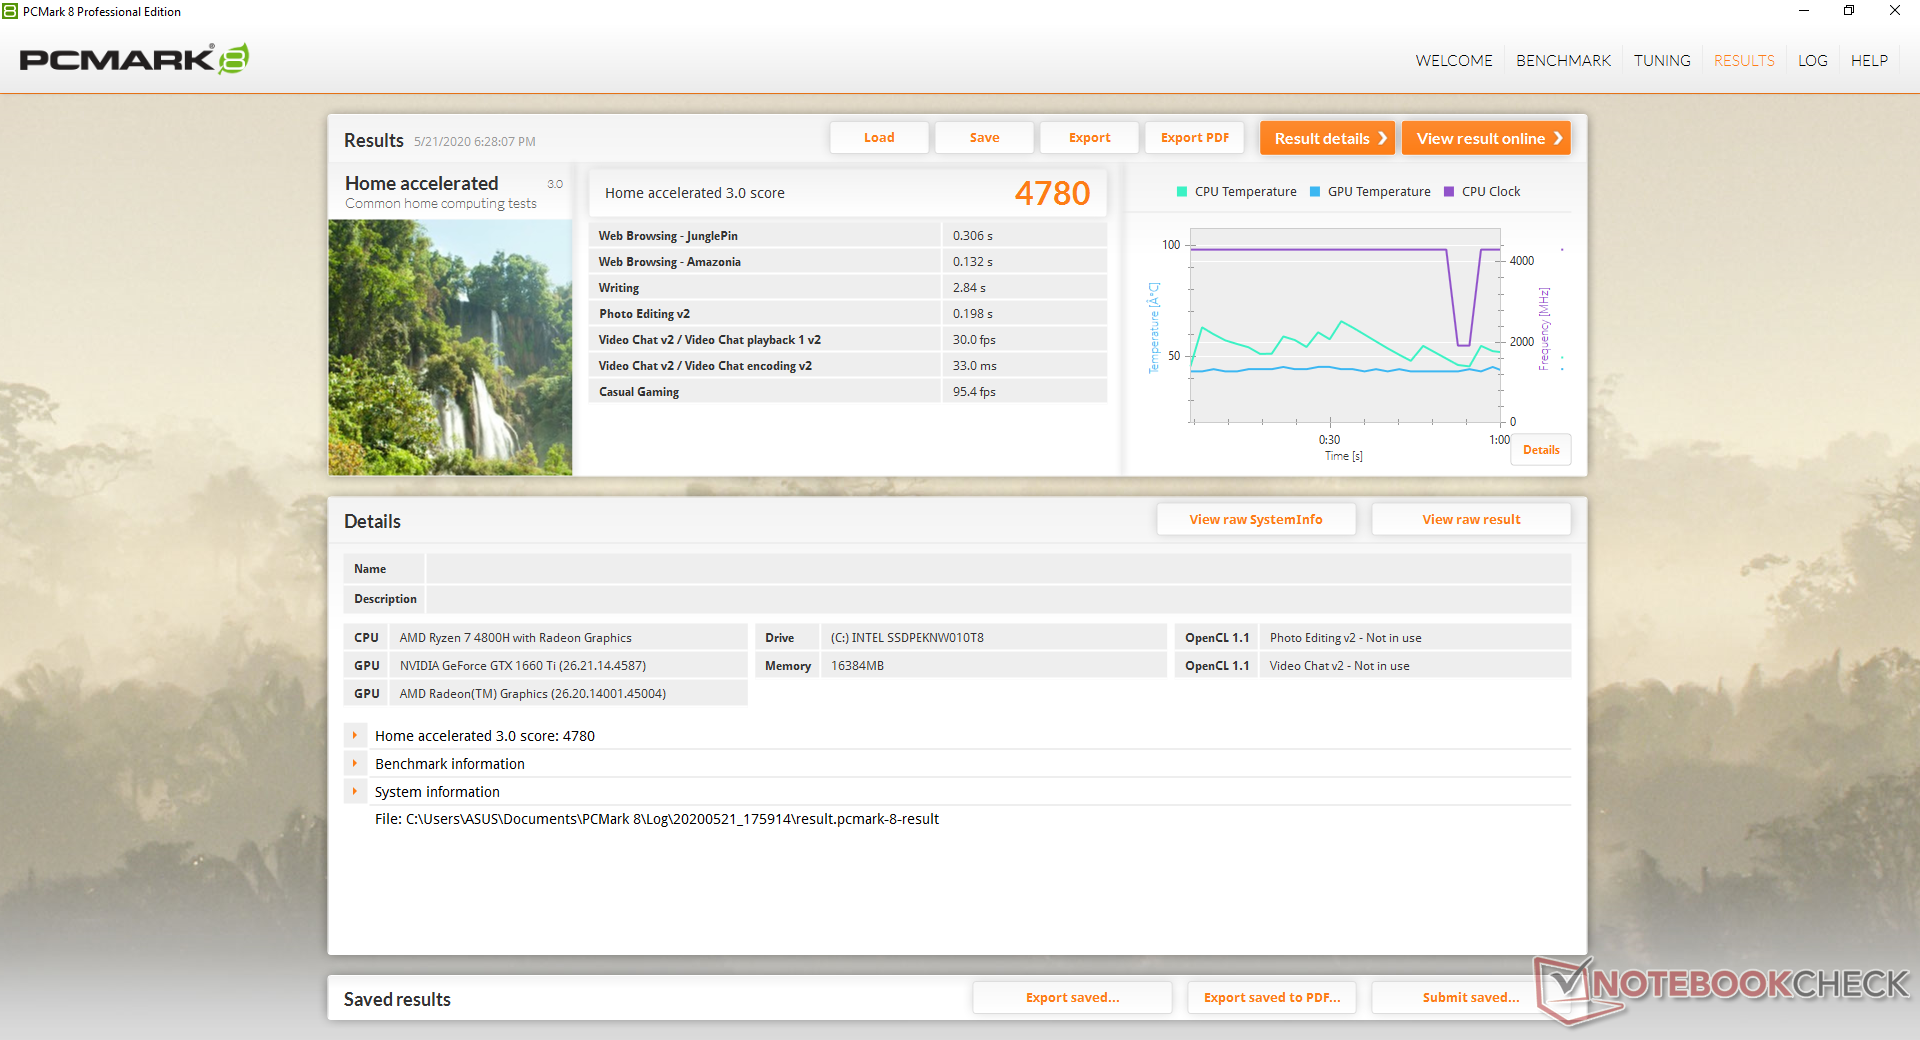
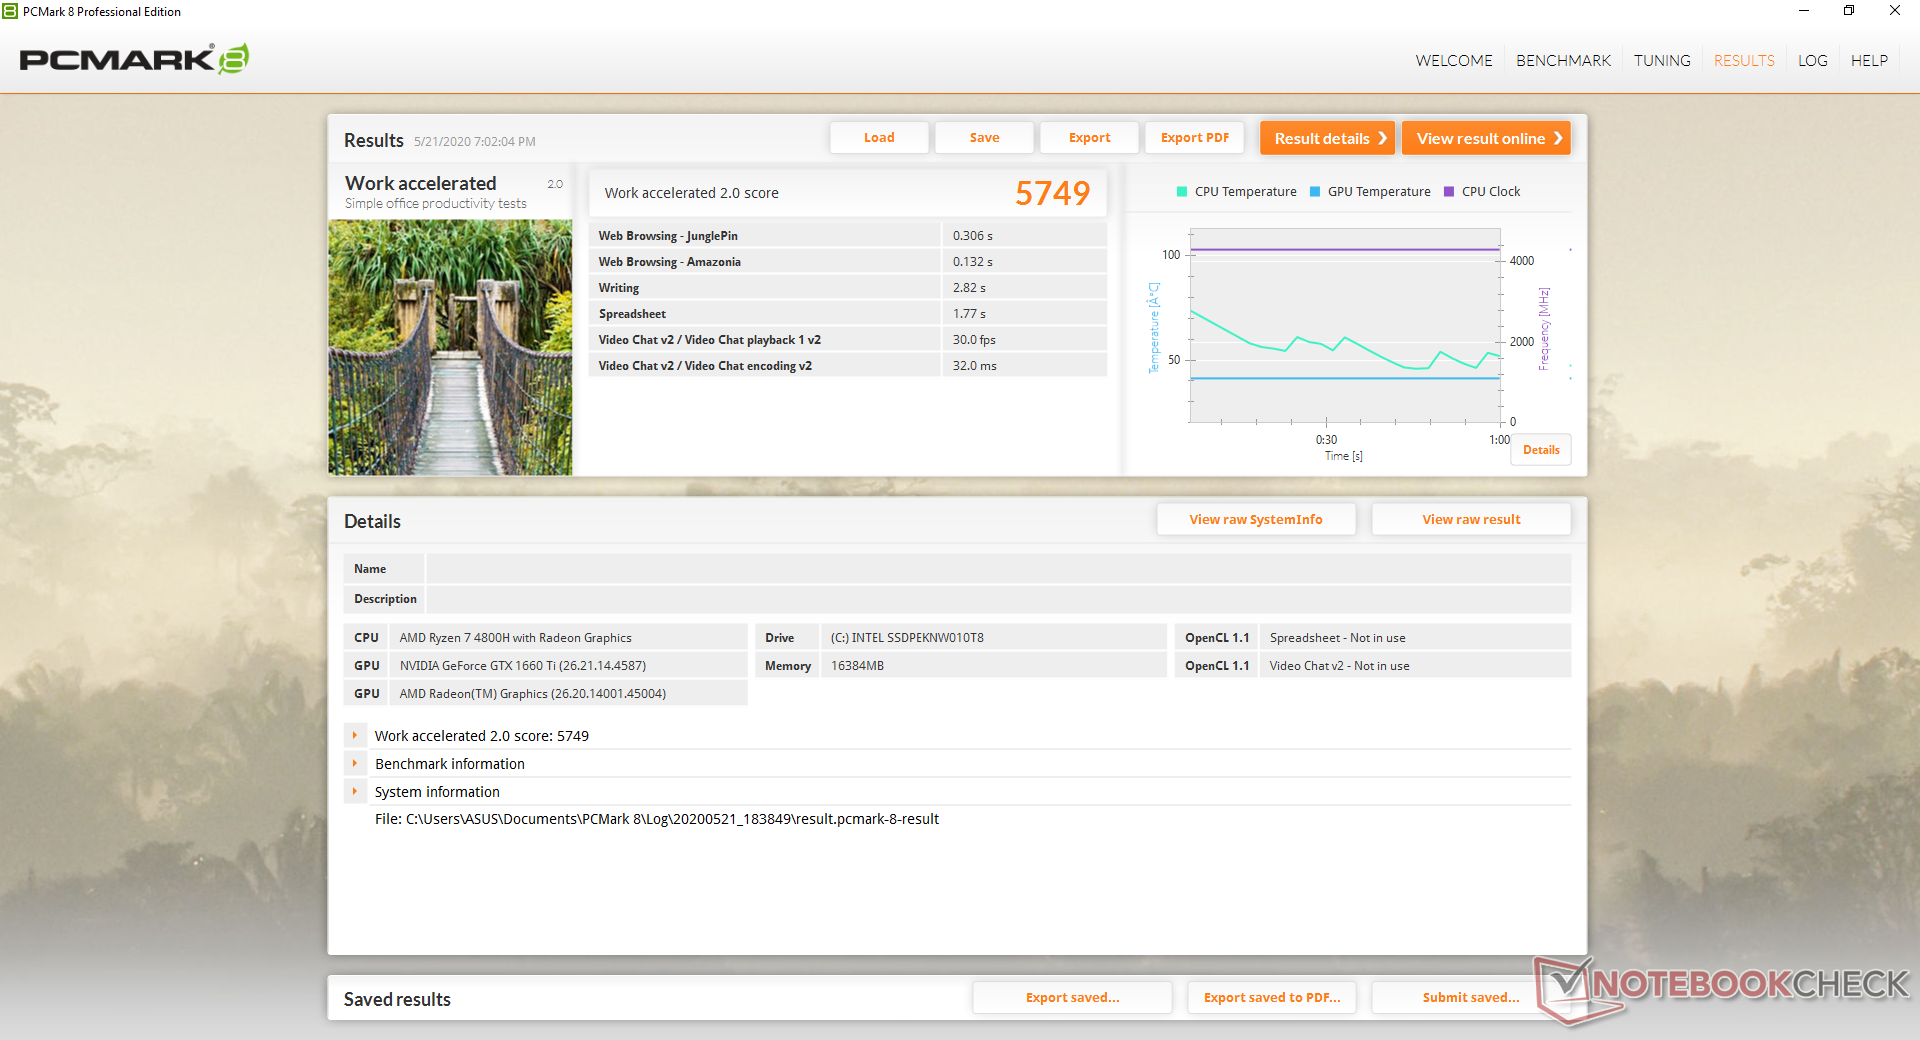
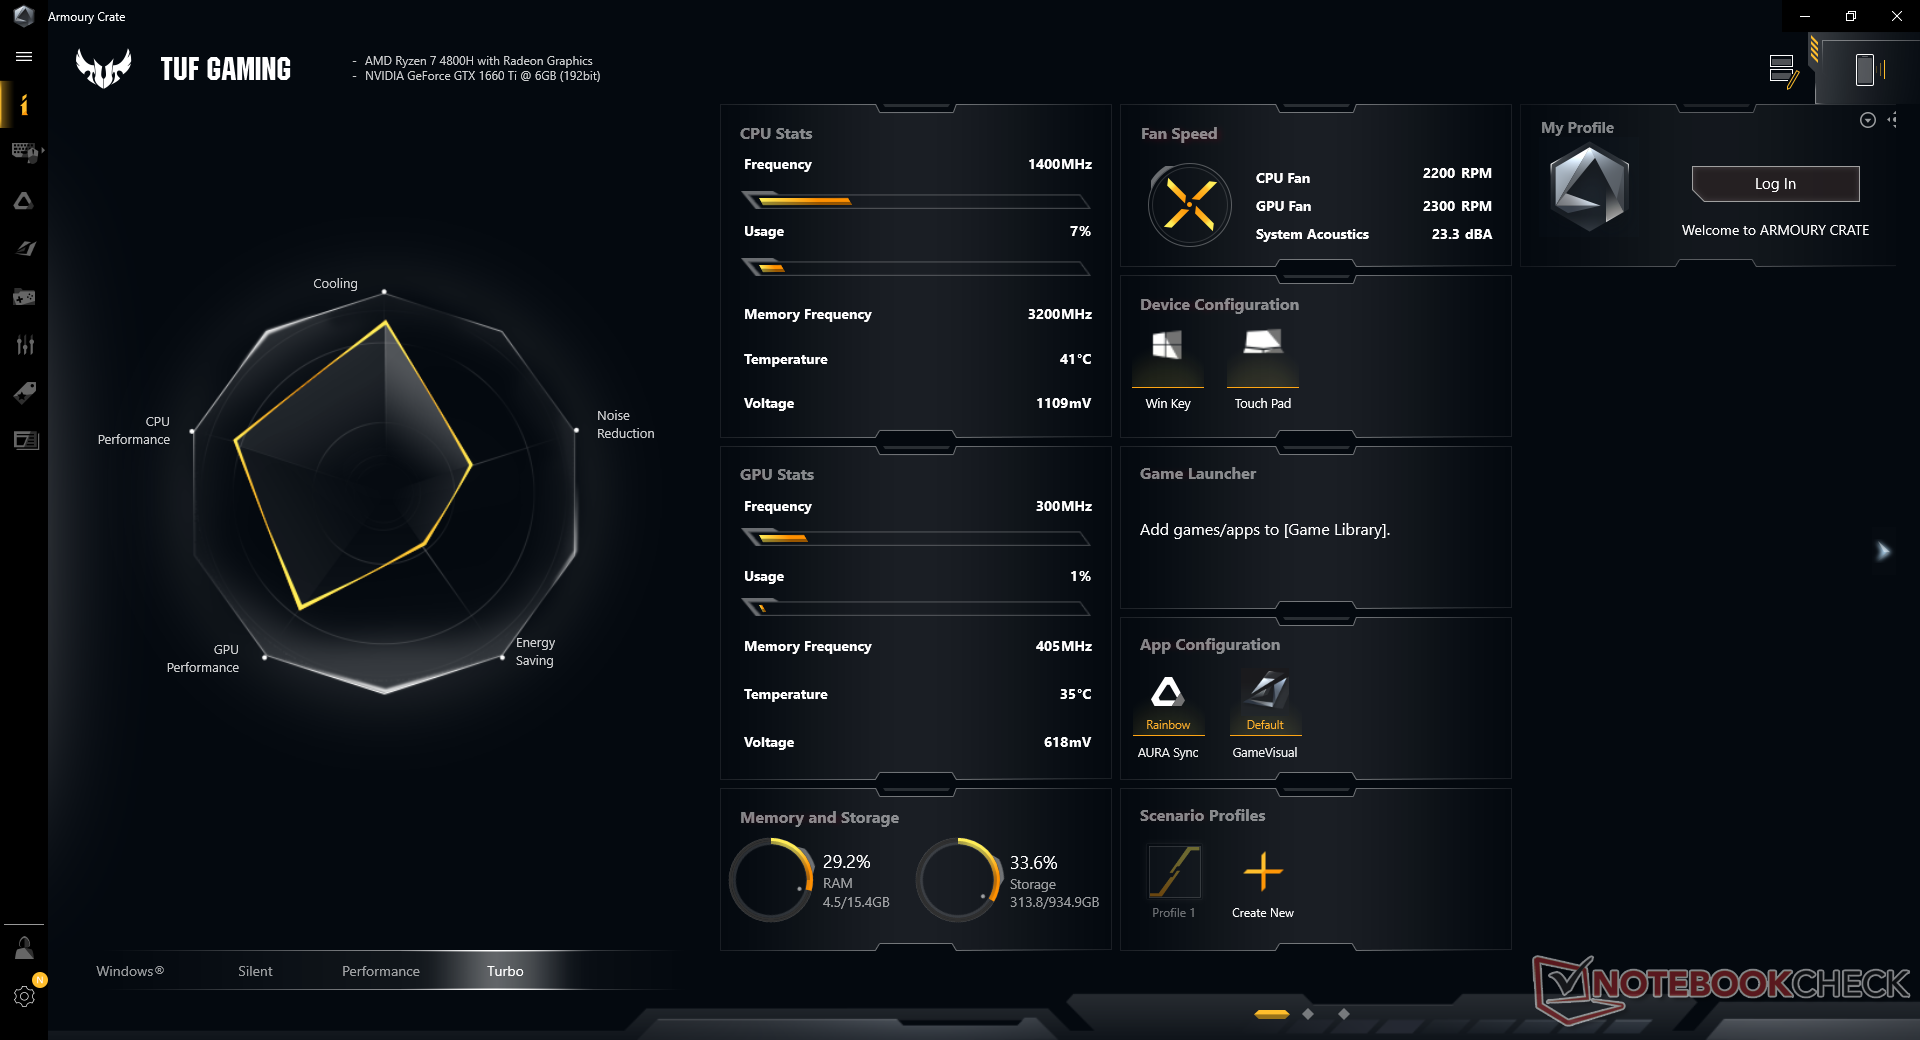
PCMark benchmarks are slightly above other gaming laptops powered by the Core i7-9750H but still consistently below some costlier Comet Lake-H laptops like the Gigabyte Aero 17 with the Core i7-10875H. While we experienced no software or hardware issues with the unit, we highly recommend becoming familiar with the pre-installed Armoury Crate app as system performance is tied closely to this software.
| PCMark 8 | |
| Home Score Accelerated v2 | |
| Asus TUF A17 FA706IU-AS76 | |
| Asus TUF FX705DT-AU068T | |
| HP Pavilion Gaming 17-cd0085cl | |
| Dell G7 17 7790 | |
| MSI GP75 Leopard 9SD | |
| Work Score Accelerated v2 | |
| Asus TUF A17 FA706IU-AS76 | |
| MSI GP75 Leopard 9SD | |
| Dell G7 17 7790 | |
| HP Pavilion Gaming 17-cd0085cl | |
| Asus TUF FX705DT-AU068T | |
| PCMark 8 Home Score Accelerated v2 | 4780 points | |
| PCMark 8 Work Score Accelerated v2 | 5749 points | |
| PCMark 10 Score | 5617 points | |
Help | ||
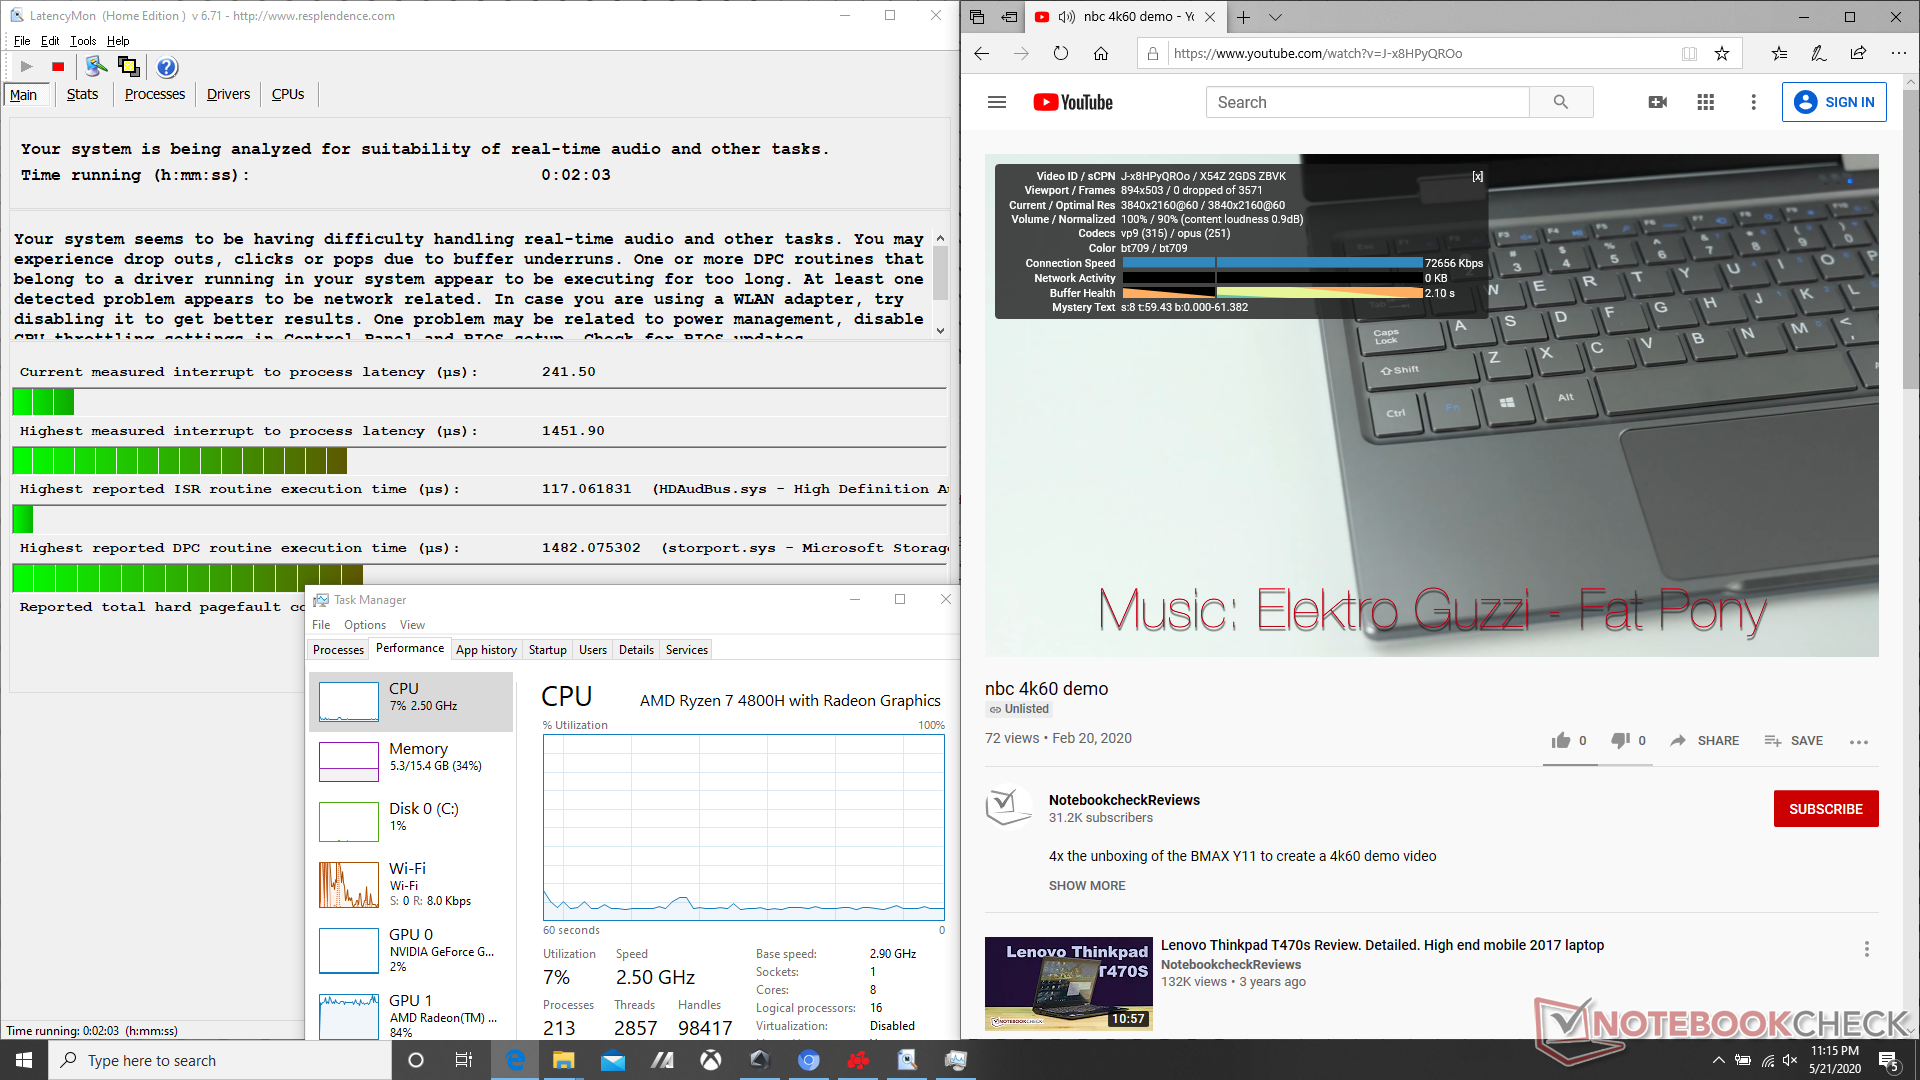
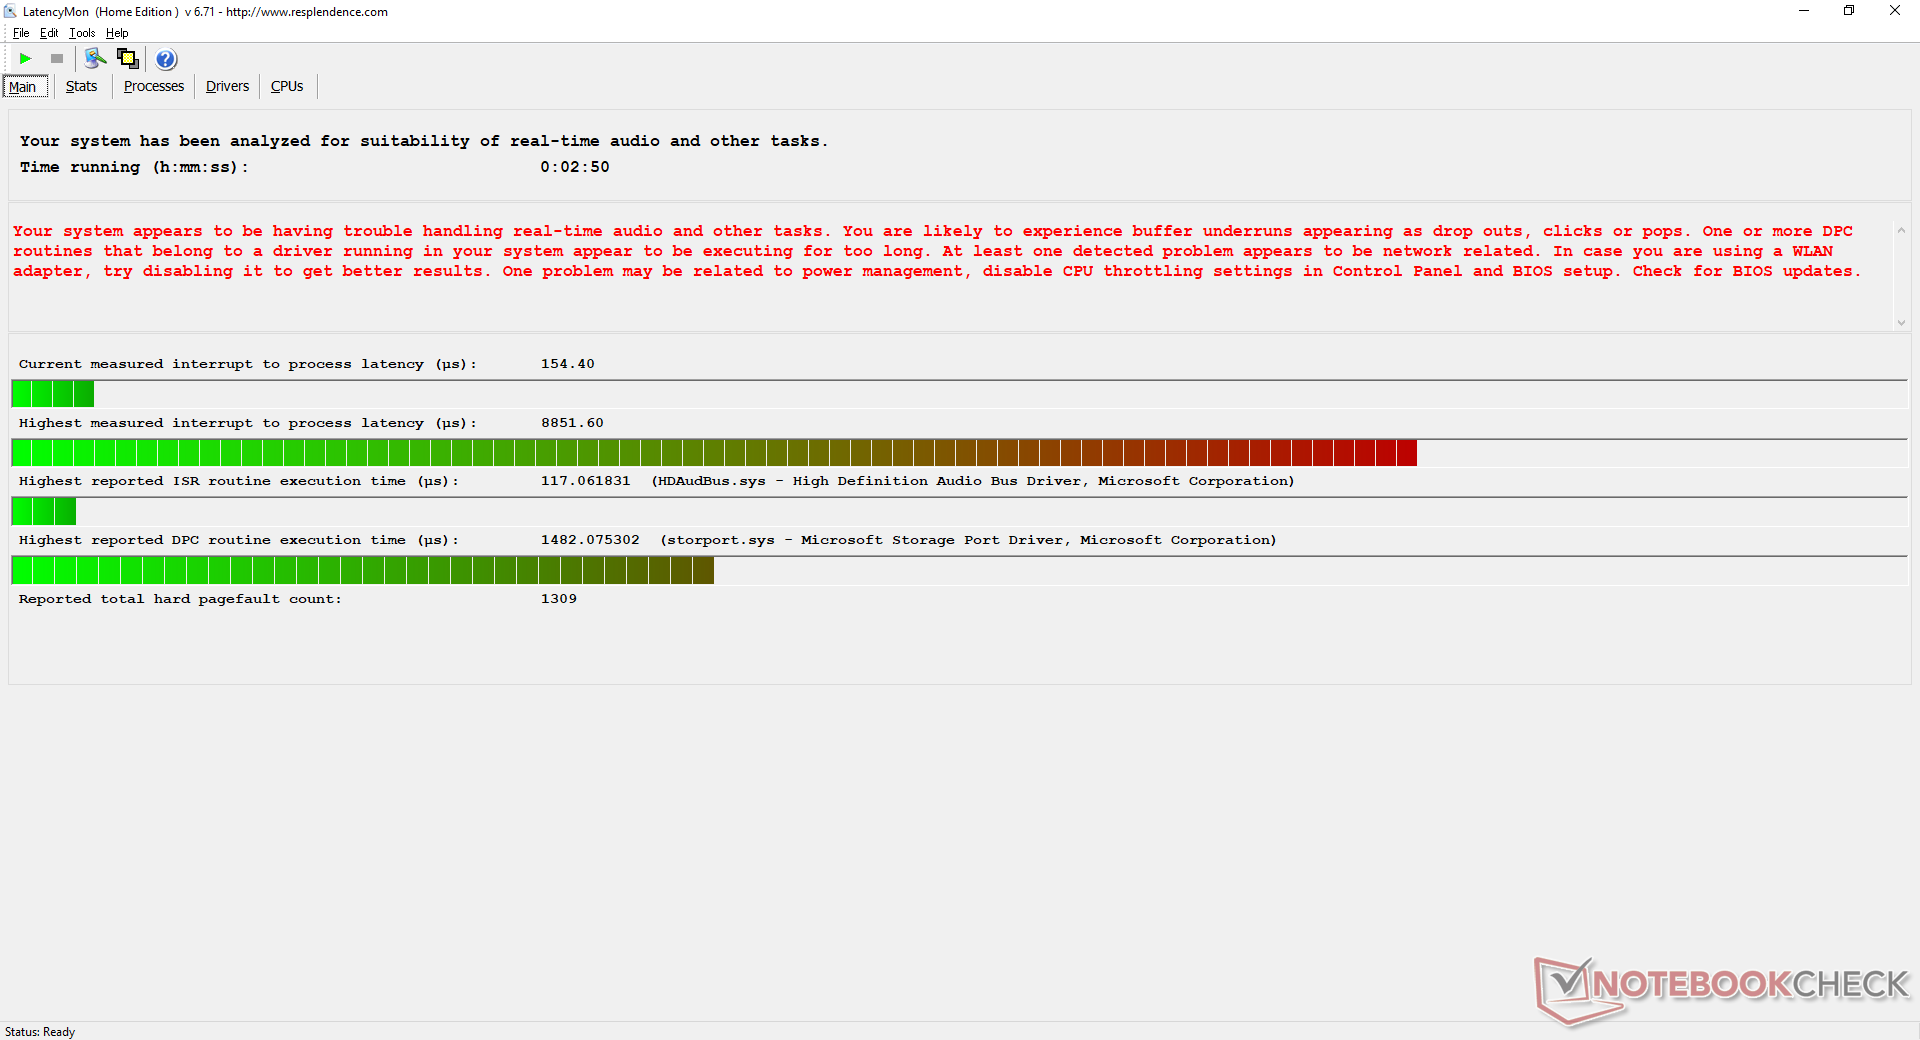
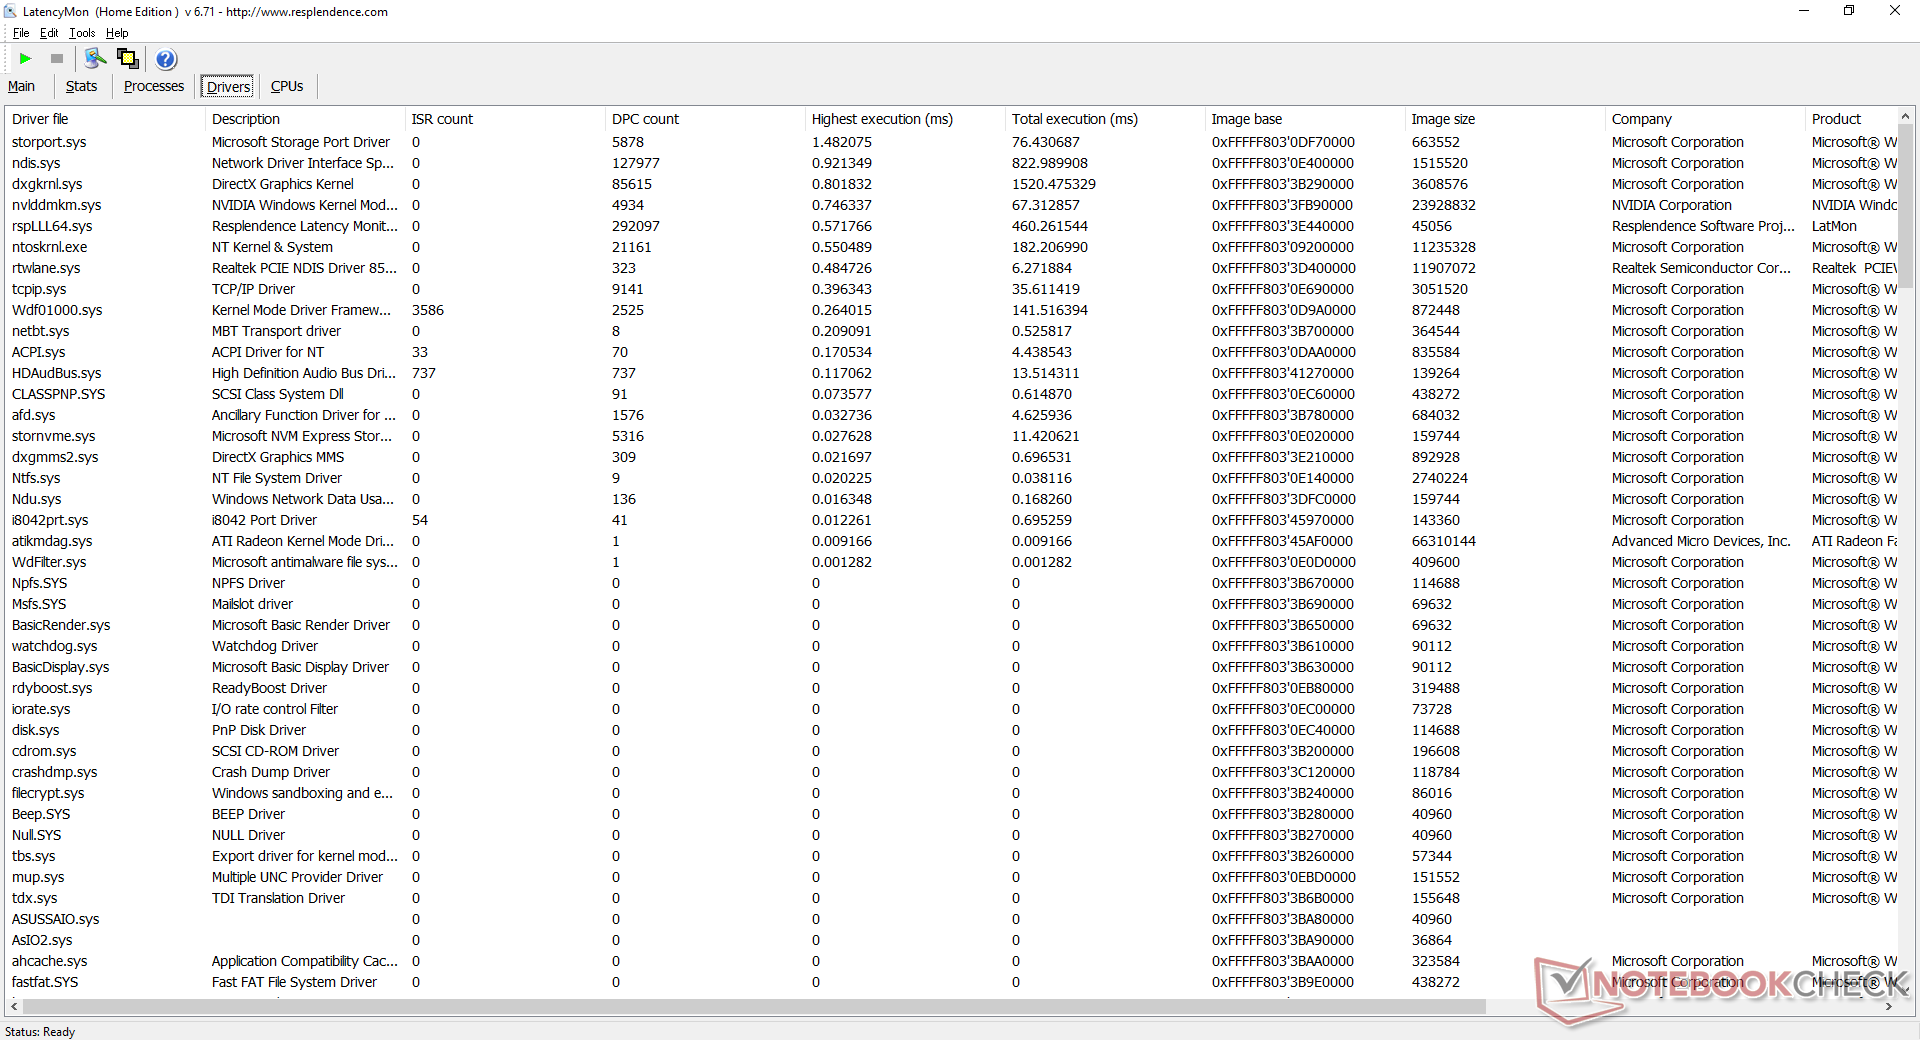
DPC Latency
LatencyMon shows DPC latency issues when opening multiple browser tabs on Edge. 4K video playback is otherwise smooth with no dropped frames albeit at 84 percent GPU utilization.
| DPC Latencies / LatencyMon - interrupt to process latency (max), Web, Youtube, Prime95 | |
| Asus TUF A17 FA706IU-AS76 | |
| Asus Zephyrus G14 GA401IV | |
| MSI GS66 10SGS | |
| MSI GP65 10SFK-047US | |
* ... smaller is better
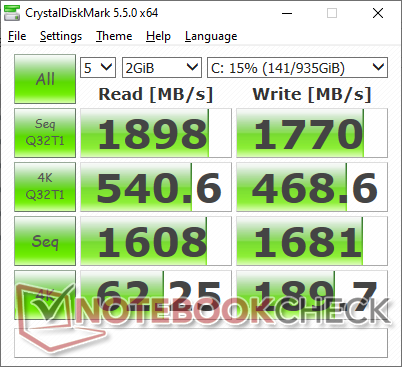
Storage Devices — Dual M.2 PCIe x4
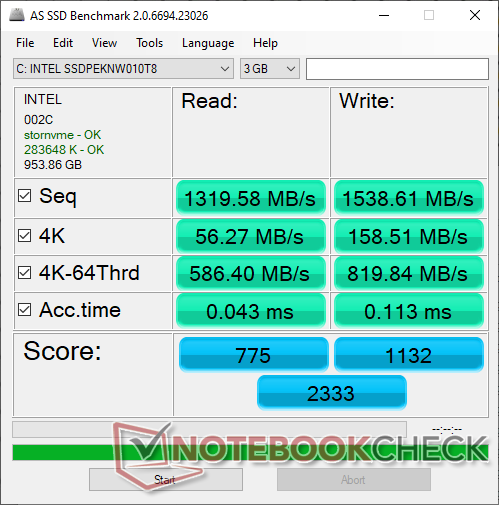
Two M.2 PCIe storage slots are available on our test unit. Depending on the SKU, however, some will also have a 2.5-inch SATA III bay to make storage expansion more affordable. The 1 TB Intel 660p NVMe SSD exhibits no performance throttling after running DiskSpd Read in a loop 50 times. Our table of HDDs and SSDs provide additional benchmark comparisons.
| Asus TUF A17 FA706IU-AS76 Intel SSD 660p 1TB SSDPEKNW010T8 | MSI GP75 Leopard 9SD Kingston RBUSNS8154P3256GJ1 | Dell G7 17 7790 Toshiba BG3 KBG30ZMS256G | HP Pavilion Gaming 17-cd0085cl Samsung SSD PM981 MZVLB256HAHQ | Asus TUF FX705DT-AU068T WDC PC SN520 SDAPNUW-256G | |
|---|---|---|---|---|---|
| AS SSD | -71% | -90% | 7% | -34% | |
| Seq Read | 1320 | 748 -43% | 1033 -22% | 1709 29% | 1546 17% |
| Seq Write | 1539 | 219 -86% | 218.3 -86% | 1345 -13% | 1182 -23% |
| 4K Read | 56.3 | 25.7 -54% | 24.12 -57% | 49.73 -12% | 36.54 -35% |
| 4K Write | 158.5 | 82.4 -48% | 55 -65% | 108.2 -32% | 109.2 -31% |
| 4K-64 Read | 586 | 259.3 -56% | 330.3 -44% | 731 25% | 612 4% |
| 4K-64 Write | 820 | 190.2 -77% | 155.8 -81% | 1233 50% | 436.6 -47% |
| Access Time Read * | 0.043 | 0.159 -270% | 0.18 -319% | 0.073 -70% | 0.113 -163% |
| Access Time Write * | 0.113 | 0.058 49% | 0.314 -178% | 0.034 70% | 0.034 70% |
| Score Read | 775 | 360 -54% | 458 -41% | 951 23% | 803 4% |
| Score Write | 1132 | 294 -74% | 233 -79% | 1476 30% | 664 -41% |
| Score Total | 2333 | 821 -65% | 891 -62% | 2909 25% | 1869 -20% |
| Copy ISO MB/s | 1736 | 382.9 -78% | 1284 -26% | 698 -60% | |
| Copy Program MB/s | 553 | 234.9 -58% | 589 7% | 114.1 -79% | |
| Copy Game MB/s | 1264 | 218.7 -83% | 1107 -12% | 379.6 -70% | |
| CrystalDiskMark 5.2 / 6 | -51% | -58% | 5% | -26% | |
| Write 4K | 189.7 | 105.8 -44% | 78.6 -59% | 135.3 -29% | 145 -24% |
| Read 4K | 62.3 | 27.89 -55% | 31.89 -49% | 63.7 2% | 45.28 -27% |
| Write Seq | 1681 | 270.8 -84% | 230.4 -86% | 1337 -20% | 1301 -23% |
| Read Seq | 1608 | 879 -45% | 925 -42% | 1617 1% | 1362 -15% |
| Write 4K Q32T1 | 468.6 | 273.3 -42% | 159.1 -66% | 568 21% | 249.1 -47% |
| Read 4K Q32T1 | 541 | 361.2 -33% | 315.6 -42% | 645 19% | 342.1 -37% |
| Write Seq Q32T1 | 1770 | 253 -86% | 230.7 -87% | 1428 -19% | 1301 -26% |
| Read Seq Q32T1 | 1898 | 1505 -21% | 1323 -30% | 3184 68% | 1732 -9% |
| Total Average (Program / Settings) | -61% /
-63% | -74% /
-78% | 6% /
6% | -30% /
-31% |
* ... smaller is better

Disk Throttling: DiskSpd Read Loop, Queue Depth 8
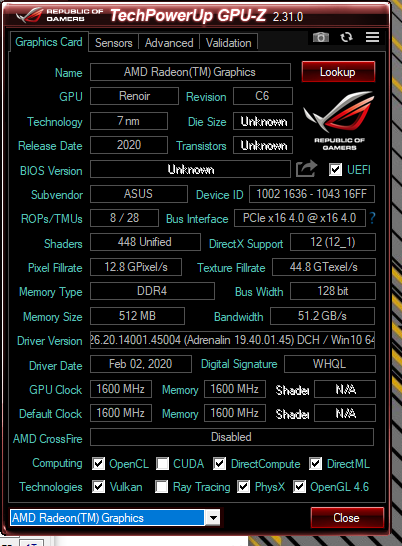
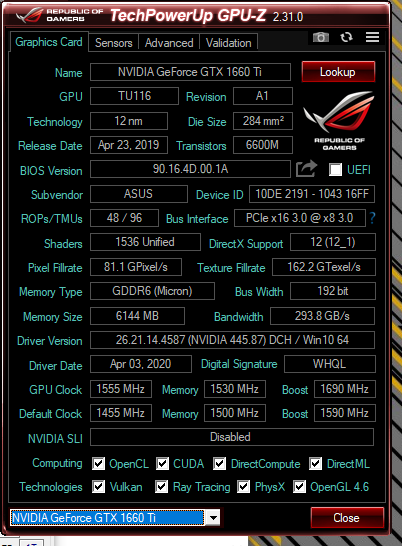
GPU Performance
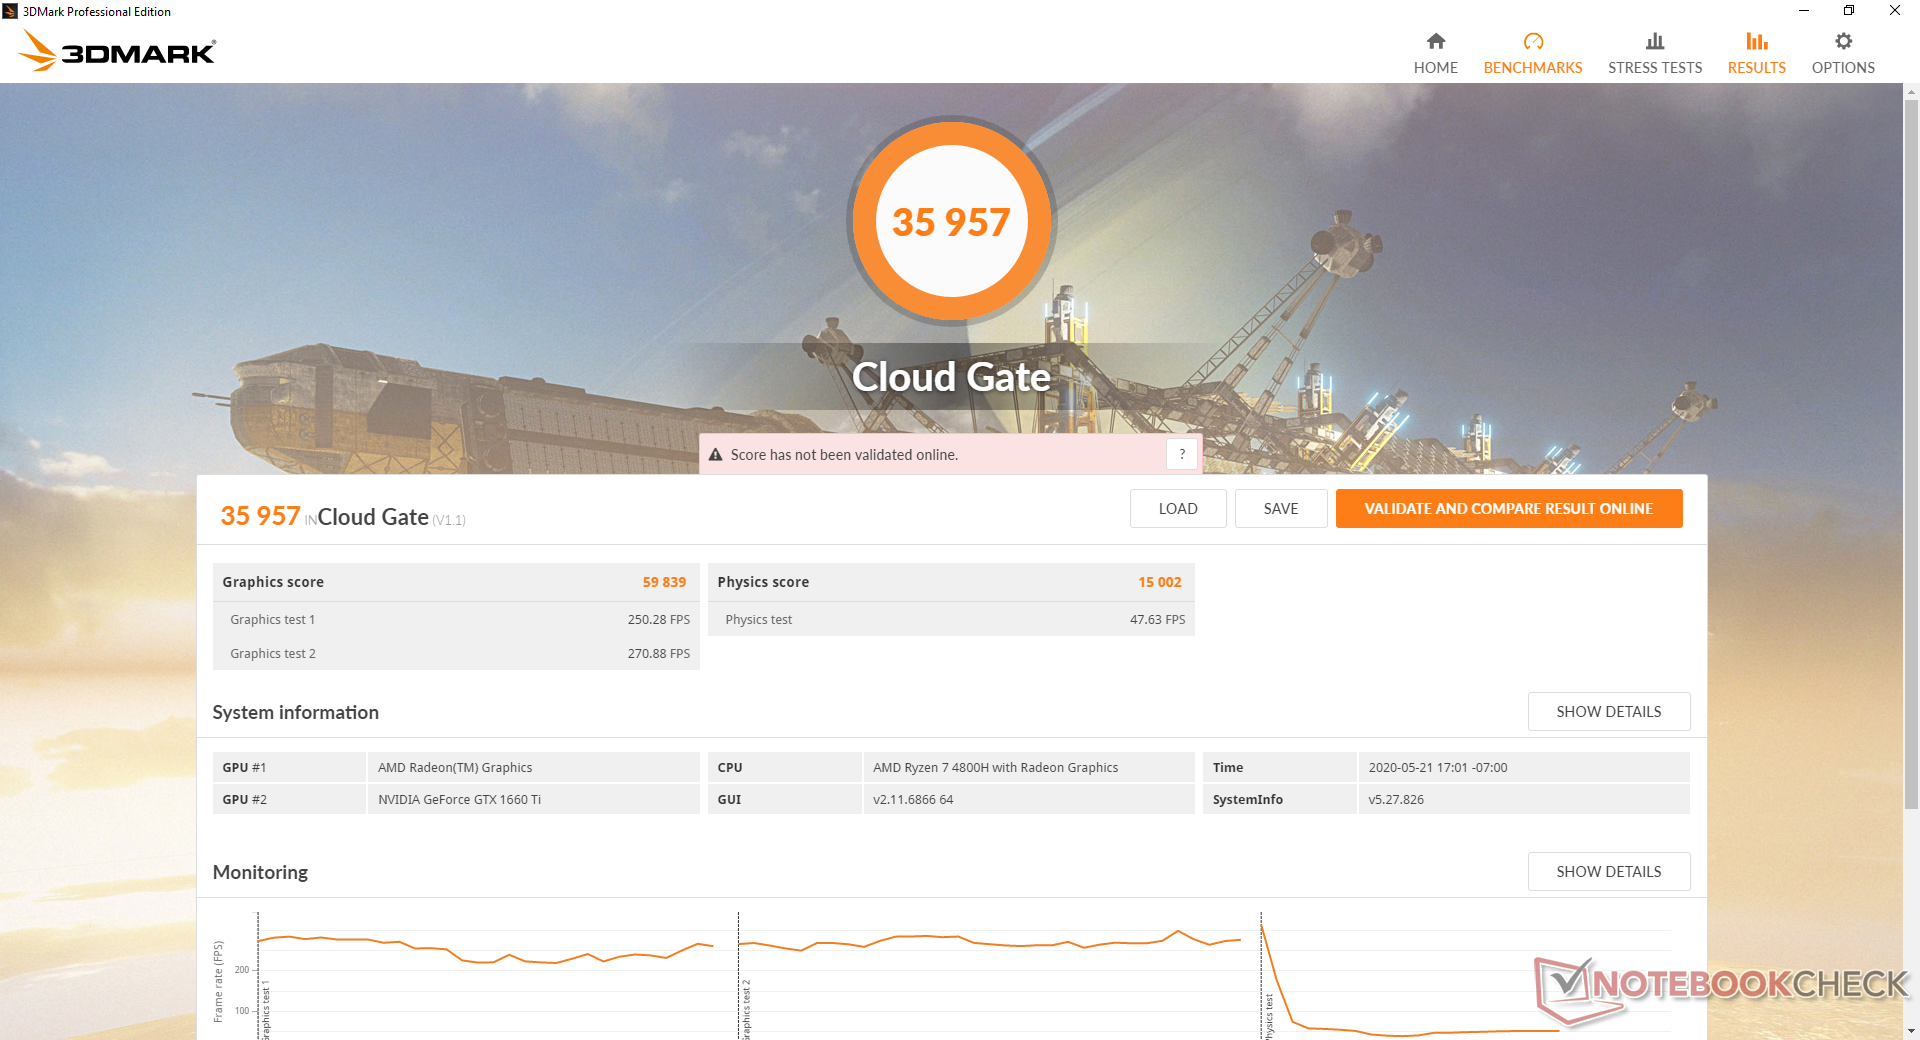
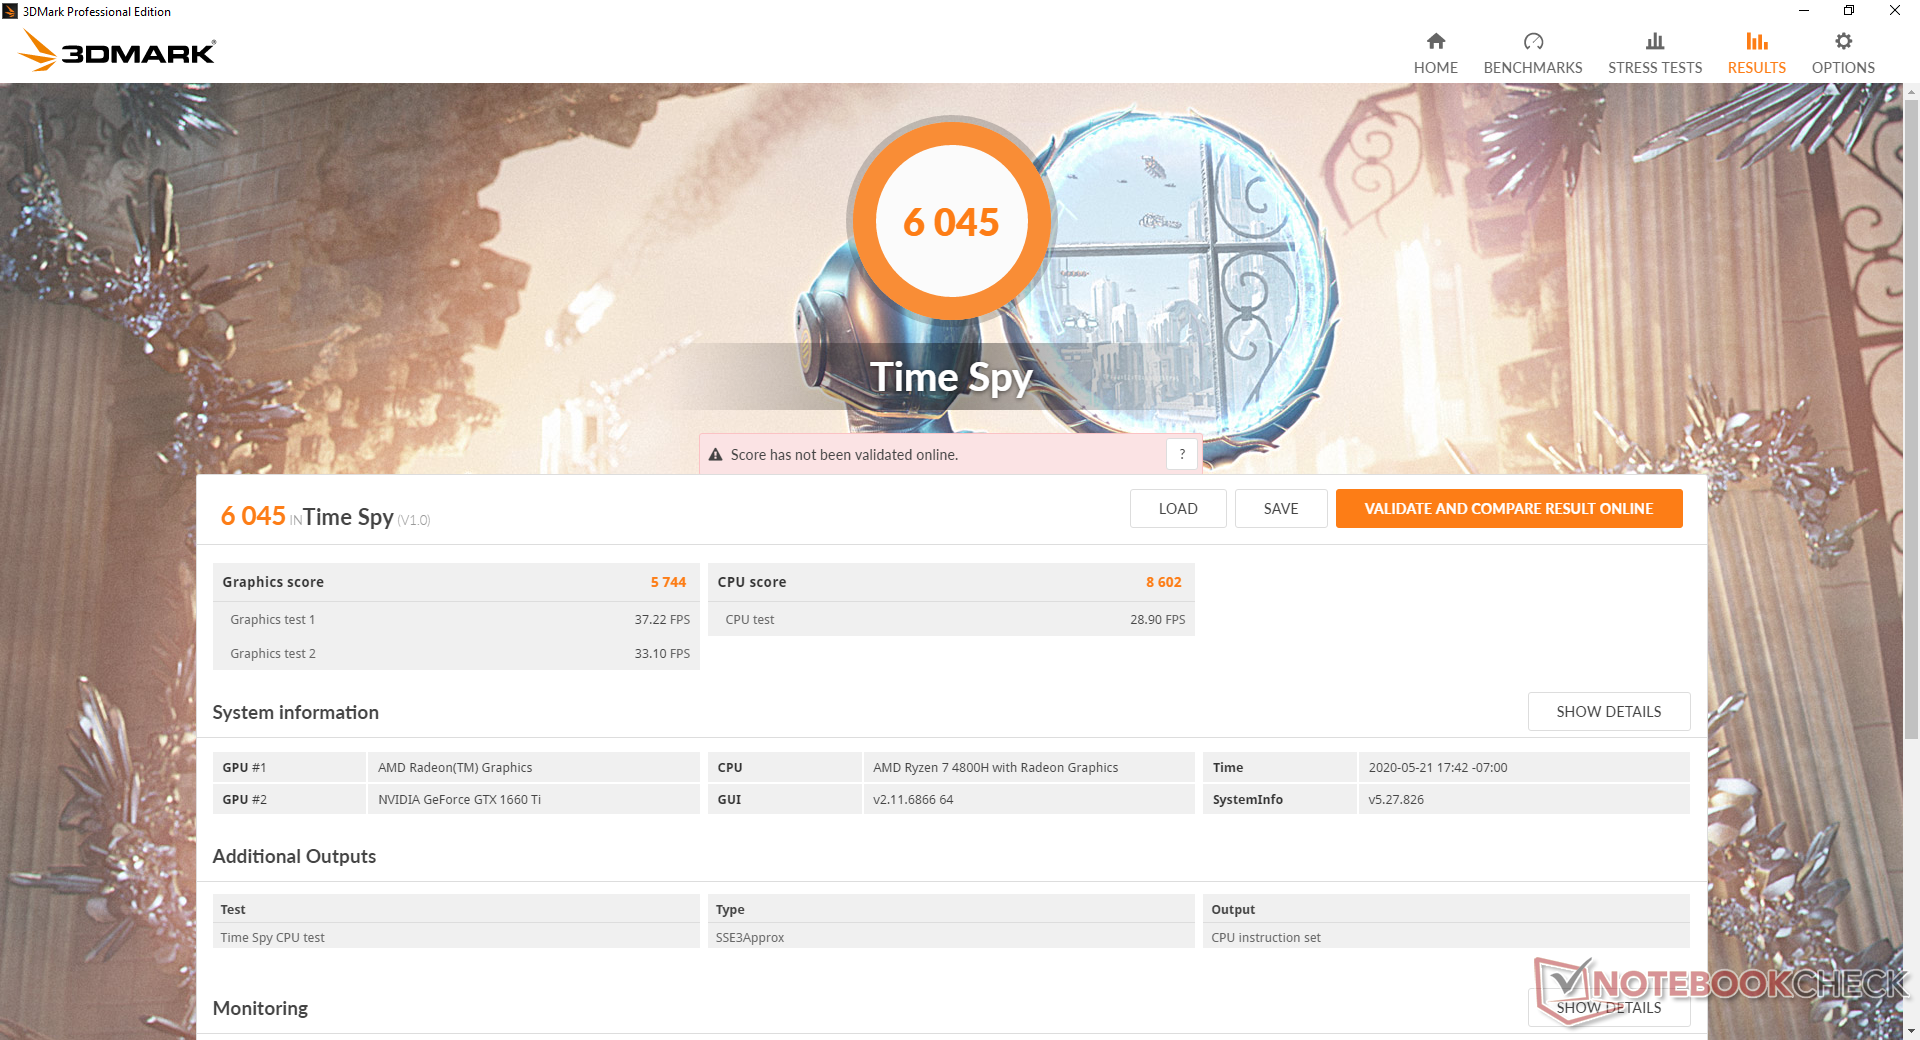
The GTX 1660 Ti in our Asus holds no surprises as it performs where we expect it to be relative to other laptops with the same GPU. Users can expect roughly the same performance as the mobile GTX 1070 when running DX12 titles. Results are essentially on par with the RTX 2060 Max-Q in the smaller Zephyrus G14 sans any RT or DLSS features.
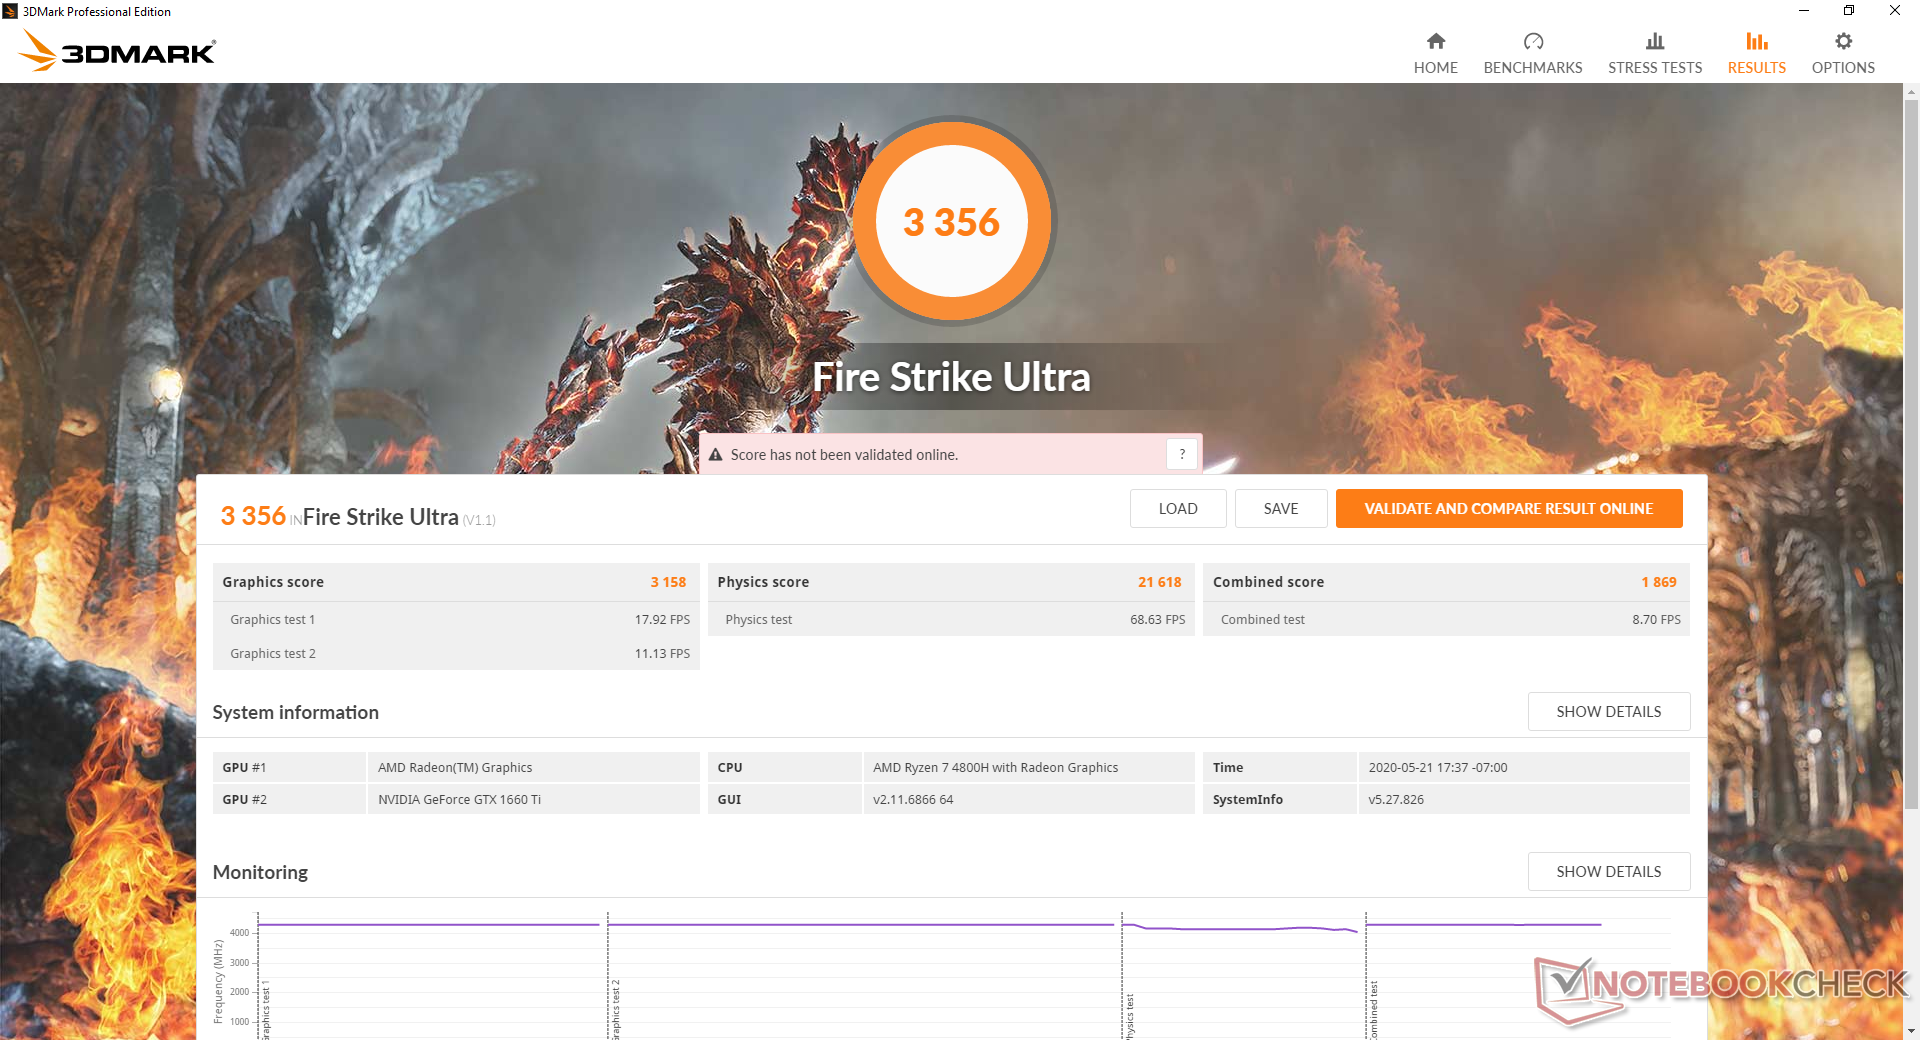
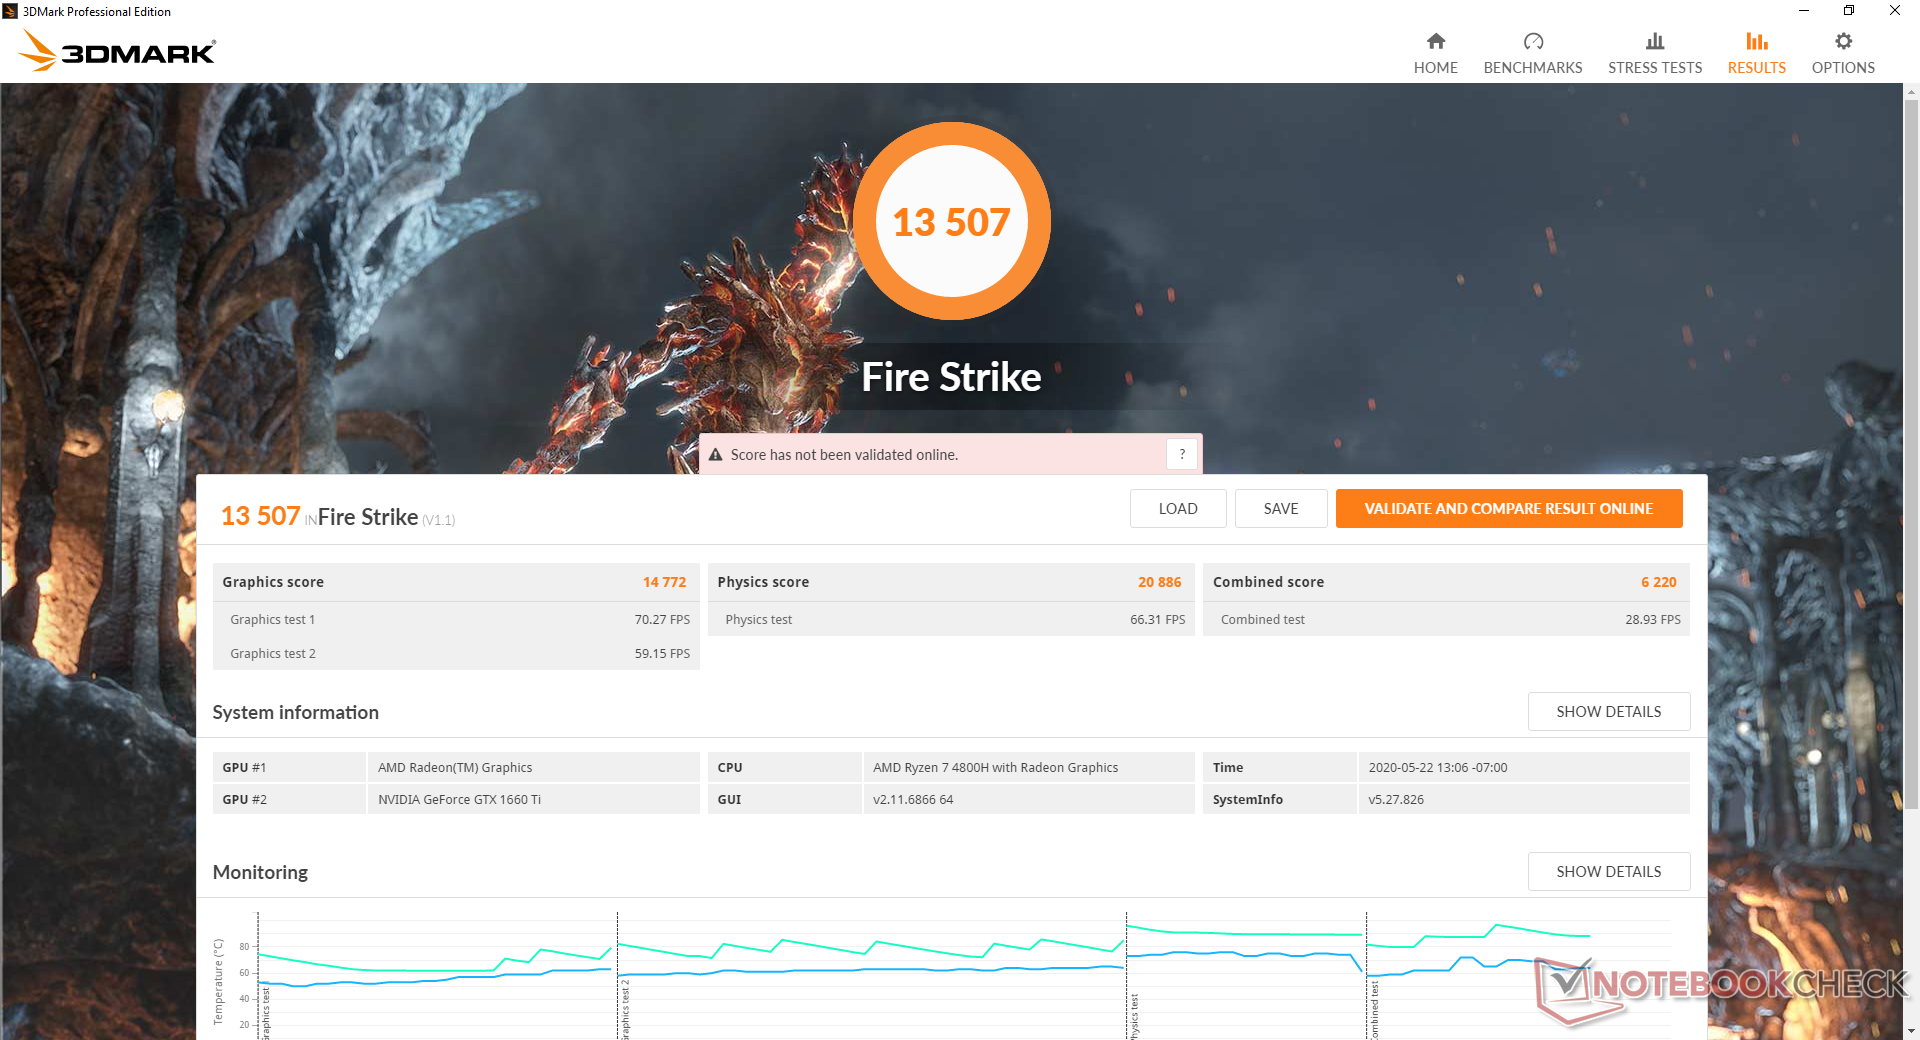
Running in Turbo mode instead of Performance mode will net ever-so-slightly higher scores in Fire Strike (20886 to 21102 points in Physics and 14772 to 15334 points in Graphics).
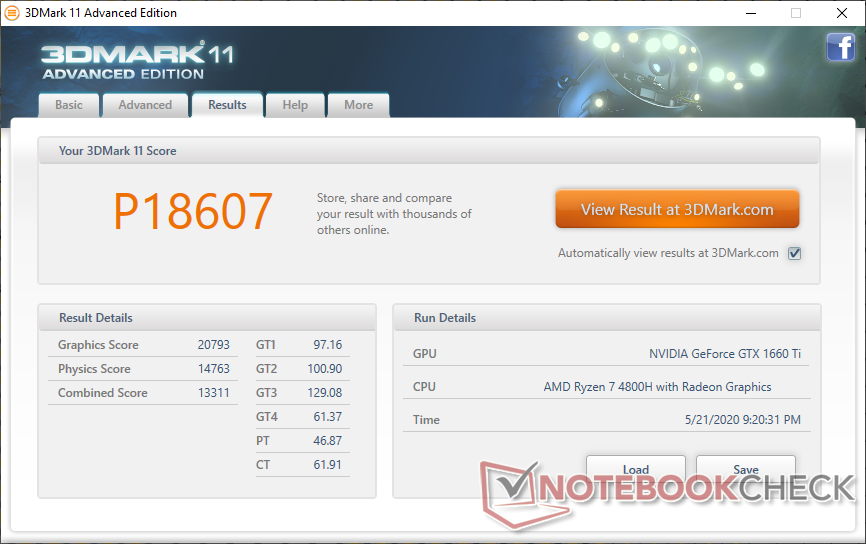
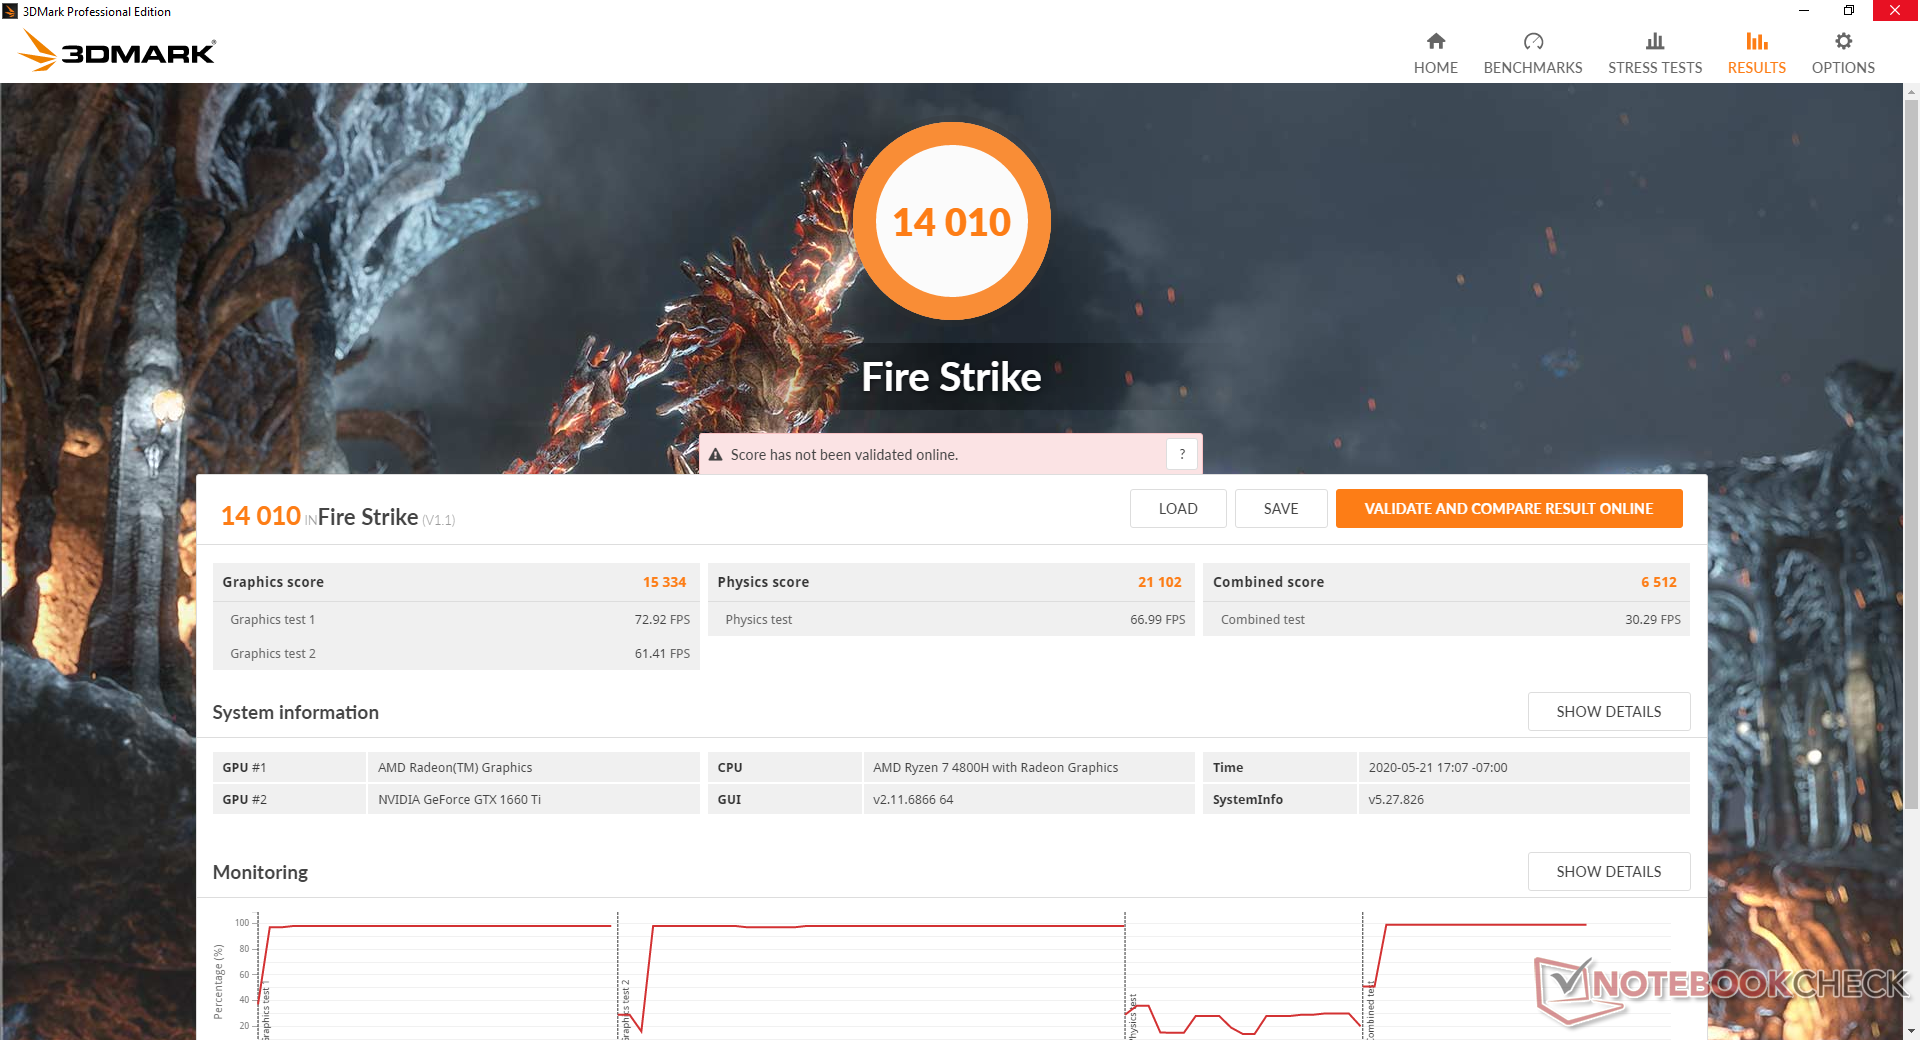
| 3DMark 11 Performance | 18607 points | |
| 3DMark Cloud Gate Standard Score | 35957 points | |
| 3DMark Fire Strike Score | 14010 points | |
| 3DMark Time Spy Score | 6045 points | |
Help | ||
Gaming Performance
Intel likes to tout its advantages in single-threaded workloads that can come in handy for running games. In our tests, however, performance isn't consistently any better or worse than the average GTX 1660 Ti in our database even when on lower settings where average frame rates are higher. This suggests that games are more GPU bound in this scenario especially when considering the budget-mid-range GTX 1660 Ti. Had the system come equipped with an RTX 2070 or RTX 2080 instead, then results may vary more.
See our dedicated page on the GeForce GTX 1660 Ti for more technical information and benchmark comparisons. The GPU pairs very well with our 120 Hz adaptive sync display since it tends to run most newer games in the 40 to 60 FPS range.
| Shadow of the Tomb Raider | |
| 1280x720 Lowest Preset | |
| Walmart EVOO Gaming 17 | |
| HP Omen 15-dc0015ng | |
| Average NVIDIA GeForce GTX 1660 Ti Mobile (88 - 151, n=6) | |
| Lenovo Legion Y740-17IRH | |
| Asus Strix Scar III G531GW-AZ062T | |
| Asus TUF A17 FA706IU-AS76 | |
| Dell G5 15 5590-PCNJJ | |
| Alienware 17 R4 | |
| 1920x1080 Highest Preset AA:T | |
| Walmart EVOO Gaming 17 | |
| Asus Strix Scar III G531GW-AZ062T | |
| Alienware 17 R4 | |
| Lenovo Legion Y740-17IRH | |
| Asus TUF A17 FA706IU-AS76 | |
| Average NVIDIA GeForce GTX 1660 Ti Mobile (62 - 73, n=8) | |
| HP Omen 15-dc0015ng | |
| Asus TUF FX705GM | |
| Dell G5 15 5590-PCNJJ | |
| The Witcher 3 | |
| 1024x768 Low Graphics & Postprocessing | |
| Walmart EVOO Gaming 17 | |
| Lenovo Legion Y740-17IRH | |
| Asus Strix Scar III G531GW-AZ062T | |
| Asus TUF A17 FA706IU-AS76 | |
| Average NVIDIA GeForce GTX 1660 Ti Mobile (177.3 - 298, n=14) | |
| HP Omen 15-dc0015ng | |
| Dell G5 15 5590-PCNJJ | |
| 1920x1080 Ultra Graphics & Postprocessing (HBAO+) | |
| Asus Strix Scar III G531GW-AZ062T | |
| Walmart EVOO Gaming 17 | |
| Lenovo Legion Y740-17IRH | |
| Average NVIDIA GeForce GTX 1660 Ti Mobile (51.6 - 65.1, n=21) | |
| Asus TUF A17 FA706IU-AS76 | |
| HP Omen 15-dc0015ng | |
| Asus TUF FX705GM | |
| Dell G5 15 5590-PCNJJ | |
| Dota 2 Reborn | |
| 1920x1080 ultra (3/3) best looking | |
| Average NVIDIA GeForce GTX 1660 Ti Mobile (94.6 - 125, n=11) | |
| HP Omen 15-dc0015ng | |
| Asus TUF A17 FA706IU-AS76 | |
| Asus Strix Scar III G531GW-AZ062T | |
| 1280x720 min (0/3) fastest | |
| Asus Strix Scar III G531GW-AZ062T | |
| Average NVIDIA GeForce GTX 1660 Ti Mobile (109 - 150, n=11) | |
| HP Omen 15-dc0015ng | |
| Asus TUF A17 FA706IU-AS76 | |
| Metro Exodus | |
| 1920x1080 Ultra Quality AF:16x | |
| Alienware 17 R4 | |
| Asus Strix Scar III G531GW-AZ062T | |
| Lenovo Legion Y740-17IRH | |
| Asus TUF A17 FA706IU-AS76 | |
| Average NVIDIA GeForce GTX 1660 Ti Mobile (38.2 - 43.1, n=4) | |
| Dell G5 15 5590-PCNJJ | |
| 1920x1080 Medium Quality AF:4x | |
| Alienware 17 R4 | |
| Asus Strix Scar III G531GW-AZ062T | |
| Lenovo Legion Y740-17IRH | |
| Asus TUF A17 FA706IU-AS76 | |
| Average NVIDIA GeForce GTX 1660 Ti Mobile (64 - 73.7, n=4) | |
| Dell G5 15 5590-PCNJJ | |
| Borderlands 3 | |
| 1280x720 Very Low Overall Quality (DX11) | |
| Lenovo Legion Y740-17IRH | |
| Average NVIDIA GeForce GTX 1660 Ti Mobile (107.9 - 131, n=2) | |
| Alienware 17 R4 | |
| Asus TUF A17 FA706IU-AS76 | |
| Dell G5 15 5590-PCNJJ | |
| 1920x1080 Badass Overall Quality (DX11) | |
| Alienware 17 R4 | |
| Lenovo Legion Y740-17IRH | |
| Asus TUF A17 FA706IU-AS76 | |
| Average NVIDIA GeForce GTX 1660 Ti Mobile (46.6 - 48.6, n=3) | |
| Dell G5 15 5590-PCNJJ | |
| low | med. | high | ultra | |
| The Witcher 3 (2015) | 254 | 175.1 | 103 | 55.6 |
| Dota 2 Reborn (2015) | 122 | 113 | 110 | 104 |
| X-Plane 11.11 (2018) | 93 | 83.7 | 70.2 | |
| Shadow of the Tomb Raider (2018) | 108 | 87 | 81 | 73 |
| Metro Exodus (2019) | 112.4 | 73.7 | 54.4 | 42.6 |
| Borderlands 3 (2019) | 107.9 | 87.5 | 61.7 | 47.8 |
Emissions
System Noise — Still A Loud Gaming Machine
Fan noise is almost always present even if set to the Silent profile. The system will attempt to stay silent for as long as it can, but light loads like browsing or video streaming will be enough to kick the fans up to the 33 to 34 dB(A) range. It's noticeable, but thankfully not distracting.
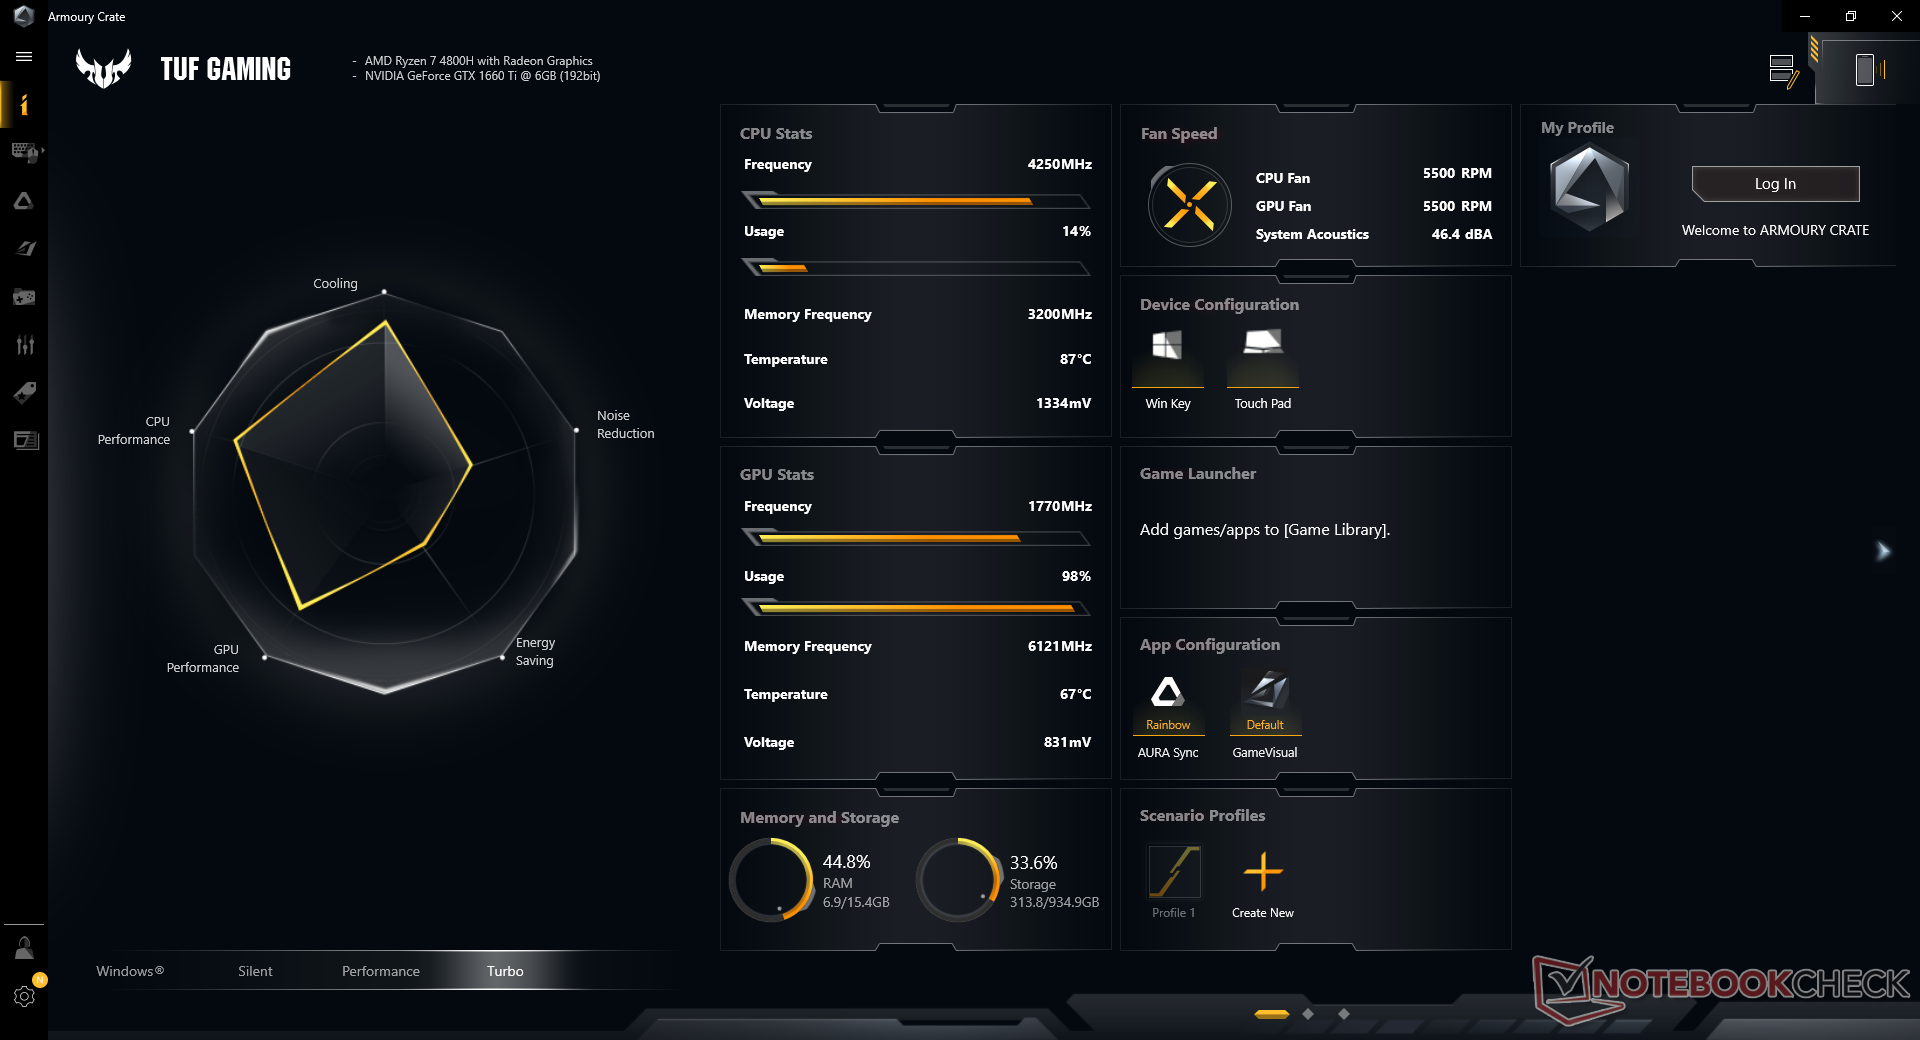
Running on Performance mode will cause the fans to pulse more frequently up to 42.5 dB(A) when running the first benchmark scene of 3DMark 06. If gaming, this jumps to 50.1 dB(A) which is about the same as what we measured on the MSI GP75 or Dell G7 when under similar conditions. Setting the system to Turbo mode will increase fan noise even further to 53.4 dB(A) for only single-digit gains in performance. It becomes difficult to game comfortably without a good pair of headphones when fan noise is at the 50 dB(A) range. If not gaming, then we recommend manually setting the system to Silent mode to reduce fan noise as much as possible.
We can notice no electronic noise or coil whine from our test unit.
| Asus TUF A17 FA706IU-AS76 GeForce GTX 1660 Ti Mobile, R7 4800H, Intel SSD 660p 1TB SSDPEKNW010T8 | MSI GP75 Leopard 9SD GeForce GTX 1660 Ti Mobile, i7-9750H, Kingston RBUSNS8154P3256GJ1 | Dell G7 17 7790 GeForce RTX 2070 Max-Q, i7-8750H, Toshiba BG3 KBG30ZMS256G | HP Pavilion Gaming 17-cd0085cl GeForce GTX 1660 Ti Max-Q, i7-9750H, Samsung SSD PM981 MZVLB256HAHQ | Lenovo Legion Y540-17IRH GeForce GTX 1660 Ti Mobile, i5-9300H, WDC PC SN520 SDAPNUW-512G | Asus TUF FX705DT-AU068T GeForce GTX 1650 Mobile, R5 3550H, WDC PC SN520 SDAPNUW-256G | |
|---|---|---|---|---|---|---|
| Noise | -8% | 7% | 11% | -3% | 2% | |
| off / environment * | 28.7 | 29 -1% | 28.2 2% | 28.2 2% | 30 -5% | 30.8 -7% |
| Idle Minimum * | 28.7 | 29 -1% | 28.6 -0% | 30.1 -5% | 30 -5% | 30.8 -7% |
| Idle Average * | 30.5 | 34 -11% | 28.6 6% | 30.1 1% | 32 -5% | 30.8 -1% |
| Idle Maximum * | 32.5 | 37 -14% | 28.6 12% | 30.1 7% | 34 -5% | 32.2 1% |
| Load Average * | 42.5 | 53 -25% | 31.8 25% | 34.2 20% | 44 -4% | 38.6 9% |
| Witcher 3 ultra * | 50.1 | 51 -2% | 50.6 -1% | 34.2 32% | 50 -0% | |
| Load Maximum * | 53.4 | 55 -3% | 50.8 5% | 43.8 18% | 52 3% | 44.8 16% |
* ... smaller is better
Noise Level
| Idle |
| 28.7 / 30.5 / 32.5 dB(A) |
| Load |
| 42.5 / 53.4 dB(A) |
 | ||
30 dB silent 40 dB(A) audible 50 dB(A) loud |
||
min: | ||
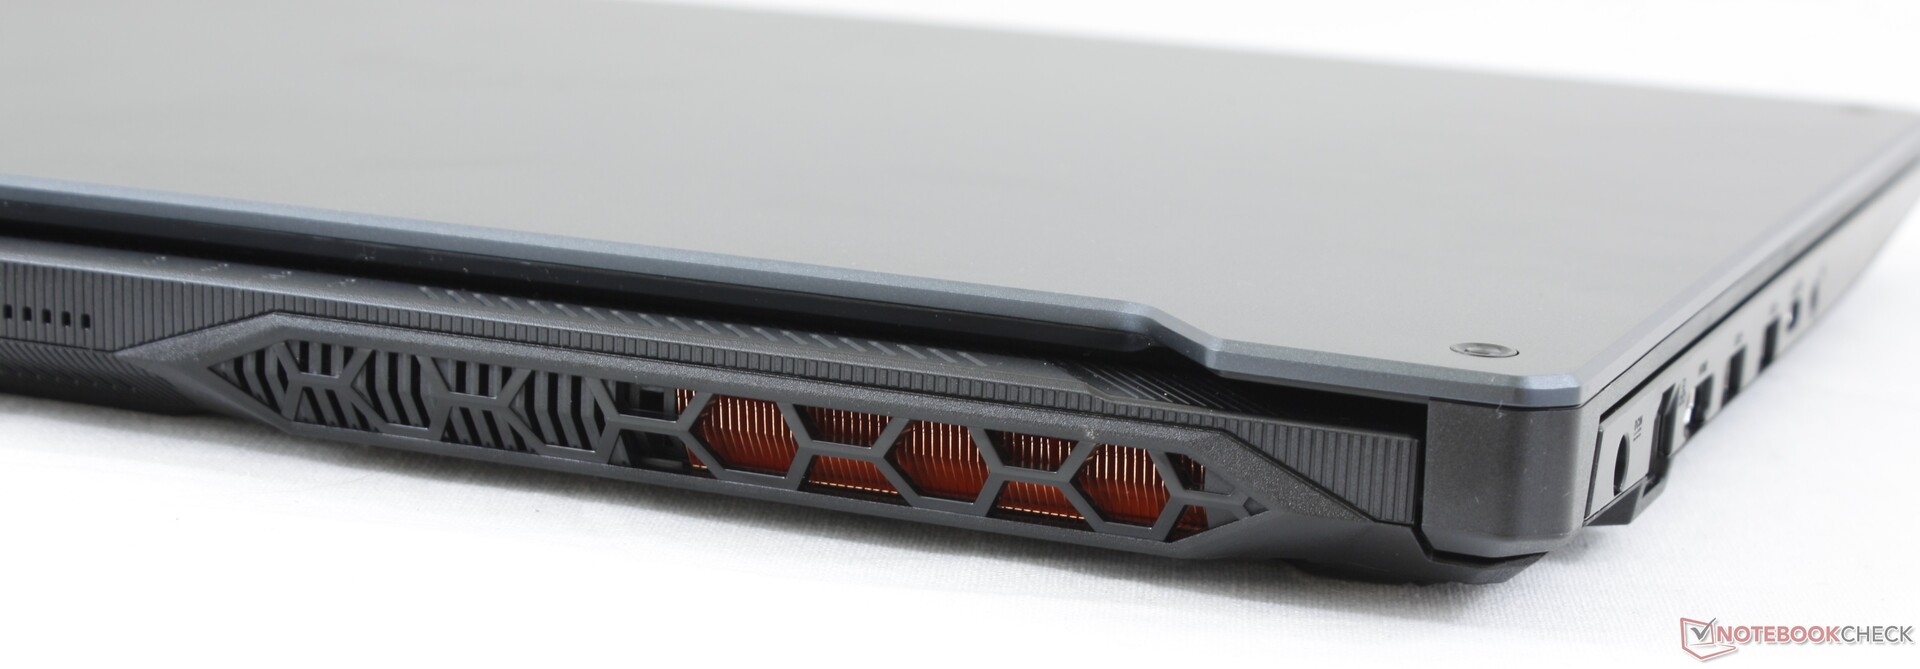
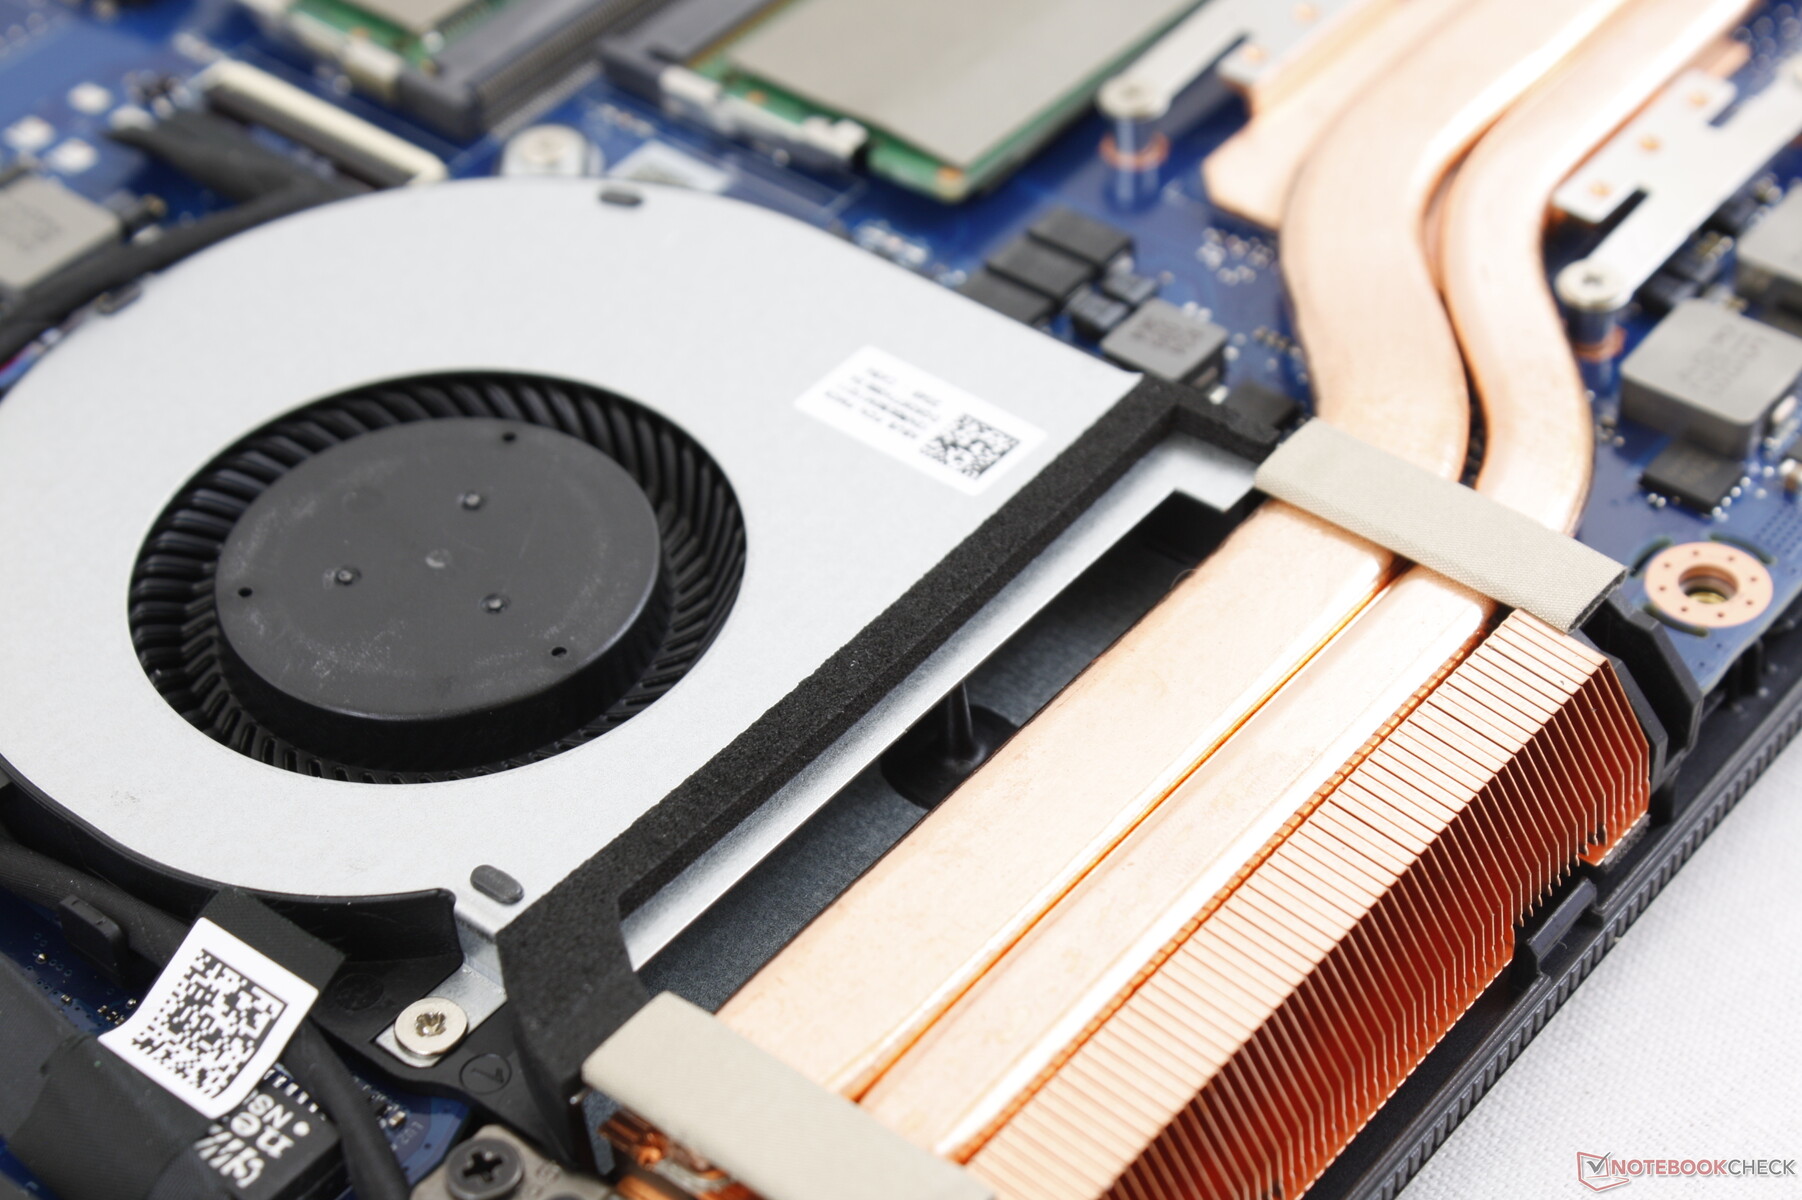
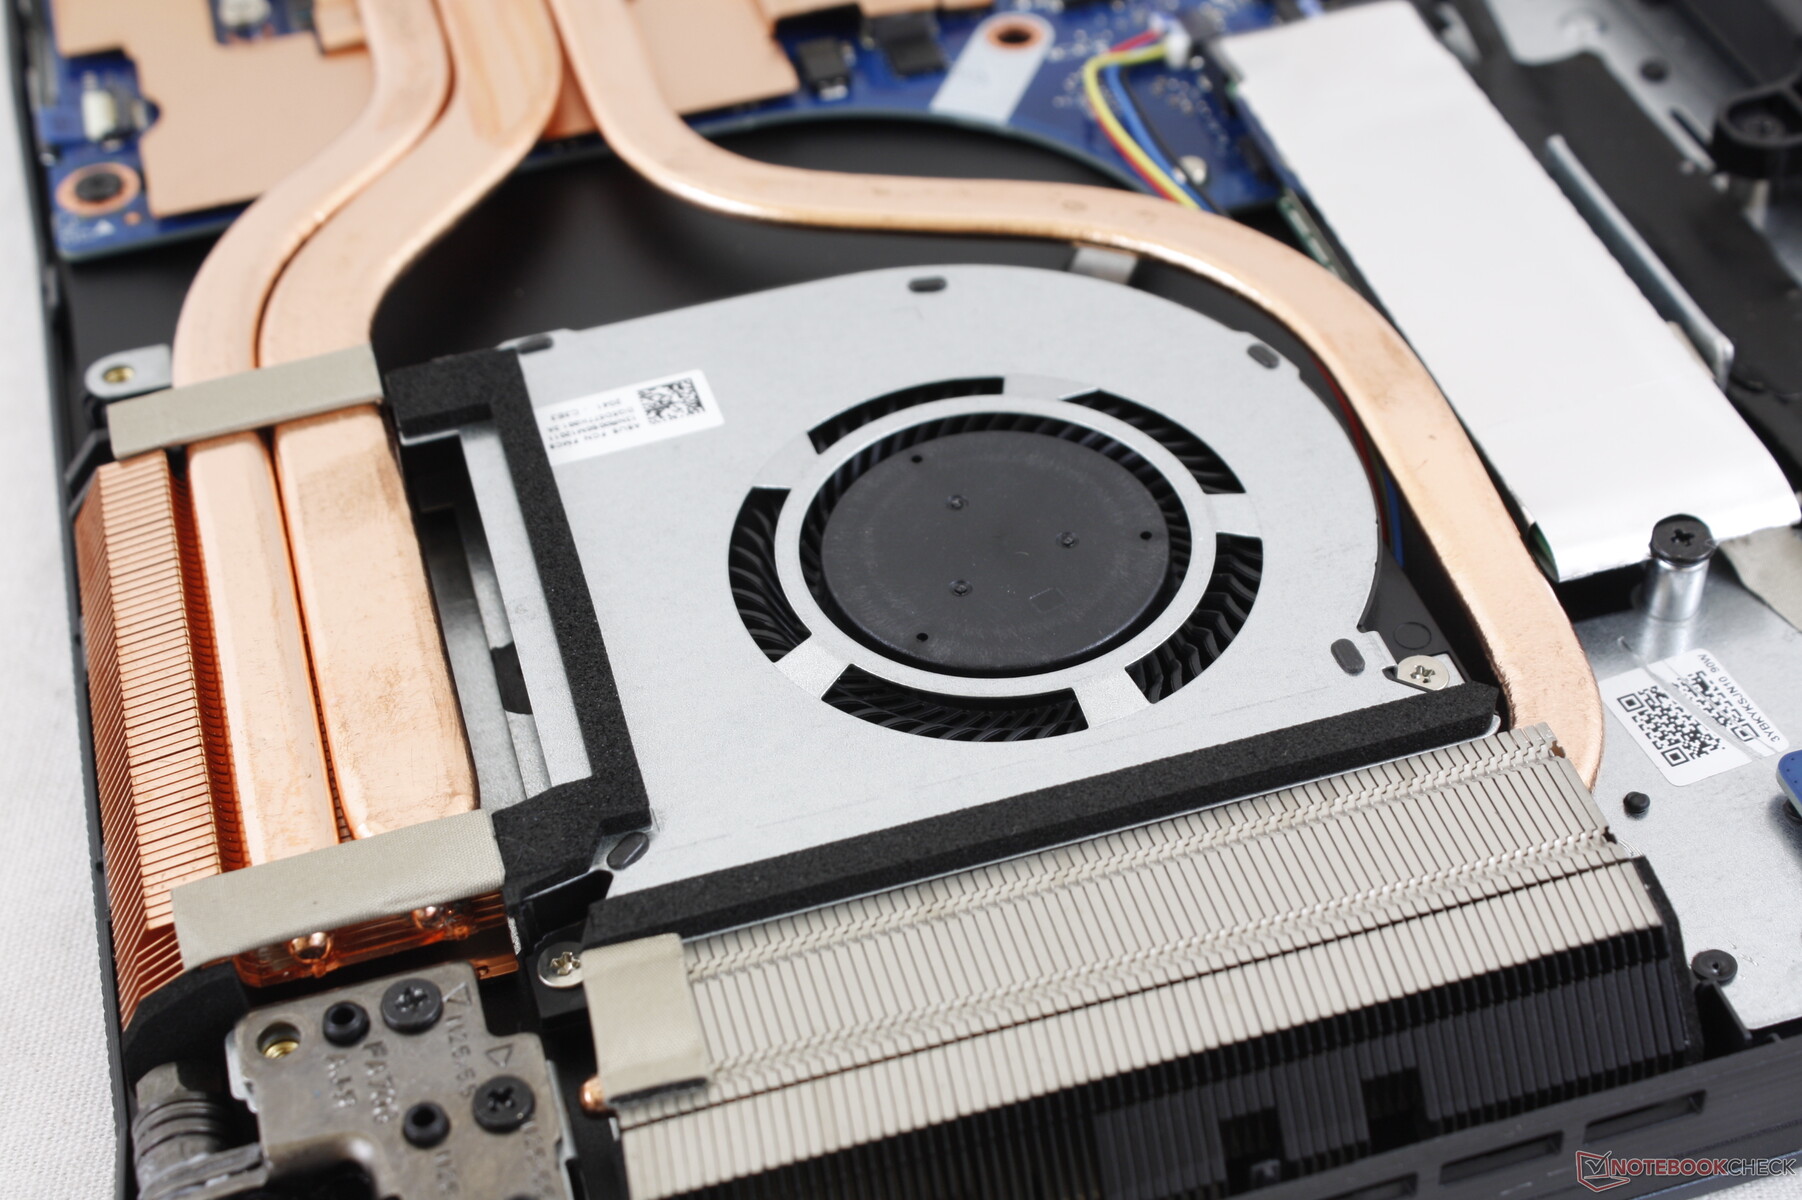
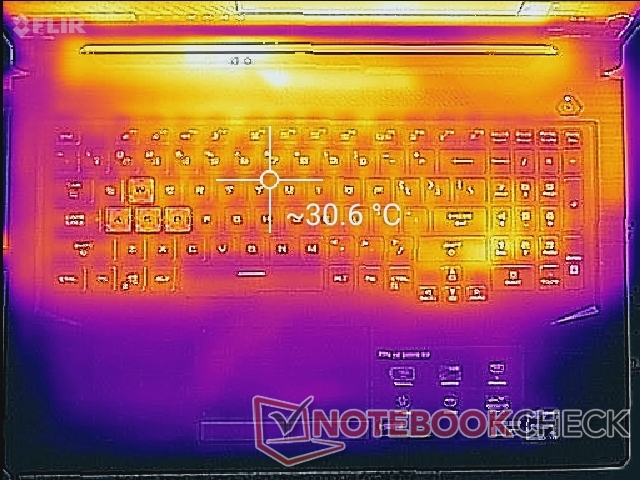
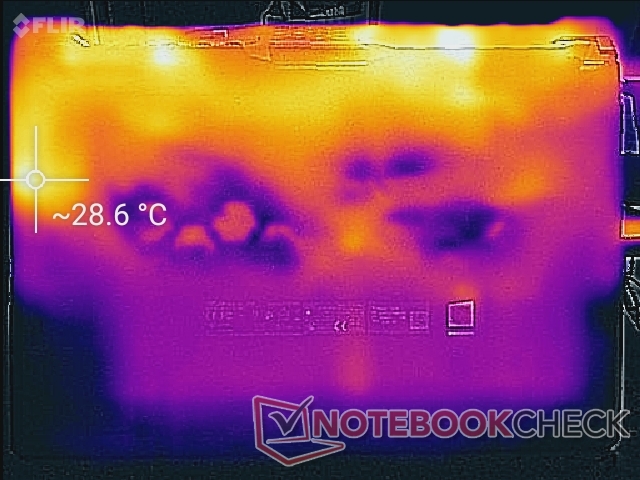
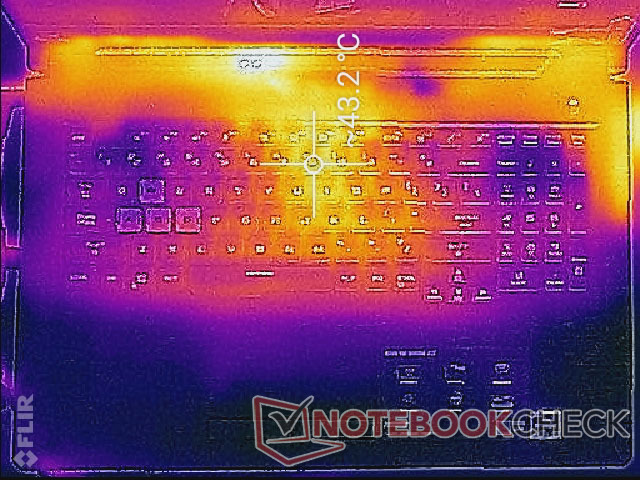
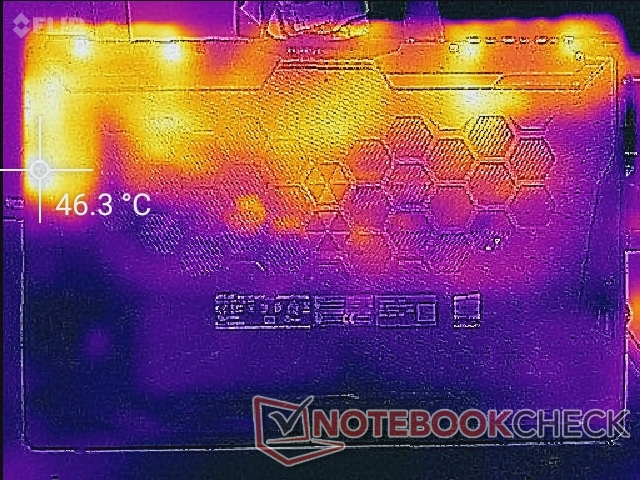
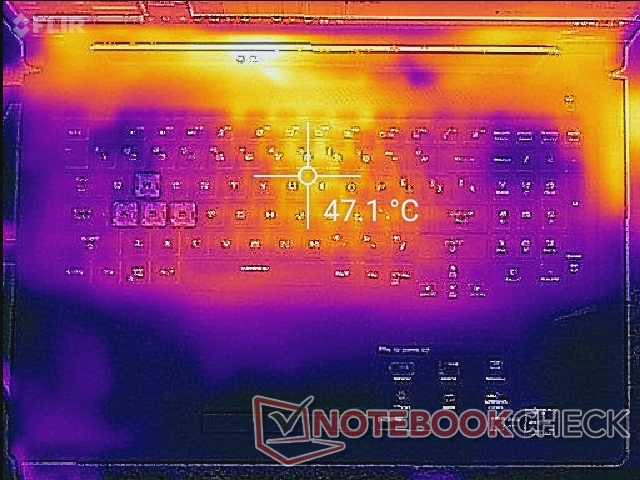
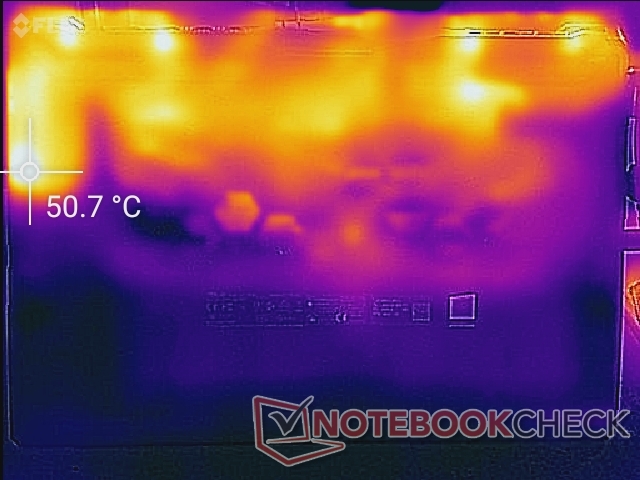
Temperature — Cool WASD keys and Palm Rests
Surface temperatures are not an issue when under high loads. The dual fans pull air from the WASD keys and NumPad keys to keep them cool and the plastic palm rests and touchpad remain cool as well even if hot spots around the rear can become as warm as 46 C. All-metal laptops like the Razer Blade 15 can be uncomfortably warm around the palm rests; when gaming, the palm rests on the Razer can be 10 C warmer than on our Asus (27 C vs 37 C).
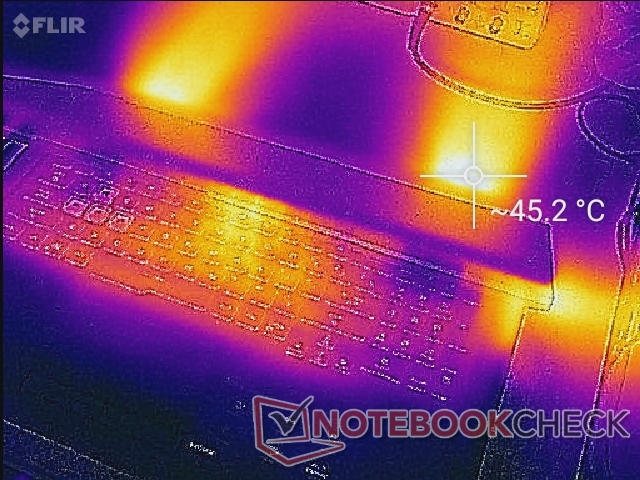
(-) The maximum temperature on the upper side is 47.6 °C / 118 F, compared to the average of 40.4 °C / 105 F, ranging from 21.2 to 68.8 °C for the class Gaming.
(-) The bottom heats up to a maximum of 50.8 °C / 123 F, compared to the average of 43.2 °C / 110 F
(+) In idle usage, the average temperature for the upper side is 29.3 °C / 85 F, compared to the device average of 33.8 °C / 93 F.
(±) Playing The Witcher 3, the average temperature for the upper side is 32.3 °C / 90 F, compared to the device average of 33.8 °C / 93 F.
(+) The palmrests and touchpad are cooler than skin temperature with a maximum of 28.6 °C / 83.5 F and are therefore cool to the touch.
(±) The average temperature of the palmrest area of similar devices was 28.9 °C / 84 F (+0.3 °C / 0.5 F).
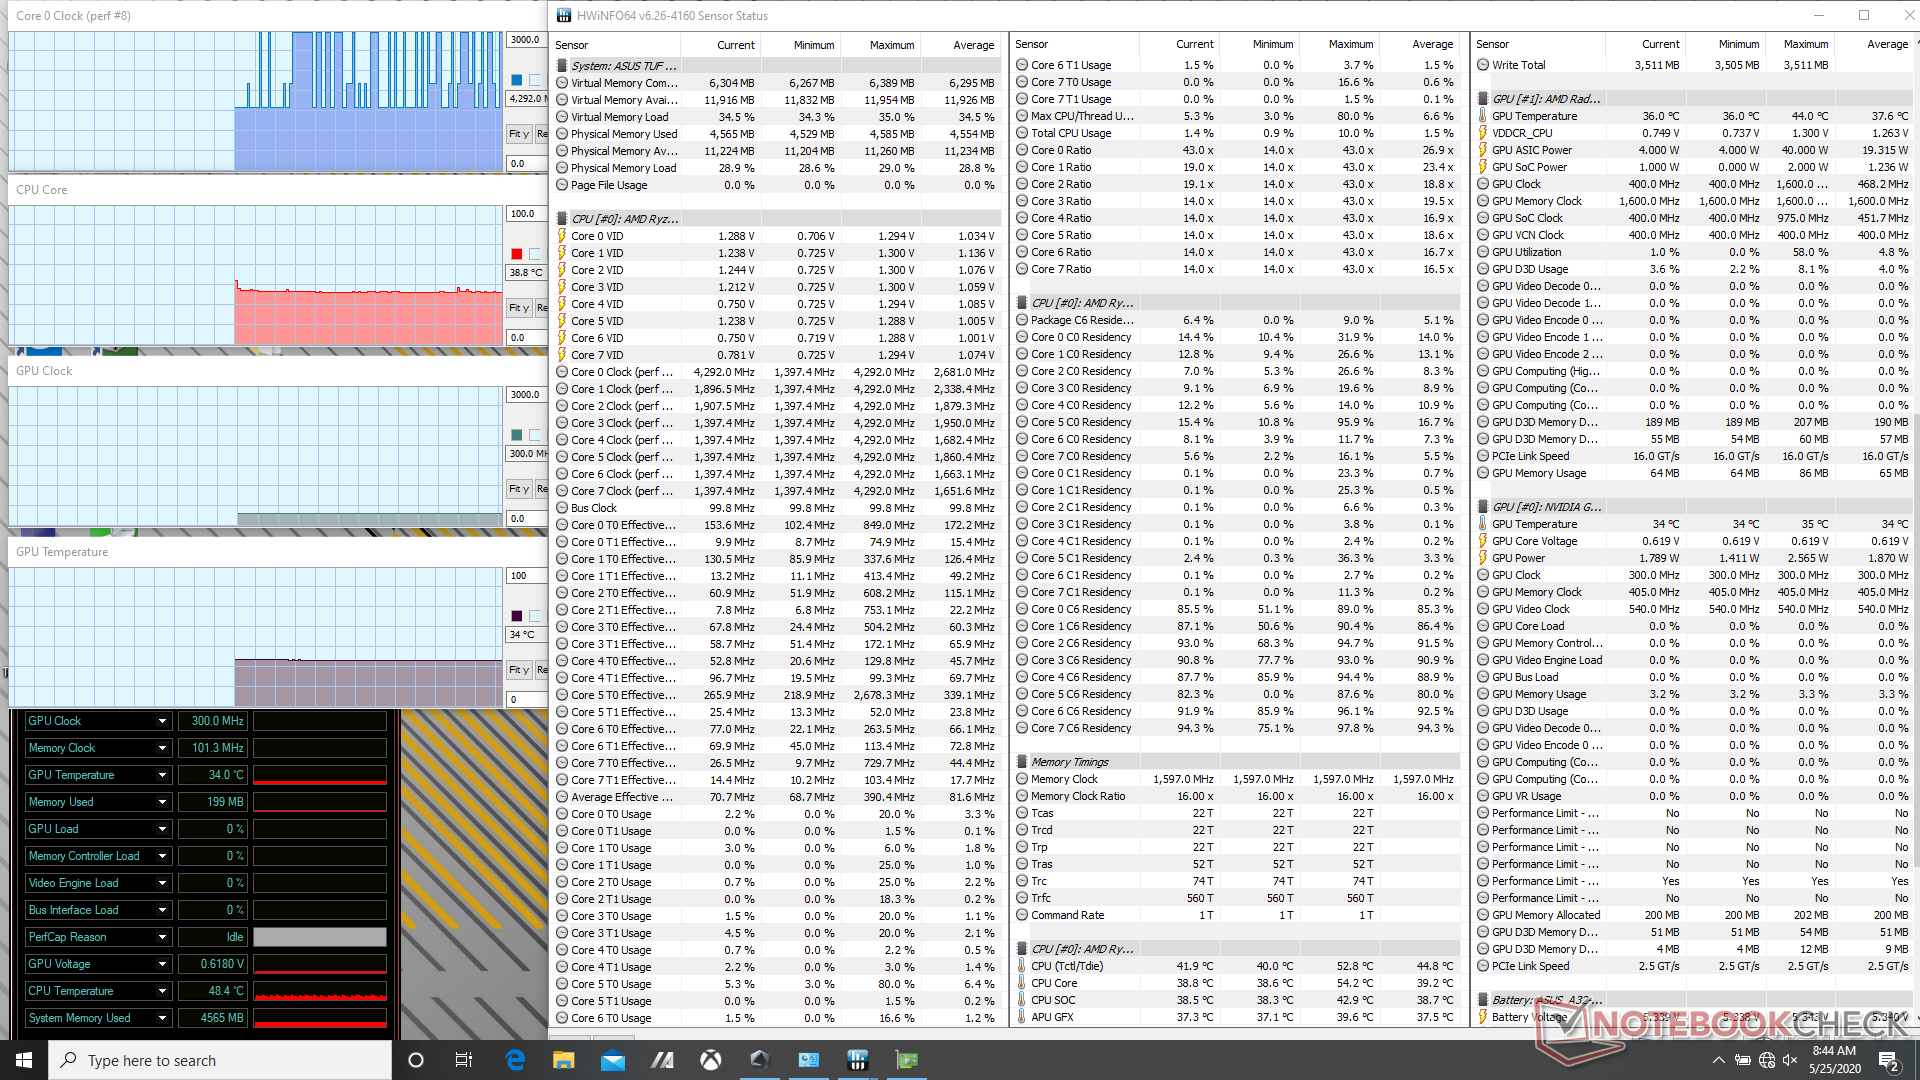
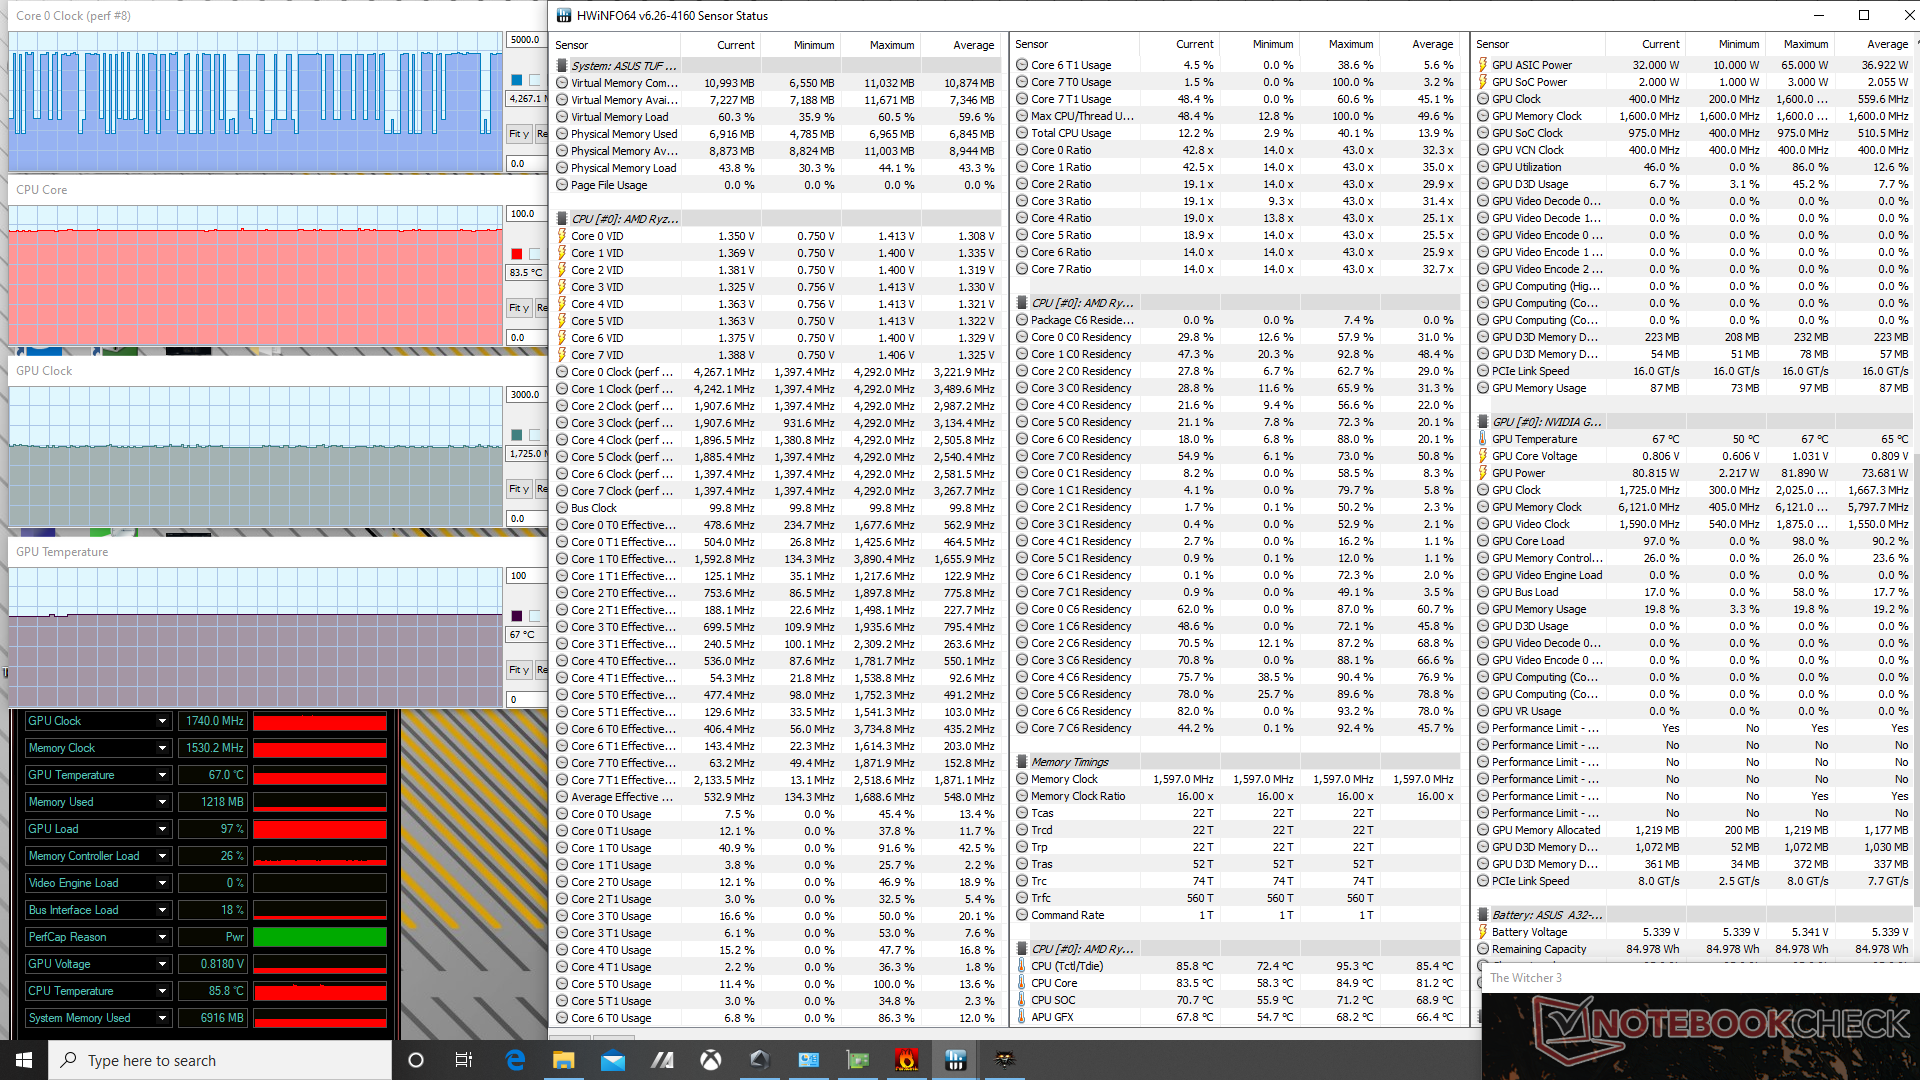
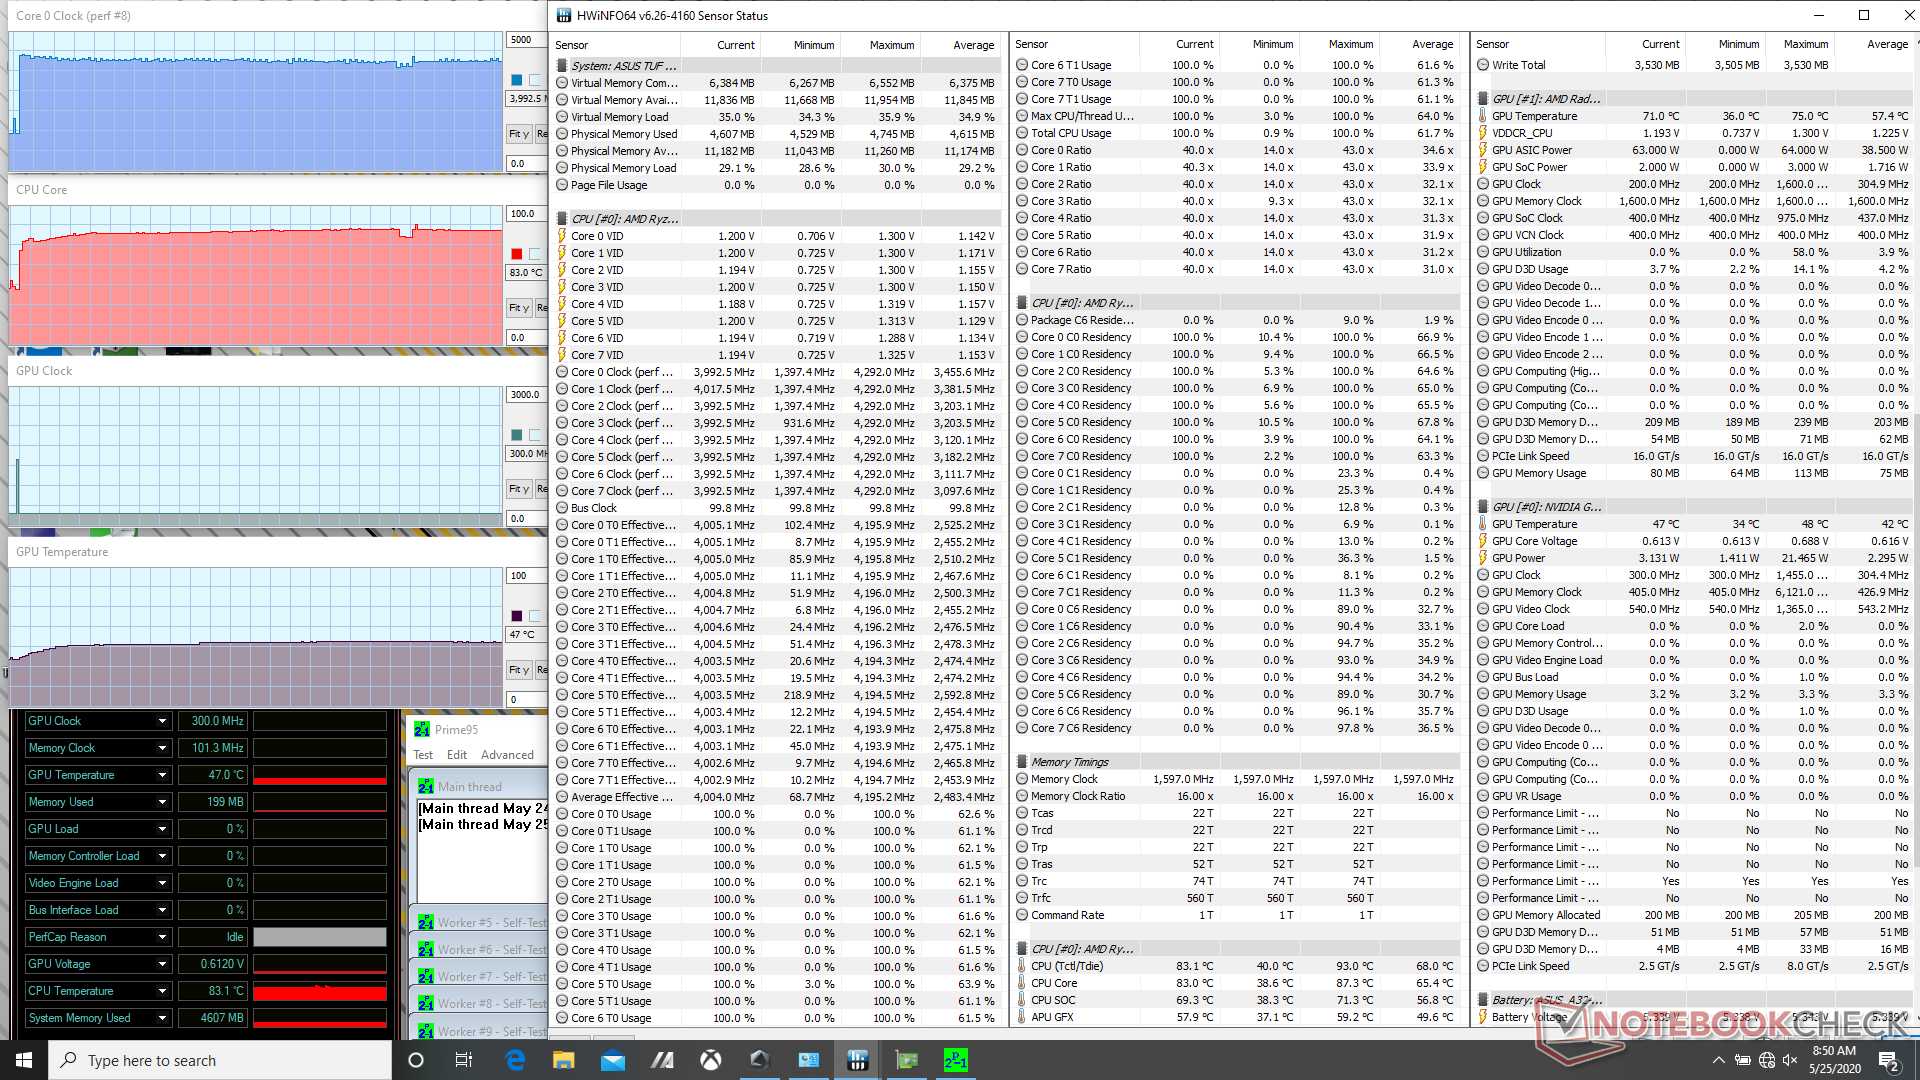
Stress Test — Reasonable Core Temperatures
We stress the system to identify for any potential throttling or stability issues. When running Prime95, the CPU would boost up to 4.2 GHz for just a few seconds before falling to 4 GHz and 83 C. After a few more minutes, clock rates and temperature would stabilize at 3.8 GHz and 75 C, respectively, when running on Turbo mode according to HWiNFO. Running both Prime95 and FurMark would cause the CPU to stabilize at a much higher 95 C and a lower core clock rate of 3.3 GHz.
Running Witcher 3 is more representative of gaming loads. Here, the CPU and GPU would stabilize at 83 C and 67 C, respectively, compared to 73 C and 64 C on the Razer Blade Pro 17 with the RTX 2060. GPU clock rate and memory will increase slightly (~1665 MHz to ~1740 MHz and 6000 MHz to 6121 MHz, respectively) if gaming on Turbo mode instead of Performance mode.
As usual, running on battery power will limit performance even if set to Windows High Performance mode. A Fire Strike run on batteries returns Physics and Graphics scores 12833 and 3937 points, respectively, compared to 21102 and 15334 points when on mains.
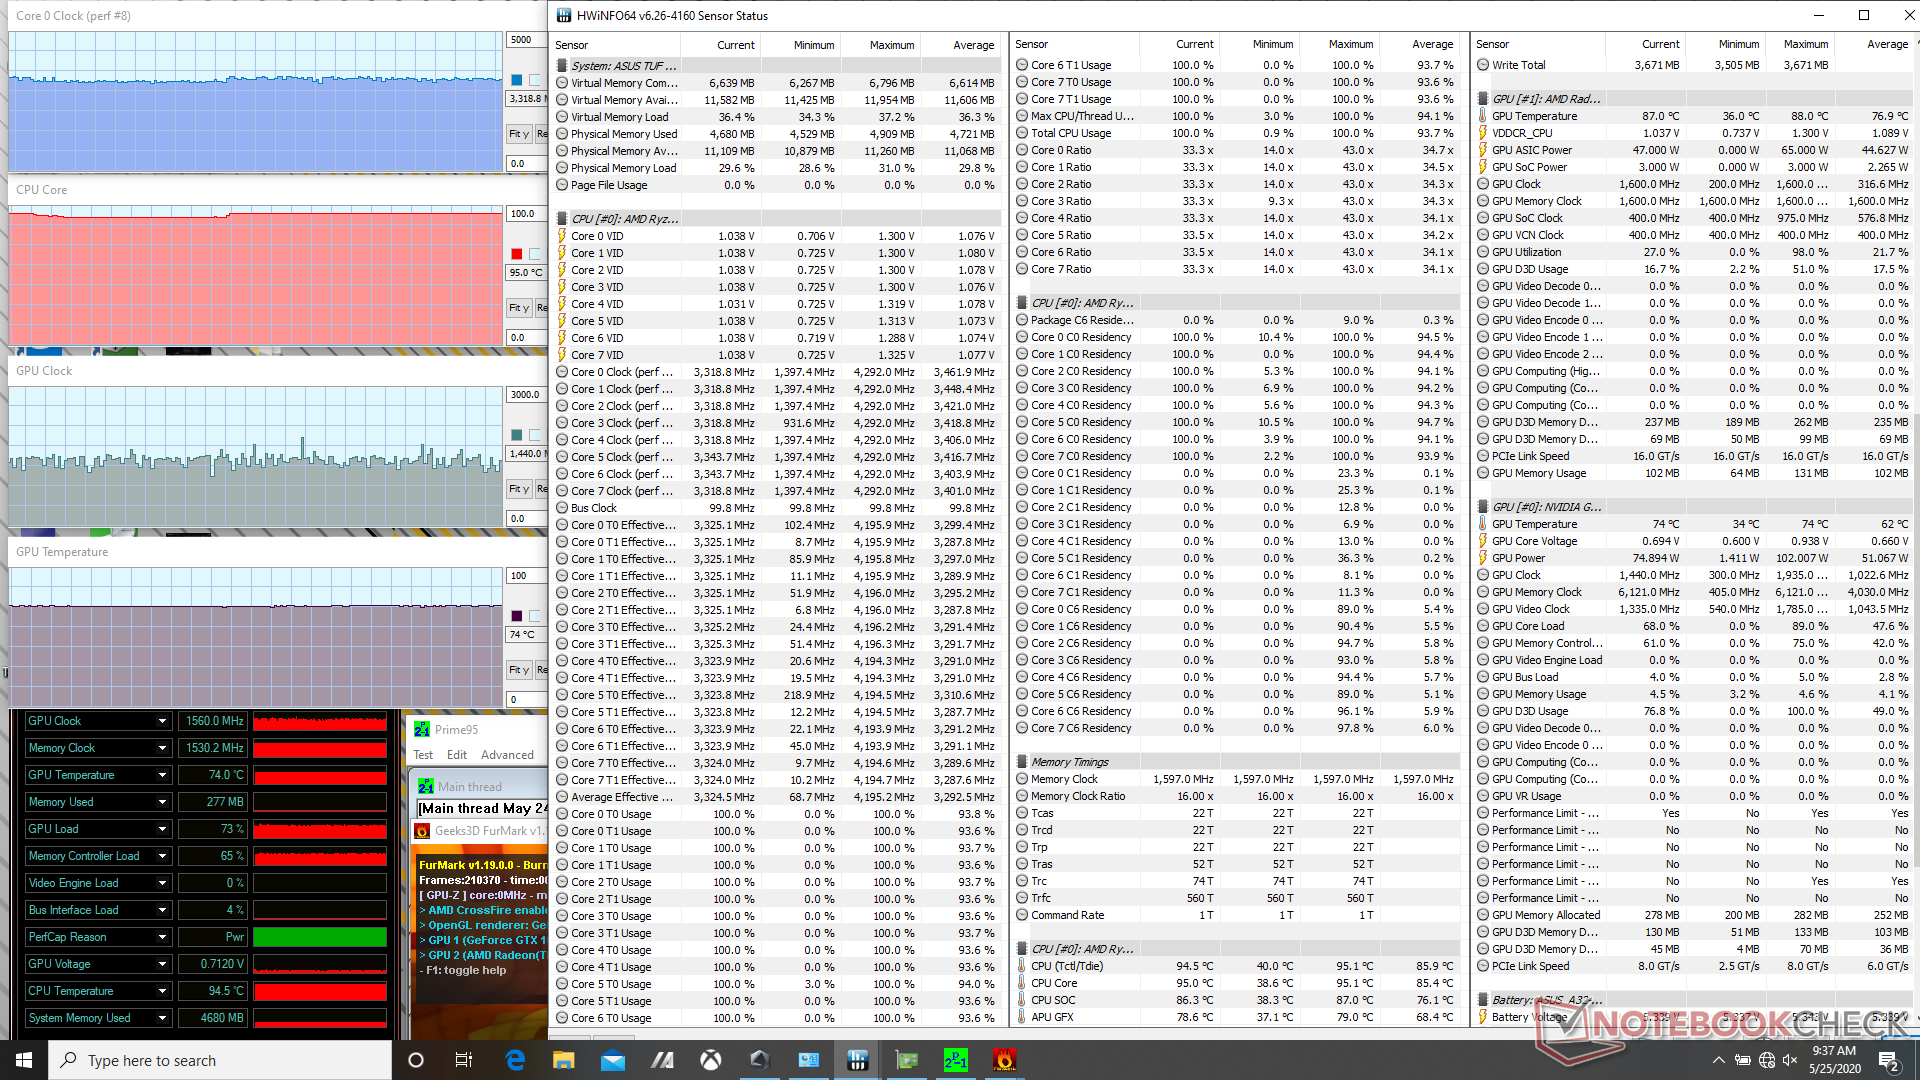
| CPU Clock (GHz) | GPU Clock (MHz) | Average CPU Temperature (°C) | Average GPU Temperature (°C) | |
| System Idle | -- | -- | 39 | 34 |
| Prime95 Stress | 3.8 | -- | 75 | 47 |
| Prime95 + FurMark Stress | 3.3 | 1560 | 95 | 74 |
| Witcher 3 Stress (Performance mode) | ~4.3 | ~1665 | 84 | 69 |
| Witcher 3 Stress (Turbo mode) | ~4.3 | ~1740 | 87 | 67 |
Speakers
Audio quality from the stereo speakers is nothing special. Bass is lacking and maximum volume is softer than what we recorded on the Razer Blade 15. High volume settings will not introduce any static or heavy imbalances, but the palm rests will vibrate slightly to the touch.


Asus TUF A17 FA706IU-AS76 audio analysis
(±) | speaker loudness is average but good (74 dB)
Bass 100 - 315 Hz
(±) | reduced bass - on average 12.7% lower than median
(±) | linearity of bass is average (11.5% delta to prev. frequency)
Mids 400 - 2000 Hz
(+) | balanced mids - only 4.8% away from median
(±) | linearity of mids is average (9.1% delta to prev. frequency)
Highs 2 - 16 kHz
(+) | balanced highs - only 3.1% away from median
(±) | linearity of highs is average (8.7% delta to prev. frequency)
Overall 100 - 16.000 Hz
(±) | linearity of overall sound is average (23.5% difference to median)
Compared to same class
» 83% of all tested devices in this class were better, 5% similar, 12% worse
» The best had a delta of 6%, average was 18%, worst was 132%
Compared to all devices tested
» 66% of all tested devices were better, 7% similar, 27% worse
» The best had a delta of 4%, average was 25%, worst was 134%
Apple MacBook 12 (Early 2016) 1.1 GHz audio analysis
(+) | speakers can play relatively loud (83.6 dB)
Bass 100 - 315 Hz
(±) | reduced bass - on average 11.3% lower than median
(±) | linearity of bass is average (14.2% delta to prev. frequency)
Mids 400 - 2000 Hz
(+) | balanced mids - only 2.4% away from median
(+) | mids are linear (5.5% delta to prev. frequency)
Highs 2 - 16 kHz
(+) | balanced highs - only 2% away from median
(+) | highs are linear (4.5% delta to prev. frequency)
Overall 100 - 16.000 Hz
(+) | overall sound is linear (10.2% difference to median)
Compared to same class
» 5% of all tested devices in this class were better, 2% similar, 93% worse
» The best had a delta of 5%, average was 19%, worst was 53%
Compared to all devices tested
» 3% of all tested devices were better, 1% similar, 96% worse
» The best had a delta of 4%, average was 25%, worst was 134%
Energy Management
Power Consumption — High CPU Performance-per-Watt
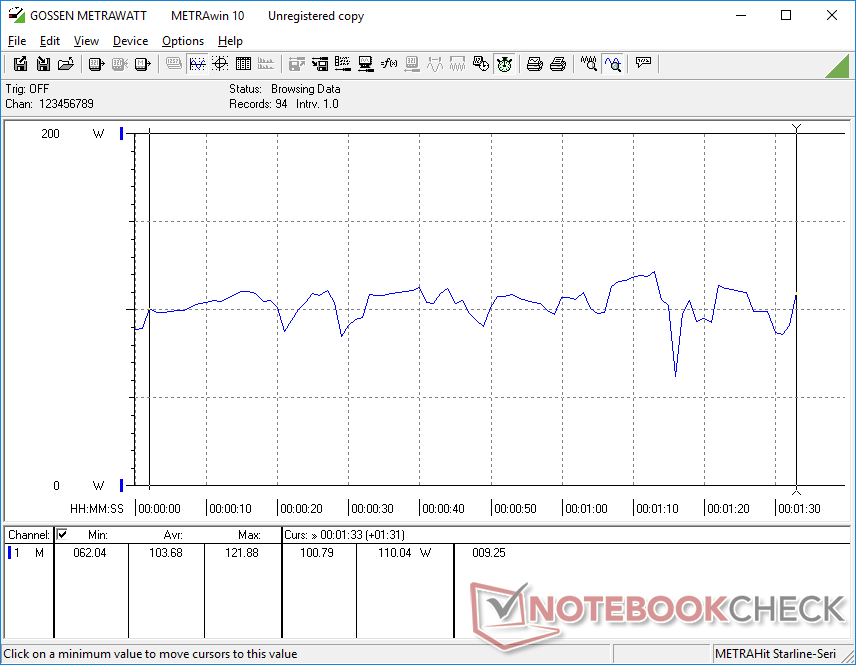
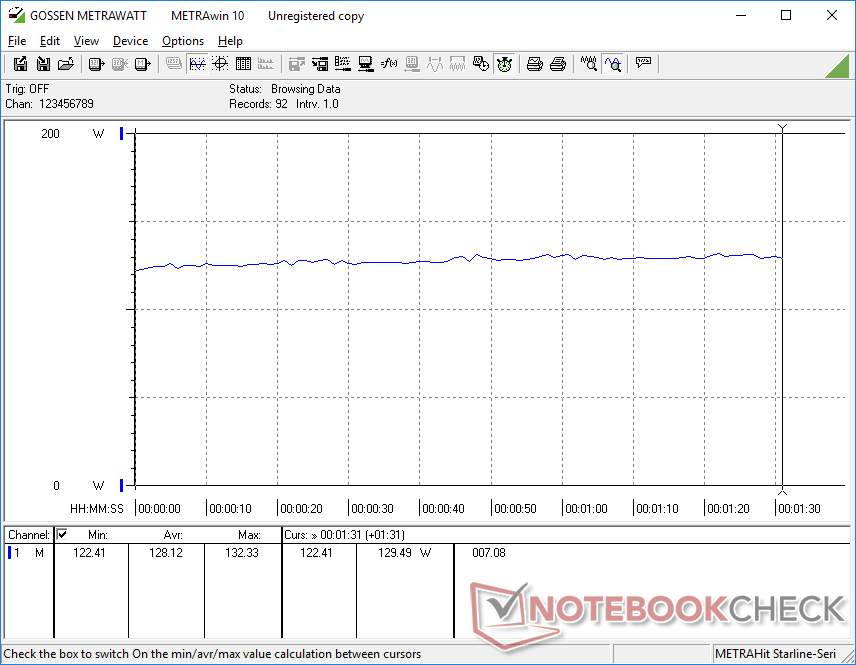
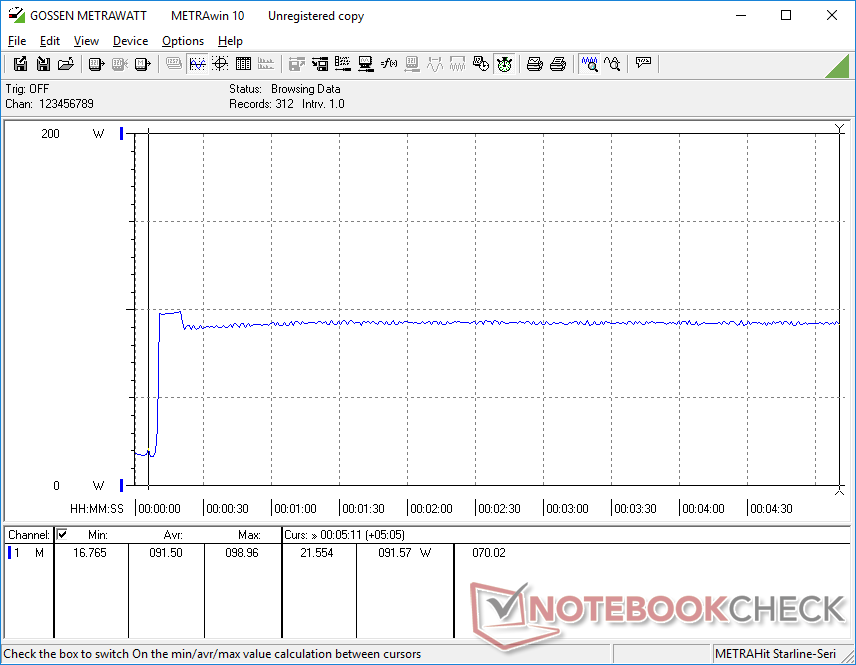
Idling on desktop demands between 7 W and 17 W depending on the power profile and brightness setting. When gaming, consumption will range between 103 W and 128 W compared to 113 W and 134 W on the Asus ROG Strix G GL731GU powered by the Core i7-9750H and same GTX 1660 Ti GPU. Thus, our TUF A17 is able to offer superior processor performance and about the same gaming performance than a Core i7-9750H laptop but at a higher performance-per-watt.
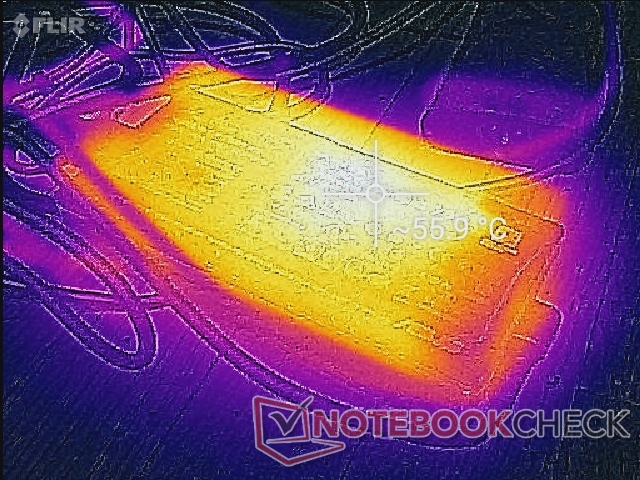
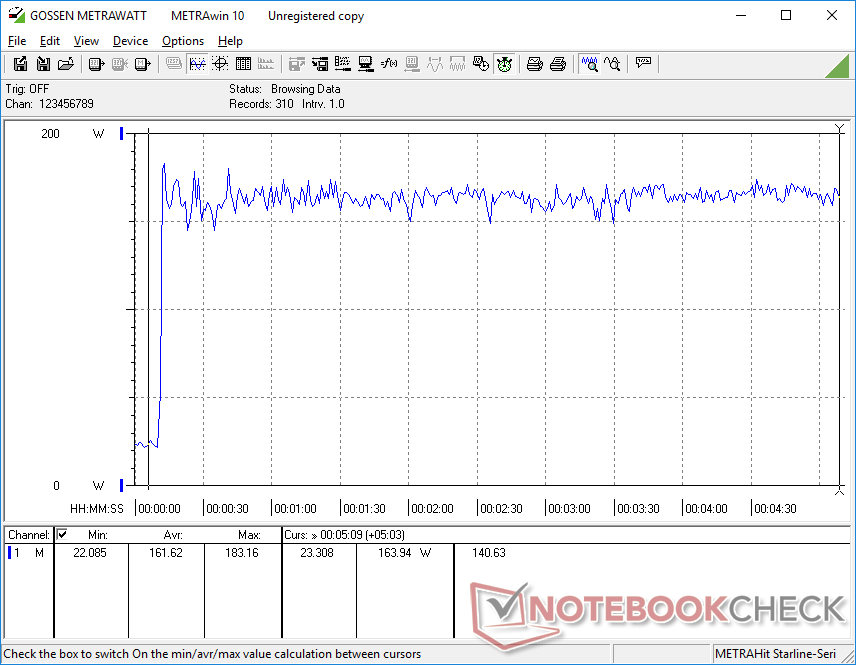
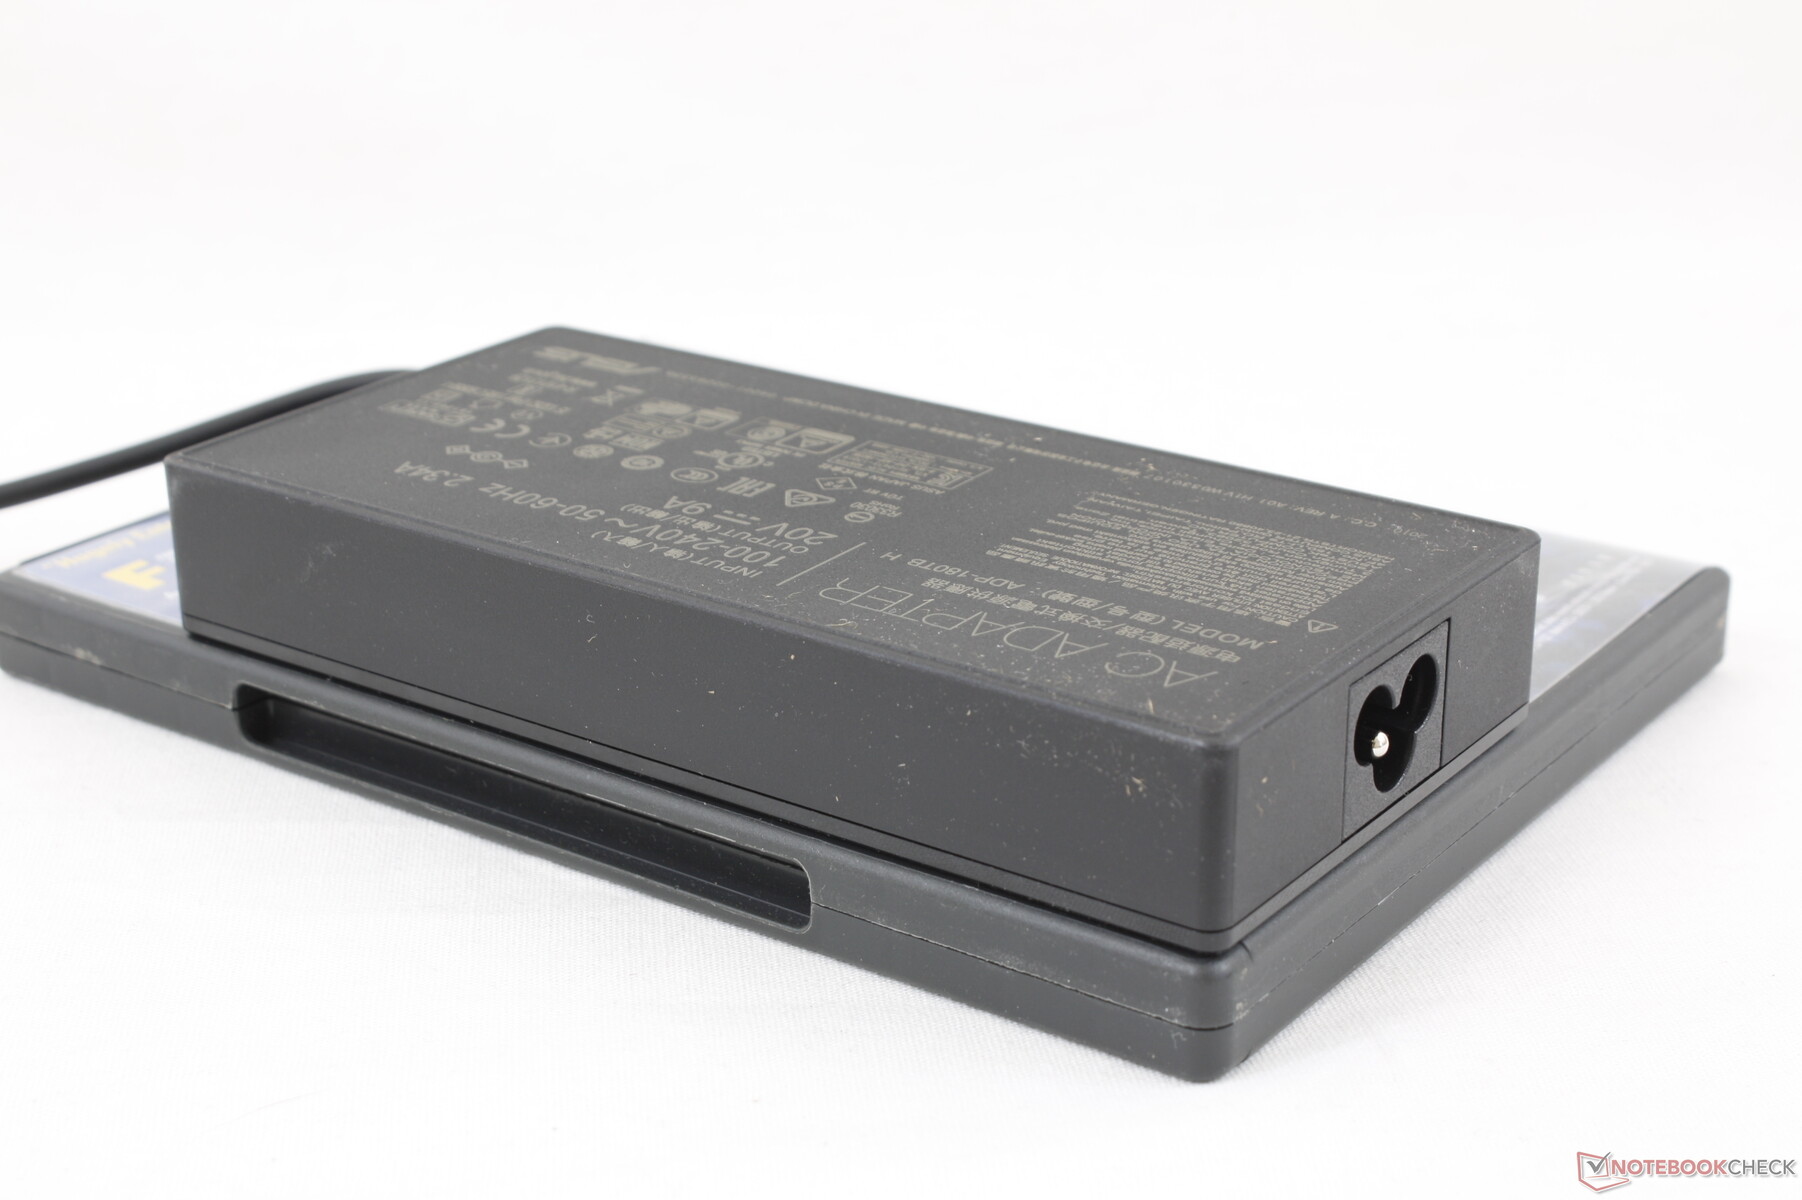
We're able to measure a maximum of 183 W from the medium-sized (~15.2 x 7.2 x 2.3 cm) 180 W AC adapter when running both Prime95 and FurMark simultaneously.
| Off / Standby | |
| Idle | |
| Load |
|
| Asus TUF A17 FA706IU-AS76 R7 4800H, GeForce GTX 1660 Ti Mobile, Intel SSD 660p 1TB SSDPEKNW010T8, IPS, 1920x1080, 17.30 | Asus ROG Strix G GL731GU-RB74 i7-9750H, GeForce GTX 1660 Ti Mobile, Intel SSD 660p SSDPEKNW512G8, IPS, 1920x1080, 17.30 | Dell G7 17 7790 i7-8750H, GeForce RTX 2070 Max-Q, Toshiba BG3 KBG30ZMS256G, IPS, 1920x1080, 17.30 | Lenovo Legion Y540-17IRH i5-9300H, GeForce GTX 1660 Ti Mobile, WDC PC SN520 SDAPNUW-512G, IPS, 1920x1080, 17.30 | Asus TUF FX705DT-AU068T R5 3550H, GeForce GTX 1650 Mobile, WDC PC SN520 SDAPNUW-256G, IPS, 1920x1080, 17.30 | Gigabyte Aero 17 HDR XB i7-10875H, GeForce RTX 2070 Super Max-Q, Samsung SSD PM981a MZVLB512HBJQ, IPS, 3840x2160, 17.30 | |
|---|---|---|---|---|---|---|
| Power Consumption | -61% | -23% | -56% | 37% | -57% | |
| Idle Minimum * | 7.4 | 13.6 -84% | 9.5 -28% | 19 -157% | 3.9 47% | 16 -116% |
| Idle Average * | 10.5 | 26.2 -150% | 16.2 -54% | 22 -110% | 9.6 9% | 19 -81% |
| Idle Maximum * | 17 | 35 -106% | 23.8 -40% | 30 -76% | 12.2 28% | 30 -76% |
| Load Average * | 103.7 | 113.6 -10% | 101.7 2% | 79 24% | 59 43% | 109 -5% |
| Witcher 3 ultra * | 128.1 | 134.1 -5% | 155 -21% | 134 -5% | 167 -30% | |
| Load Maximum * | 183.2 | 200.2 -9% | 172.2 6% | 201 -10% | 80 56% | 246 -34% |
* ... smaller is better
Battery Life — Huge 90 Wh Battery
We recorded long runtimes on last year's TUF FX705 and the newer TUF FA706 can last even longer thanks to its sizable 90 Wh battery. Expect almost 9 hours of real-world WLAN use which is well above average for any gaming laptop. Just remember to set the system to Balanced mode or lower with the integrated GPU active to reduce power consumption.
As noted earlier in the review, SKUs with the 2.5-inch SATA III bay will come with a much smaller 48 Wh battery for about half the runtime. It's a trade-off that users will want to consider before purchasing.
Charging from empty to full capacity takes about two hours.
| Asus TUF A17 FA706IU-AS76 R7 4800H, GeForce GTX 1660 Ti Mobile, 90 Wh | MSI GP75 Leopard 9SD i7-9750H, GeForce GTX 1660 Ti Mobile, 51 Wh | Dell G7 17 7790 i7-8750H, GeForce RTX 2070 Max-Q, 60 Wh | HP Pavilion Gaming 17-cd0085cl i7-9750H, GeForce GTX 1660 Ti Max-Q, 52.5 Wh | Lenovo Legion Y540-17IRH i5-9300H, GeForce GTX 1660 Ti Mobile, 57 Wh | Asus TUF FX705DT-AU068T R5 3550H, GeForce GTX 1650 Mobile, 64 Wh | |
|---|---|---|---|---|---|---|
| Battery Runtime | -64% | -33% | -25% | -55% | 2% | |
| Reader / Idle | 543 | 286 -47% | 511 -6% | 695 28% | 311 -43% | 815 50% |
| WiFi v1.3 | 512 | 190 -63% | 236 -54% | 339 -34% | 220 -57% | 469 -8% |
| Load | 196 | 38 -81% | 119 -39% | 59 -70% | 68 -65% | 124 -37% |
Pros
Cons
Verdict — Better than the FX705 in Almost Every Way
The TUF series is supposed to be Asus' budget family of gaming laptops in contrast to the higher-end ROG series. This latest model, however, brings it much closer to its costlier siblings than we had expected in terms of features and performance. The fact that you can get a 120 Hz display with fast refresh rates, both adaptive sync and Optimus, long battery life, easily accessible storage options, a rigid metal outer lid, and even Core i9-like performance all out of a $1100 USD gaming laptop is pretty remarkable. It was only just a couple of years ago that some of these features were exclusive to expensive Zephyrus laptops or other ultra-thins.
Of course, some corners had to be cut, but most are auxiliary or superficial. Gamers who want per-key RGB lighting, Wi-Fi 6, 144+ Hz refresh rates, even faster black-white response times, more powerful speakers, wider sRGB coverage, Thunderbolt 3, and a non-plastic base will have to spend more and look beyond the affordable TUF series. The core gaming experience is the best it's ever been for the TUF series so long as you can handle the loud fans and unreasonably small arrow keys.
The TUF FA706 is such a huge gen-to-gen upgrade that it makes the previous TUF FX705 series look like child's play. This is easily one of the better budget gaming laptops you can buy right now with both CPU performance rivaling most Core i9 laptops and a stronger chassis design than most other plastic gaming laptops.
Asus TUF A17 FA706IU-AS76
-
05/25/2020 v7
Allen Ngo
More articles related to this device
Asus TUF A17 FA706IU-AS76 (TUF Gaming A17 FA706 Series)Related Articles


Pricecompare
