 Deutsch
 English
 Español
 Français
 Italiano
 Nederlands
 Polski
 Português
 Русский
 Türkçe
 Svenska
 Chinese
 Magyar
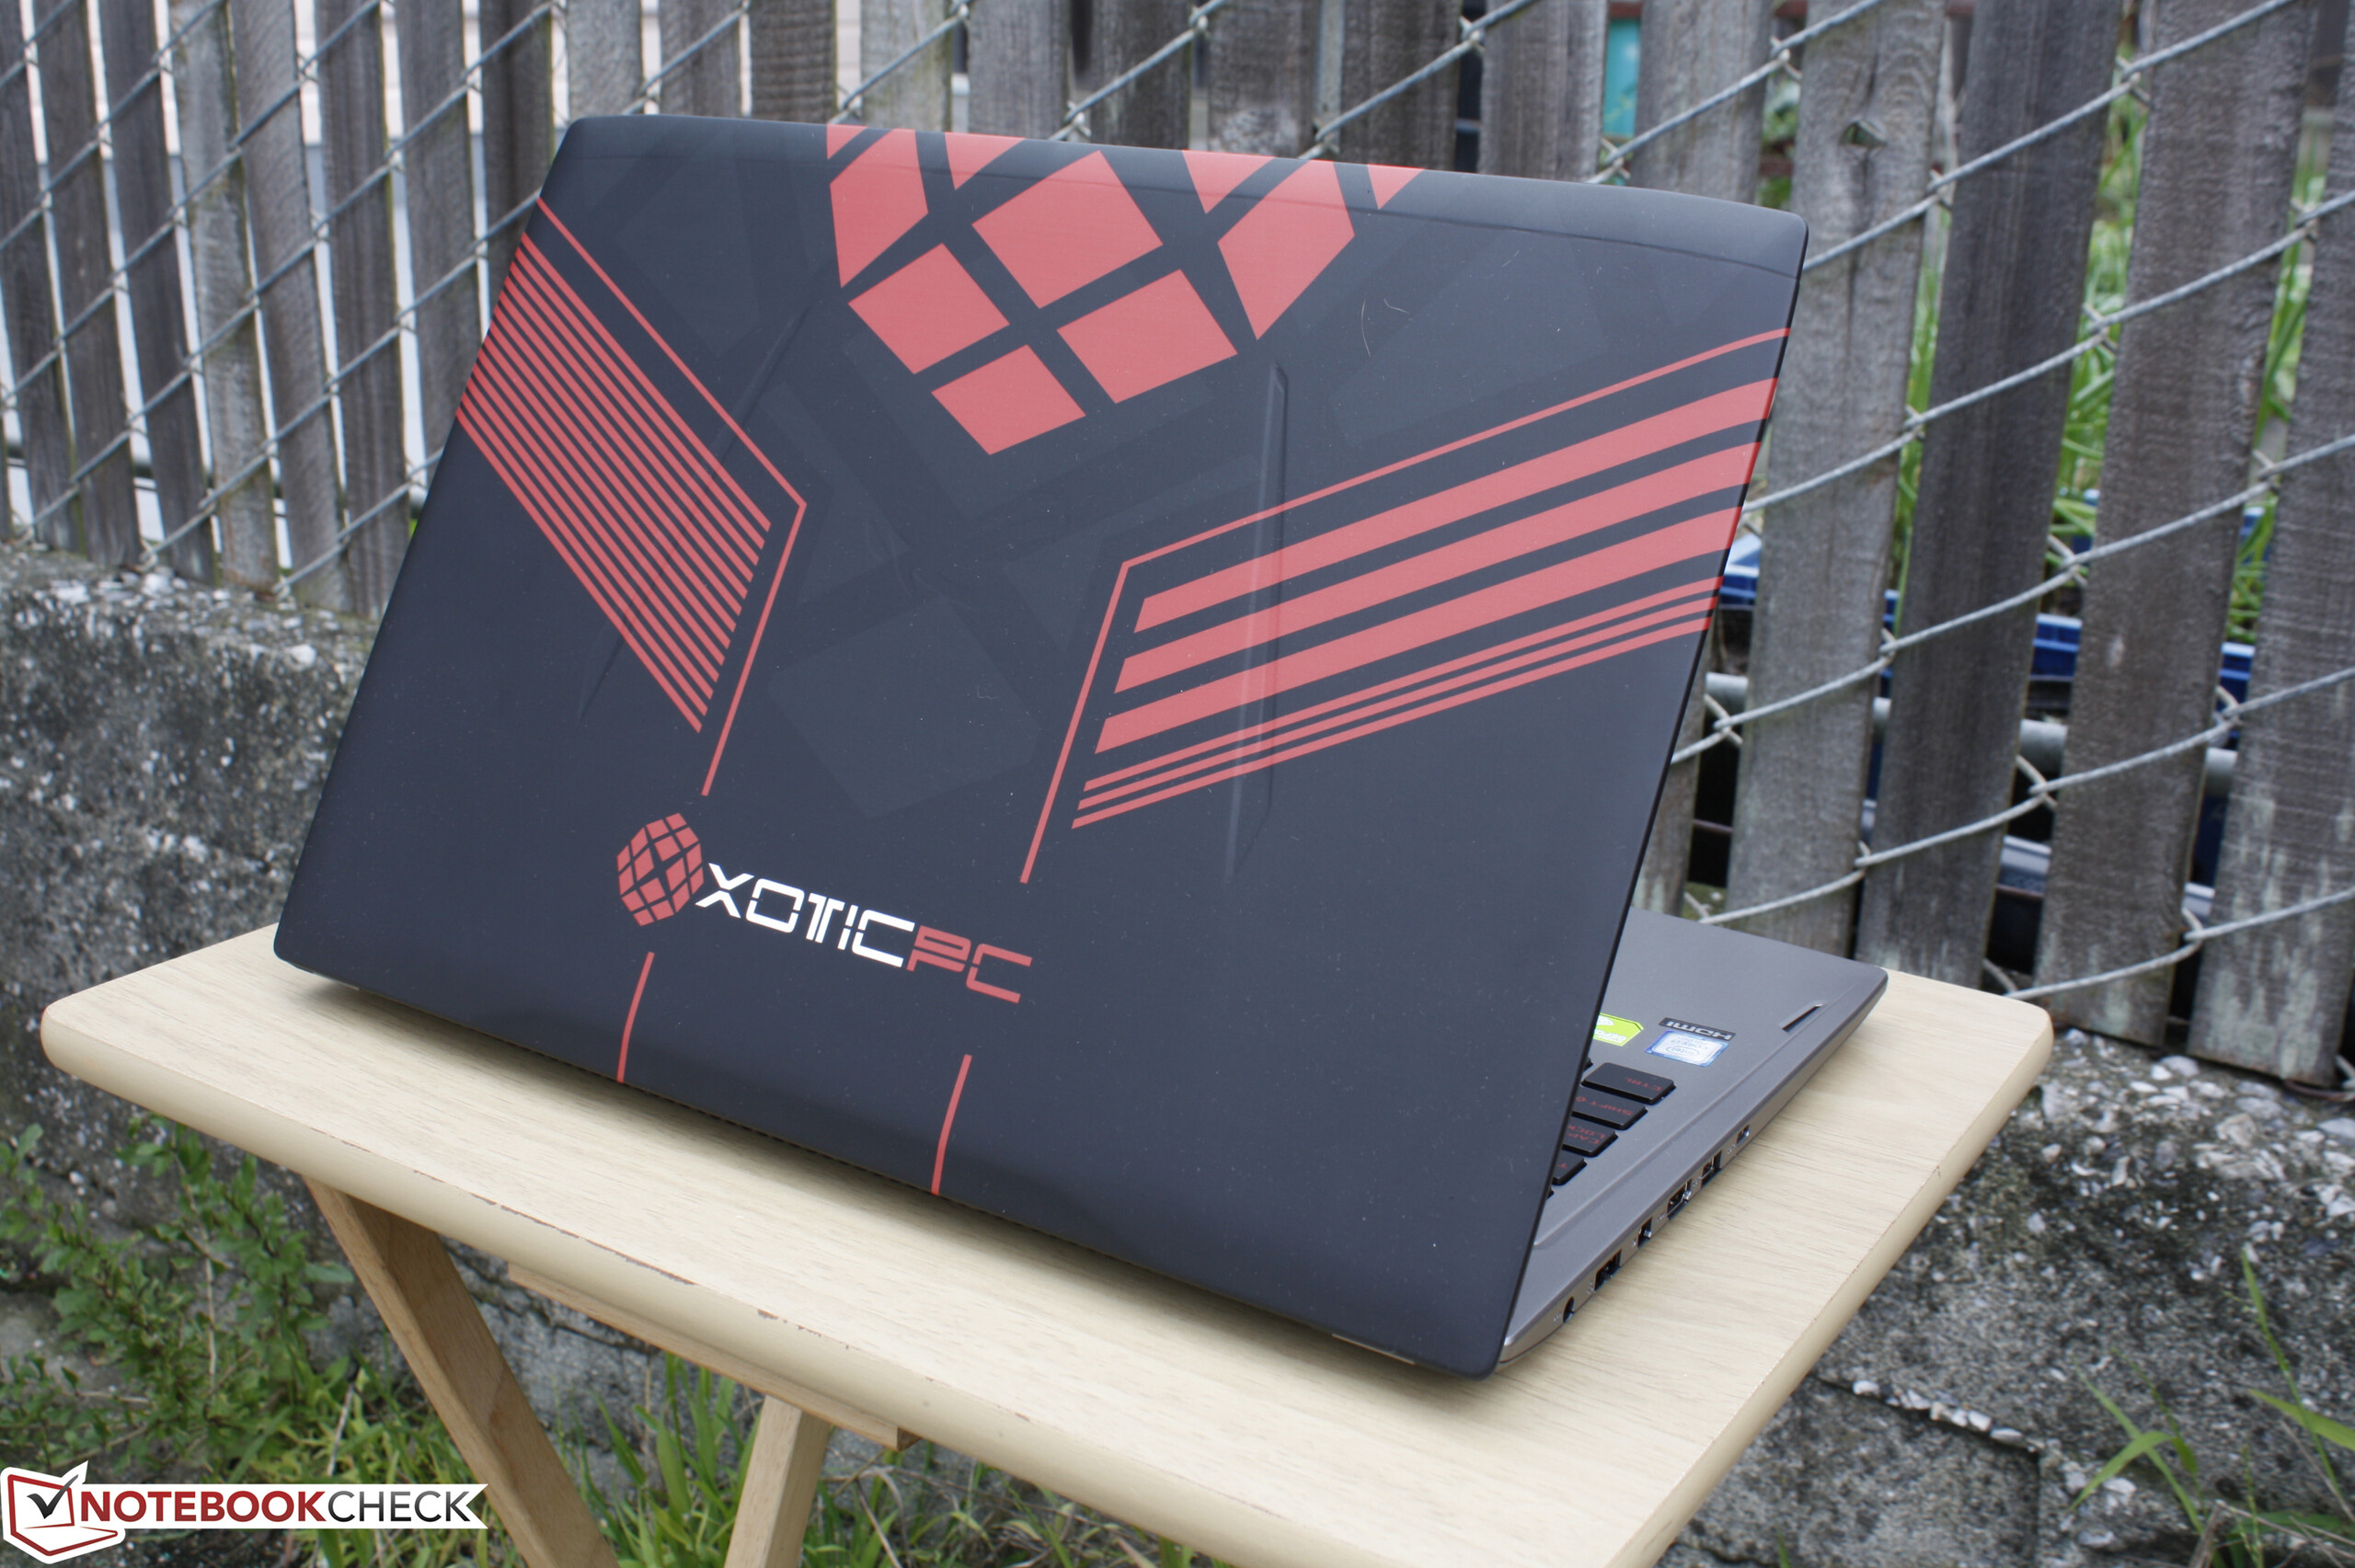
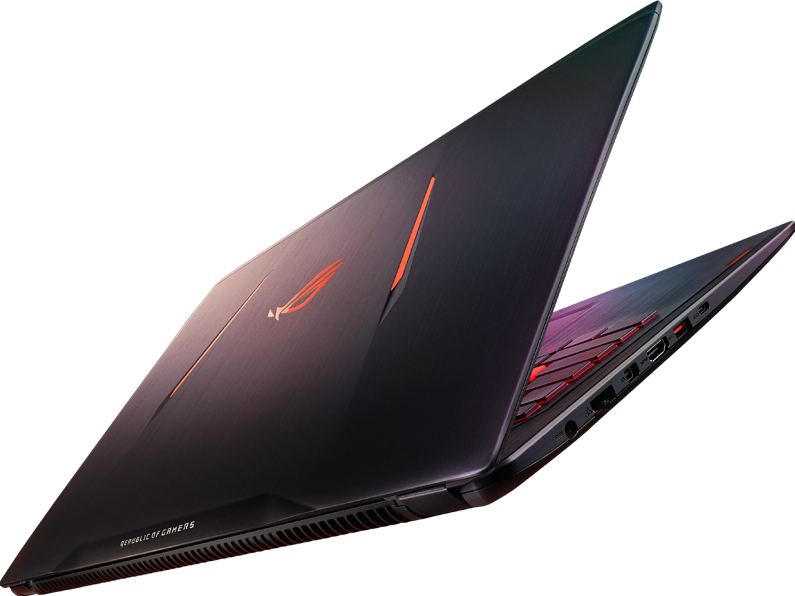
Asus Strix GL502VM-DS74 Xotic PC Edition Notebook Review
Asus and many other manufacturers have been quietly updating their respective gaming notebook series from Skylake to Kaby Lake now that the mobile HQ series of processors have been officially unveiled. One of the first refreshed units to make it to us for testing is the GL502VM with the Core i7-7700HQ. We published on the previous GL502VM SKU with the Skylake i7-6700HQ just over a month ago and we highly recommend checking out its page for more info since this Kaby Lake SKU shares the same chassis and features.
The mainstream Asus GL502/GL702 series sits above the budget-friendly GL552/GL752 series and is the smaller and lighter option when compared to Asus' crown G752/G701 series. The mainstream gaming notebook category shouldn't be underestimated now that Pascal has made 1060p60 gaming a reality on thinner designs like the GL502VM. Keep in mind that there are major differences in chassis size and weight when comparing the GL502VM to the GL502VS similar to the size differences between the Asus G752VT and G752VY.
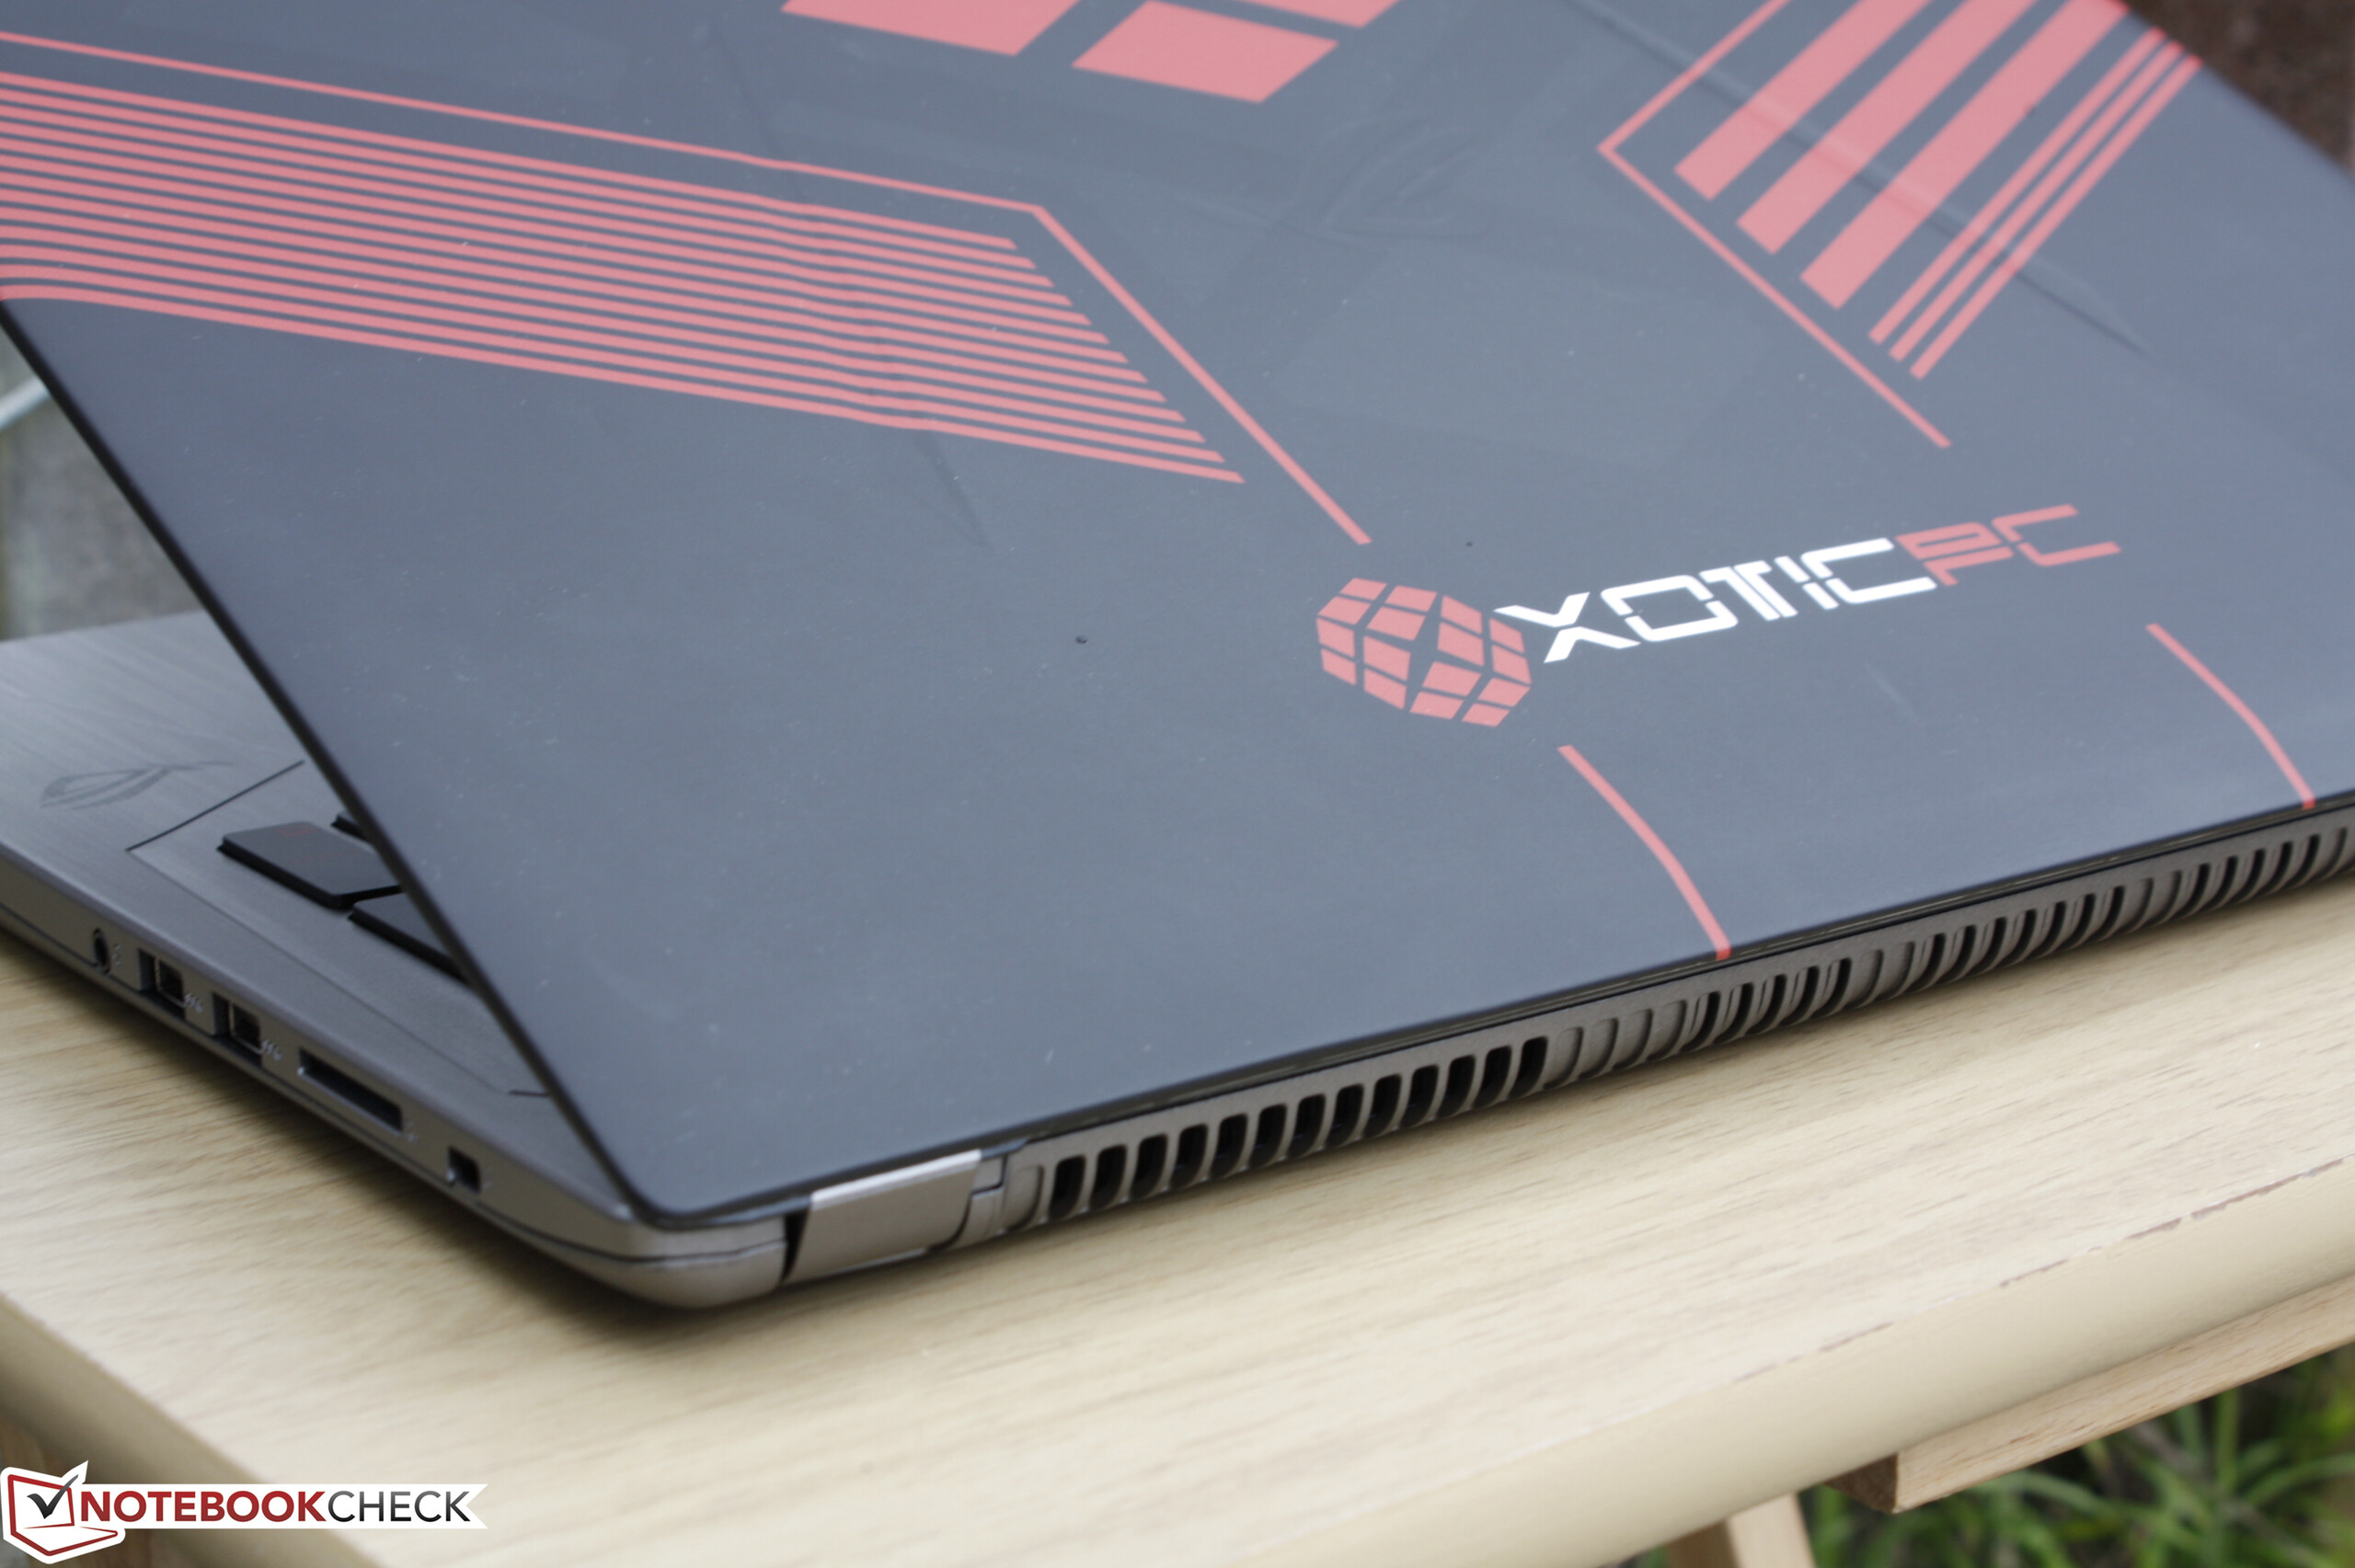
Our Kaby Lake GL502VM test unit comes directly from reseller Xotic PC who often tinkers with certain settings and other software. Thus, our performance results and measurements below do not completely reflect a stock Asus Strix GL502VM model.
Case
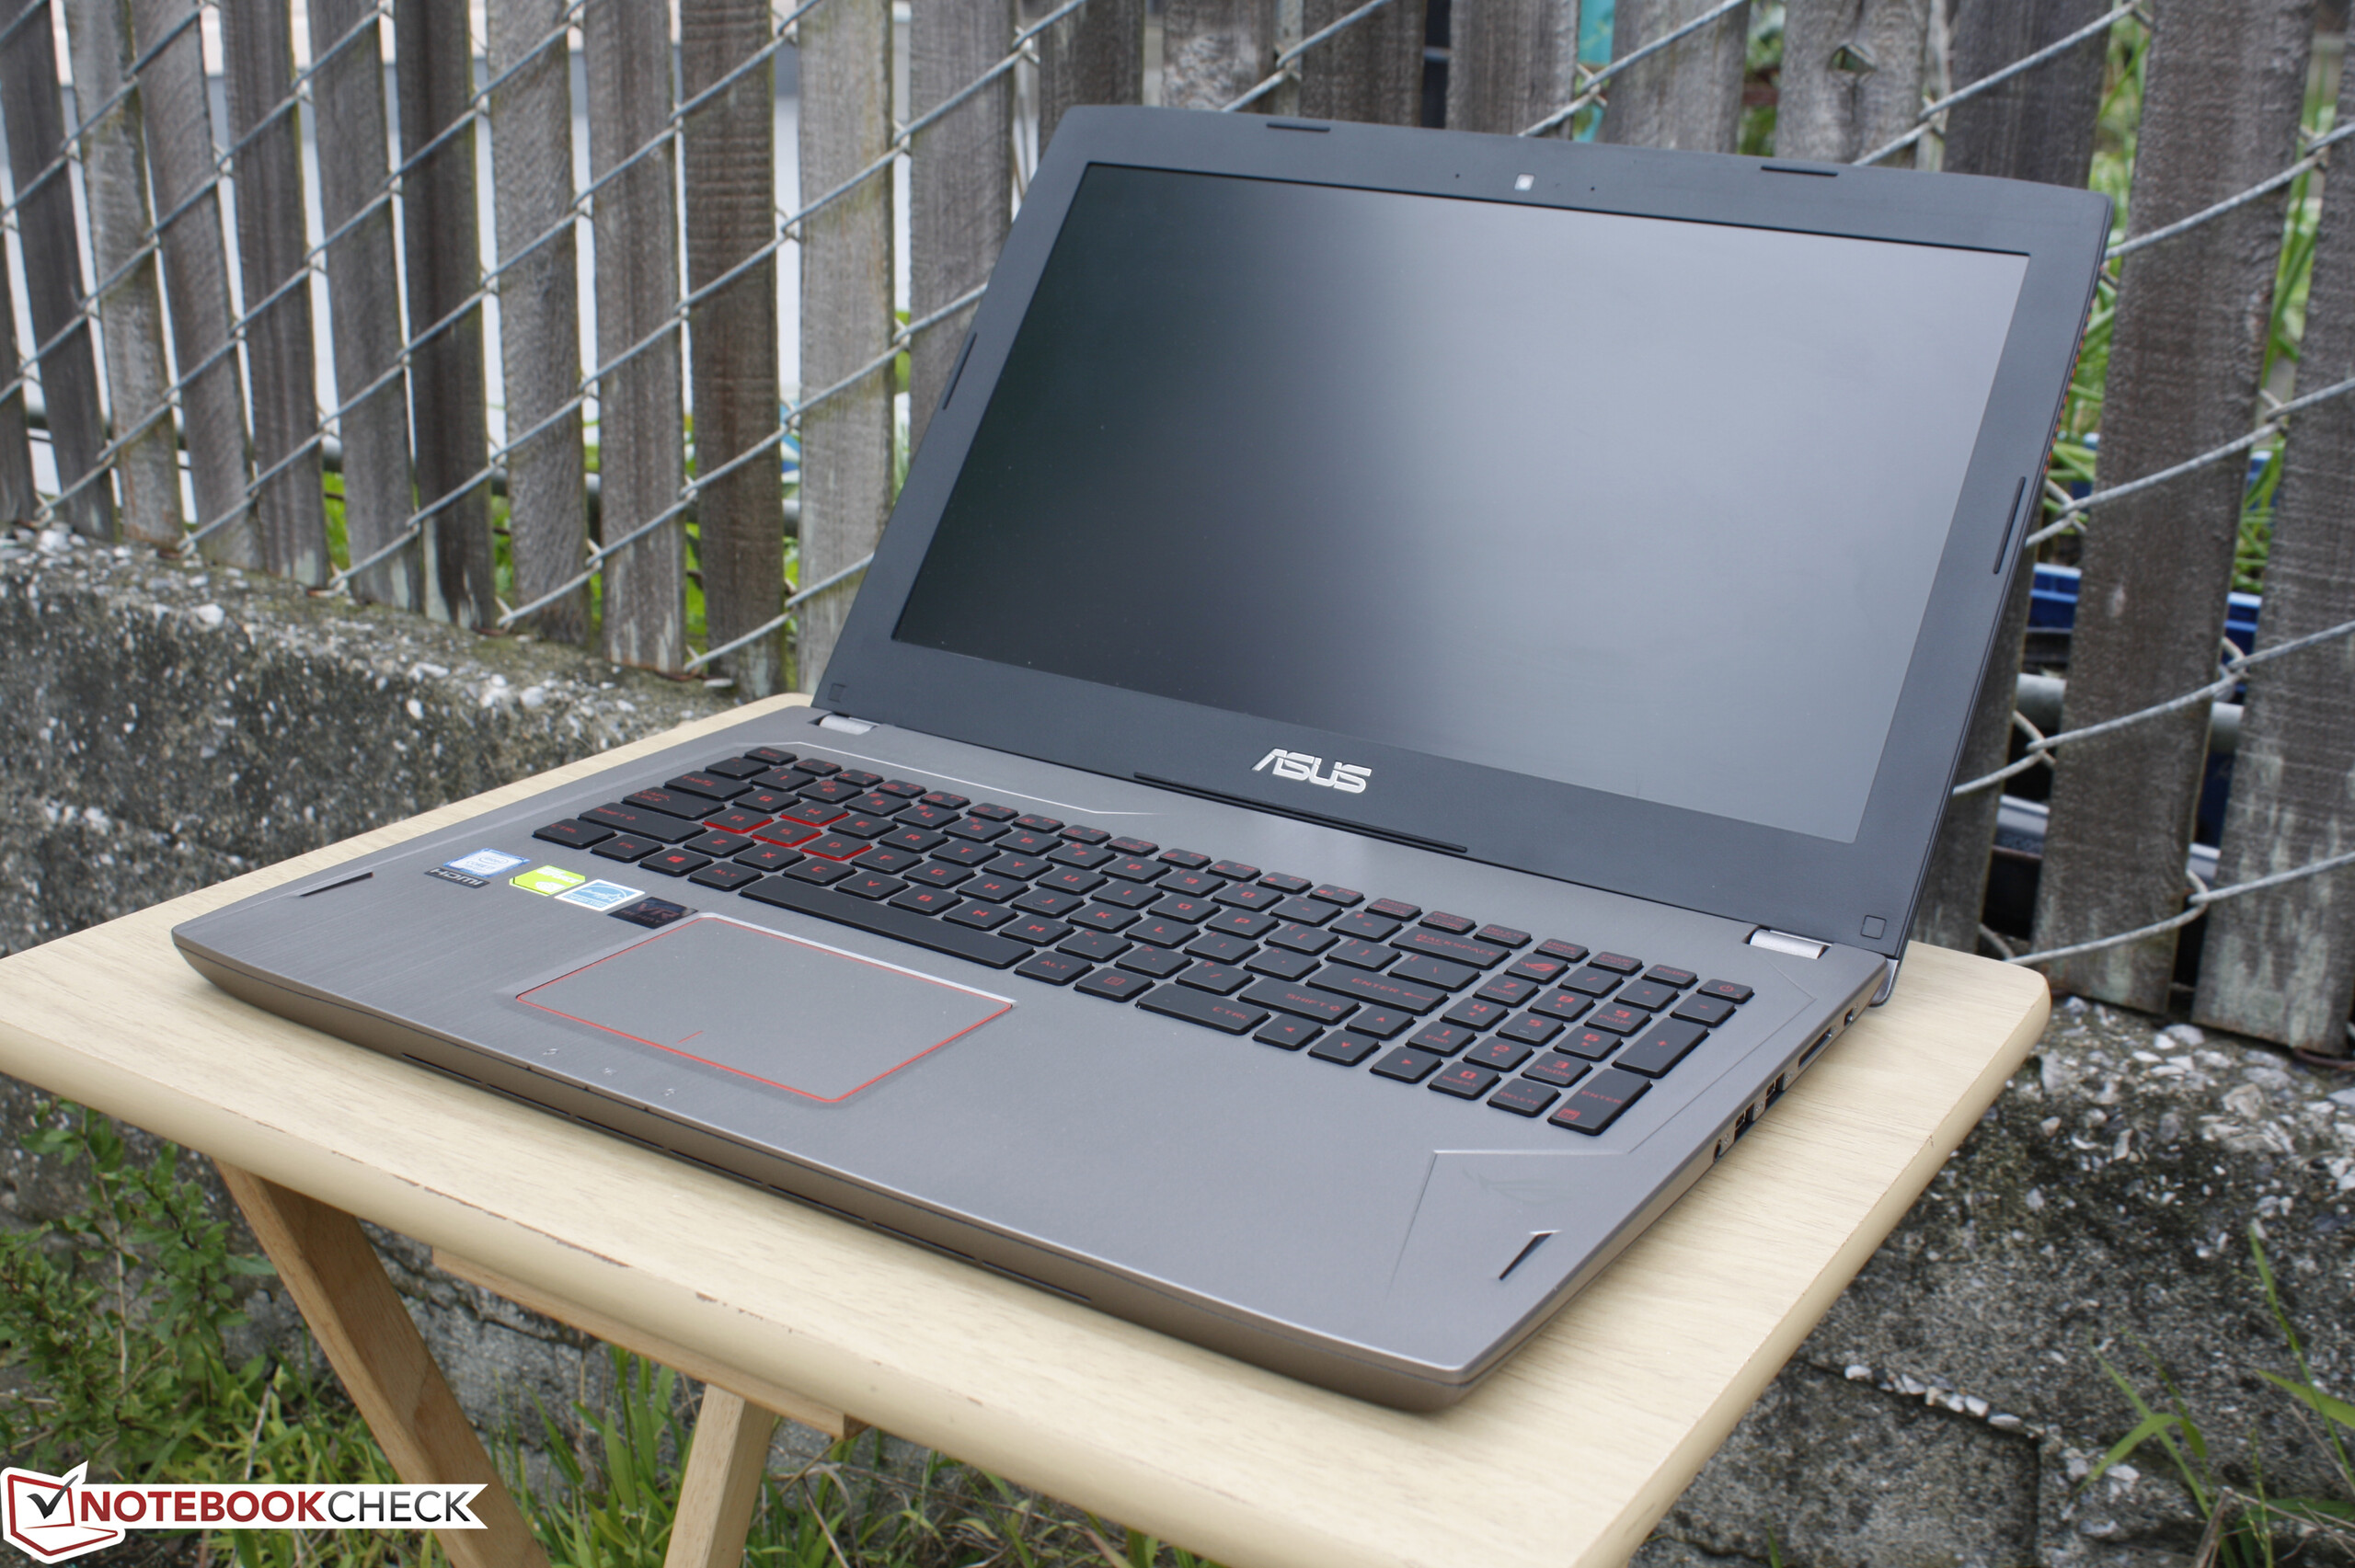
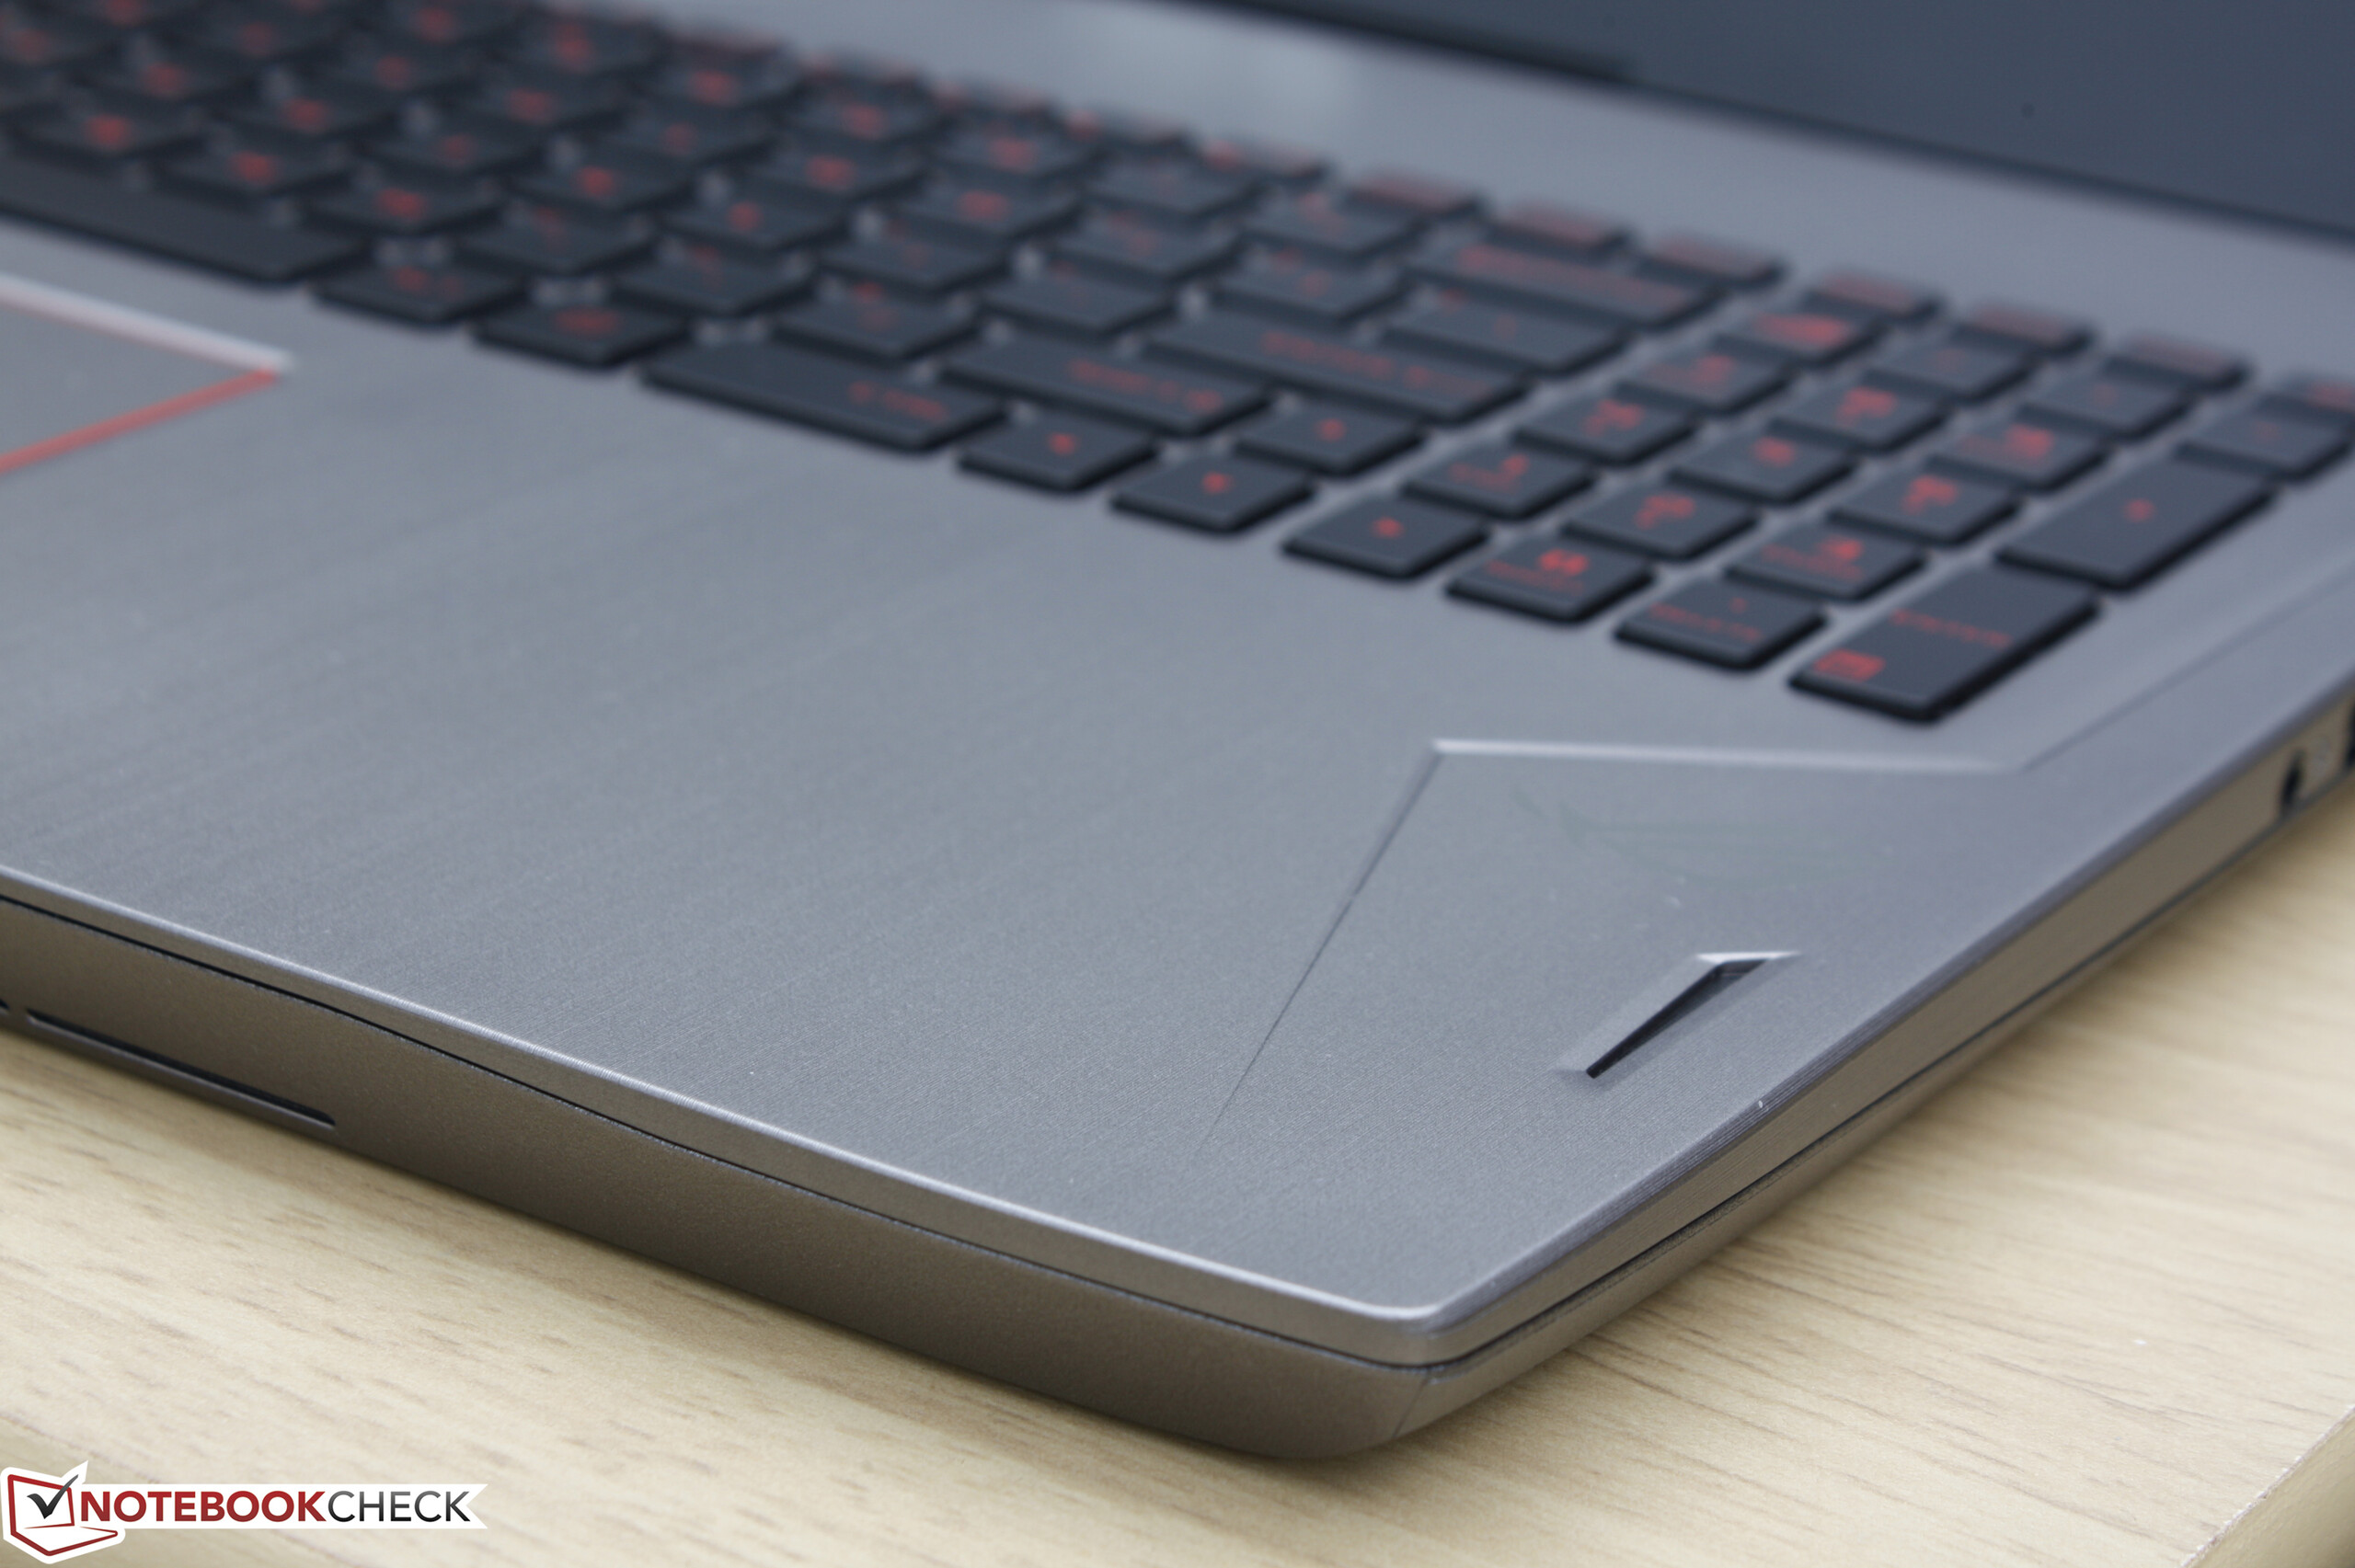
Case quality is excellent despite this model not belonging to Asus' flagship G75x series. Surfaces do not creak and both the textured aluminum palm rests and plastic bottom feel rigid and of high quality. Nonetheless, certain areas flex more easily than on the G75x series including the centers of the keyboard and the outer lid, but the warping is fortunately not significant enough to be of any concern. The hinges are sufficient enough to prevent teetering when typing up to their maximum supported angle of about 130 degrees.
There are no unintended gaps between materials on our specific test unit. The inner plastic bezel around the display, however, does not sit perfectly against the outer edges of the screen. This is quite minor and certainly not as noticeable as on our recent GT72 test unit. Beyond that, there's little to complain about the build of the GL502VM.
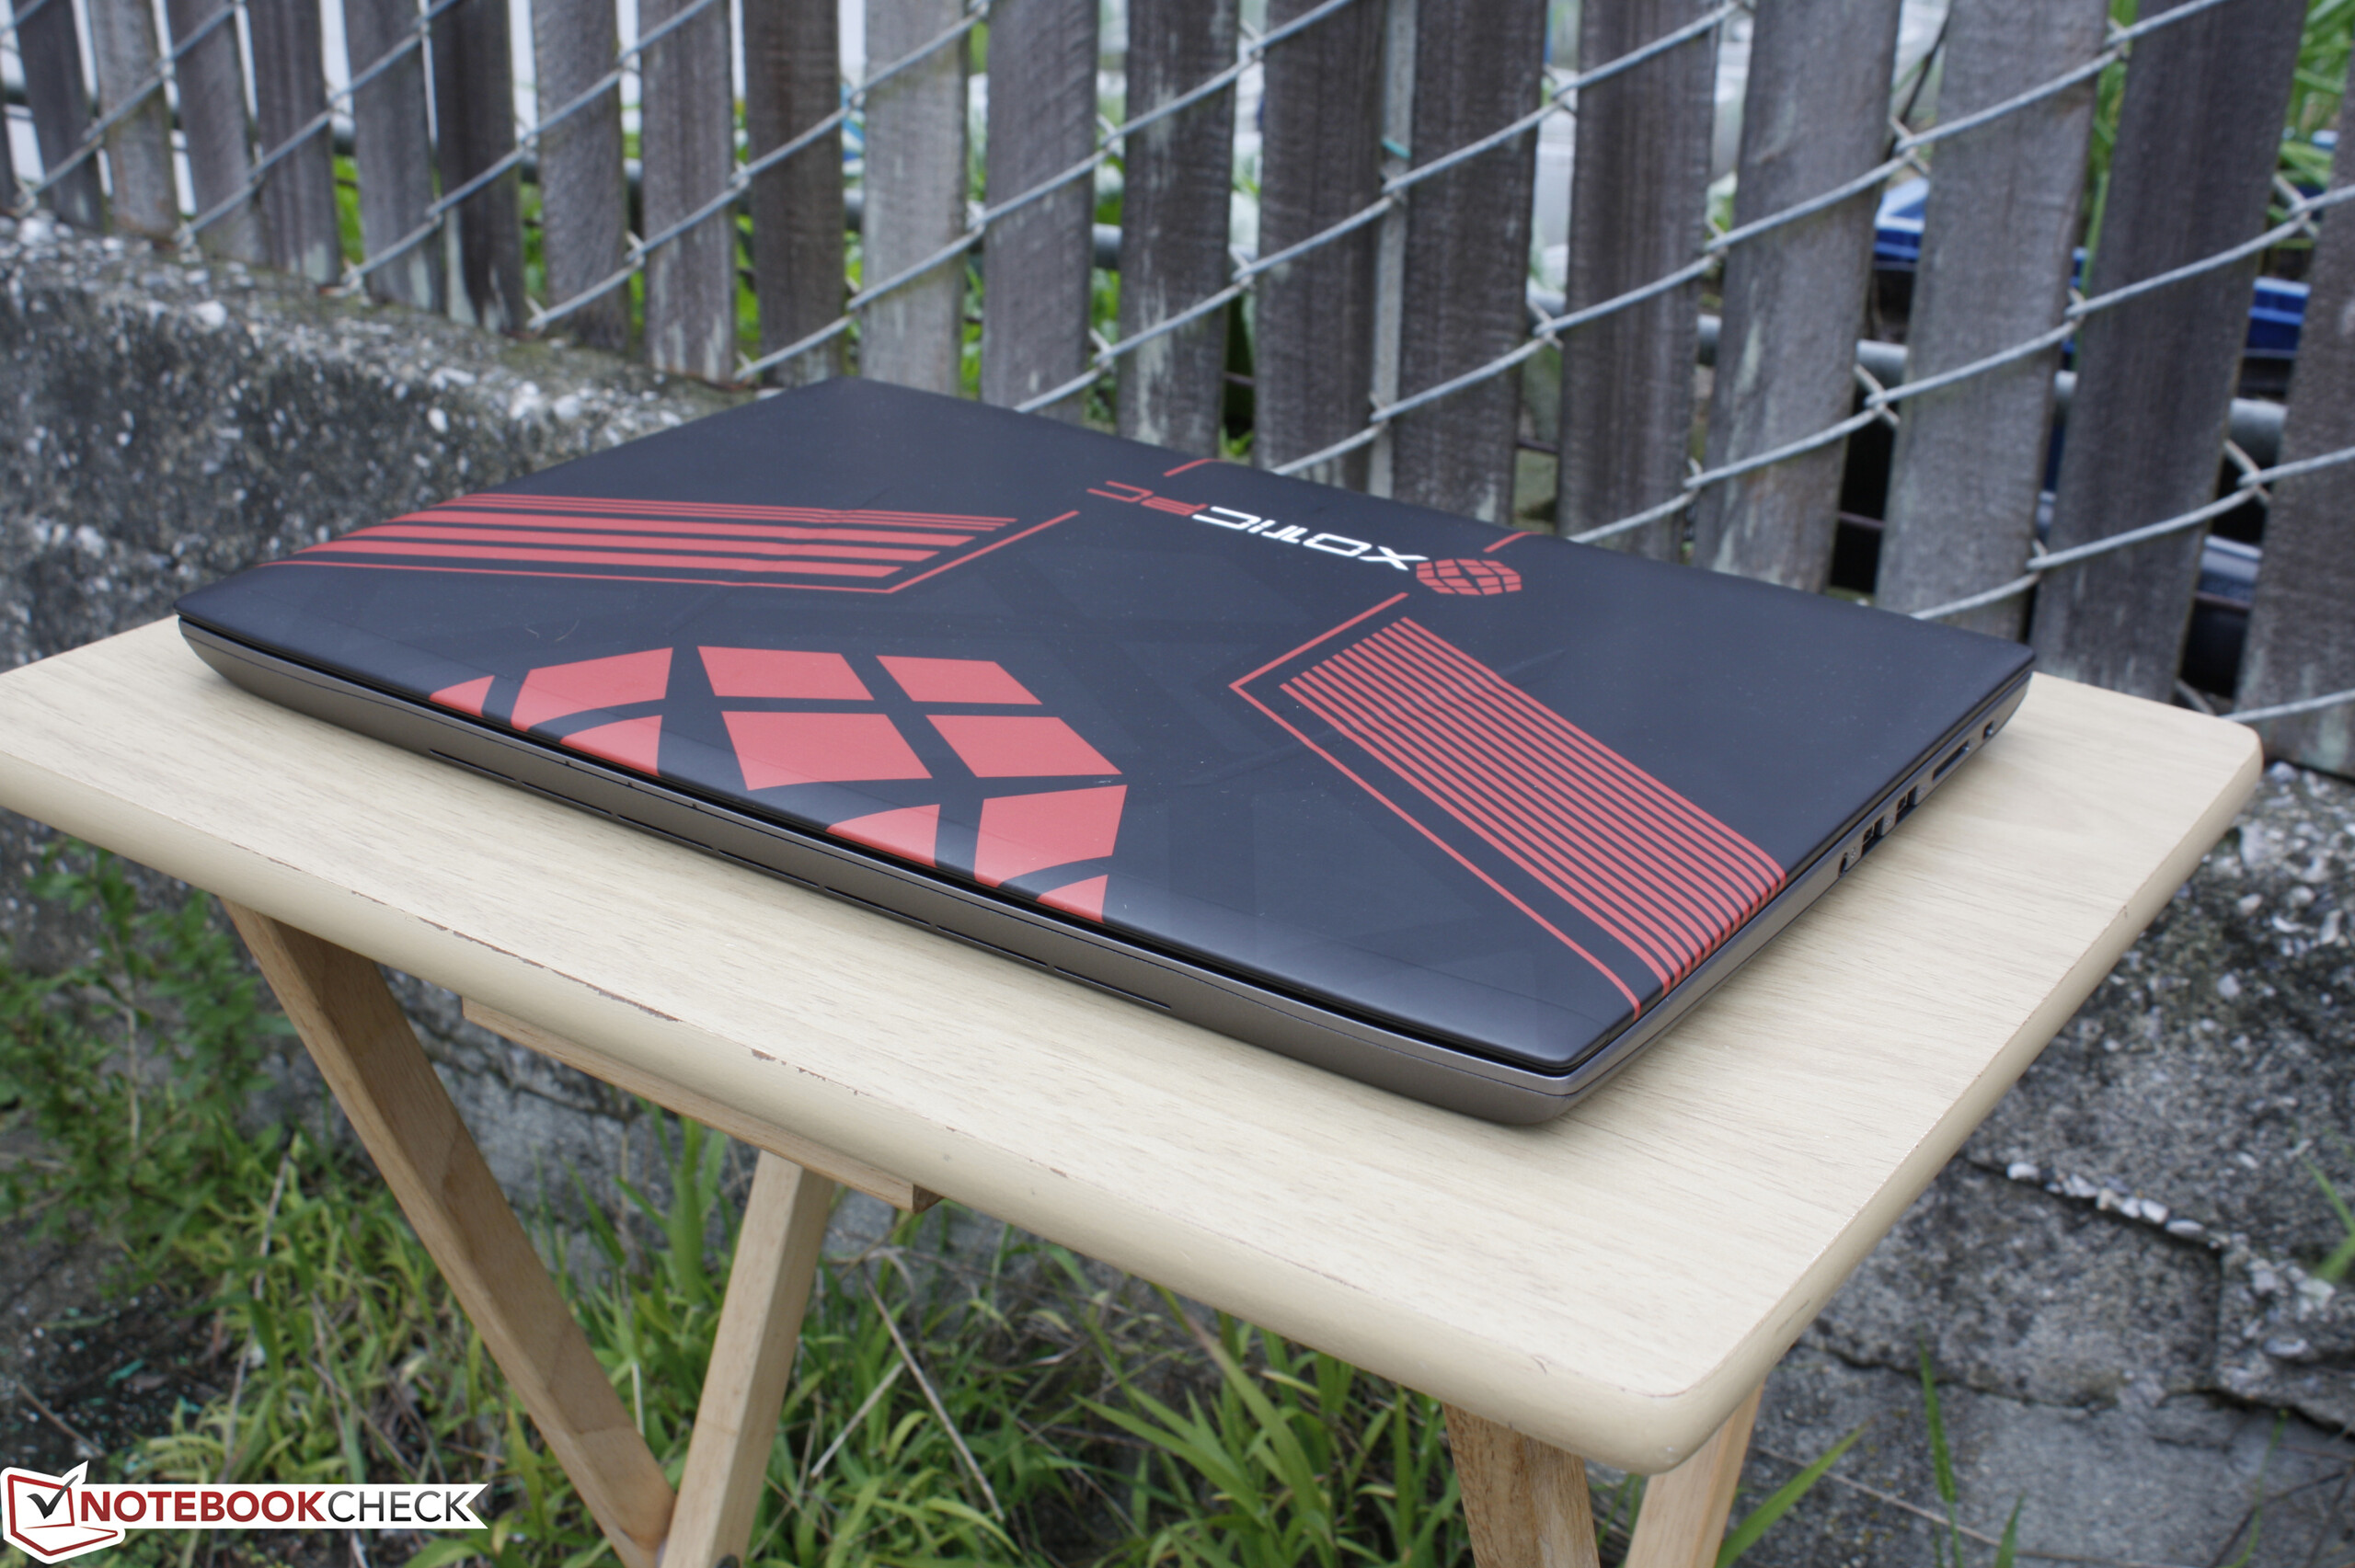
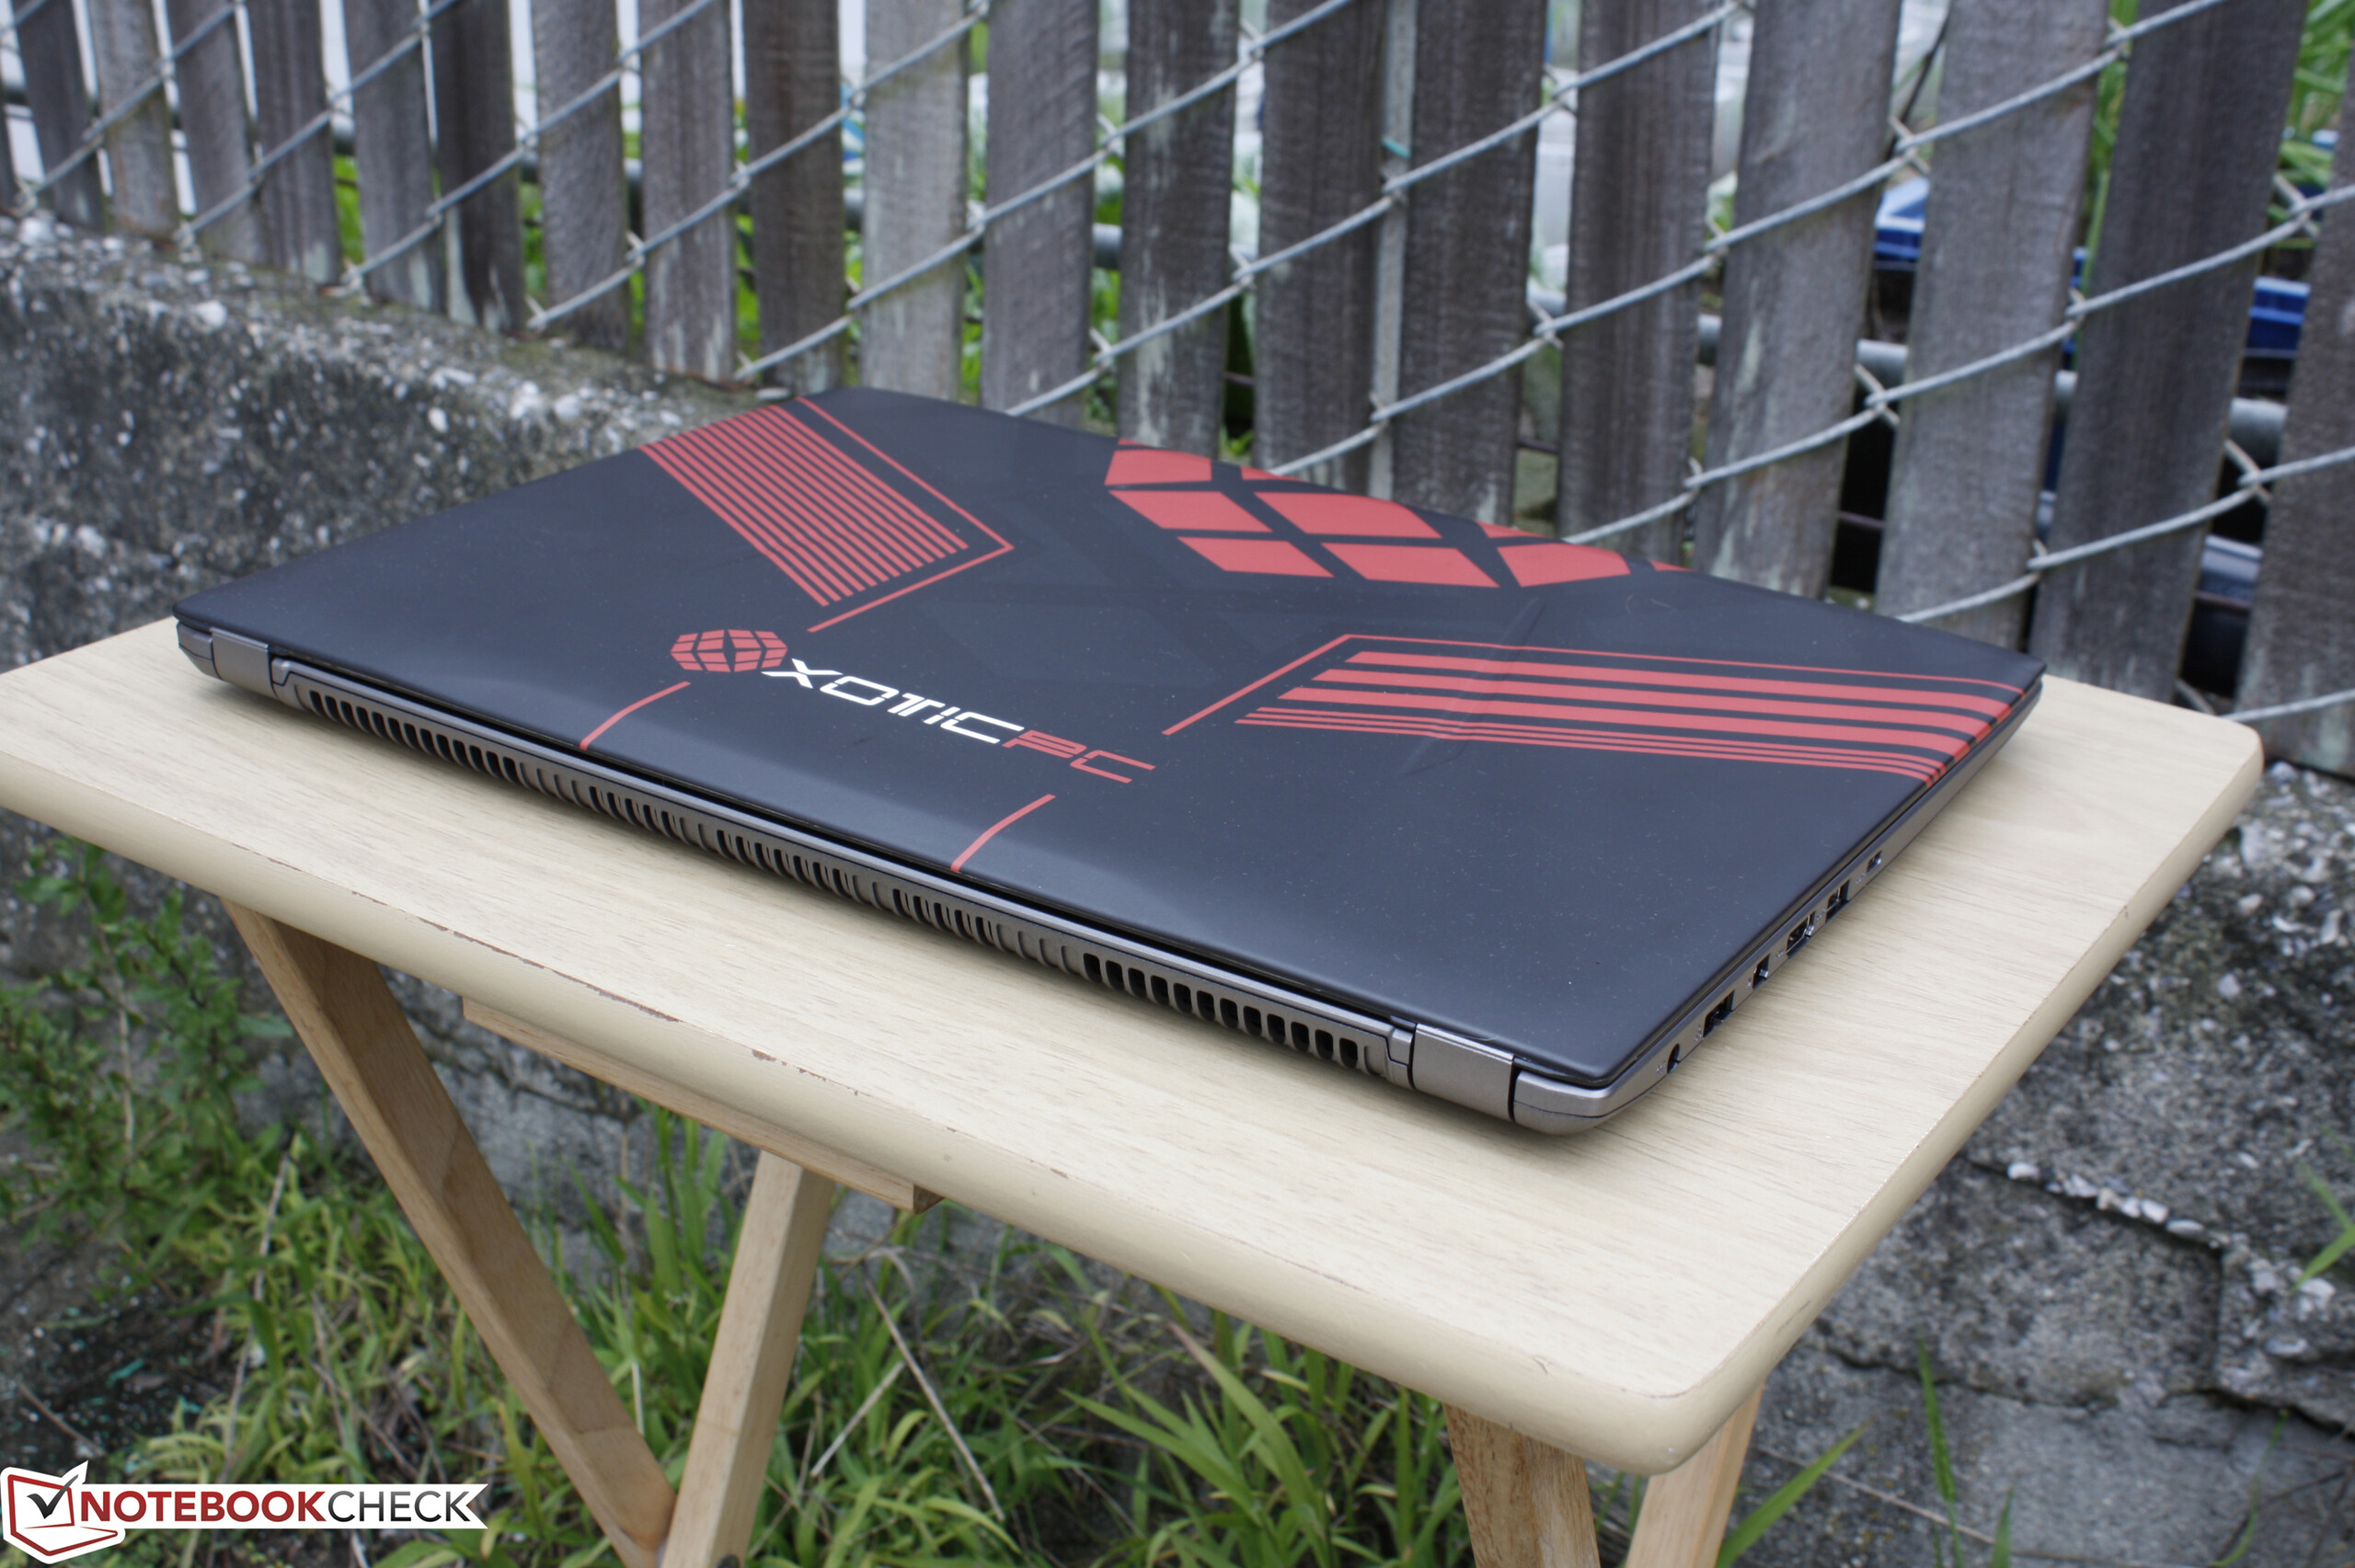
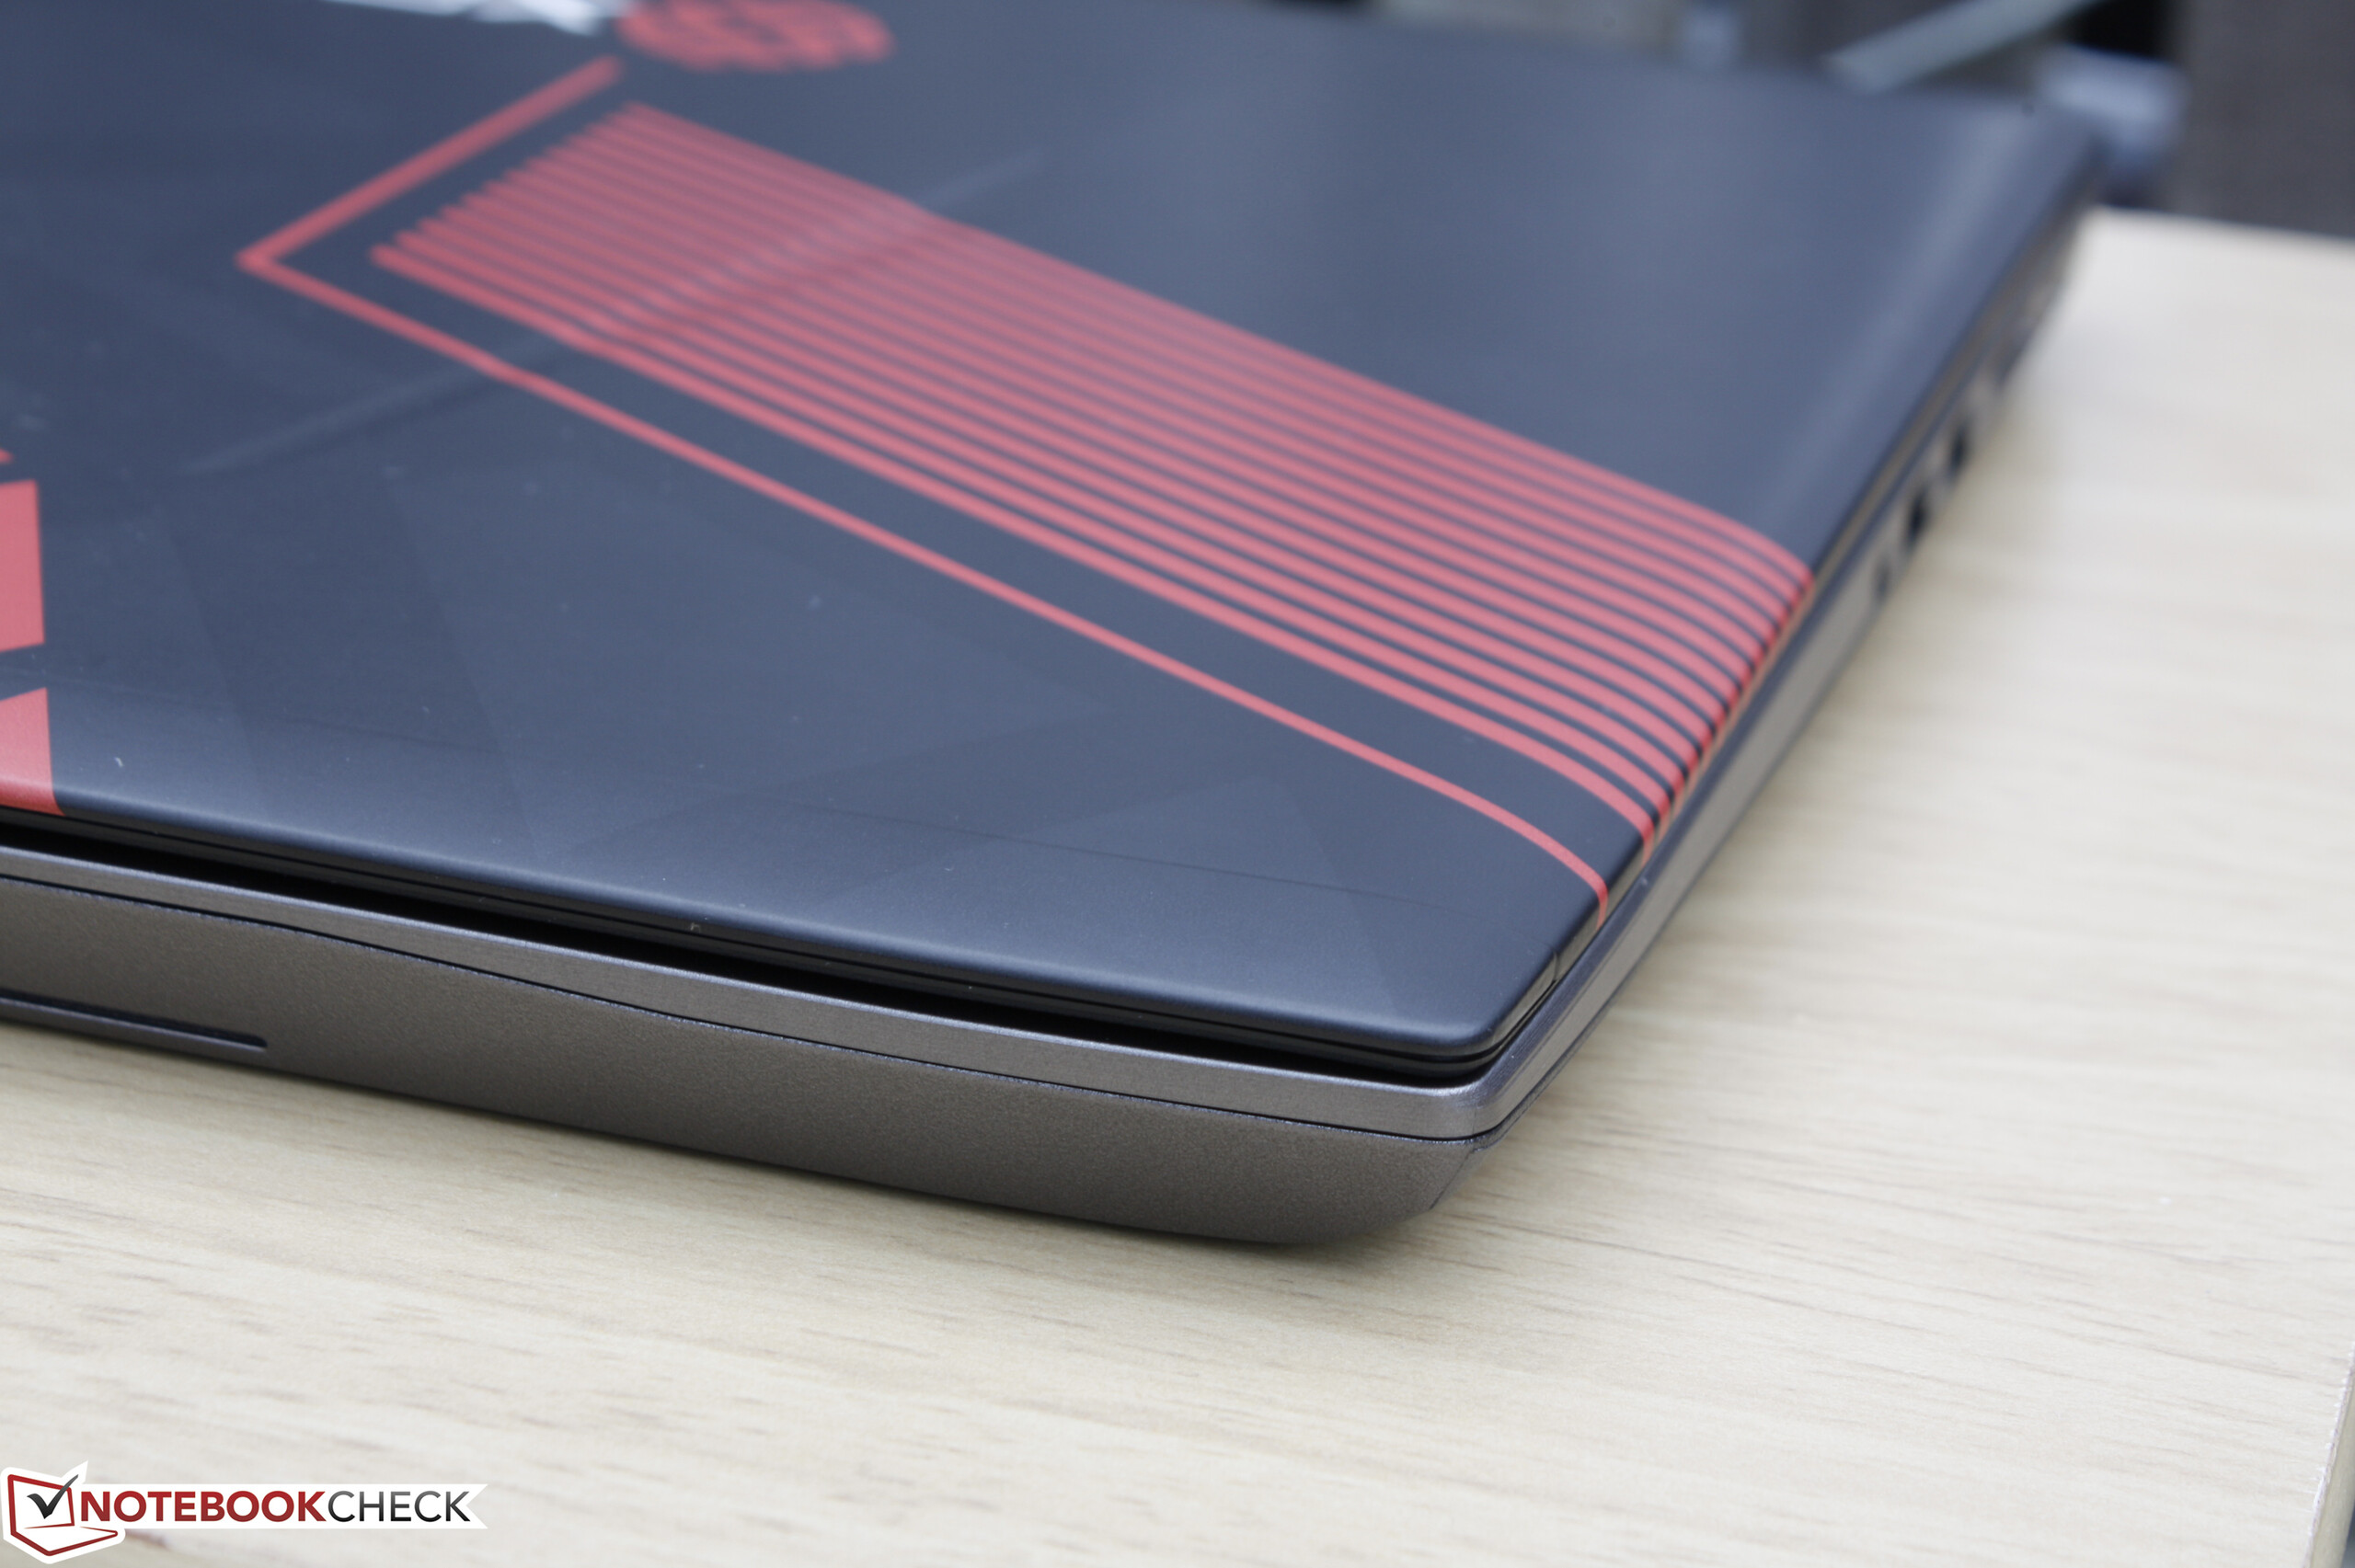
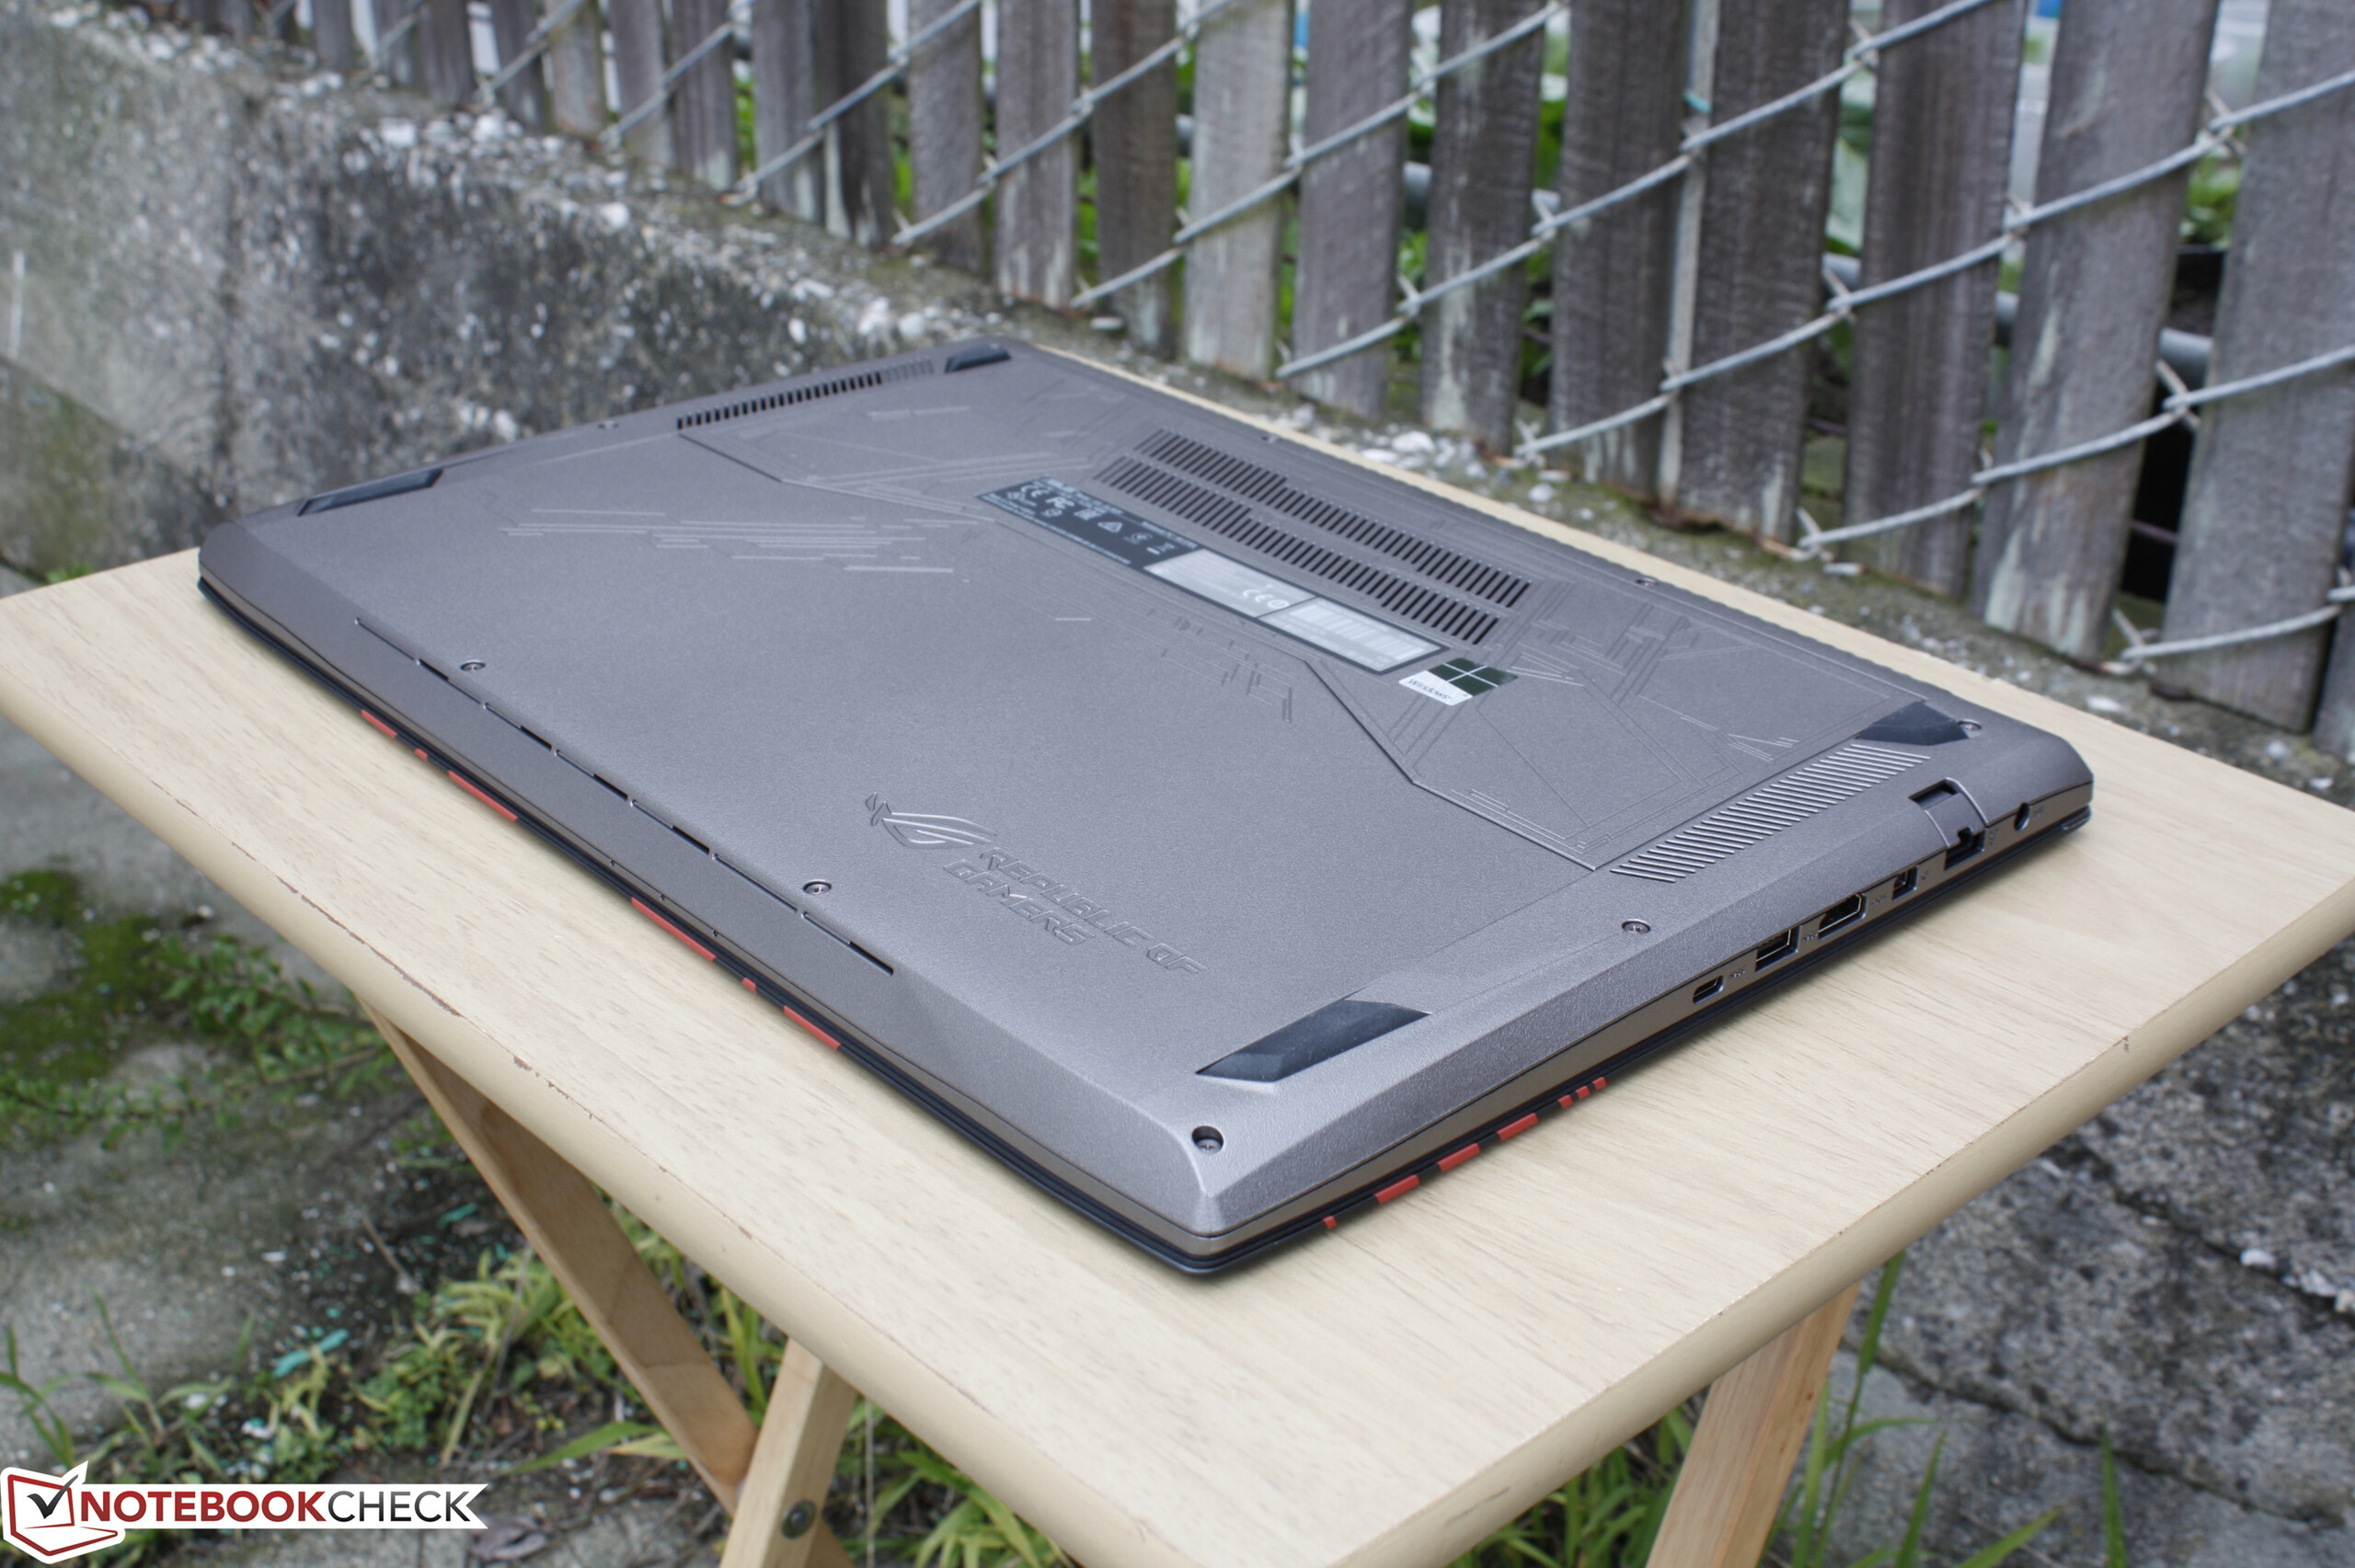
The GL502VM is a full 6 mm thinner than the GL502VS while maintaining the same length and width and even connectivity features. The MSI GS63VR series is even thinner and lighter if users want a more portable solution without sacrificing core specifications. In terms of size and weight, the GL502VM sits comfortably in between the superthin category and the "standard" thick category consisting of notebooks like the Acer Predator 15 and MSI GL62.
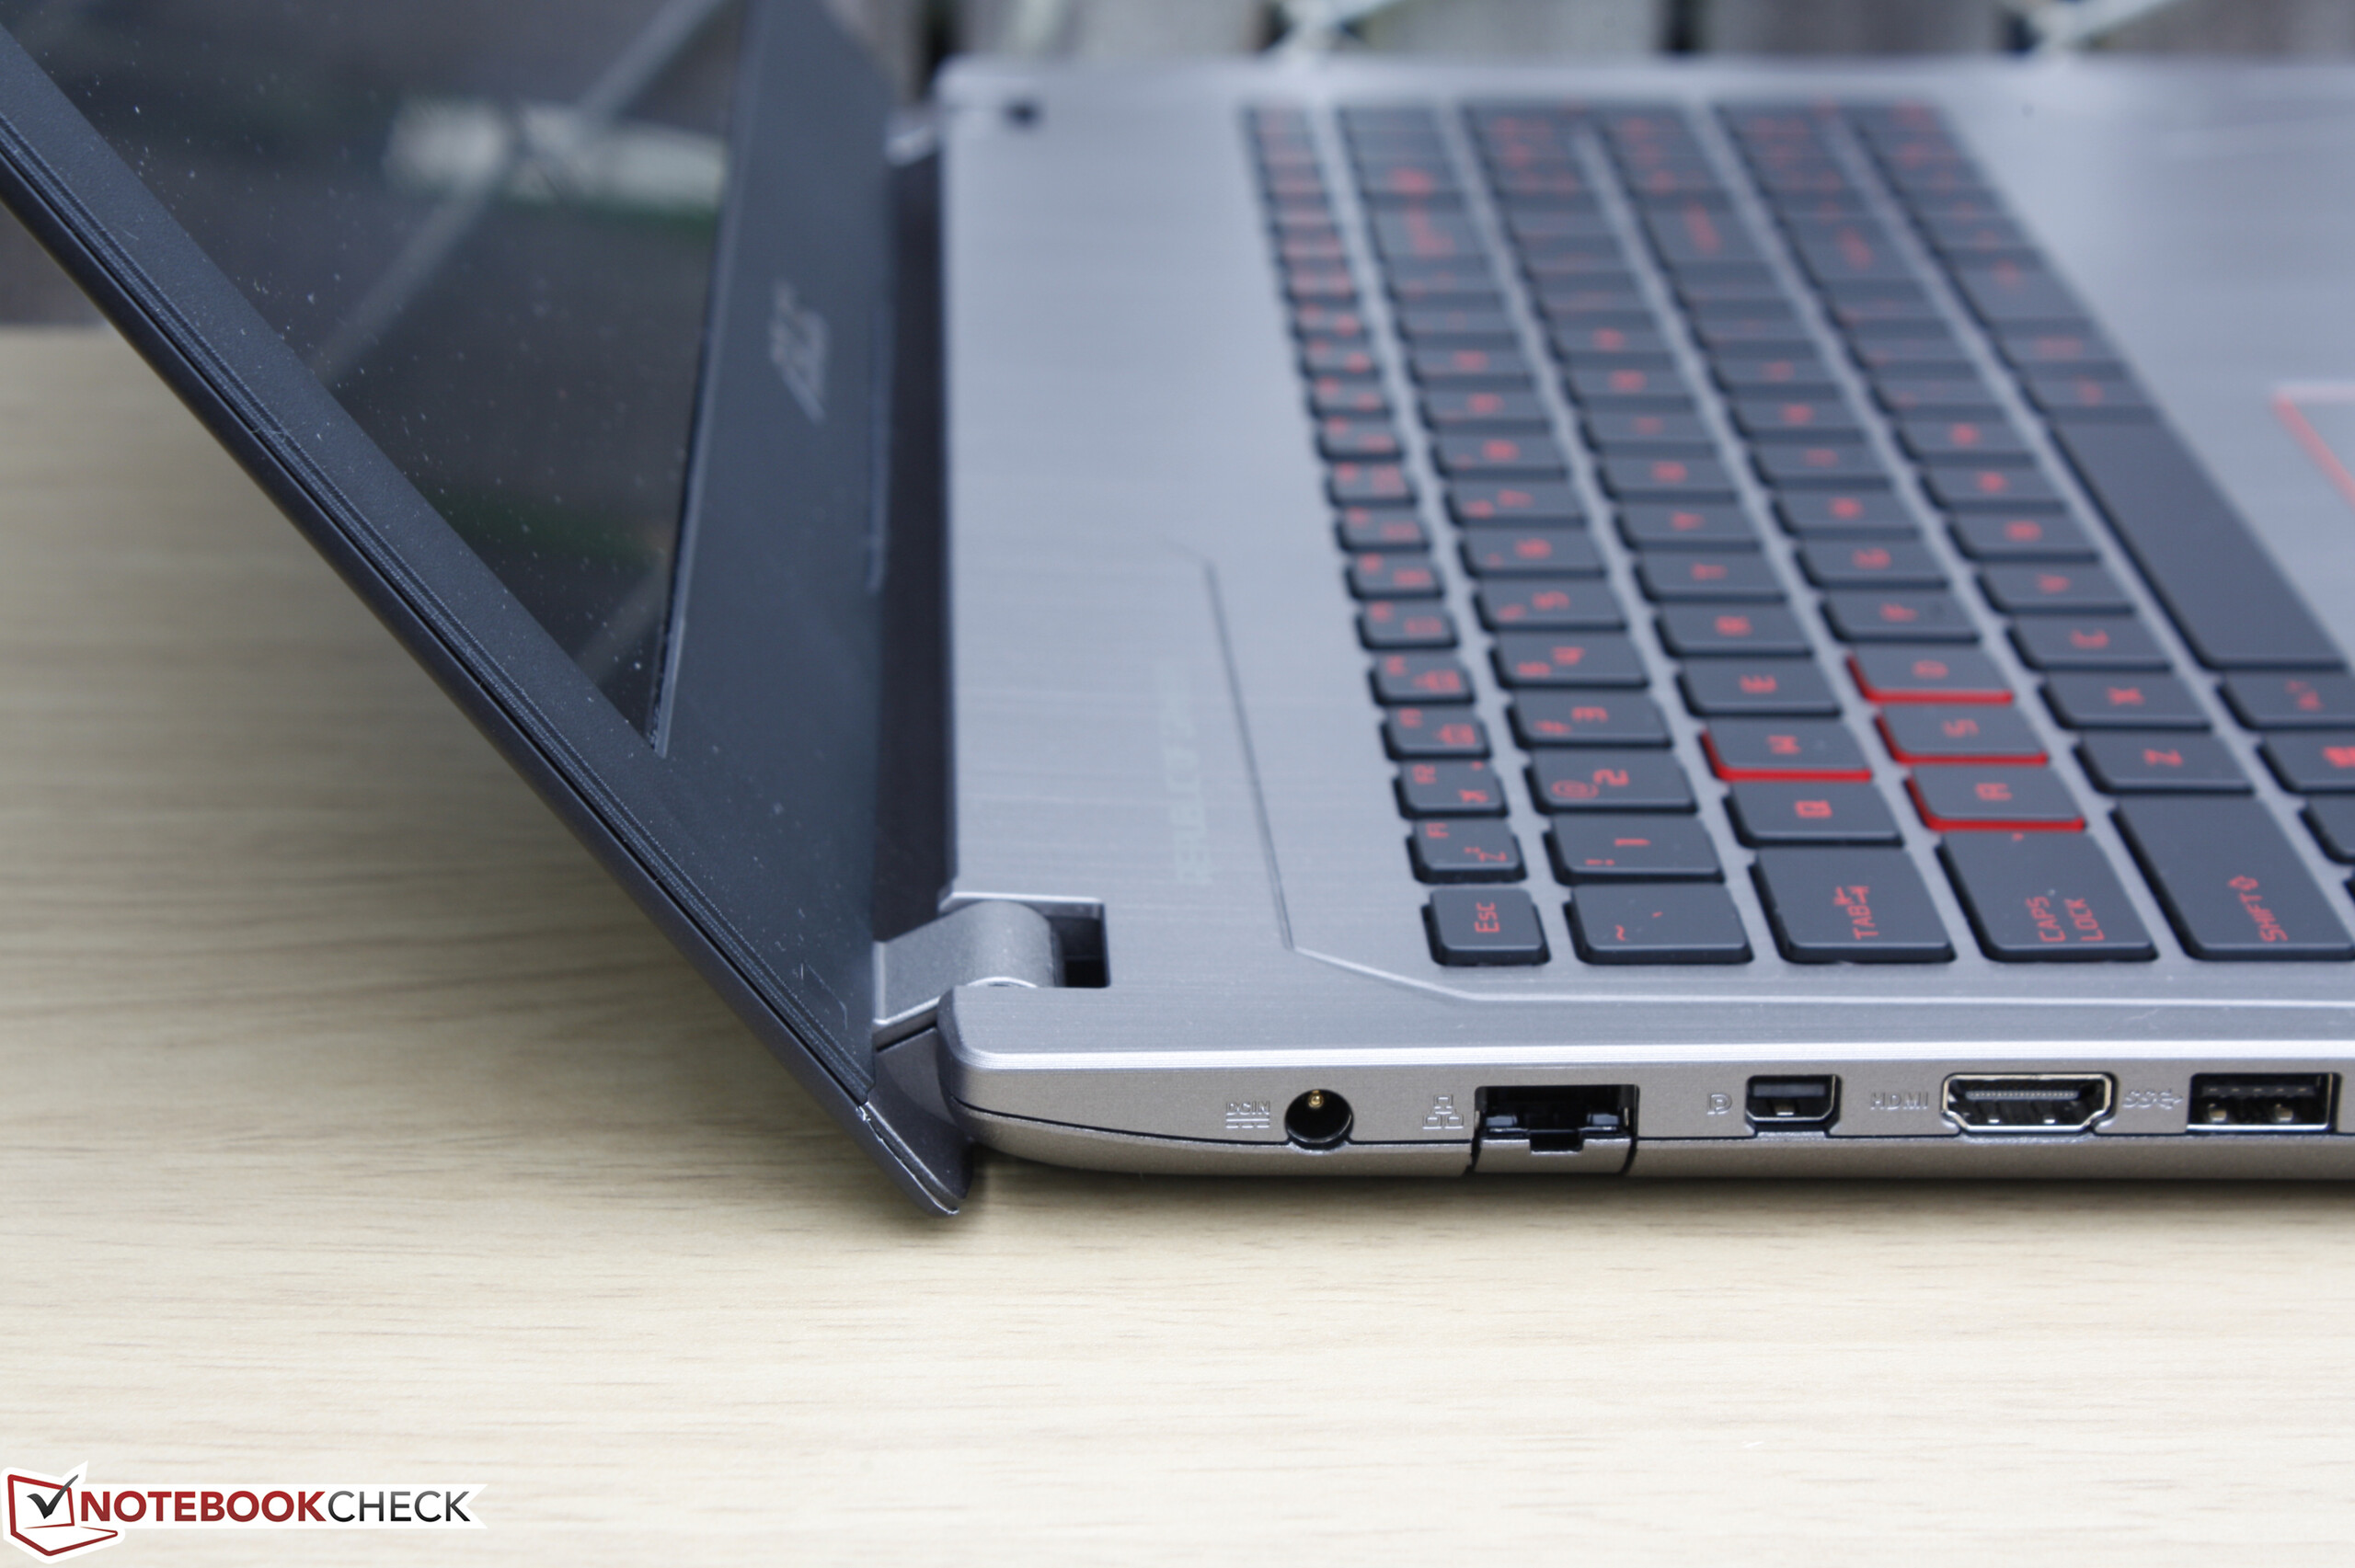
Connectivity
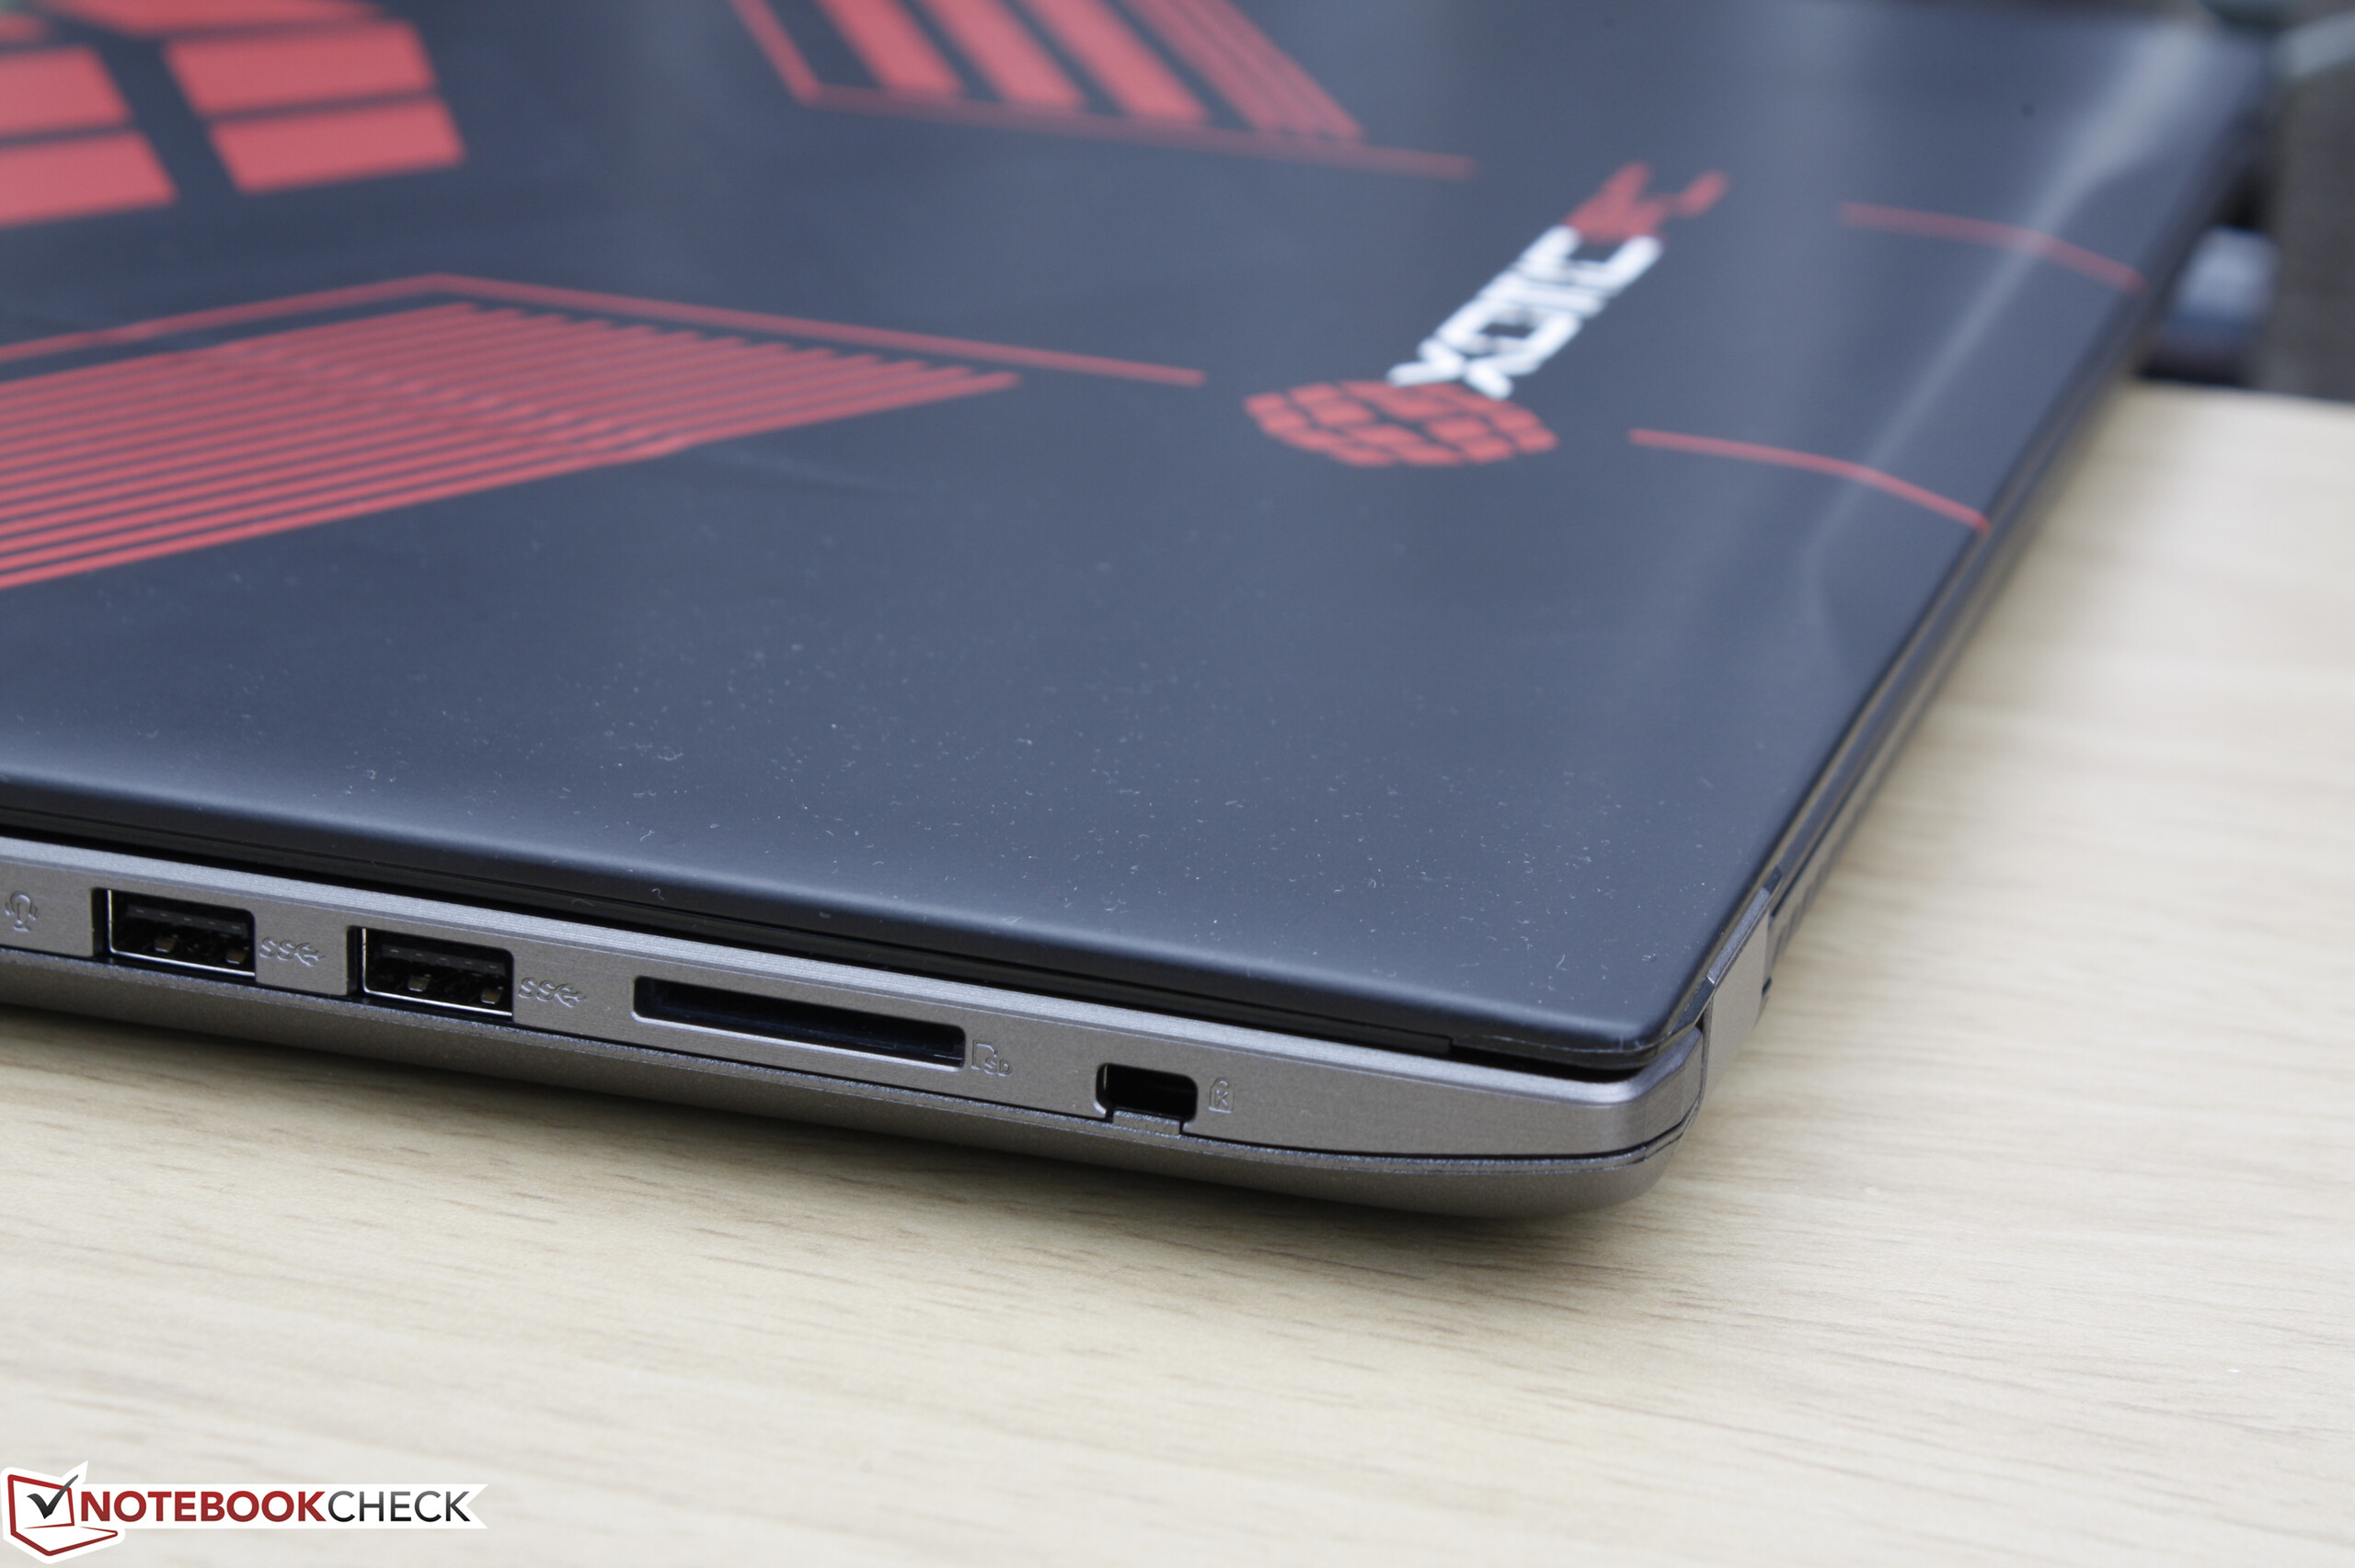
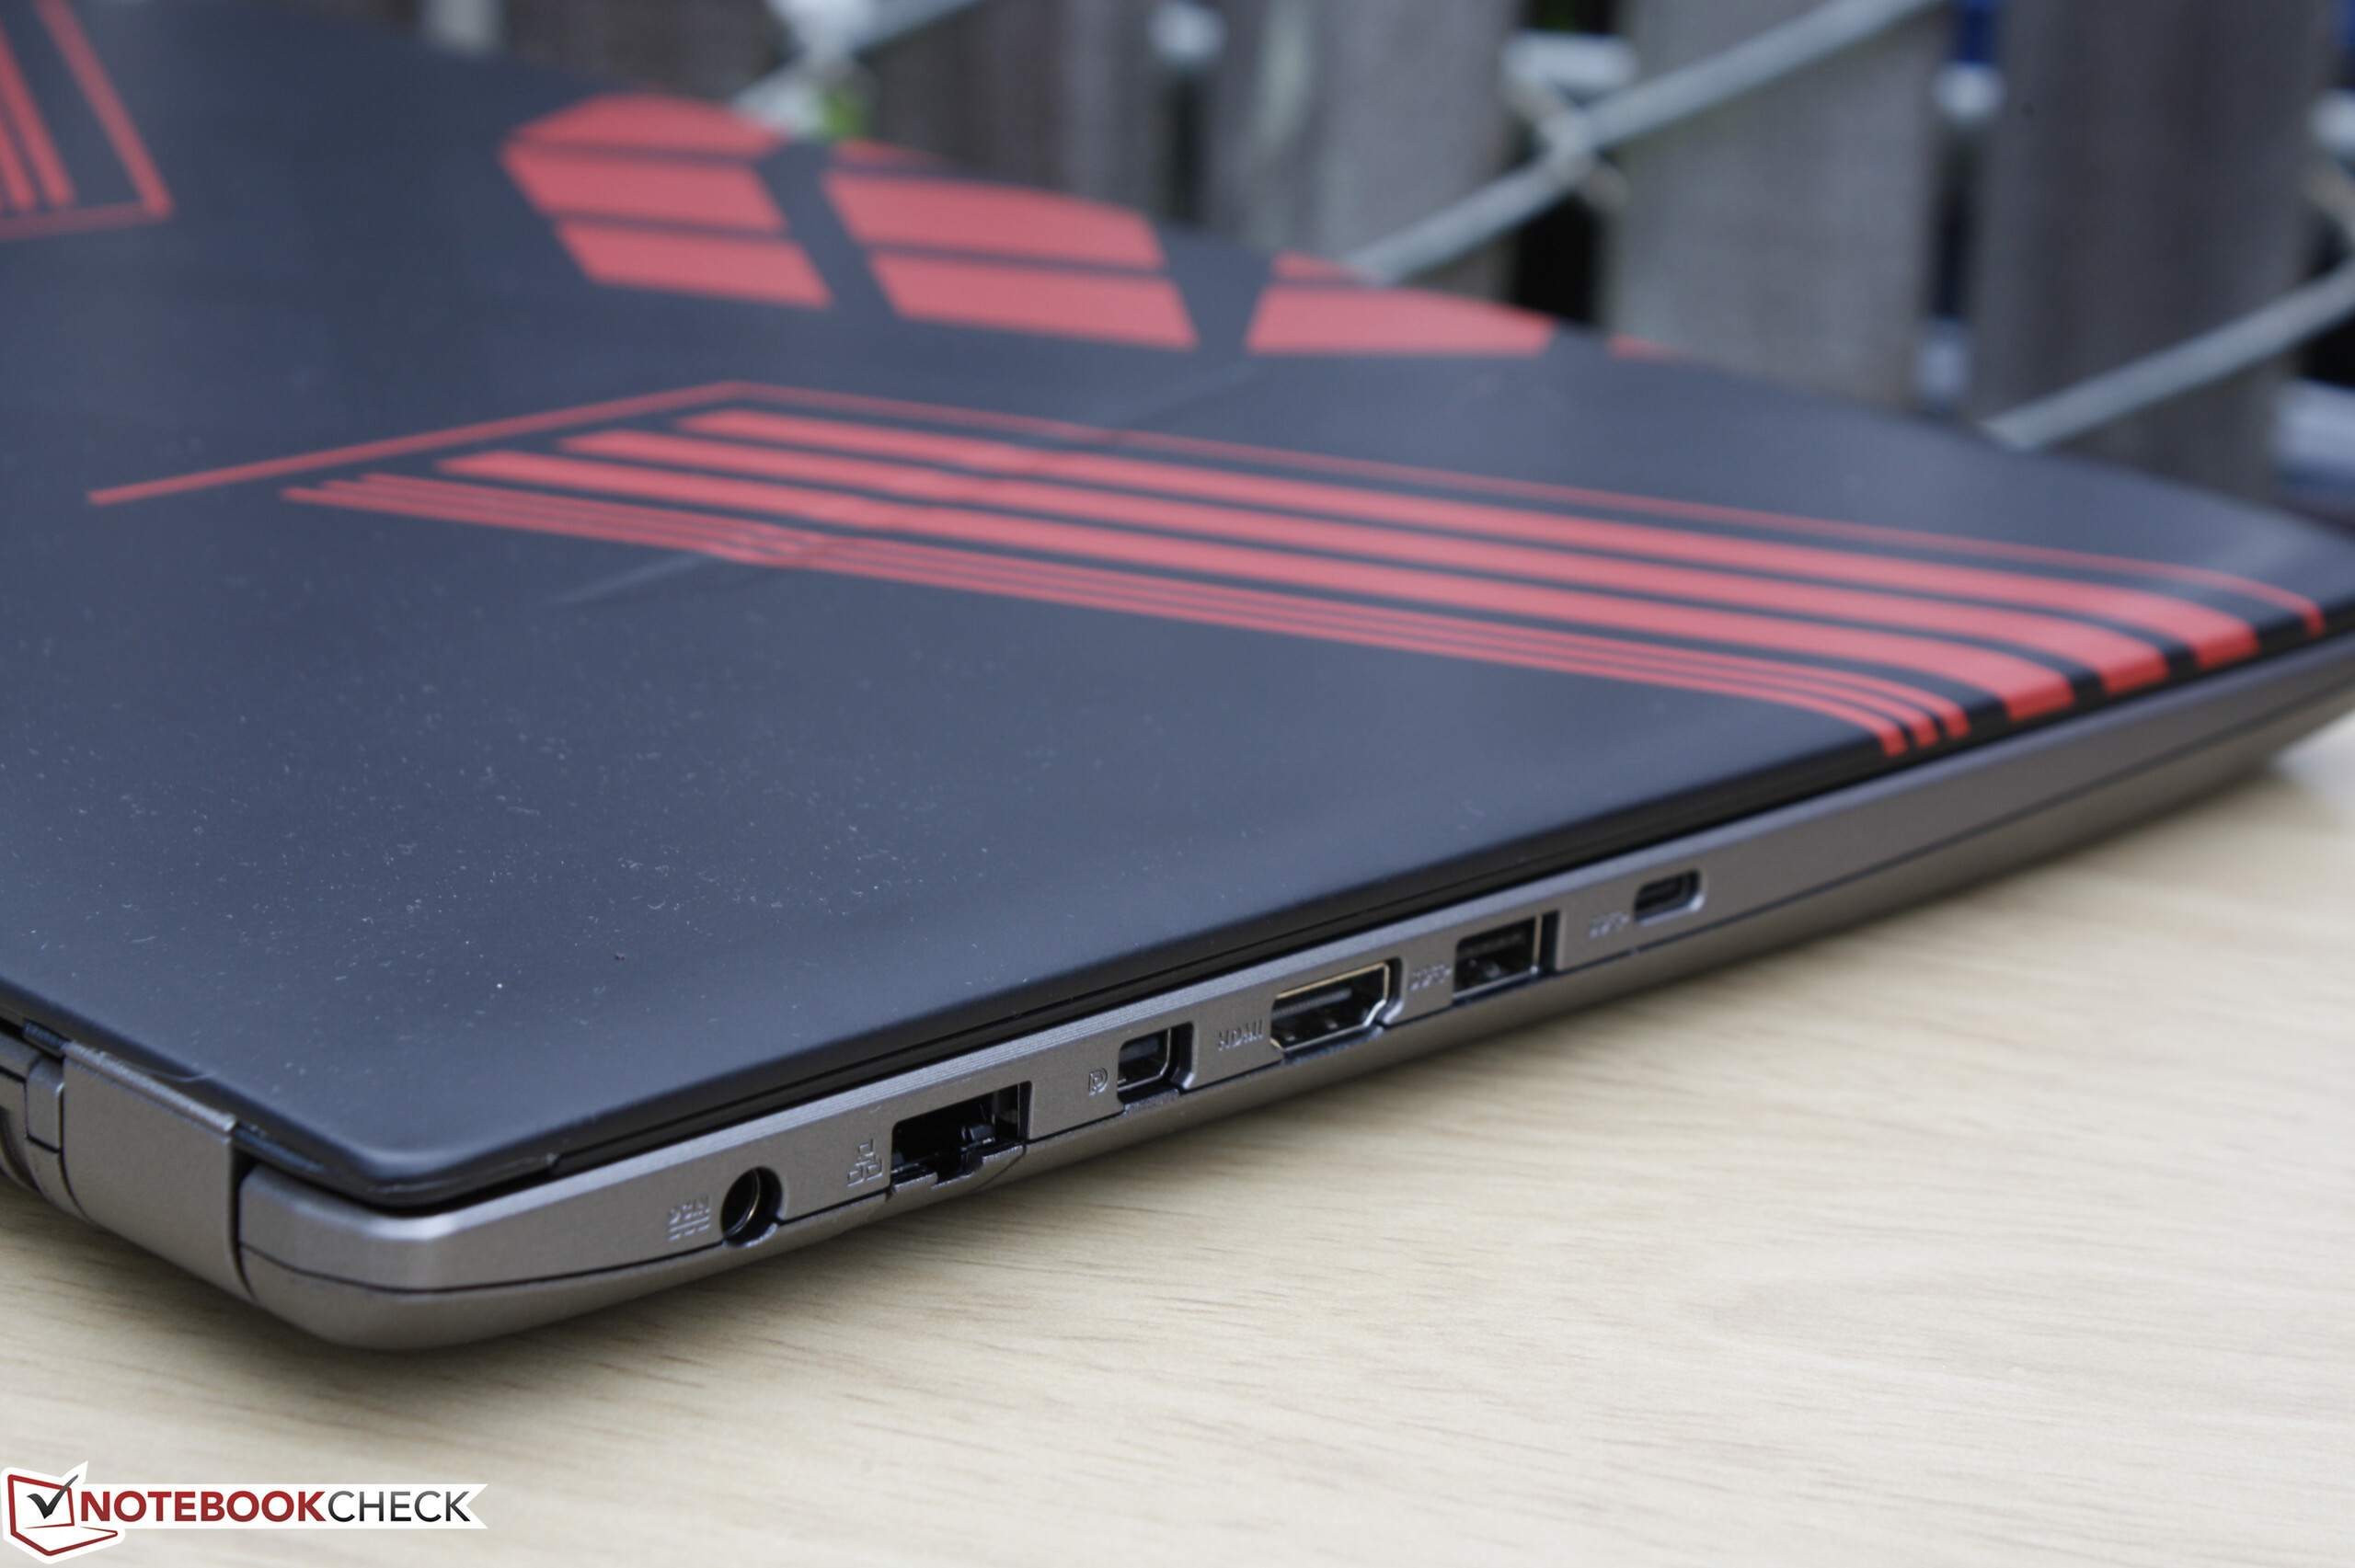
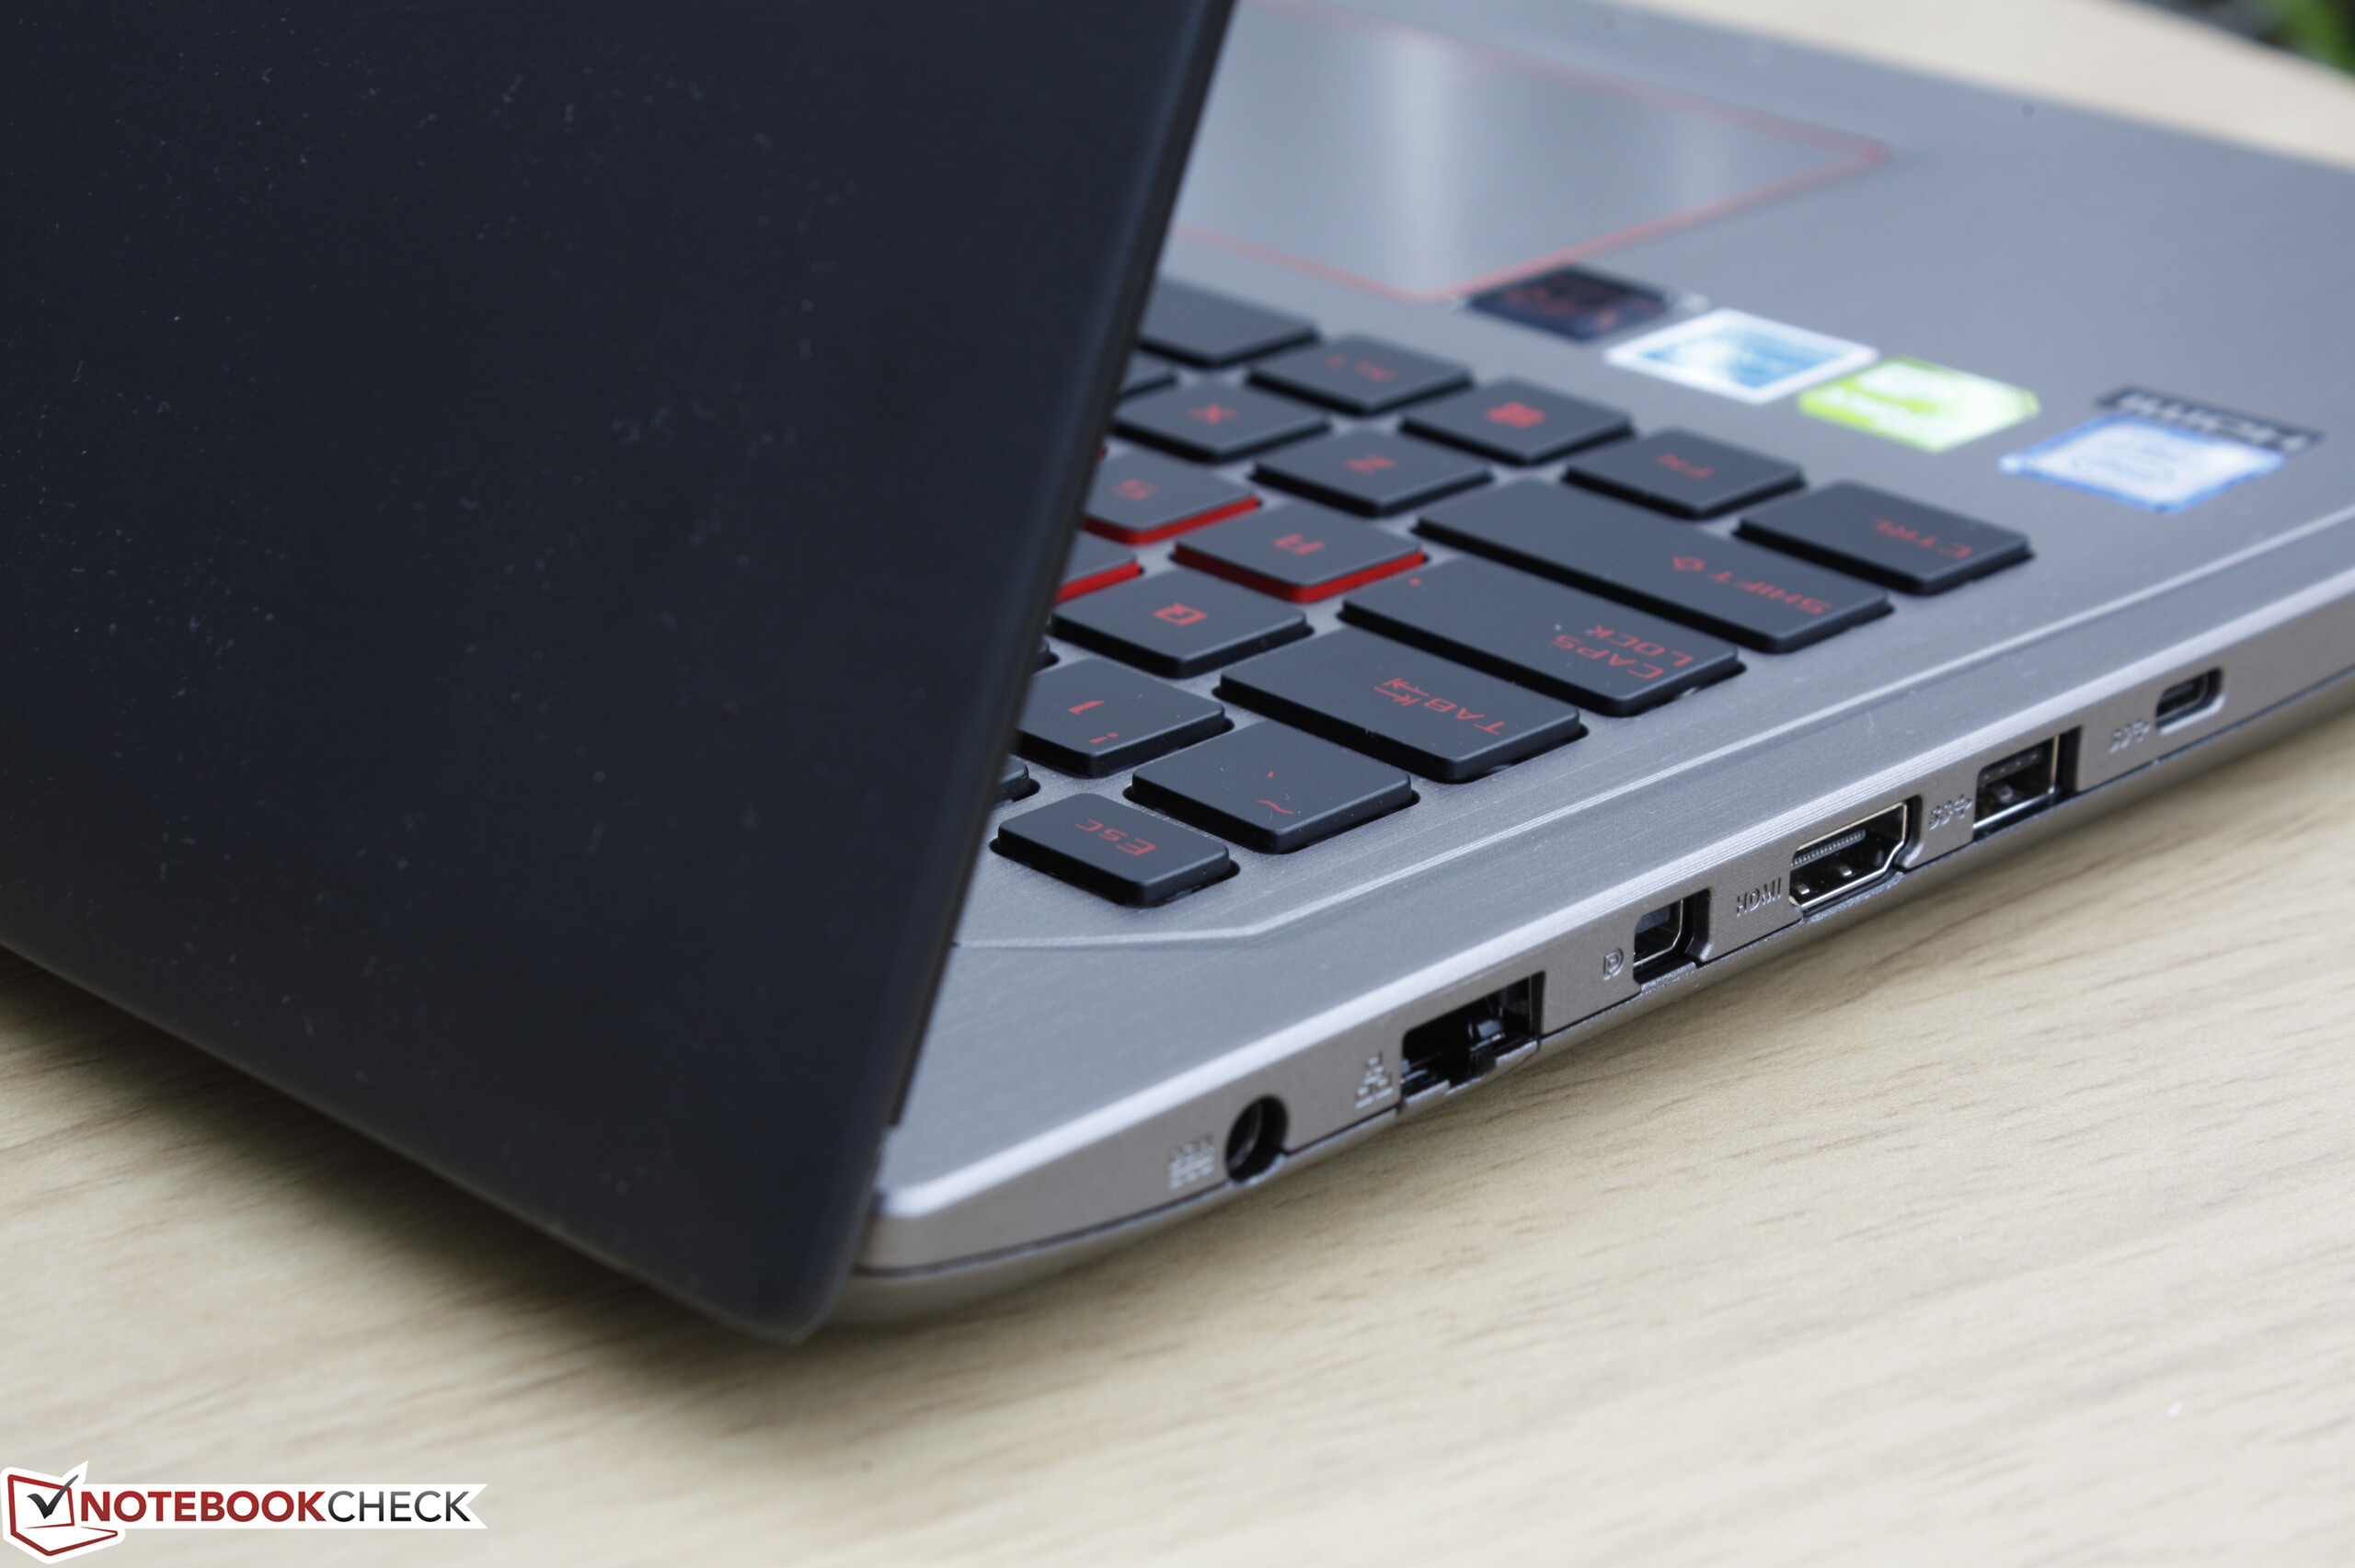
There is a healthy number of available ports from its dual video-out options, 3x USB 3.0, and USB Type-C supporting speeds of up to 10 Gbps. The HDMI port does not appear to be version 2.0, so native 4K output must be done via mini-DisplayPort. Thunderbolt 3 is not supported on the GL502 series whereas ultrathin gaming notebooks from competing manufacturers like the GS63VR or Razer Blade Pro have Thunderbolt 3 as standard.


SD Card Reader
The integrated SD reader provides an average transfer rate of about 80 MB/s with our Toshiba Exceria Pro UHS-II test card. Transferring 1 GB worth of images from the card to desktop will take approximately 13 seconds. The card reader itself is not spring loaded and the inserted card will still protrude by well over half its length.
| SD Card Reader | |
| average JPG Copy Test (av. of 3 runs) | |
| Eurocom Tornado F5 | |
| Asus Strix GL502VM-DS74 | |
| MSI GL62-6QFi781H11 | |
| maximum AS SSD Seq Read Test (1GB) | |
| Eurocom Tornado F5 | |
| Asus Strix GL502VM-DS74 | |
| MSI GL62-6QFi781H11 | |
| Networking | |
| iperf3 transmit AX12 | |
| MSI GT73VR 7RF-296 | |
| Dell XPS 13 9360 FHD i5 | |
| Asus Strix GL502VM-DS74 | |
| iperf3 receive AX12 | |
| MSI GT73VR 7RF-296 | |
| Dell XPS 13 9360 FHD i5 | |
| Asus Strix GL502VM-DS74 | |
Accessories
Included extras outside of the power adapter are a cable tie and warranty card. A carrying sleeve would have been a good addition similar to what Asus offers for free with new Zenbook purchases.
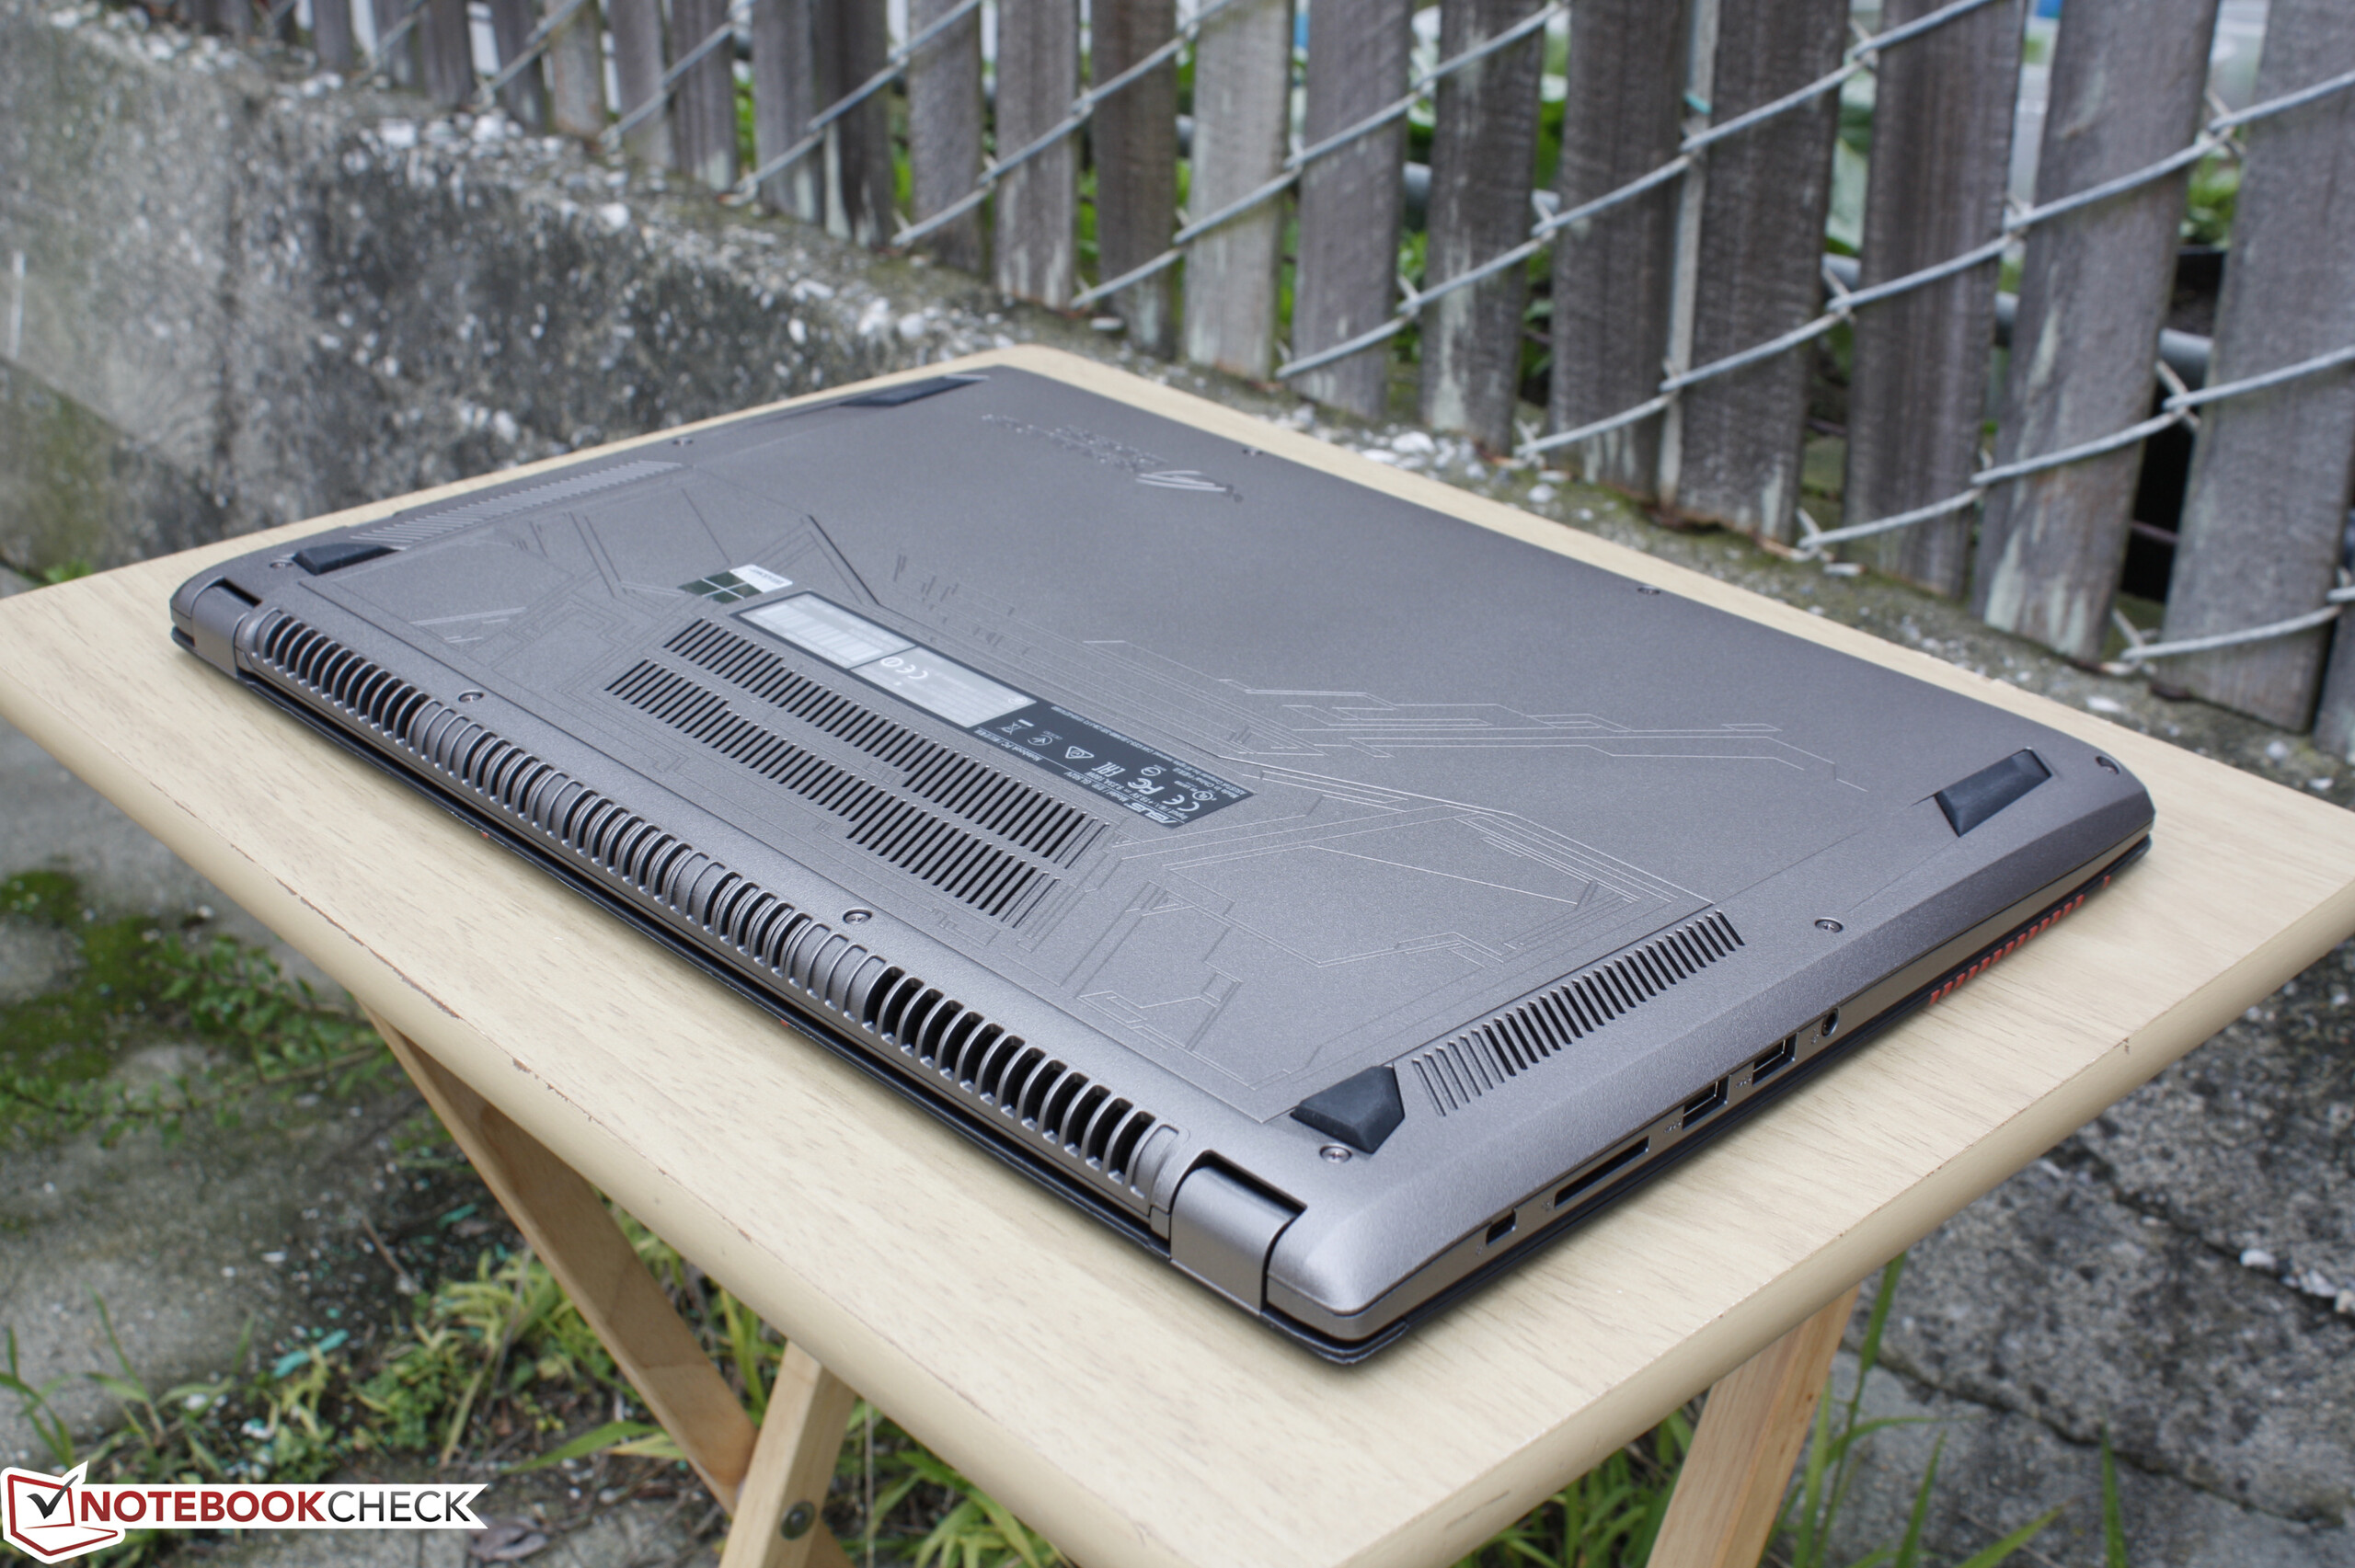
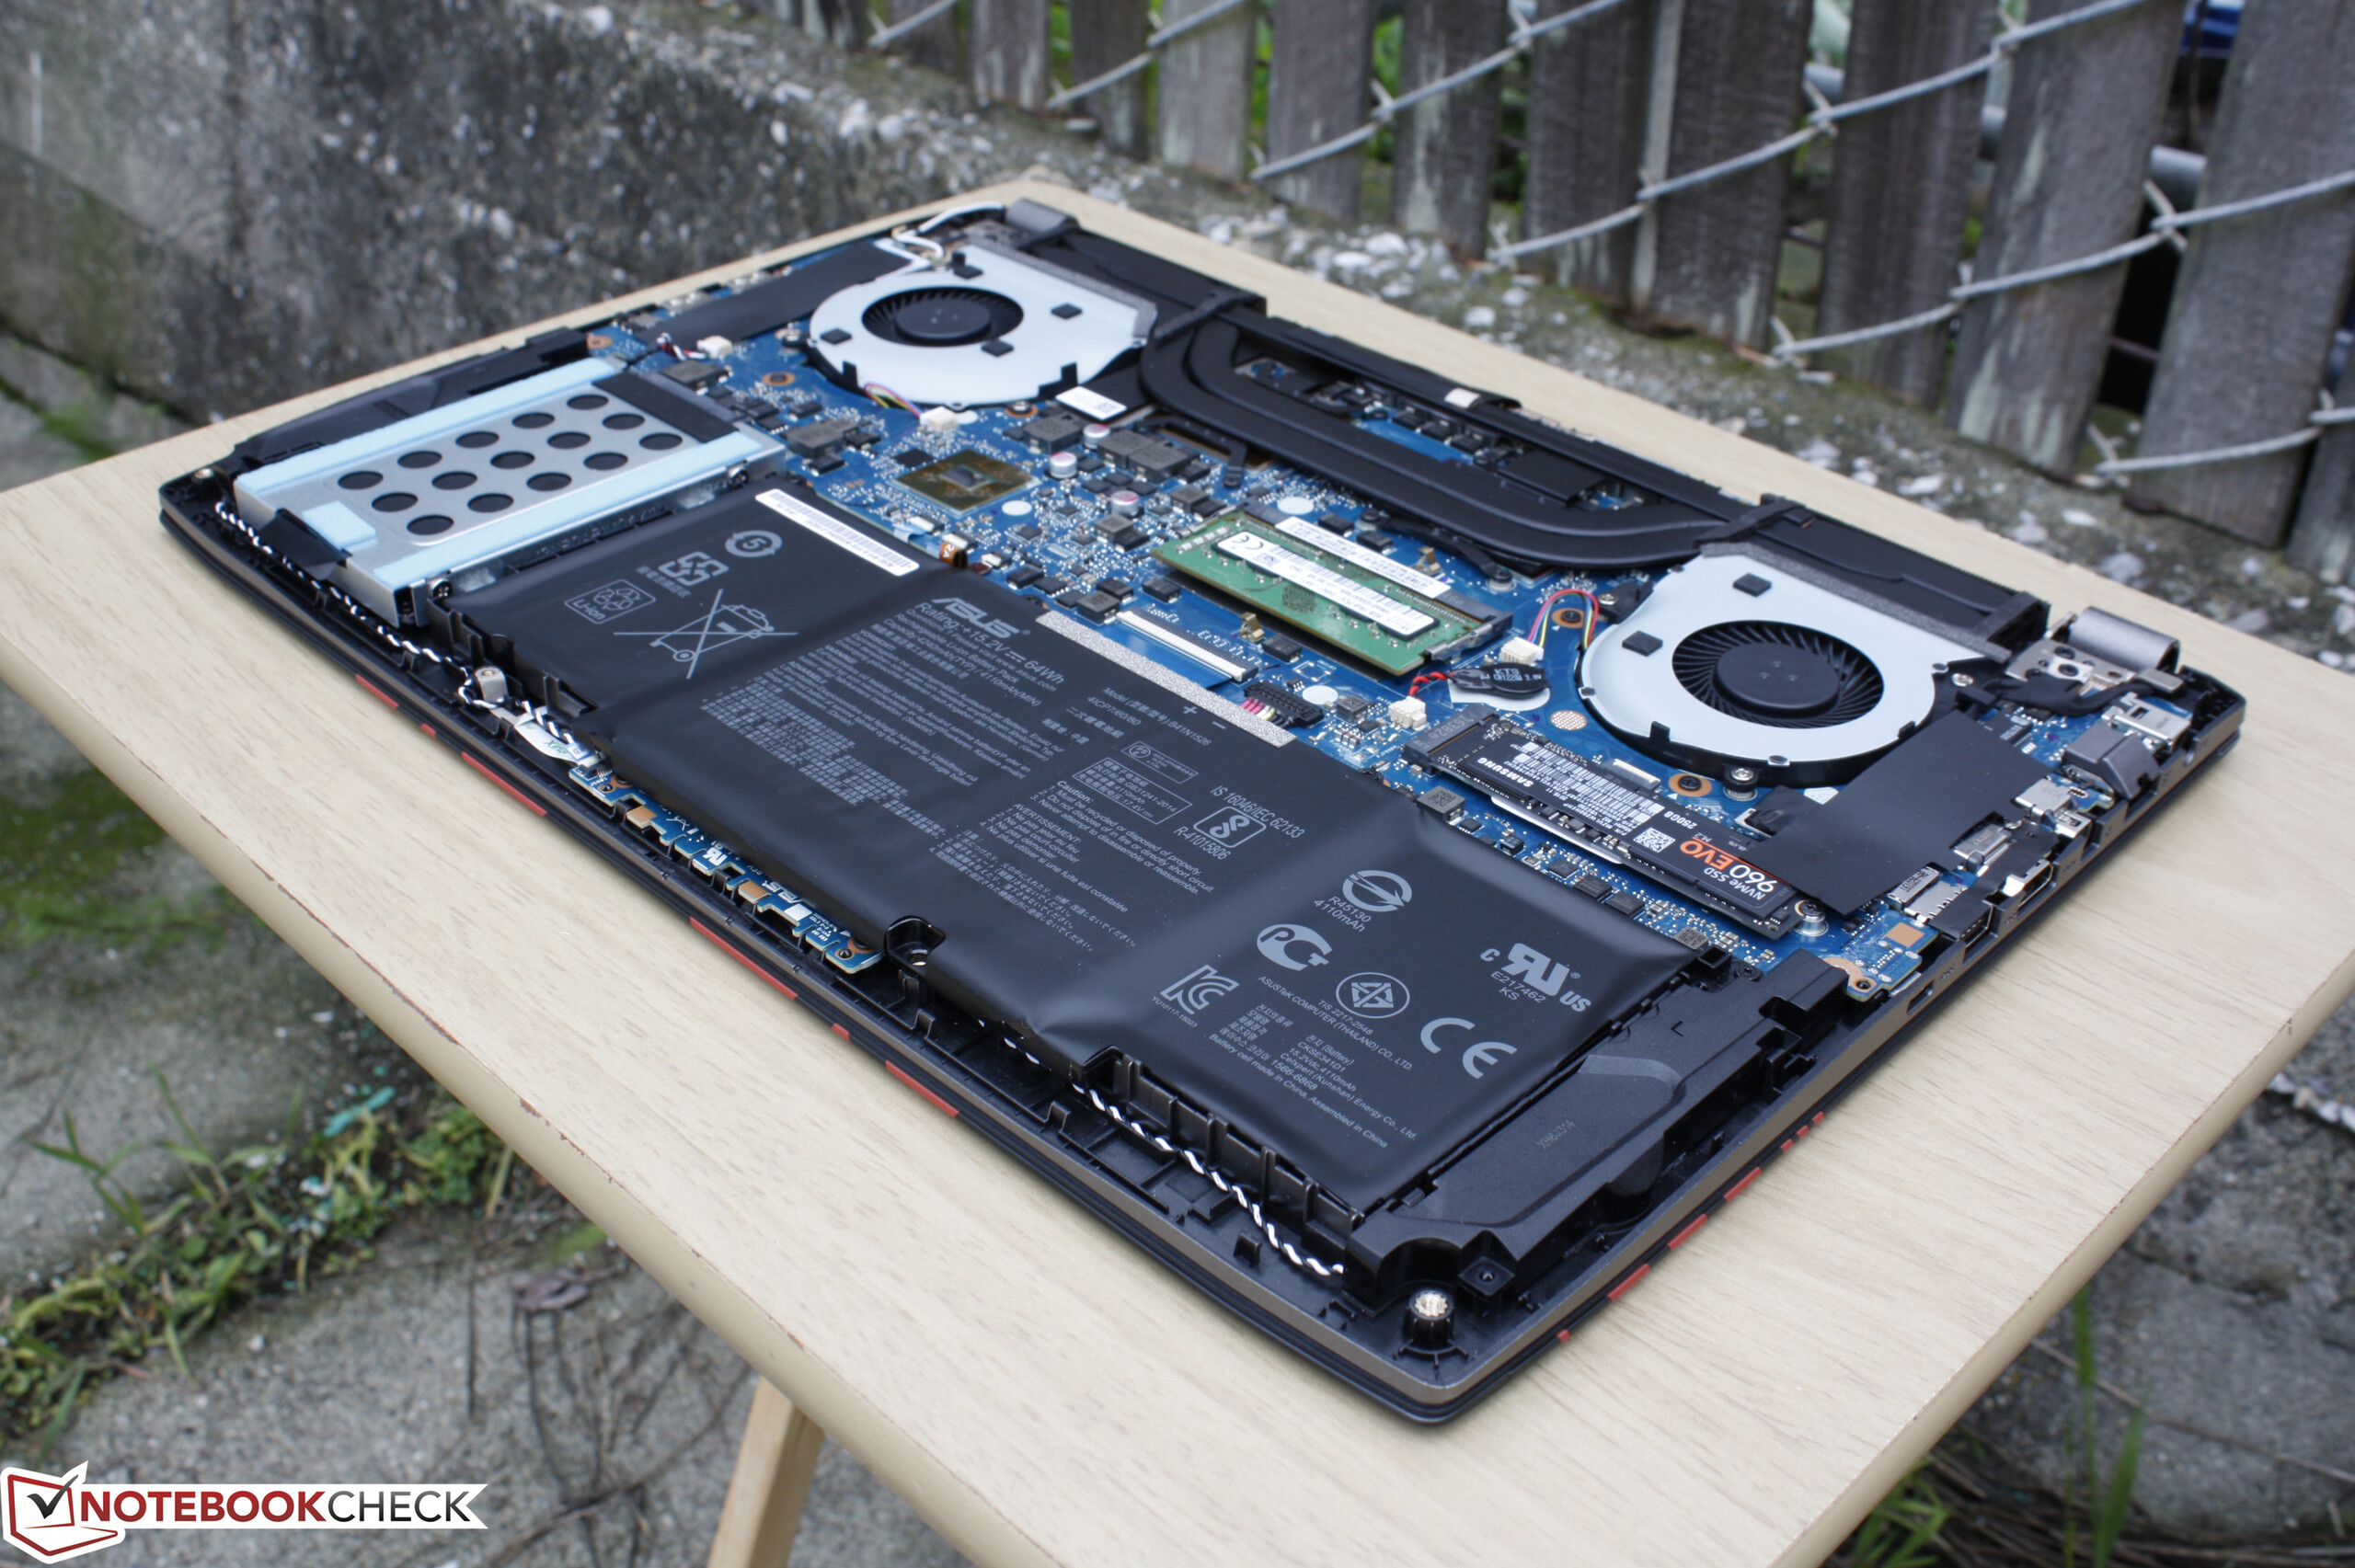
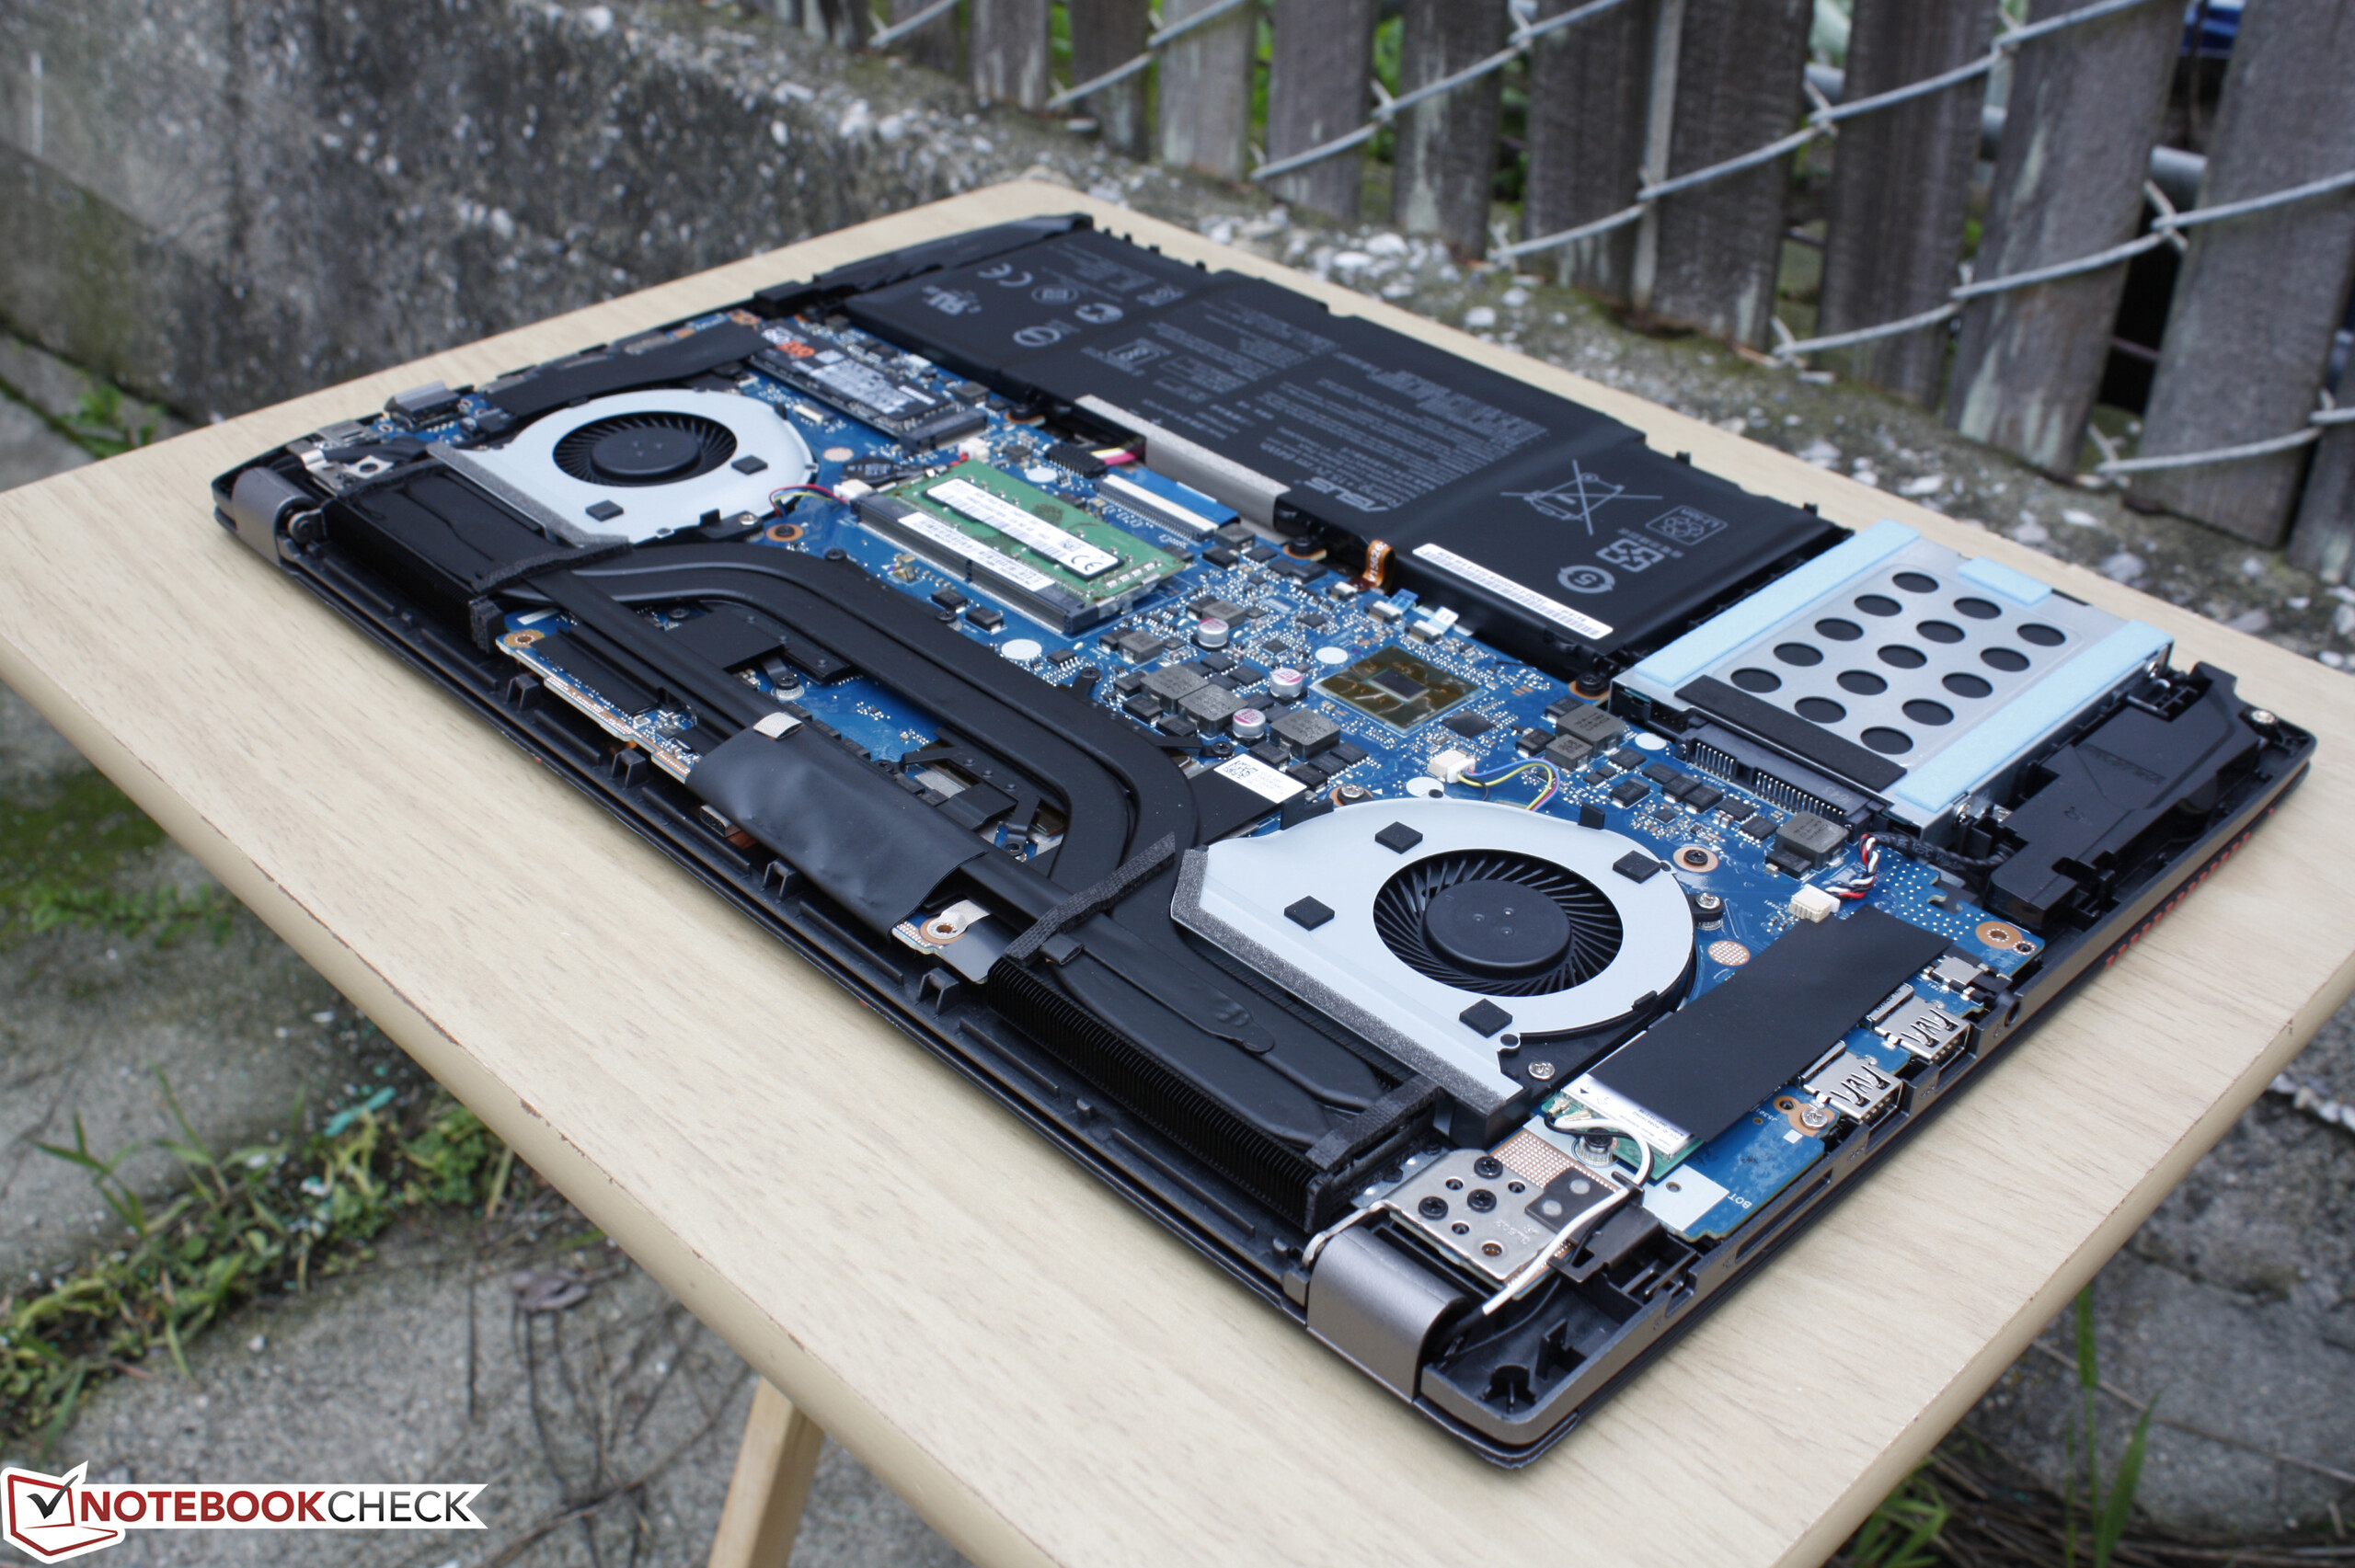
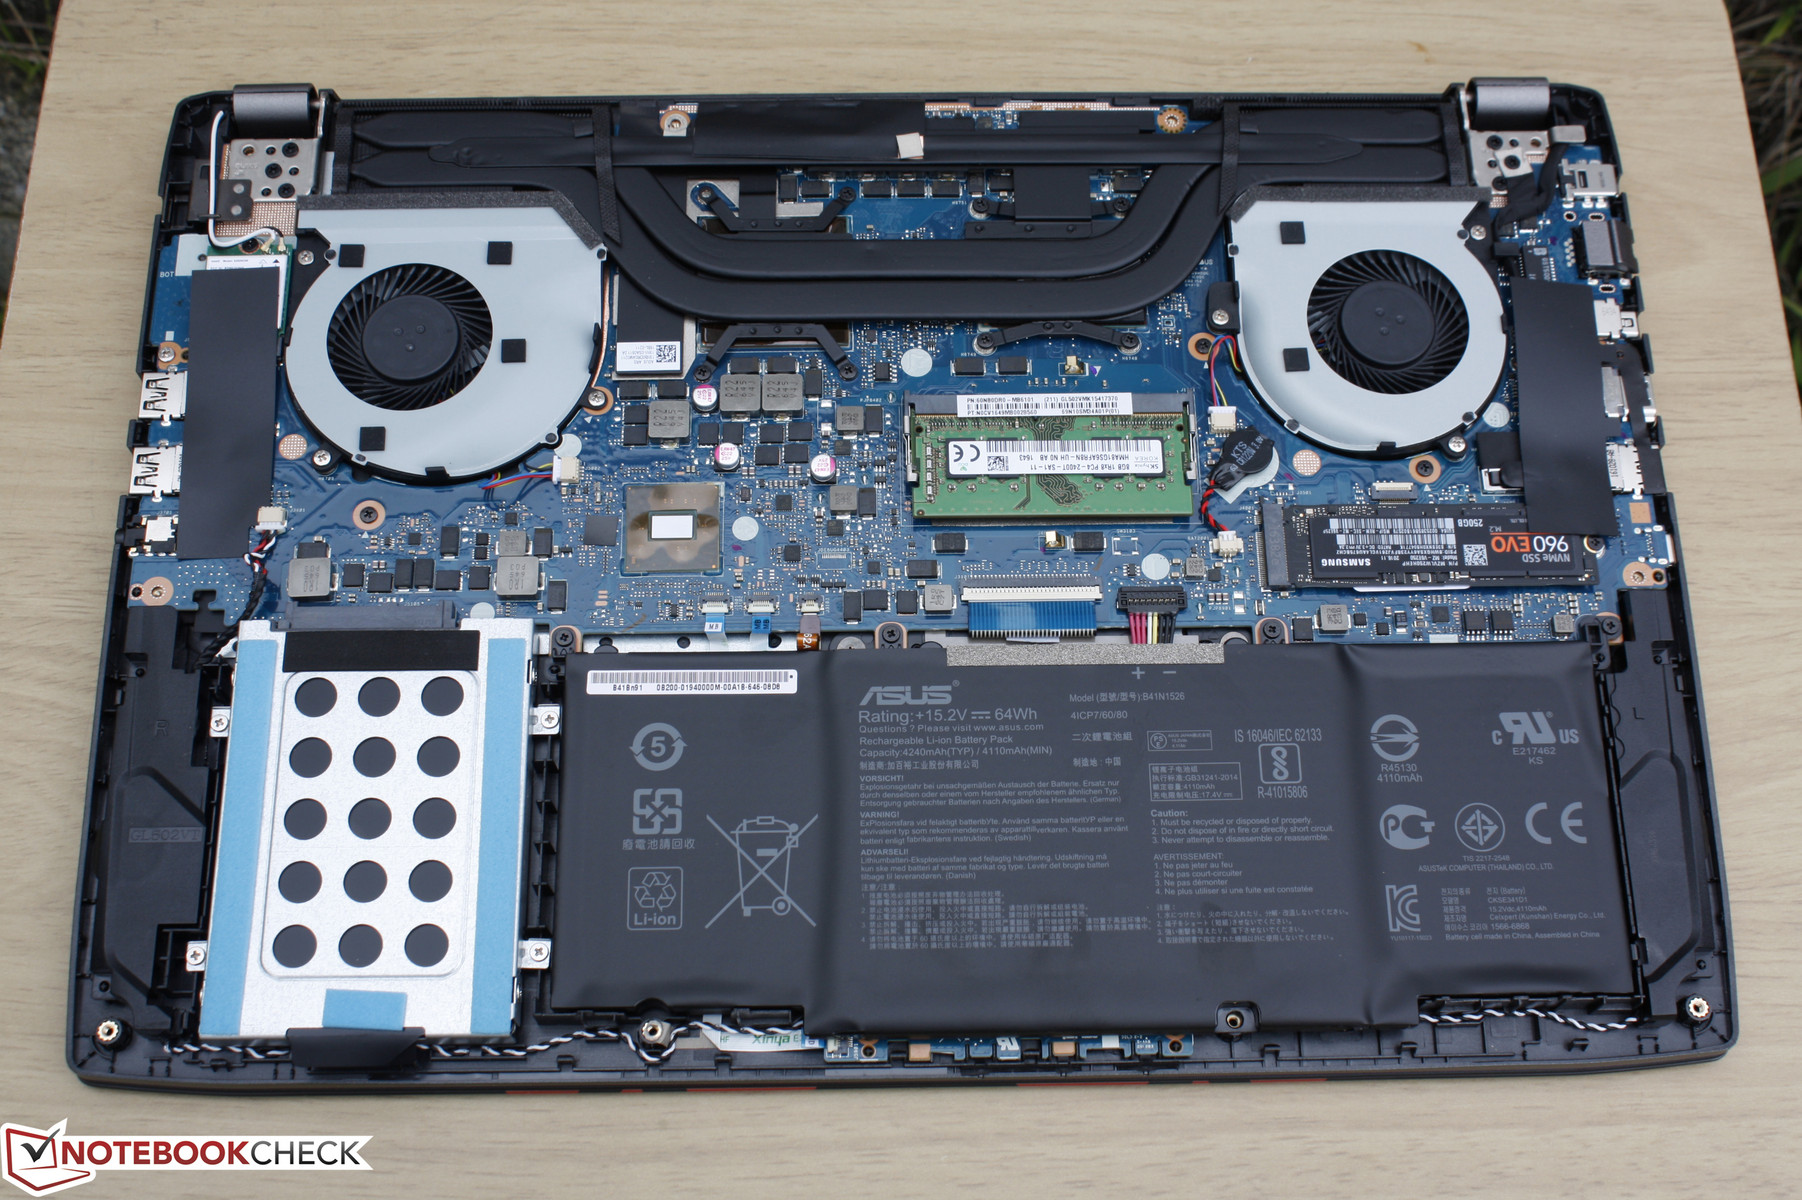
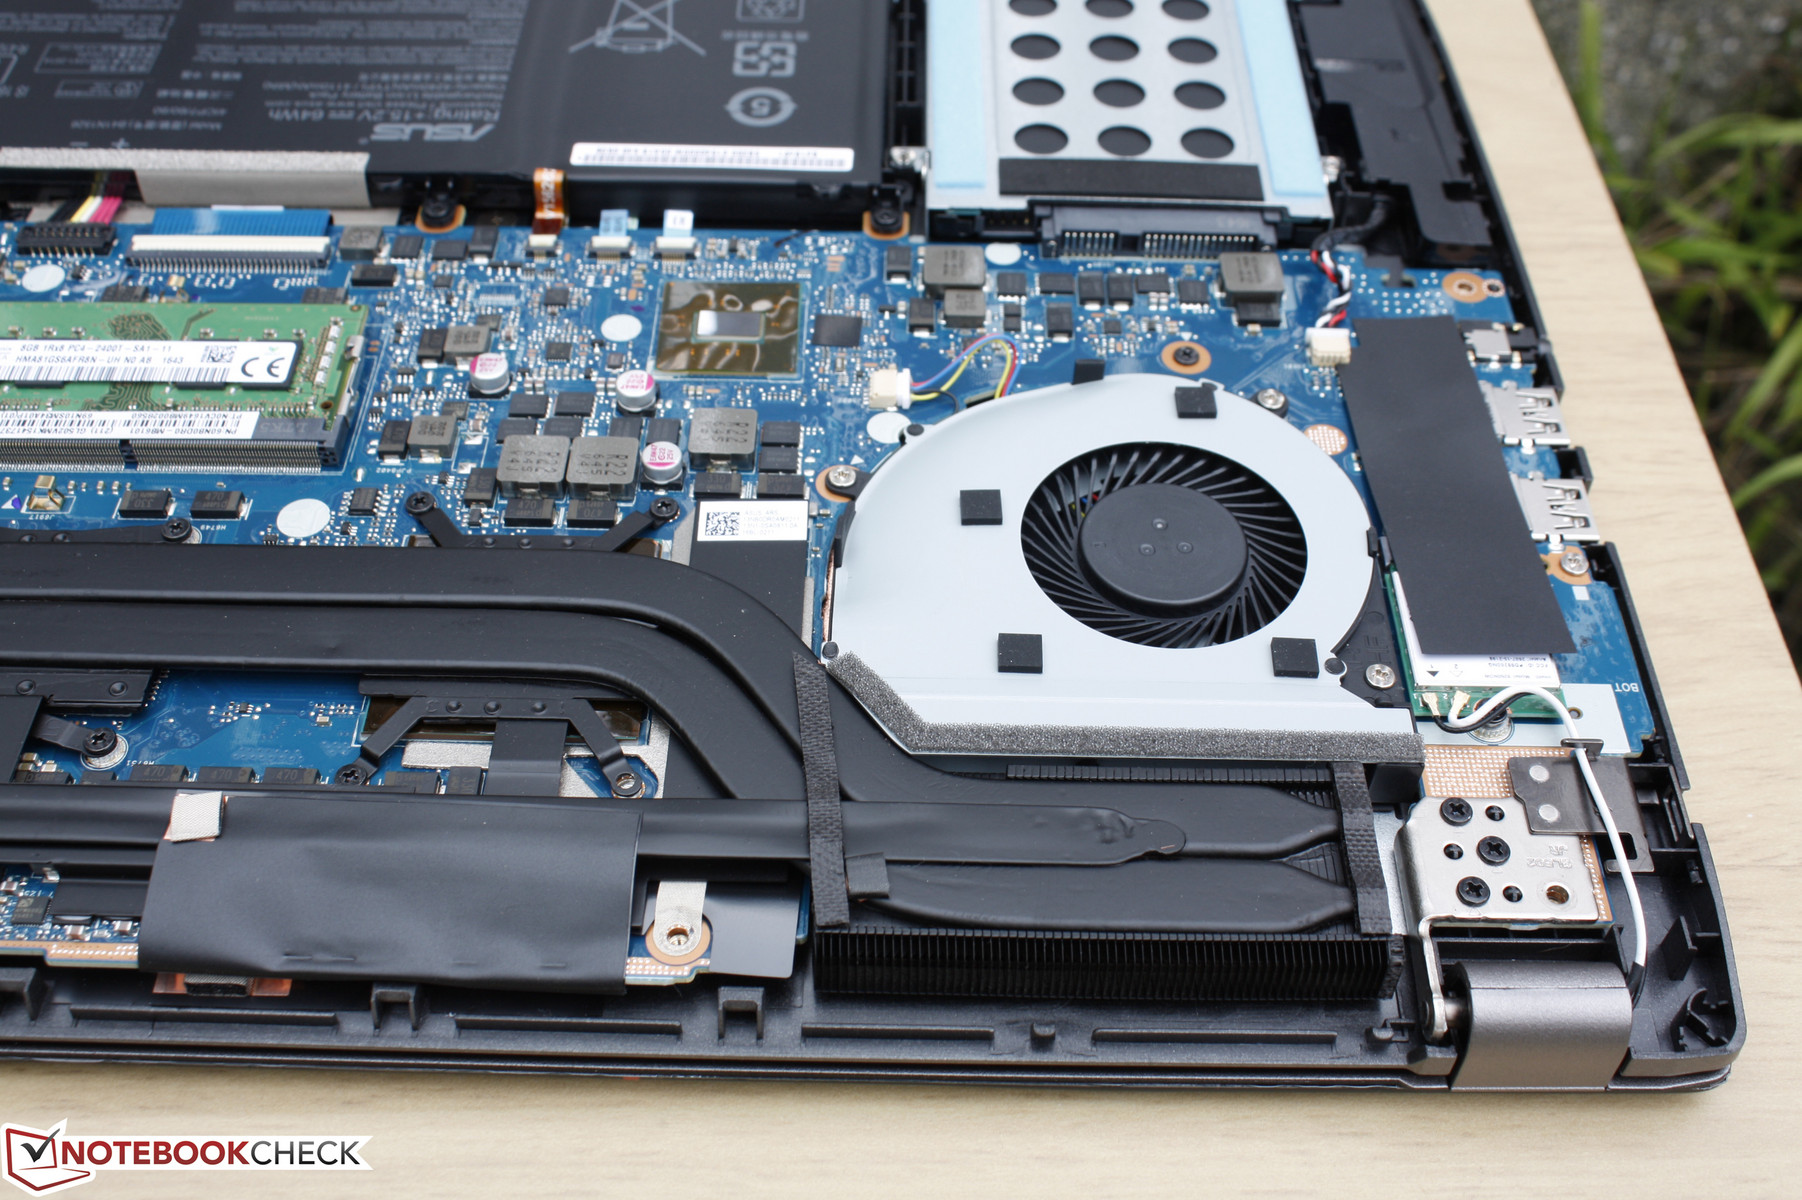
Maintenance
As opposed to the G752 or G701 series, serviceability on the GL502 is much easier. The bottom panel comes off with just a Philips screwdriver to remove the 10 screws around the edges and corners. Users will have easy access to the DDR4 SODIMM slot, cooling system, WLAN module, two storage bays, and internal 64 Wh battery.
Warranty
The standard one-year limited warranty applies from the manufacturer. Reseller Xotic PC will also cover defective units for the first year with options to extend up to three years. Users must register their purchases with the manufacturer in order to take advantage of the warranty options.
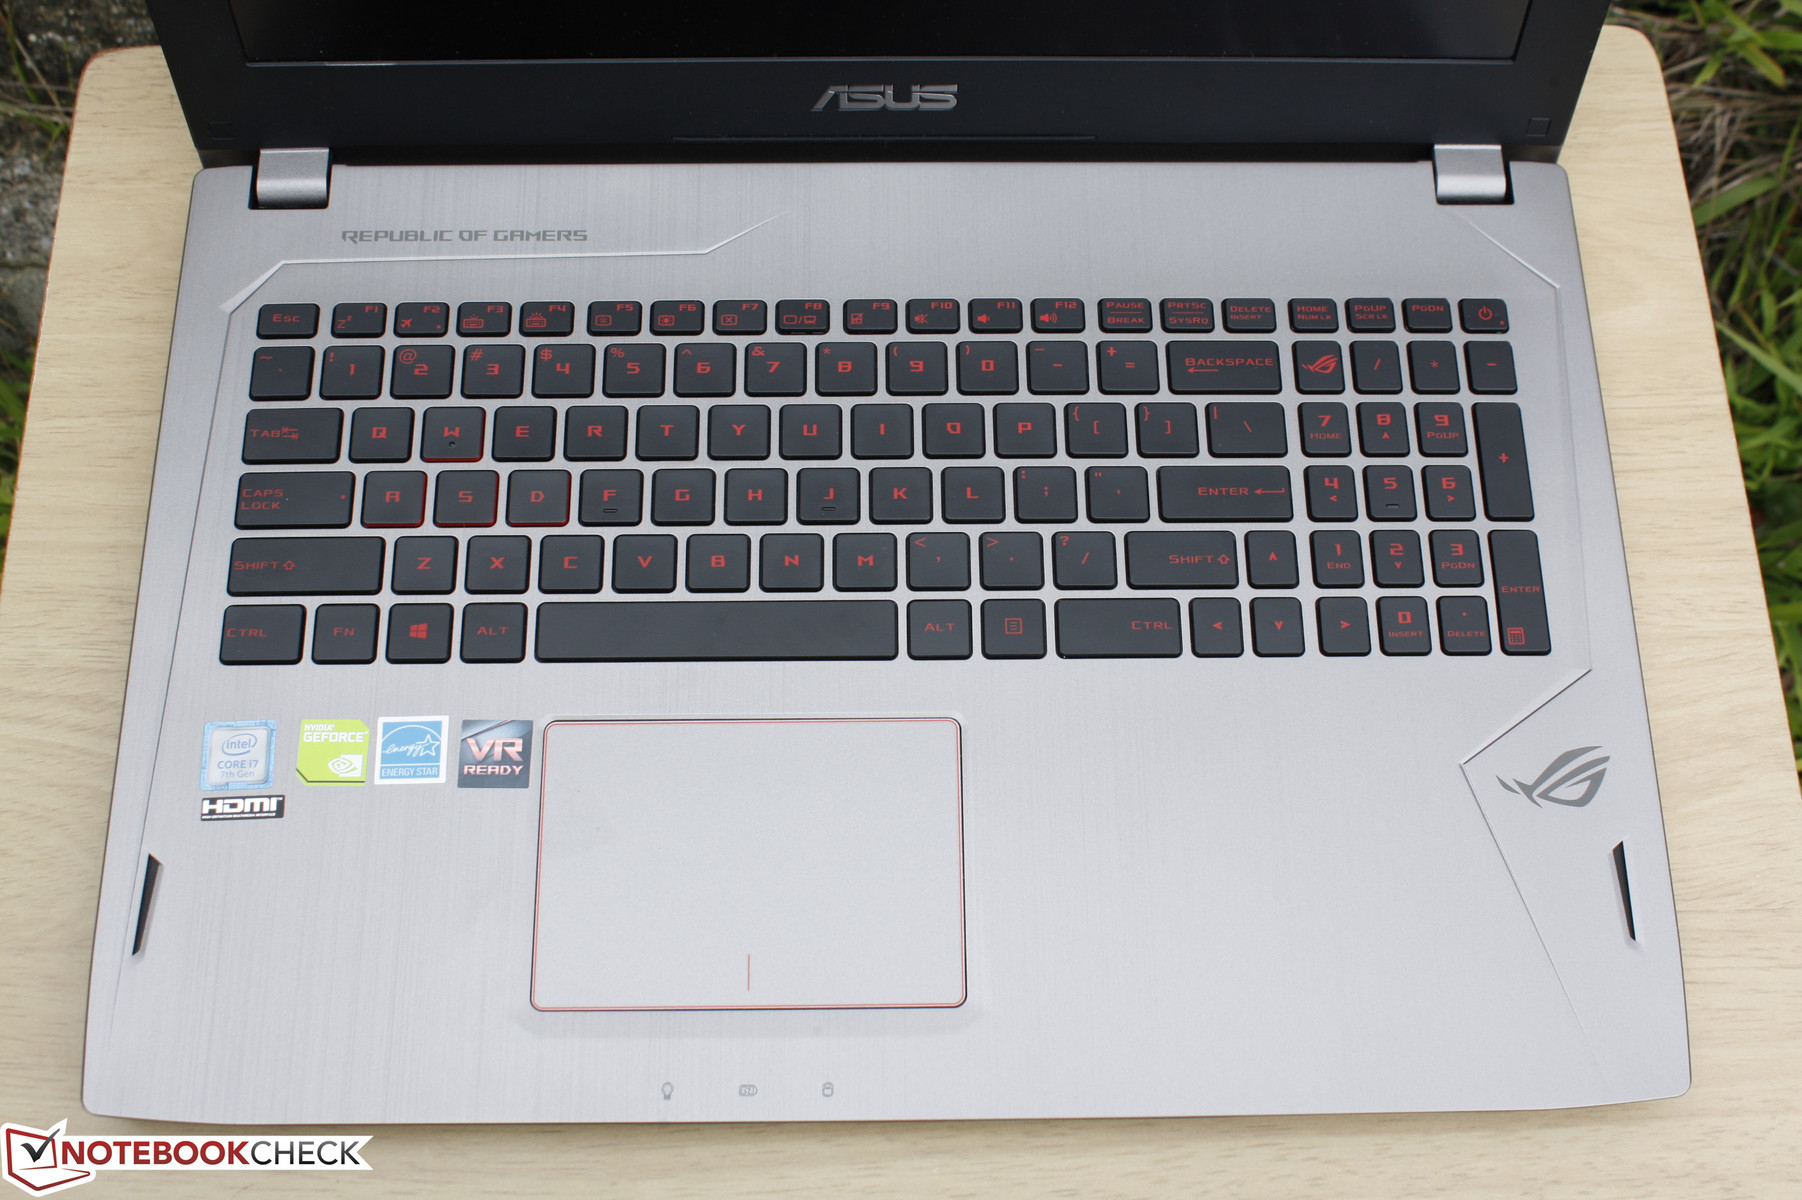
Input Devices
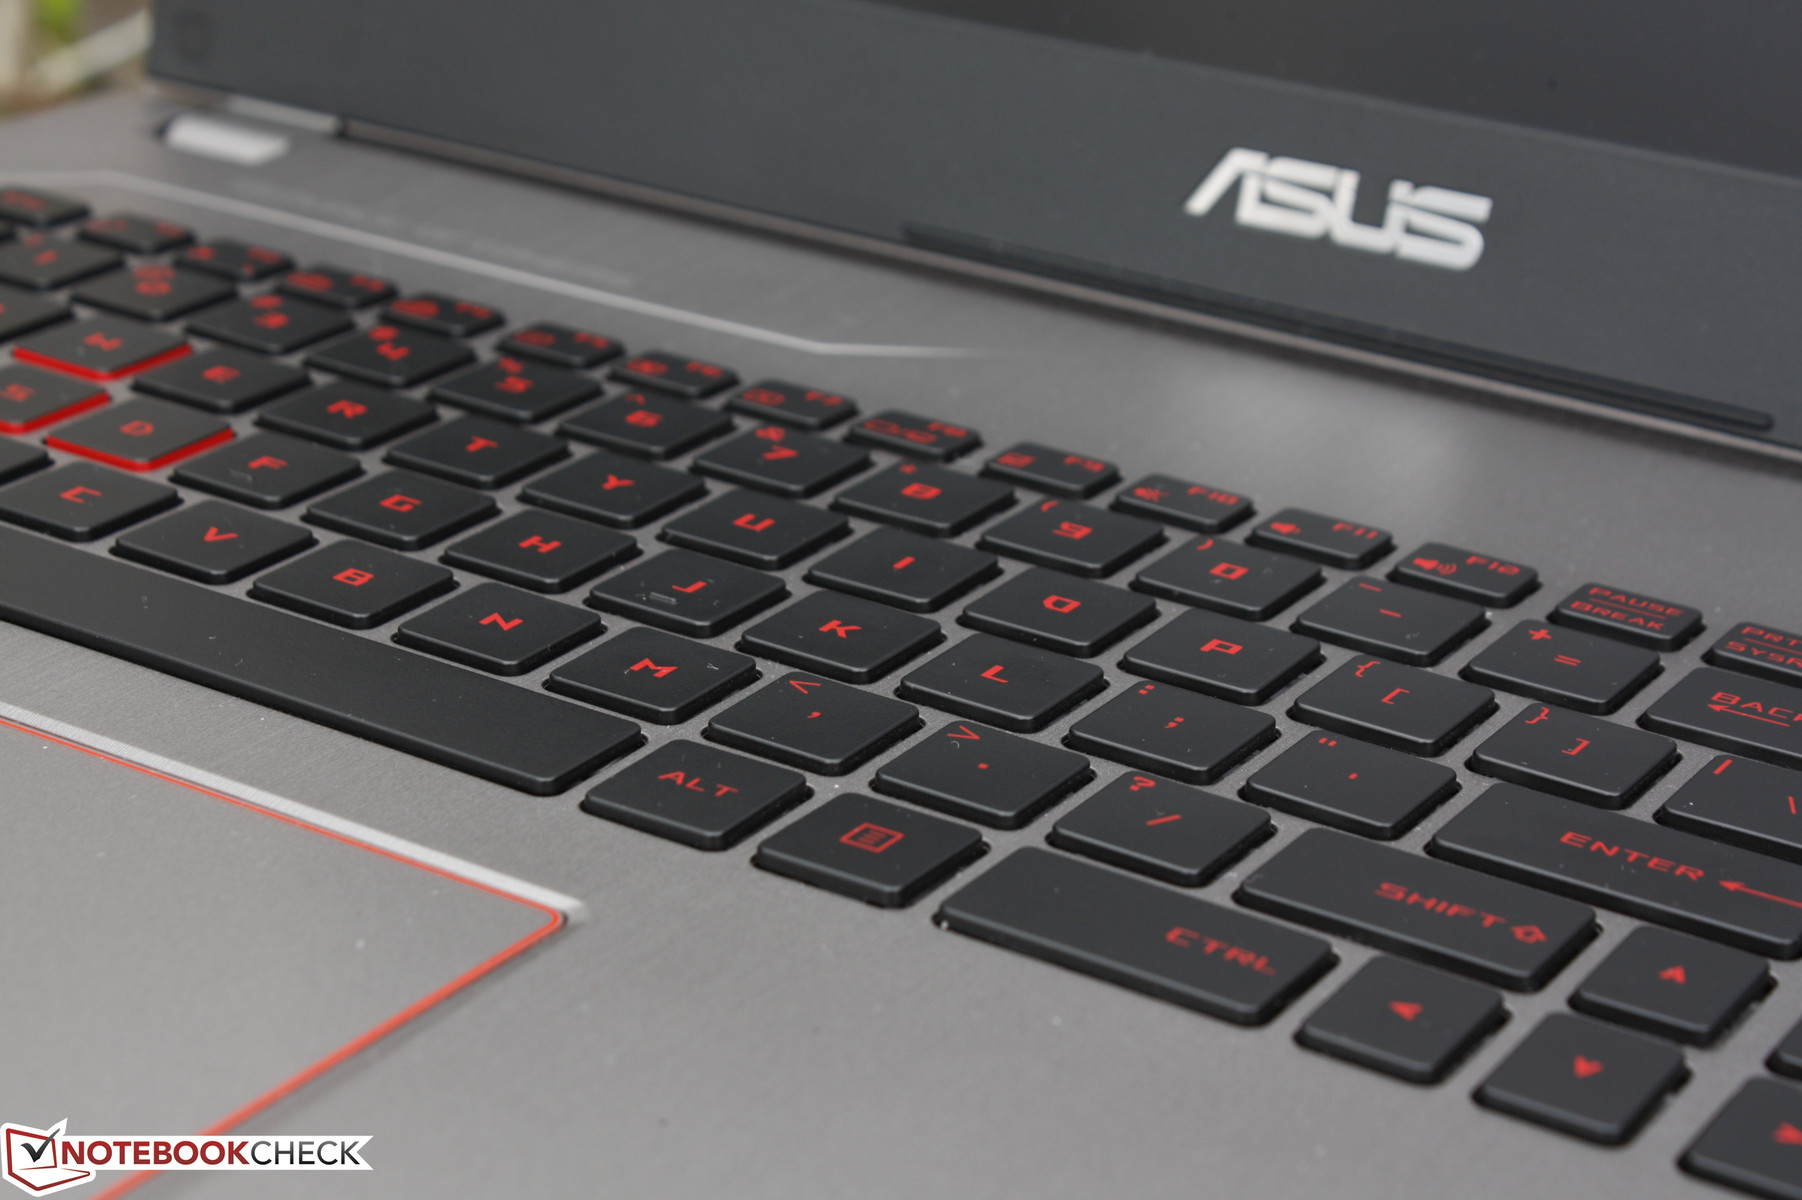
Keyboard
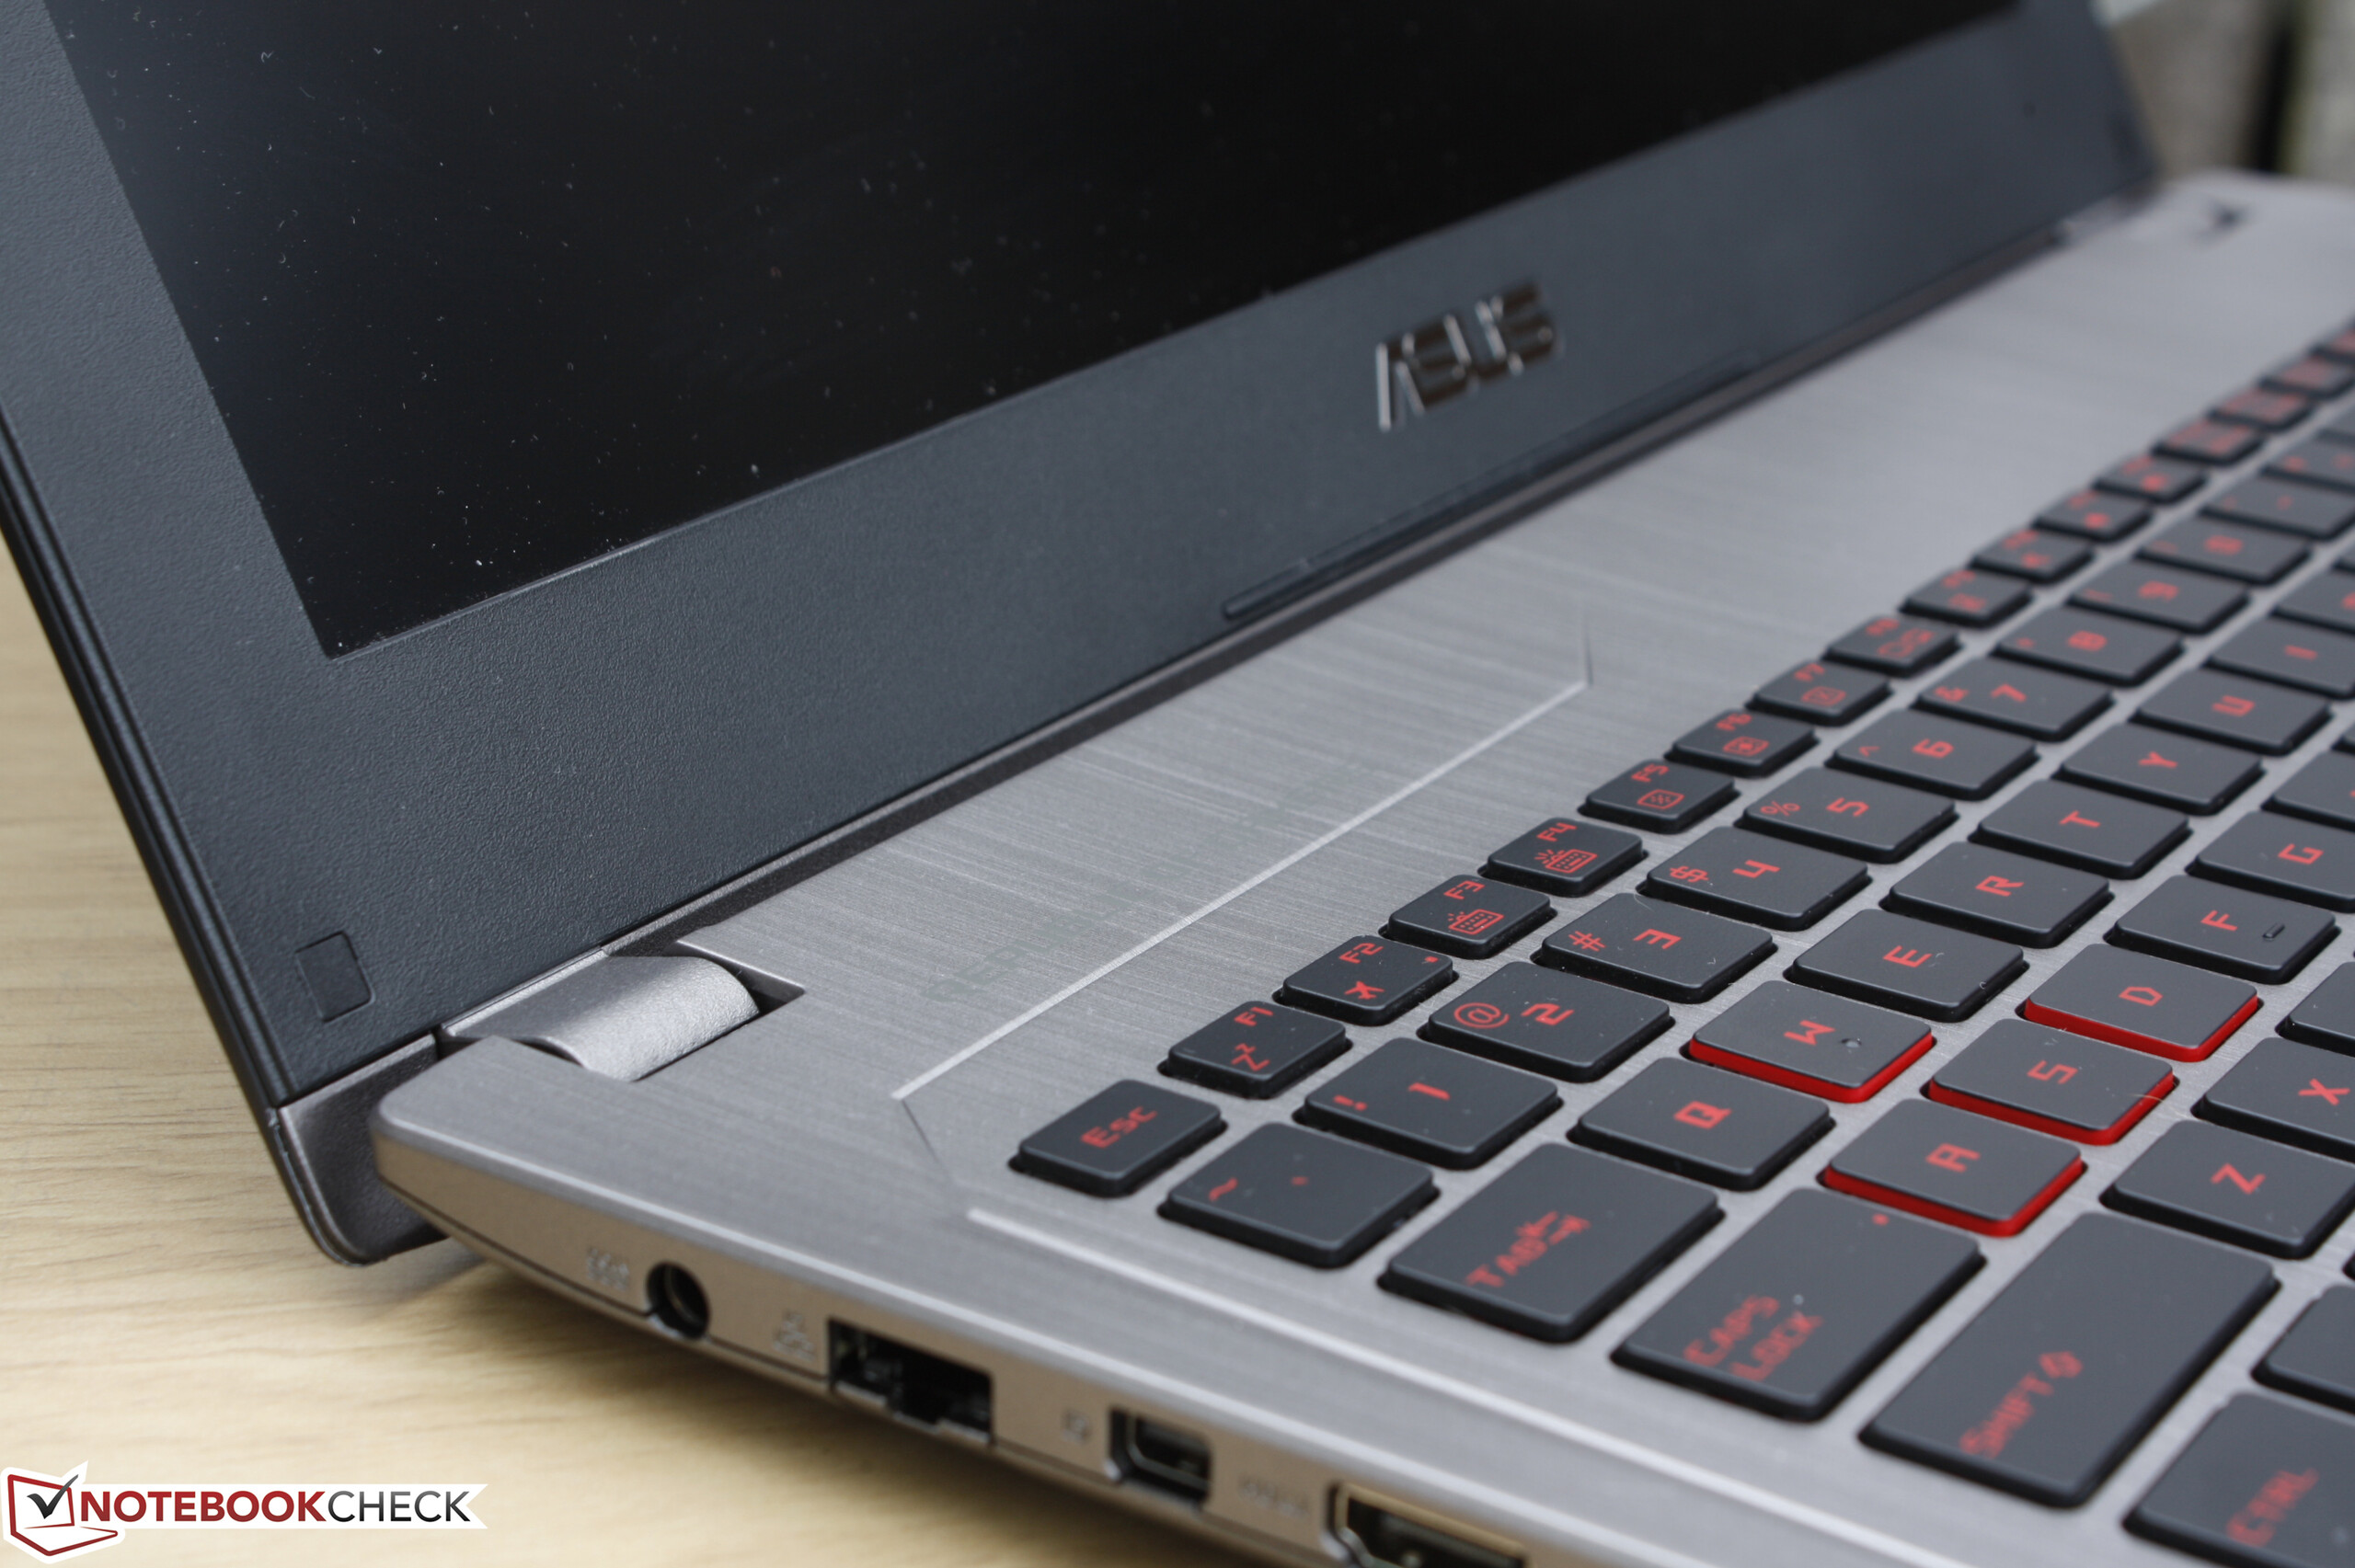
The keyboard is similar to what the GL502VS offers in both feel and layout with its key travel of 1.6 mm. Feedback is adequate if not a tad on the soft side with minimal clatter. When compared to the SteelSeries keyboard on the MSI G series, we find the Asus keys to be spongier and not as firm. Furthermore, the dark red font does not contrast well with the black keys and the lettering can thus be difficult to see if the backlight is disabled.
There are no dedicated Macro keys as found on the larger and pricier G752 series.
Touchpad
The touchpad (10.5 x 7.25 cm) is reliable for simple cursor control and multi-touch gestures. Unlike what we experienced on the GL502VS, the trackpad surface of our GL502VM test unit is equally responsive around its edges and corners as it is towards the center. Its gliding properties, however, continue to be less than ideal as smaller and more precise cursor movements are less smooth and would often result in finger slips.
The integrated mouse keys are shallow in travel with relatively soft auditory feedback when pressed. Inputting a click requires more force than average, so clicking multiple times in succession can quickly become tiresome.
Display
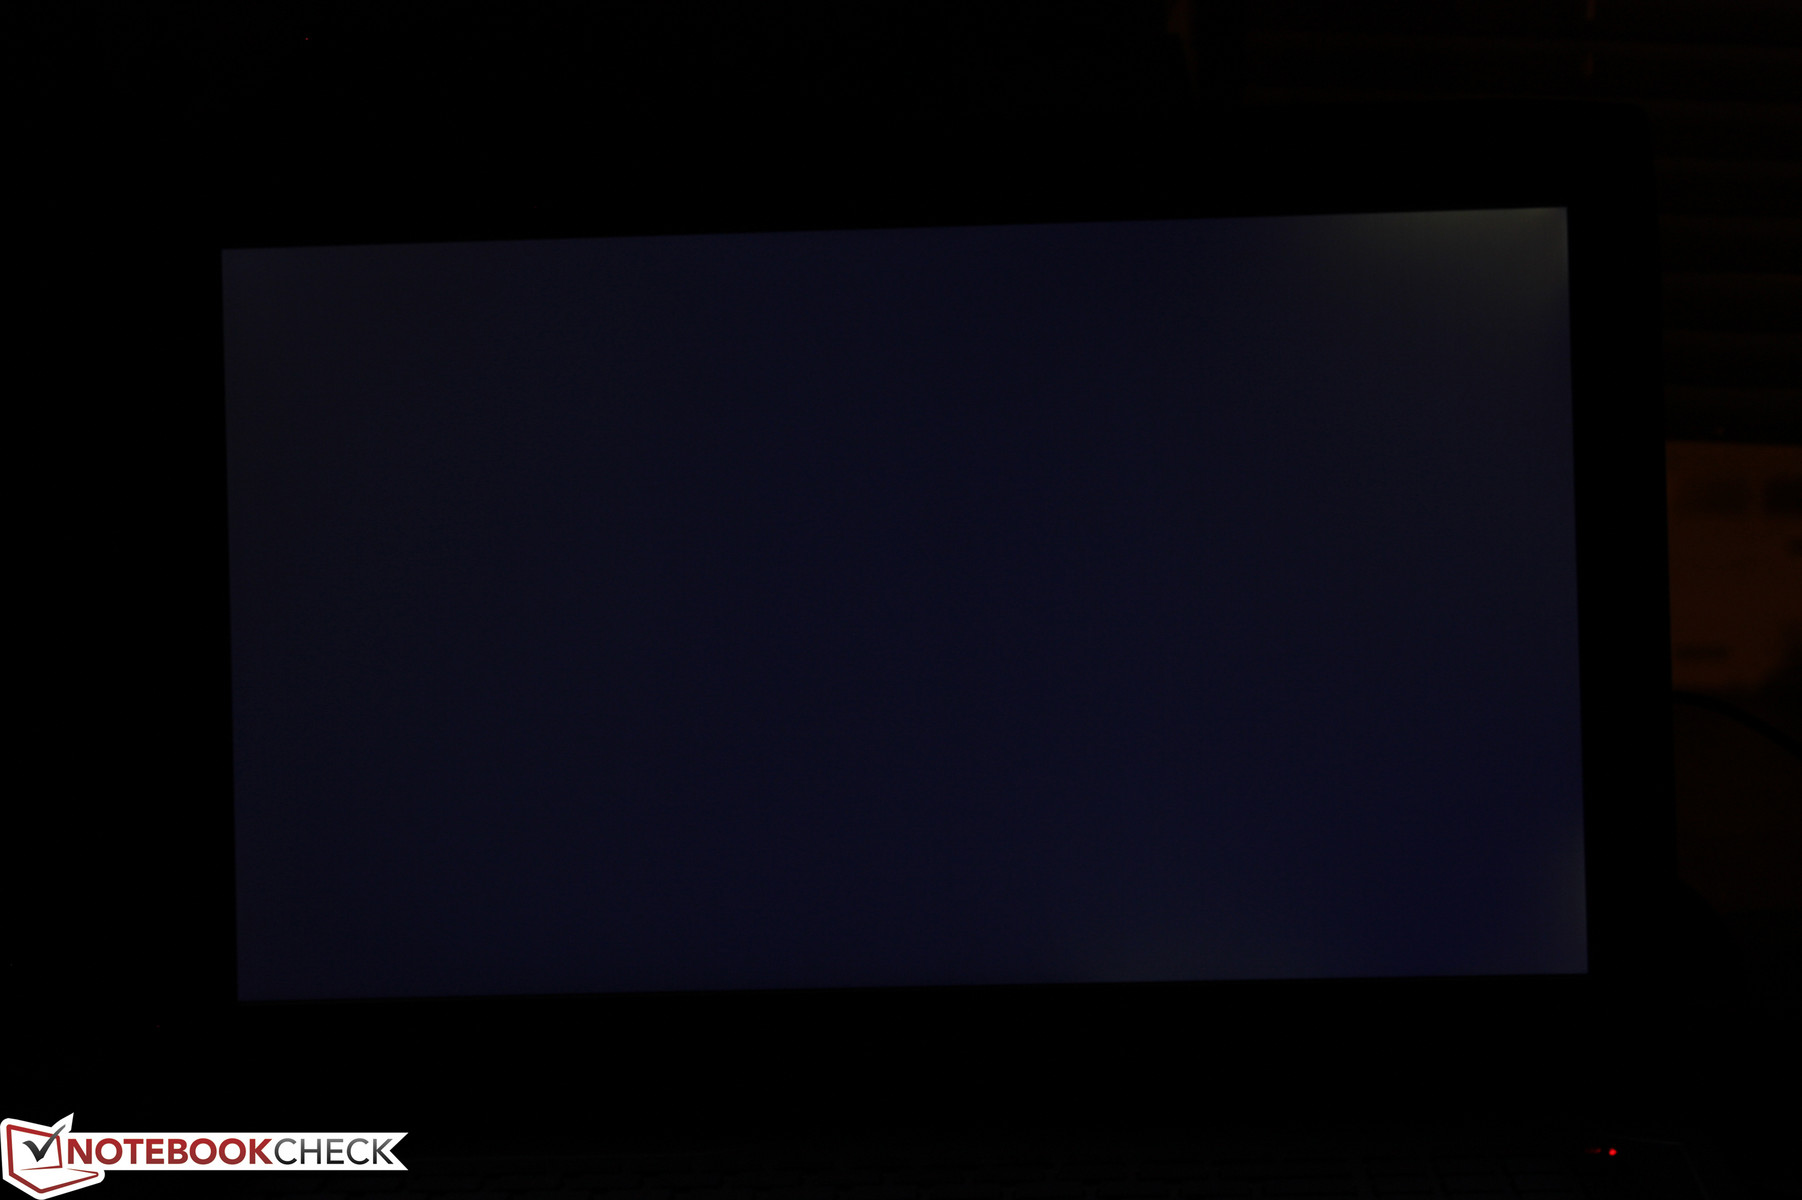
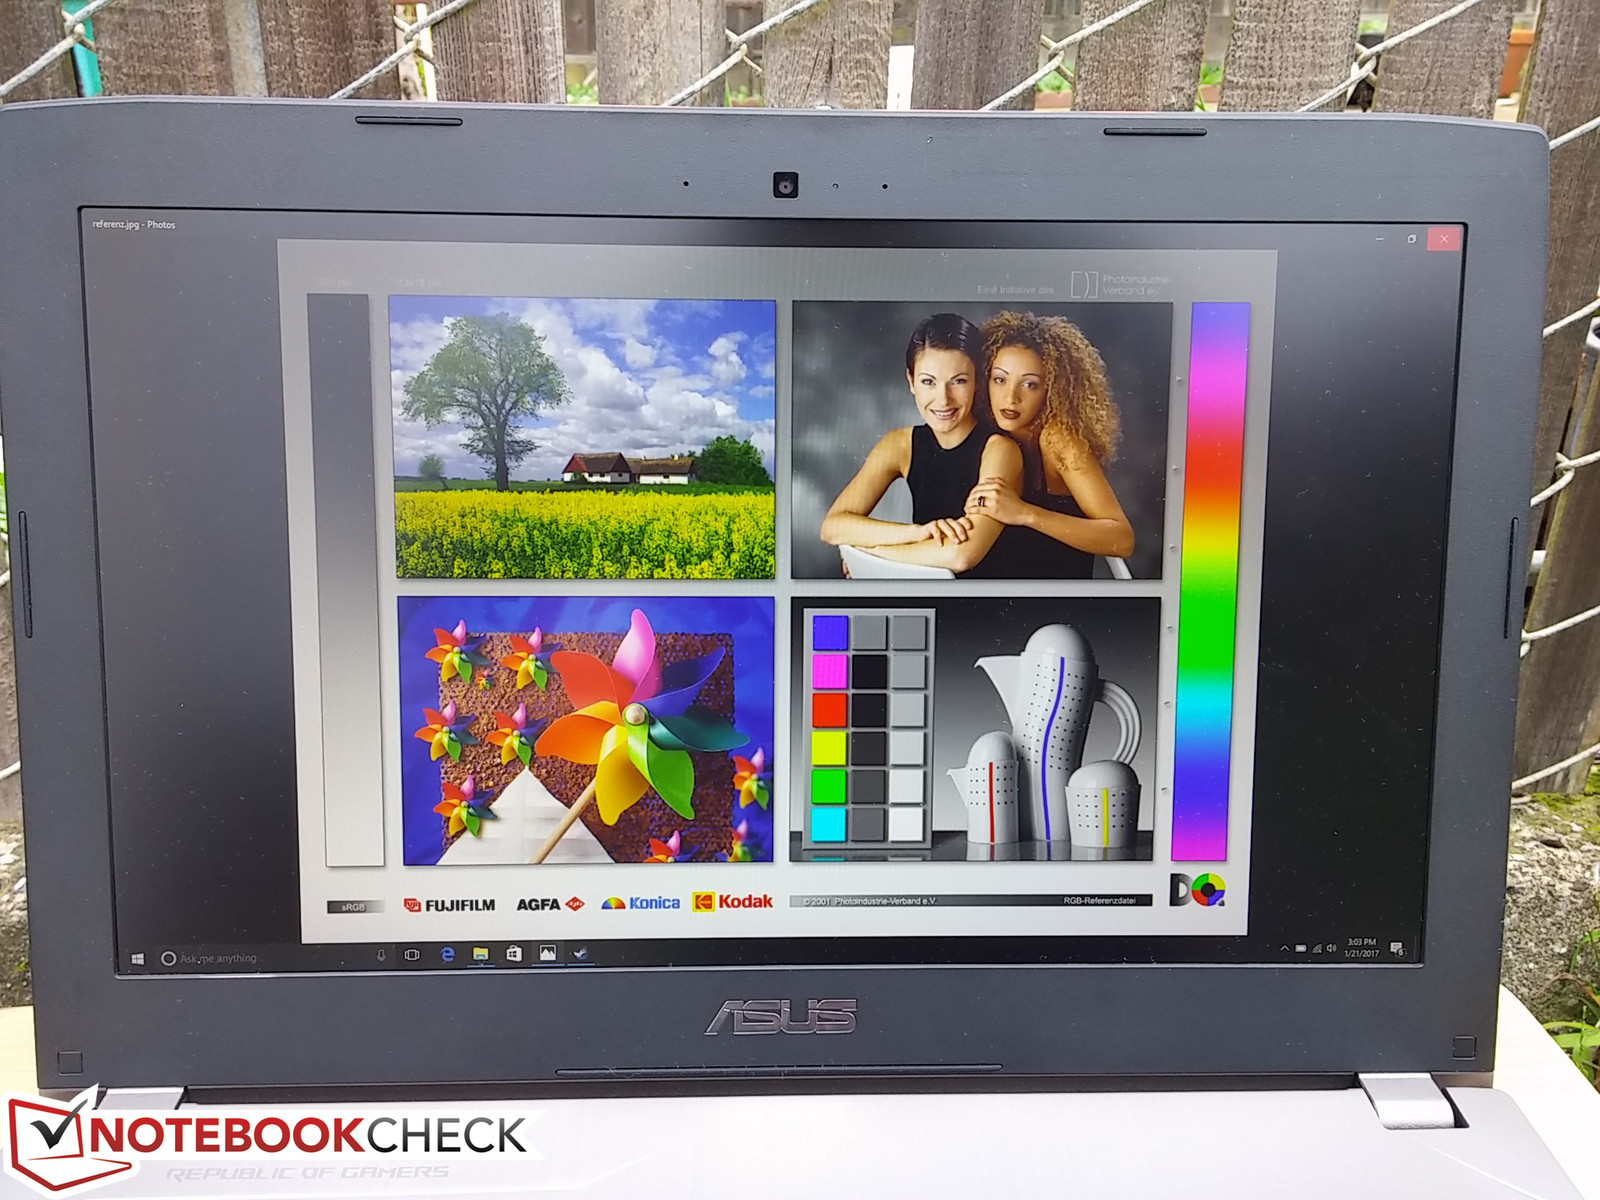
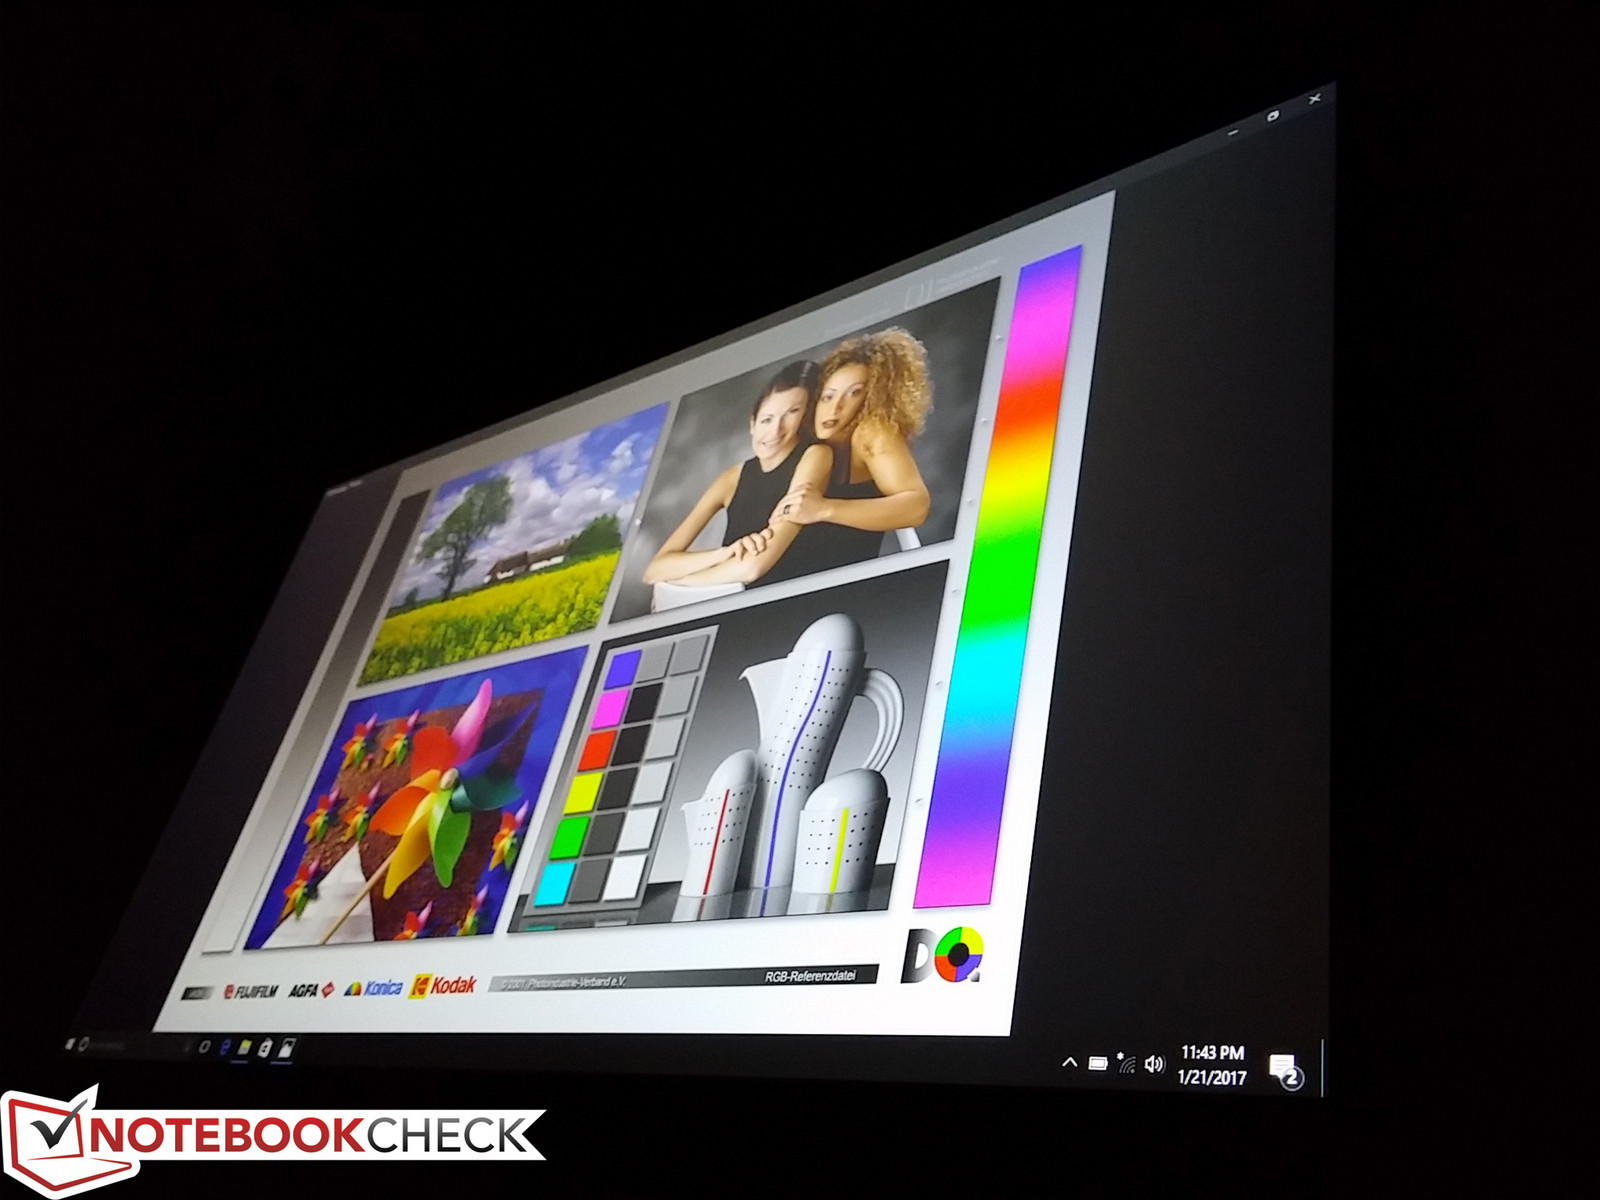
Display options for the GL502 include 4K UHD (3840 x 2160) and standard FHD (1920 x 1080). There are unfortunately no 120 Hz/5 ms configurations like on certain MSI and Aorus models for smoother gaming playback. The LG Philips LP156WF6-SPB6 panel in use on our Asus test unit is similar to what users may find on the Acer Predator 15 or the Zenbook UX510UW. Its ~1000:1 contrast ratio and ~300-nit brightness levels are on par with what users can expect from other gaming notebooks in this price range as well. Subjectively, the screen is clean with very little graininess that can often plague non-glossy displays.
There is minor uneven backlight bleeding on the two right corners of our test unit as shown in our image below. This is largely unnoticeable when browsing or gaming.

| |||||||||||||||||||||||||
Brightness Distribution: 88 %
Center on Battery: 307.8 cd/m²
Contrast: 933:1 (Black: 0.33 cd/m²)
ΔE Color 4.5 | 0.5-29.43 Ø5
ΔE Greyscale 2.9 | 0.57-98 Ø5.3
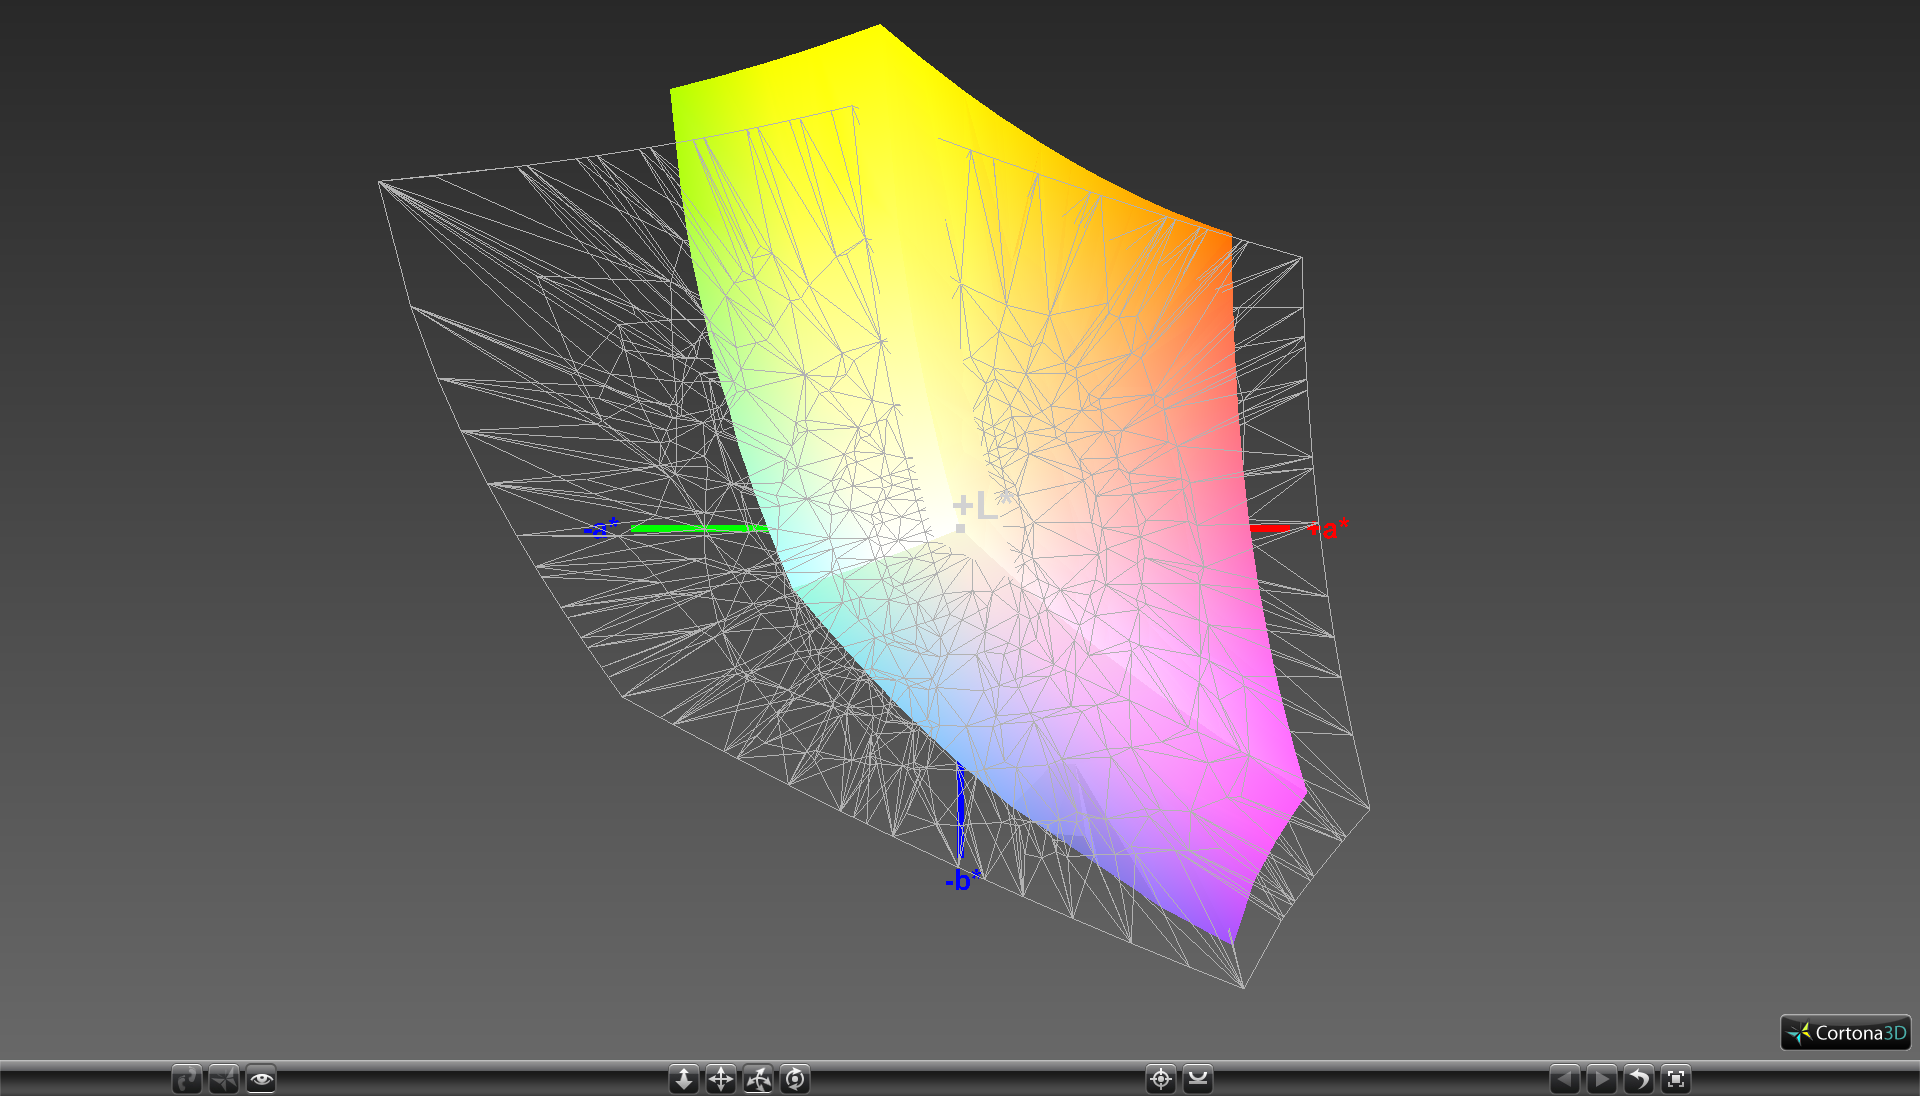
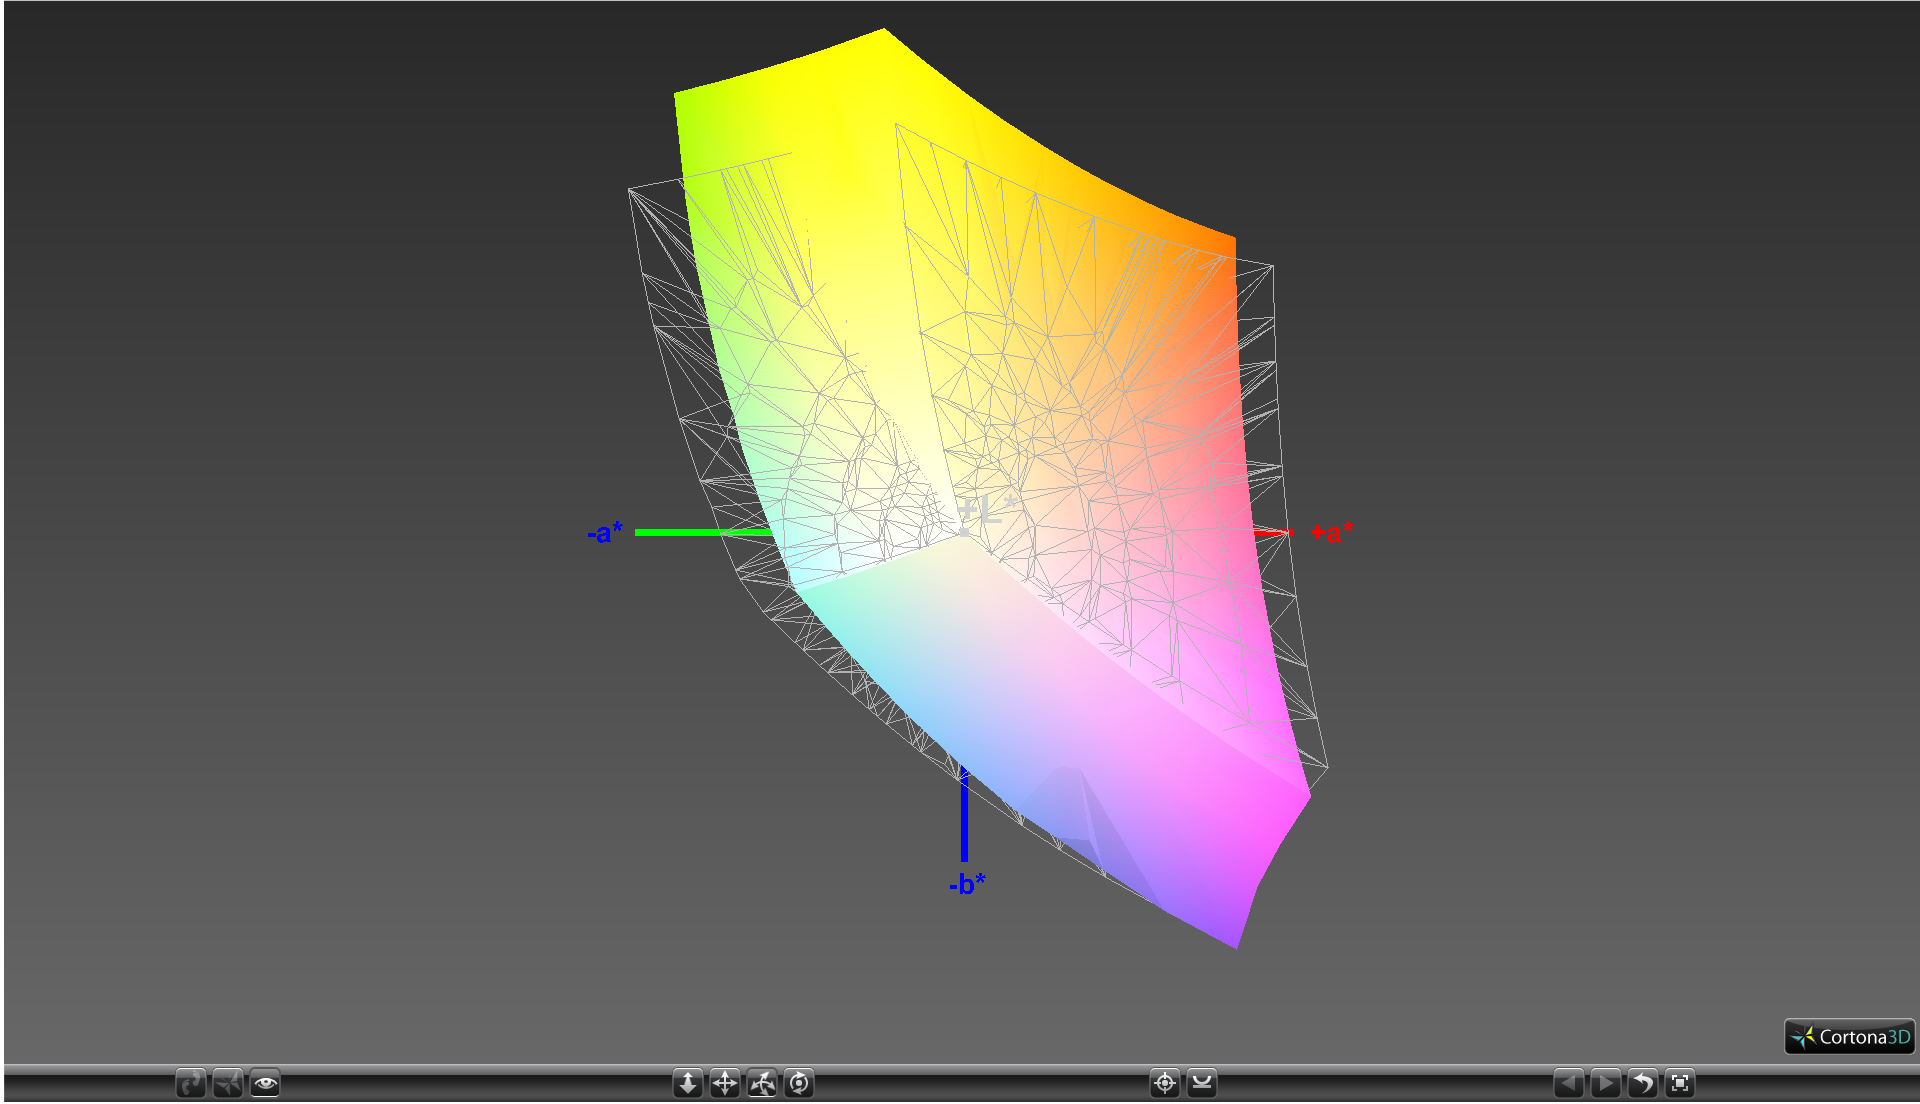
84.8% sRGB (Argyll 1.6.3 3D)
55.4% AdobeRGB 1998 (Argyll 1.6.3 3D)
62% AdobeRGB 1998 (Argyll 2.2.0 3D)
84.9% sRGB (Argyll 2.2.0 3D)
64.8% Display P3 (Argyll 2.2.0 3D)
Gamma: 2.22
| Asus Strix GL502VM-DS74 IPS, 15.60, 1920x1080 | MSI GL62-6QFi781H11 CMN N156HGE-EAL (CMN15D2), TN LED, 15.60, 1920x1080 | Acer Predator 15 G9-593-765Q LG Philips LP156WF6-SPP1 (LGD04D5), IPS, 15.60, 1920x1080 | Asus Zenbook UX510UW-CN044T LG Philips LP156WF6-SPB6, IPS, 15.60, 1920x1080 | MSI GS63VR-6RF16H22 Stealth Pro Samsung 156HL01-104 (SDC324C) , IPS, 15.60, 1920x1080 | |
|---|---|---|---|---|---|
| Display | 29% | -1% | -5% | 11% | |
| Display P3 Coverage | 64.8 | 85.8 32% | 63.6 -2% | 61.5 -5% | 67.8 5% |
| sRGB Coverage | 84.9 | 99.8 18% | 83.9 -1% | 80.4 -5% | 97.4 15% |
| AdobeRGB 1998 Coverage | 62 | 84.1 36% | 61.3 -1% | 58.8 -5% | 69.7 12% |
| Response Times | 14% | 21% | 13% | 21% | |
| Response Time Grey 50% / Grey 80% * | 42 ? | 43 ? -2% | 35 ? 17% | 40 ? 5% | |
| Response Time Black / White * | 32.8 ? | 23 ? 30% | 25 ? 24% | 26 ? 21% | 26 ? 21% |
| PWM Frequency | 1000 ? | 202 ? | |||
| Screen | -58% | 2% | -12% | 4% | |
| Brightness middle | 307.8 | 216 -30% | 273 -11% | 326 6% | 293 -5% |
| Brightness | 301 | 202 -33% | 267 -11% | 316 5% | 279 -7% |
| Brightness Distribution | 88 | 83 -6% | 83 -6% | 80 -9% | 84 -5% |
| Black Level * | 0.33 | 0.48 -45% | 0.27 18% | 0.35 -6% | 0.33 -0% |
| Contrast | 933 | 450 -52% | 1011 8% | 931 0% | 888 -5% |
| Colorchecker dE 2000 * | 4.5 | 9.98 -122% | 3.77 16% | 5.49 -22% | 3.59 20% |
| Colorchecker dE 2000 max. * | 10 | 17.12 -71% | 10.64 -6% | 11.36 -14% | 5.79 42% |
| Greyscale dE 2000 * | 2.9 | 10.91 -276% | 2.48 14% | 4.84 -67% | 3.86 -33% |
| Gamma | 2.22 99% | 2.31 95% | 2.37 93% | 2.23 99% | 2.53 87% |
| CCT | 1136 572% | 13185 49% | 6854 95% | 5971 109% | 7229 90% |
| Color Space (Percent of AdobeRGB 1998) | 55.4 | 75 35% | 55 -1% | 53 -4% | 63 14% |
| Color Space (Percent of sRGB) | 84.8 | 100 18% | 84 -1% | 80 -6% | 97 14% |
| Total Average (Program / Settings) | -5% /
-31% | 7% /
4% | -1% /
-7% | 12% /
6% |
* ... smaller is better
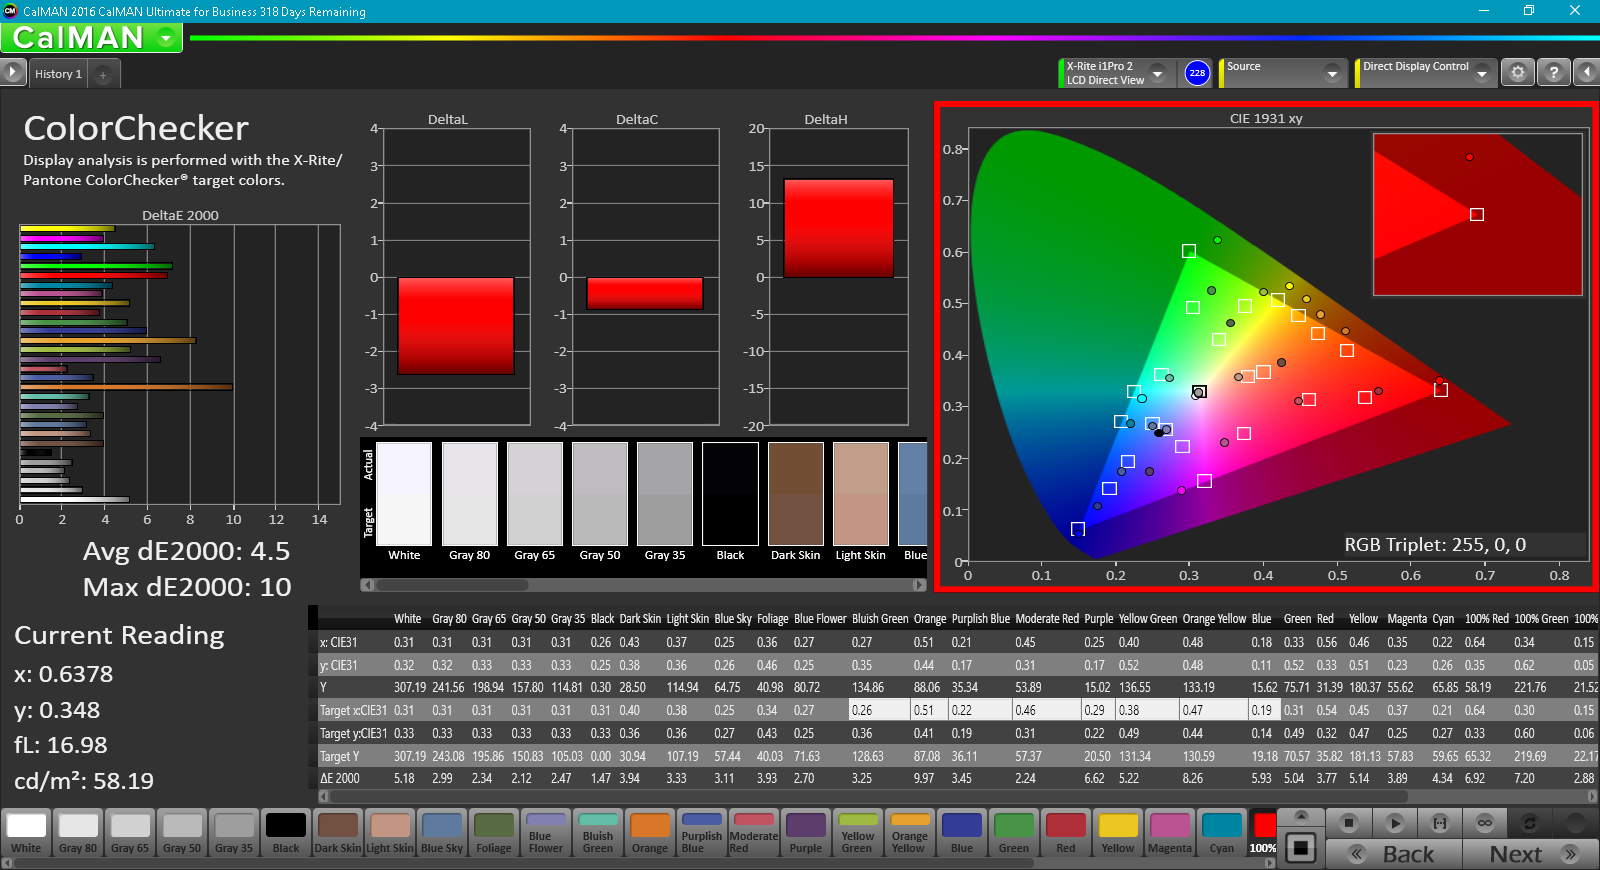
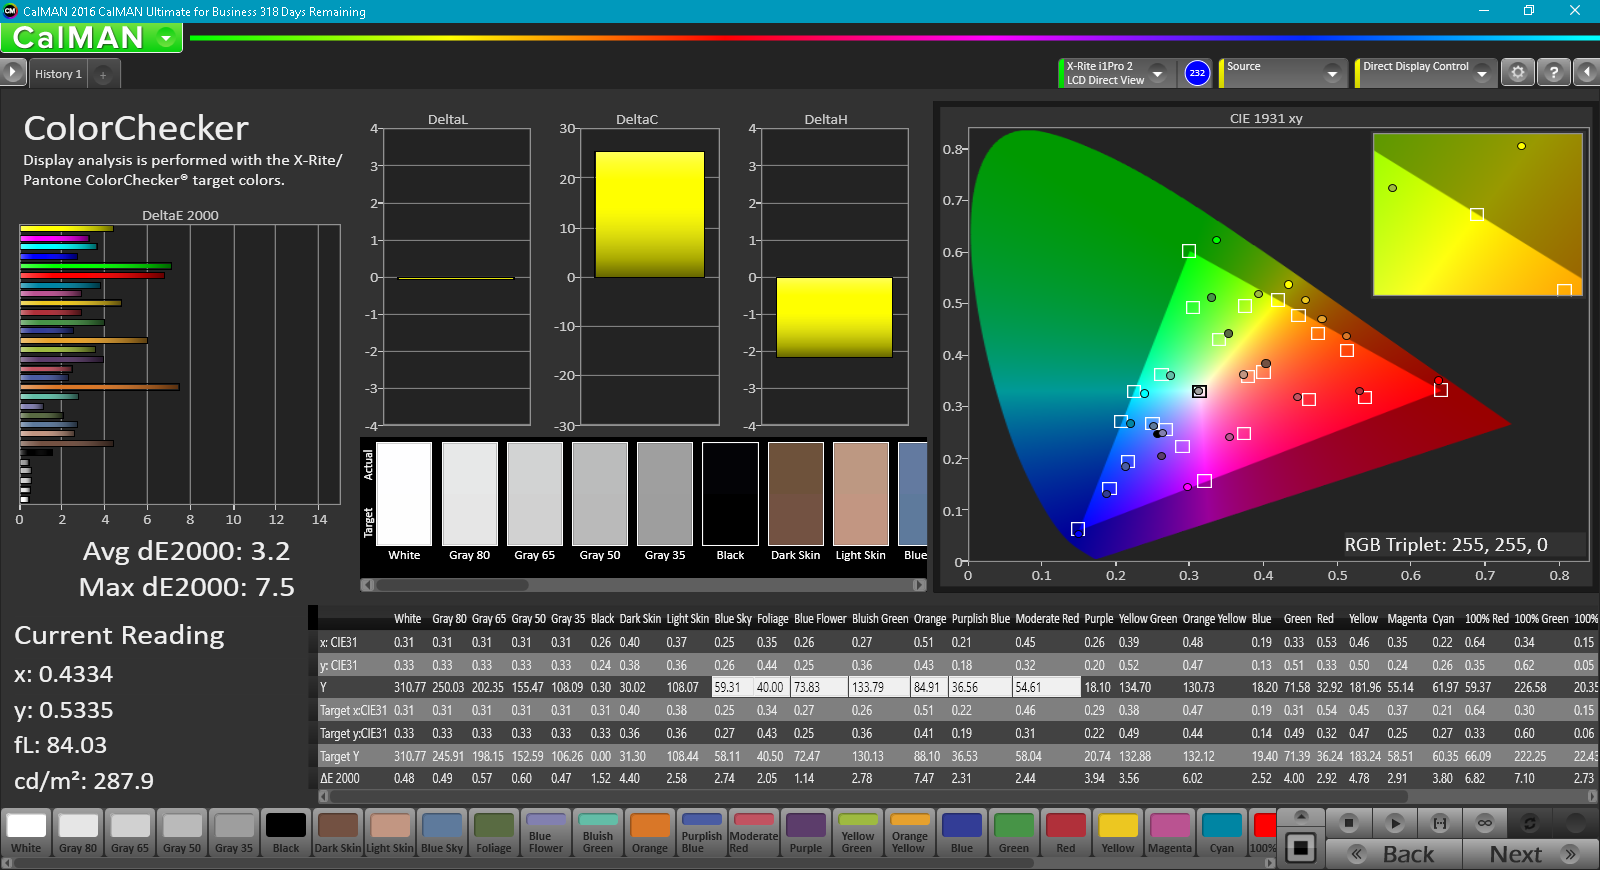
Color gamut is approximately 55 percent and 85 percent of the AdobeRGB and sRGB standards, respectively. This is superior to most budget TN panels and unsurprisingly similar to the display on the Acer Predator 15. Interestingly, Asus is advertising 100 percent sRGB and 98 percent AdobeRGB coverage with the GL502, but this is certainly not what our own measurements show on the FHD SKU. Certain manufacturers like MSI or Razer offer true sRGB coverage that match our own findings to better appeal to digital artists and designers in addition to gamers.

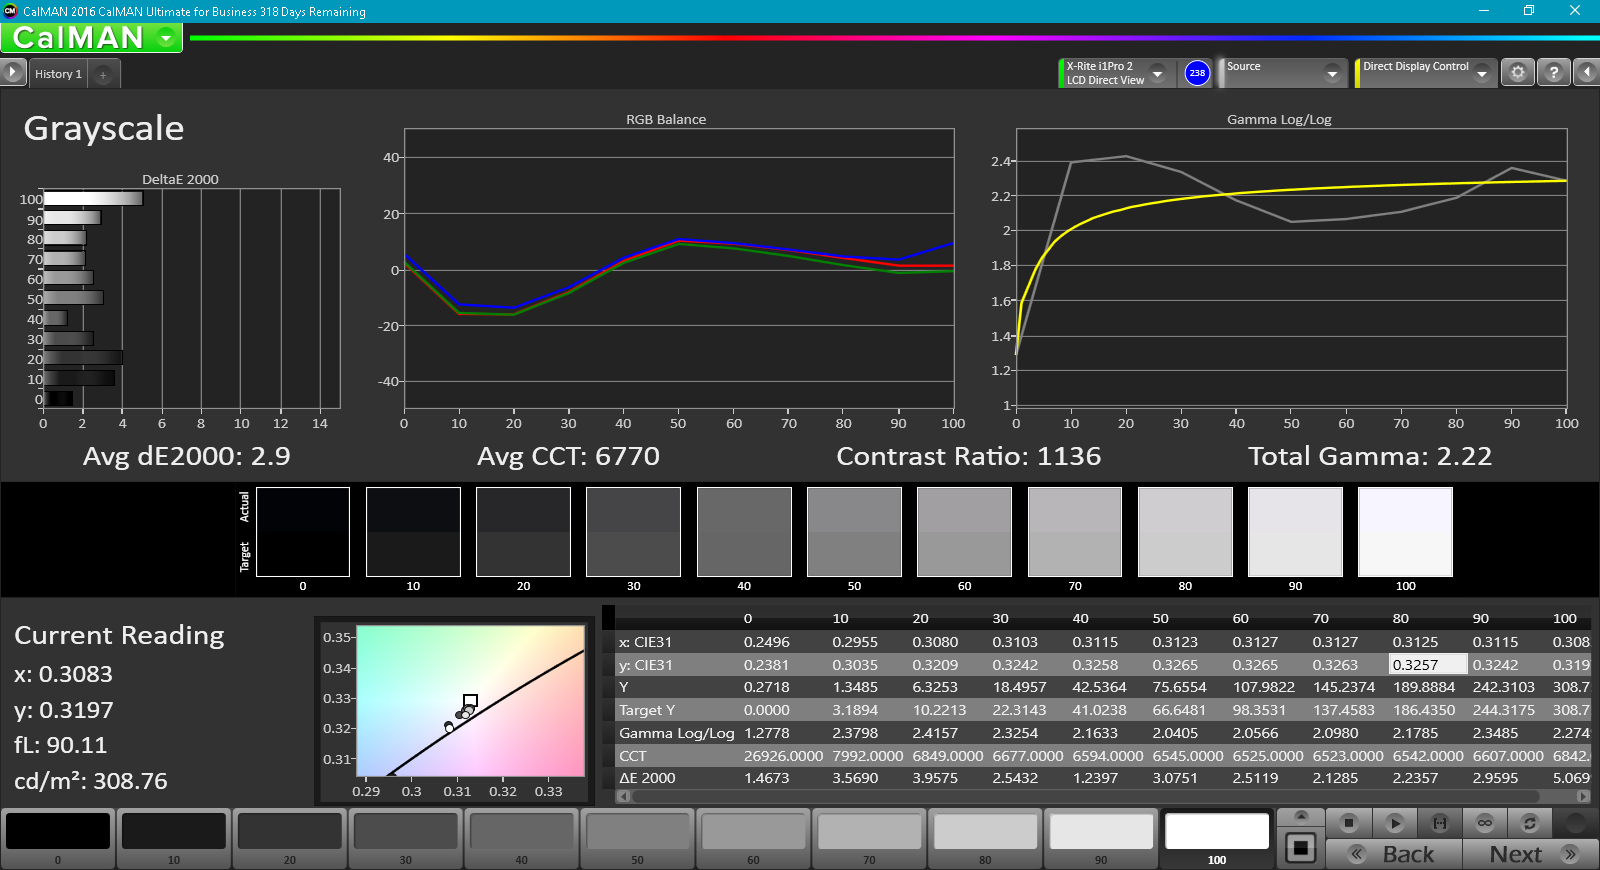
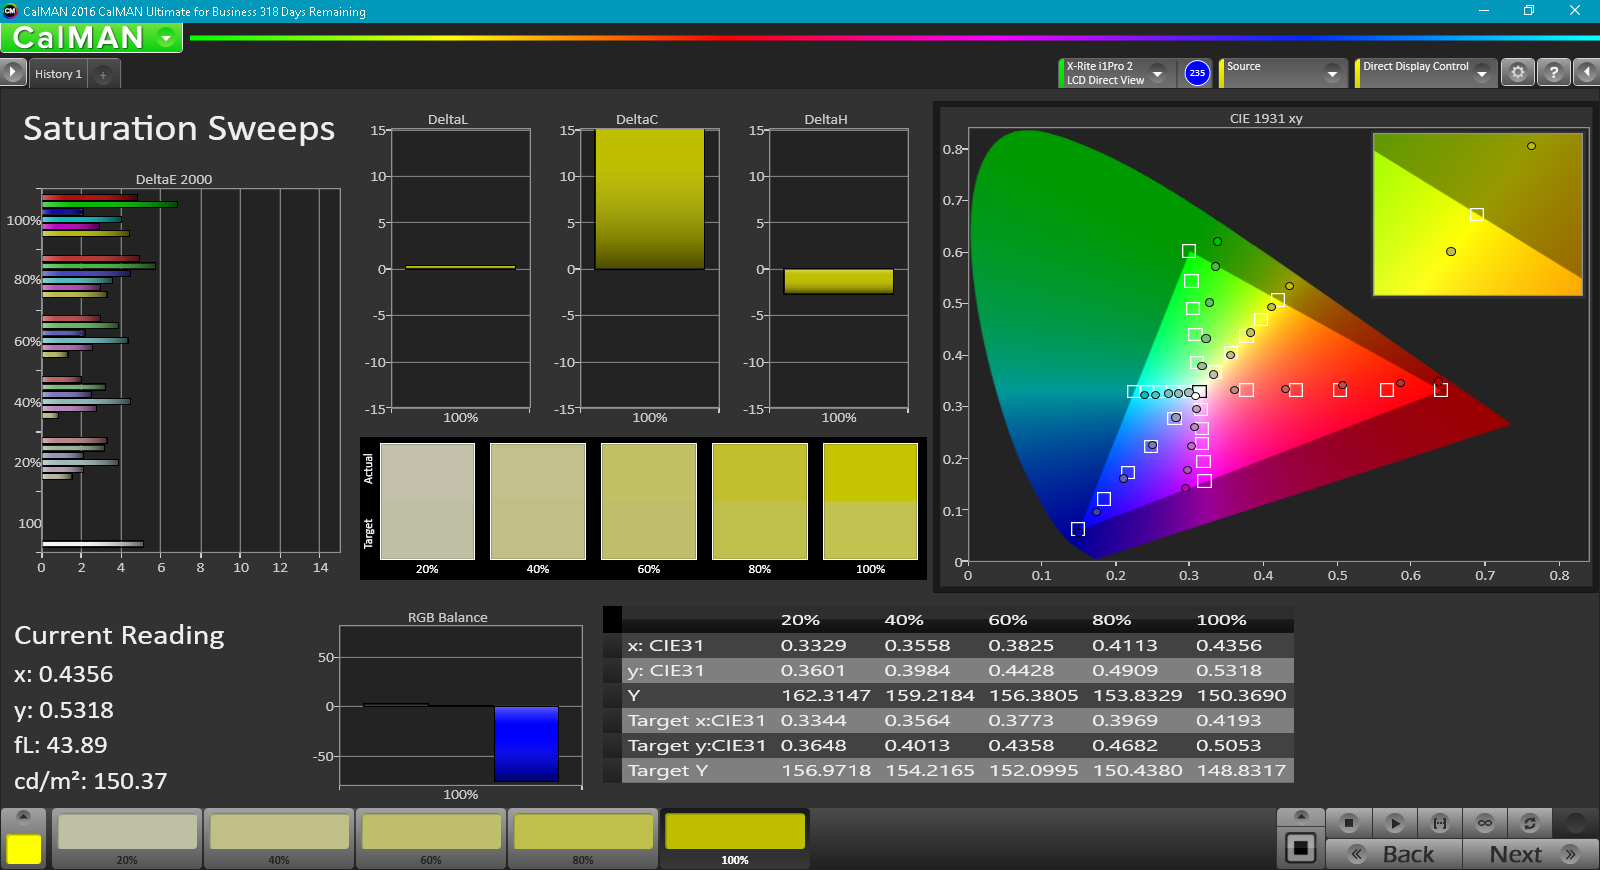
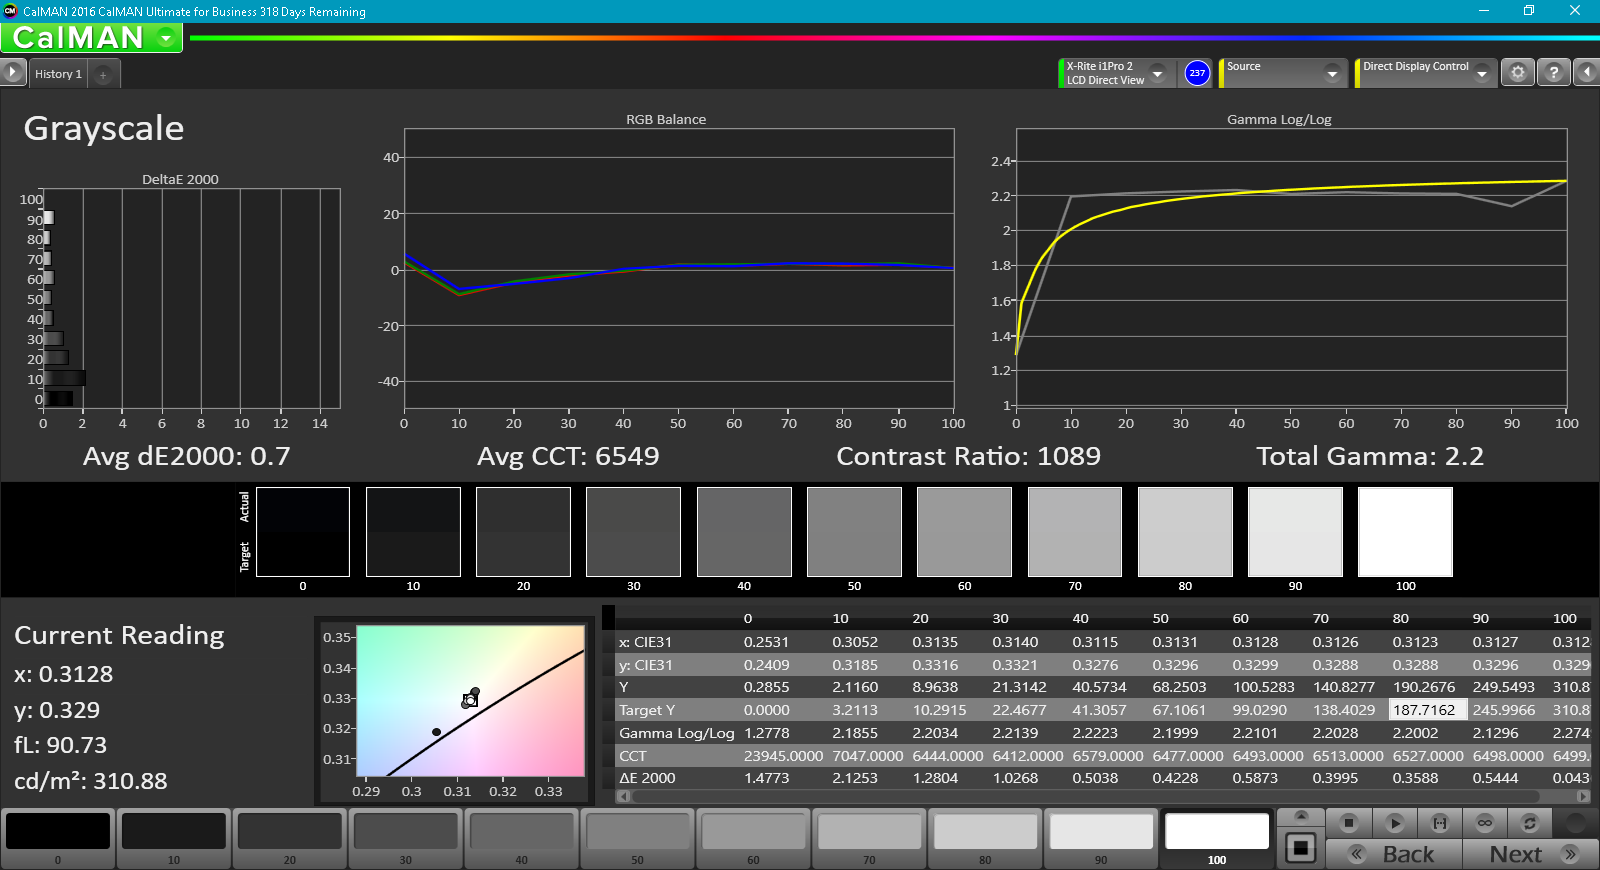
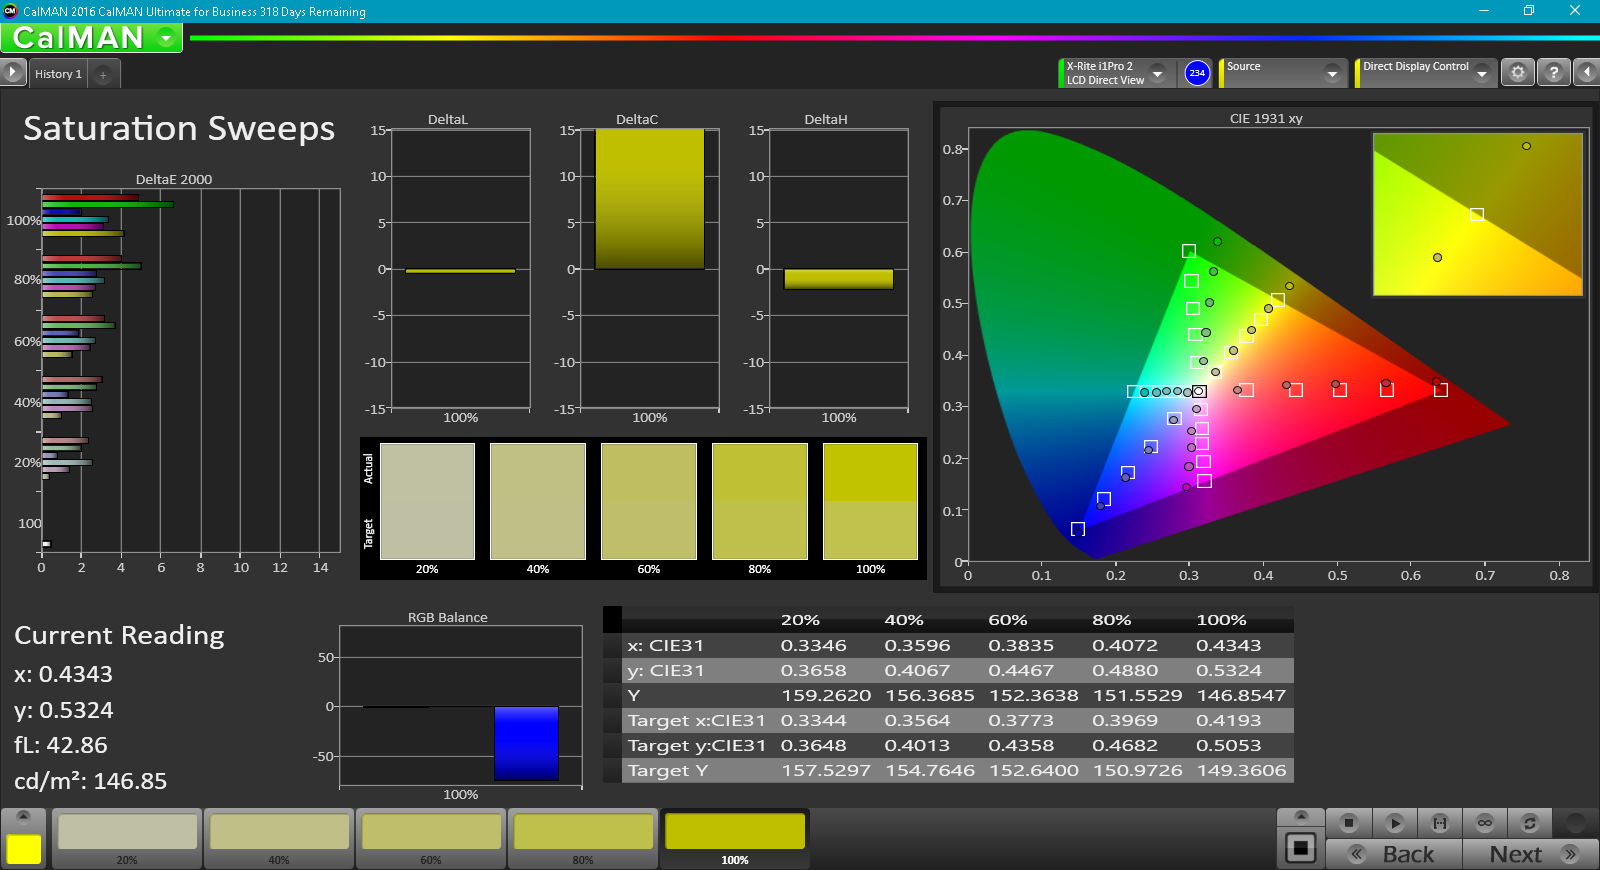
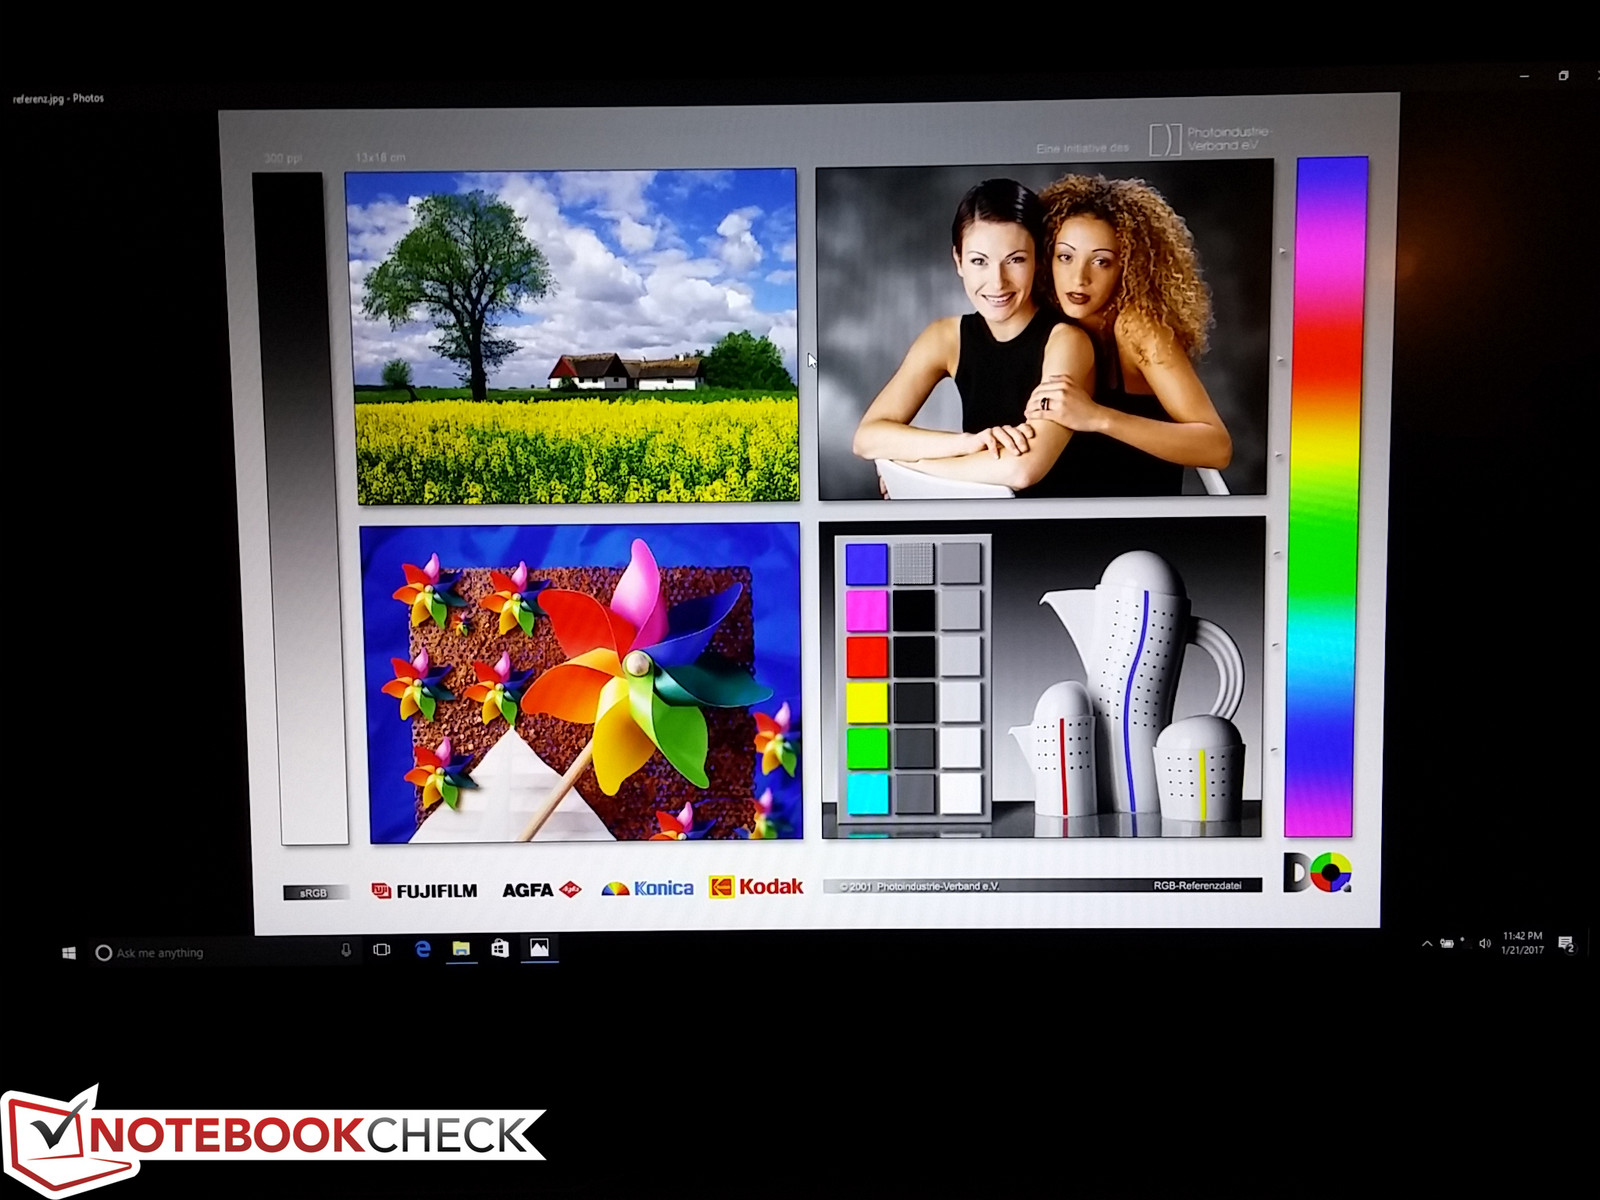
Further display measurements with a X-Rite spectrophotometer reveal good colors and grayscale out of the box. A calibration improves both with a flatter RGB balance and a cleaner grayscale DeltaE distribution. Colors become progressively less accurate the higher the saturation level due to imperfect sRGB coverage.
Display Response Times
| ↔ Response Time Black to White | ||
|---|---|---|
| 32.8 ms ... rise ↗ and fall ↘ combined | ↗ 6 ms rise | 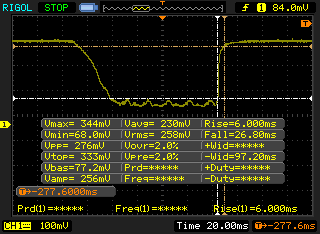 |
| ↘ 26.8 ms fall | ||
| The screen shows slow response rates in our tests and will be unsatisfactory for gamers. In comparison, all tested devices range from 0.1 (minimum) to 240 (maximum) ms. » 87 % of all devices are better. This means that the measured response time is worse than the average of all tested devices (21.5 ms). | ||
| ↔ Response Time 50% Grey to 80% Grey | ||
| 42 ms ... rise ↗ and fall ↘ combined | ↗ 19.2 ms rise | 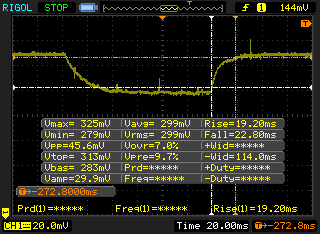 |
| ↘ 22.8 ms fall | ||
| The screen shows slow response rates in our tests and will be unsatisfactory for gamers. In comparison, all tested devices range from 0.2 (minimum) to 636 (maximum) ms. » 63 % of all devices are better. This means that the measured response time is worse than the average of all tested devices (33.7 ms). | ||
Screen Flickering / PWM (Pulse-Width Modulation)
| Screen flickering / PWM not detected | 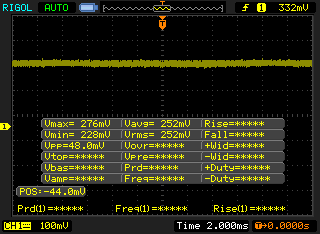 | ||
In comparison: 53 % of all tested devices do not use PWM to dim the display. If PWM was detected, an average of 17915 (minimum: 5 - maximum: 3846000) Hz was measured. | |||
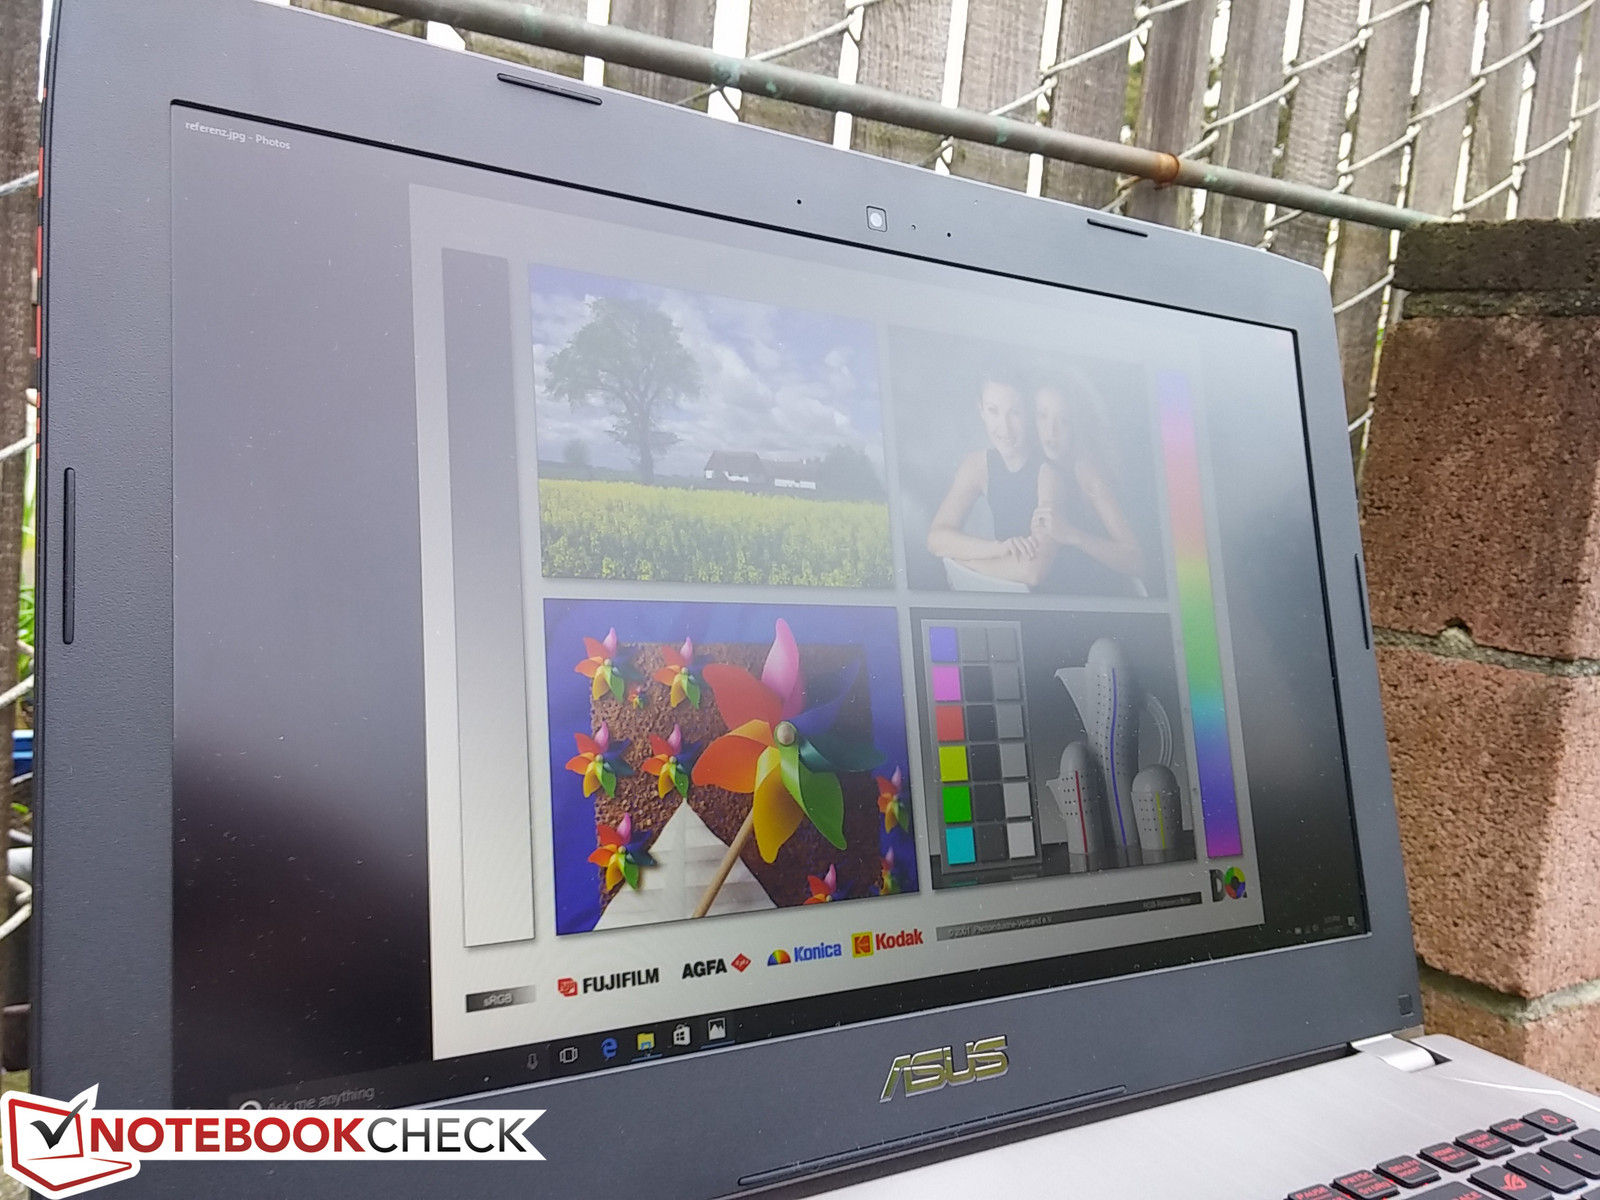
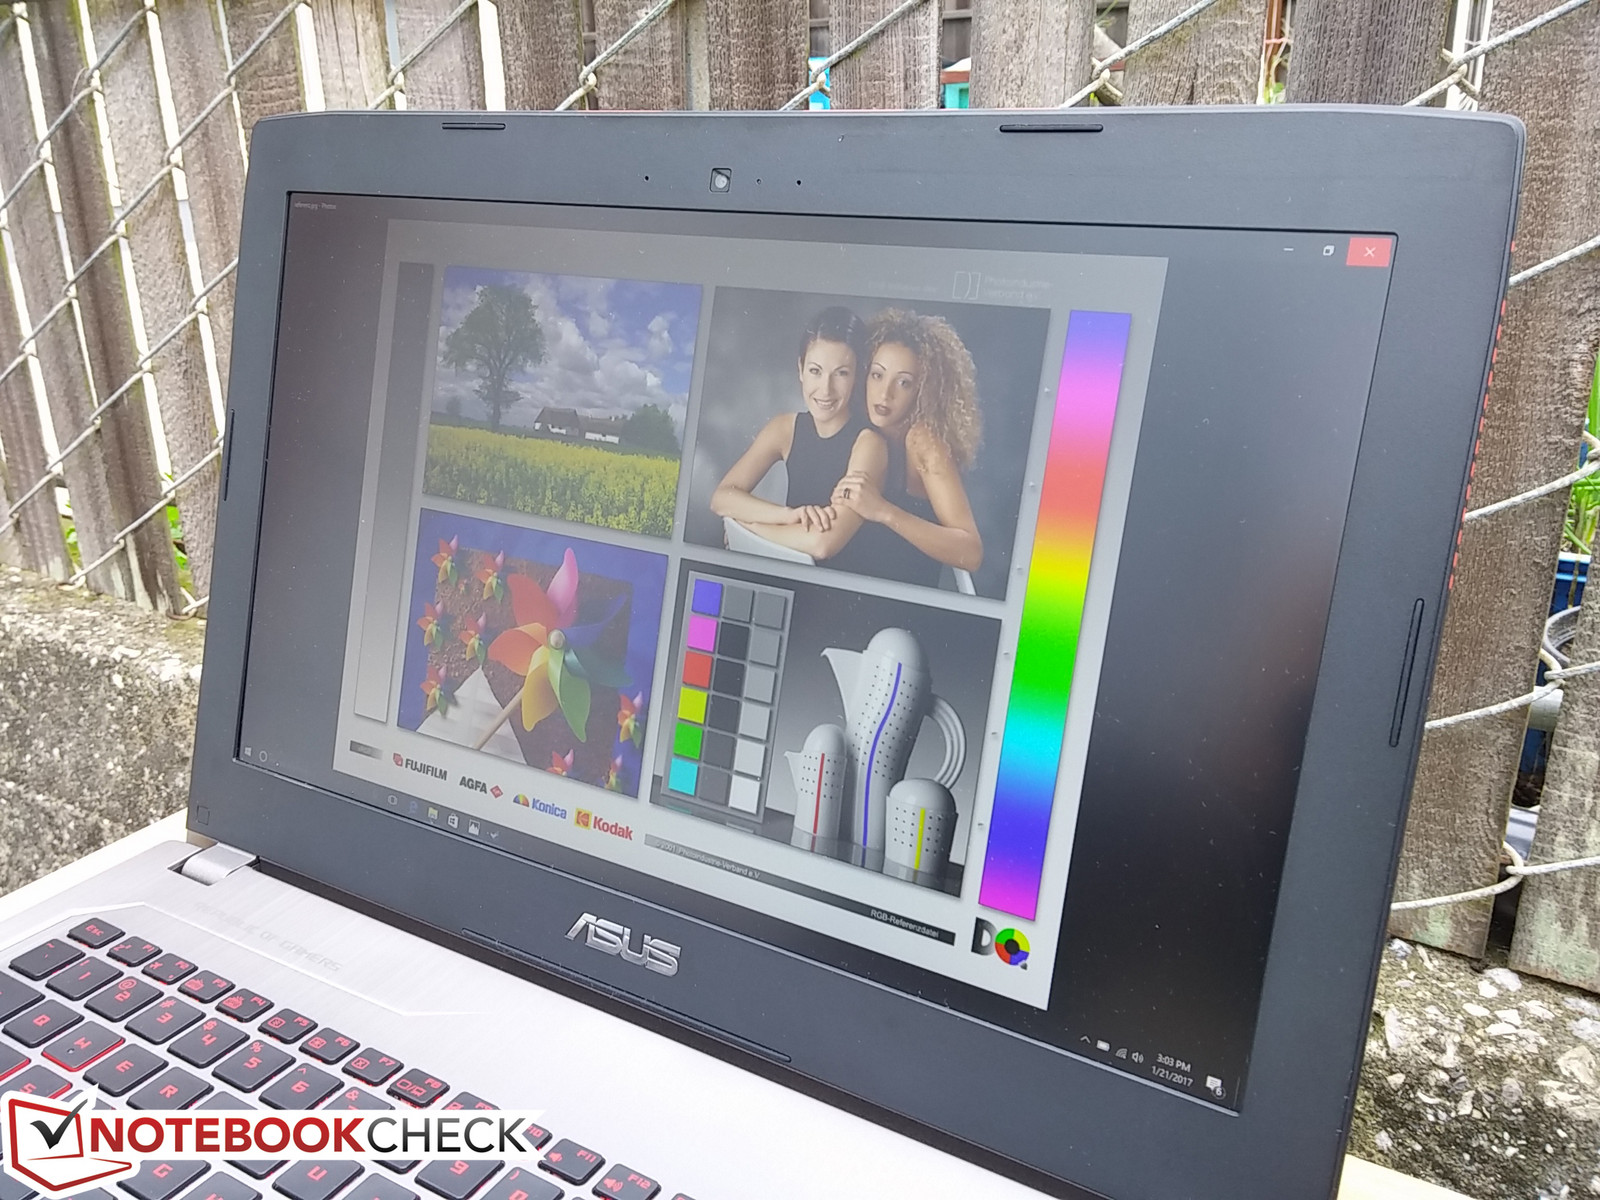
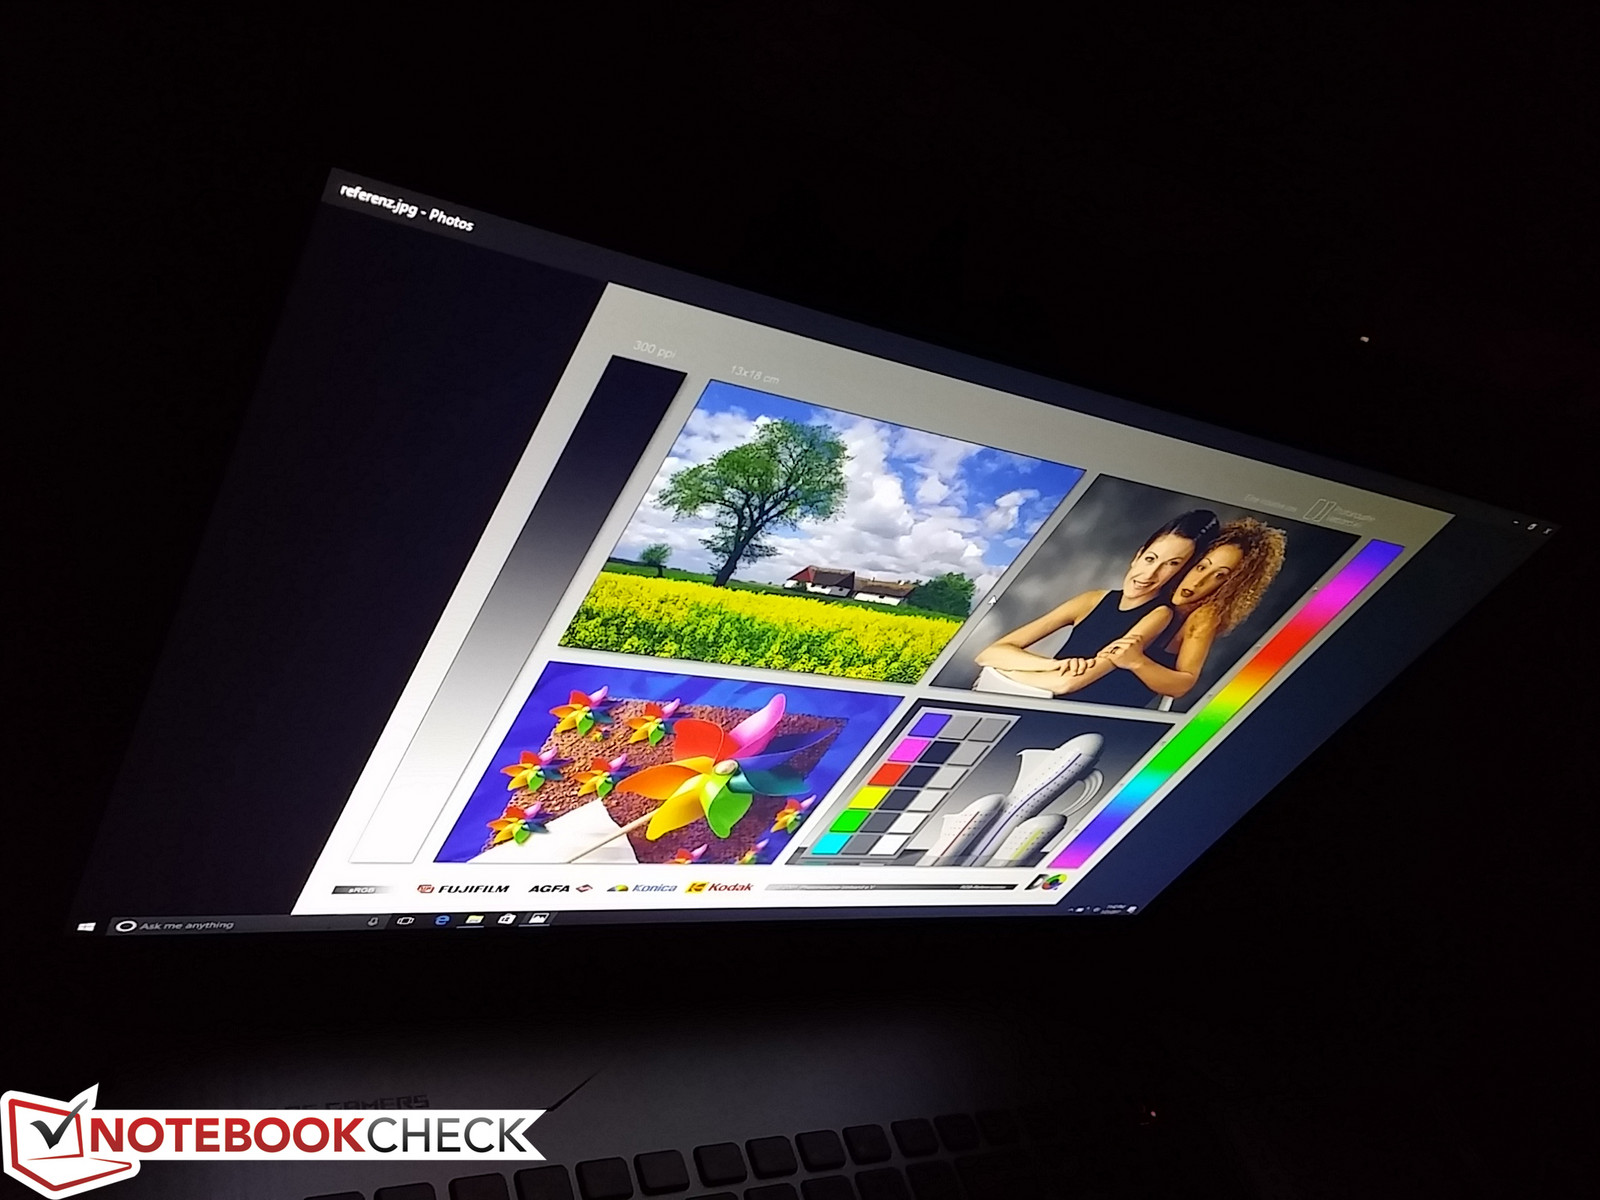
Outdoor visibility is average on a cloudy or overcast day due to the wide viewing angles of the IPS panel and the decent 300-nit backlight. Brighter ambient lighting or direct sunlight will wash out colors and make onscreen text and images difficult to see. Viewing too far off angle will see just slight variations in contrast and apparent brightness.
Performance
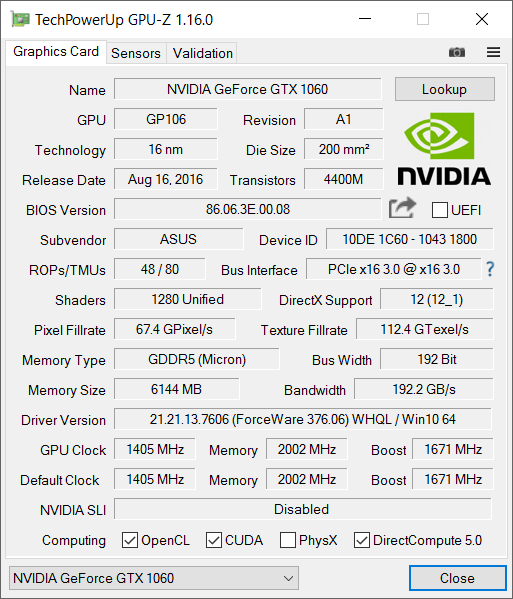
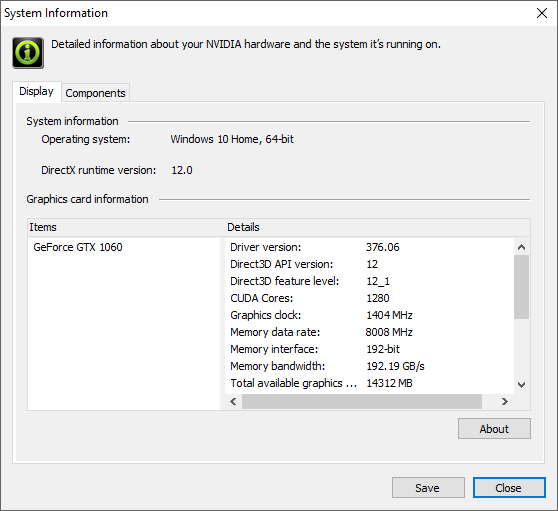
The i7-7700HQ replaces the i7-6700HQ and i7-5700HQ that are both very commonly found on high-end gaming notebooks. The CPU and GTX 1060 GPU are soldered onto the motherboard and not upgradeable, so SKU options are more limited especially when compared to barebone systems. SKUs with the much more powerful GTX 1070, however, are also available on the GL502 series albeit in the larger GL502VY form factor.
Nvidia G-Sync comes standard with the series to reduce screen-tearing. As a result, there are no Optimus options for switching to the integrated HD Graphics 630.
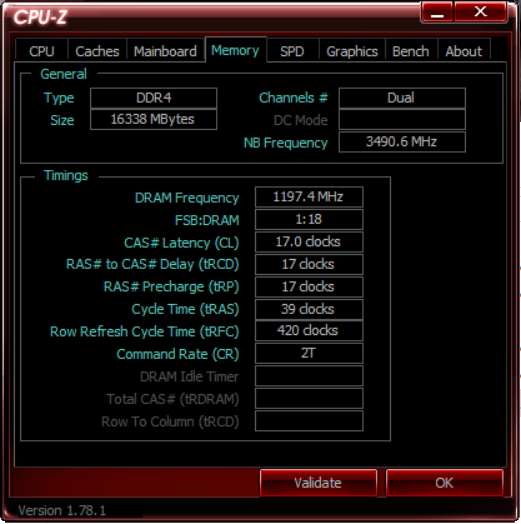
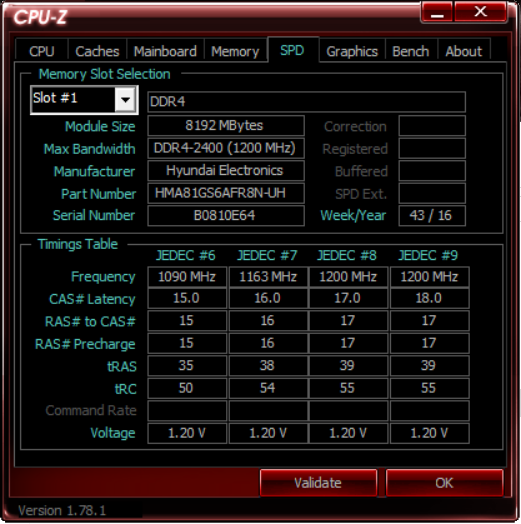
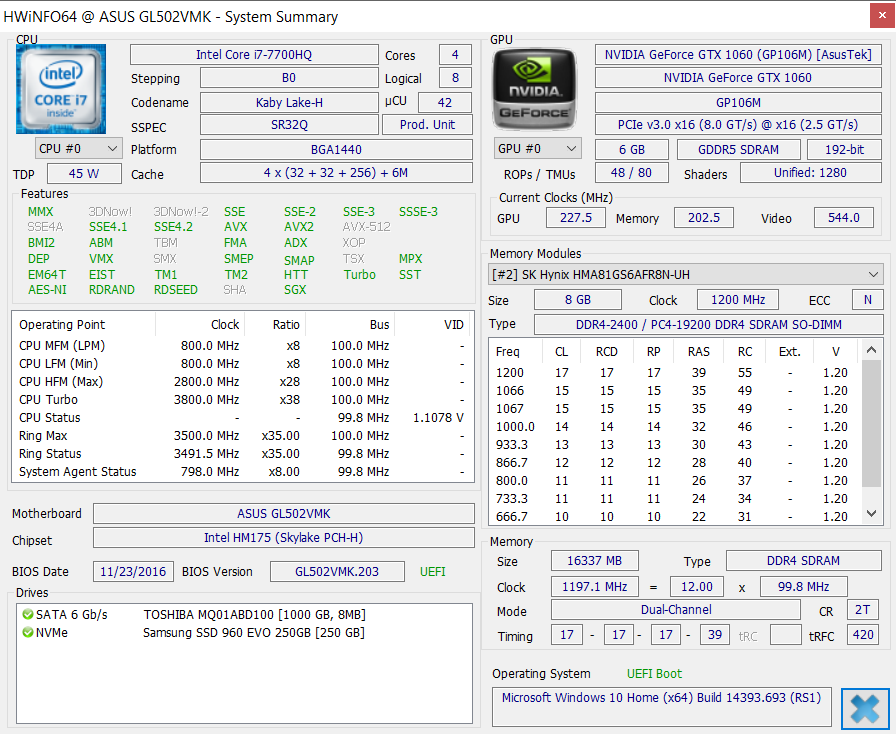
8 GB of DDR4 RAM is soldered onto the motherboard with a single SODIMM slot for expansion for up to 24 GB total.
Processor
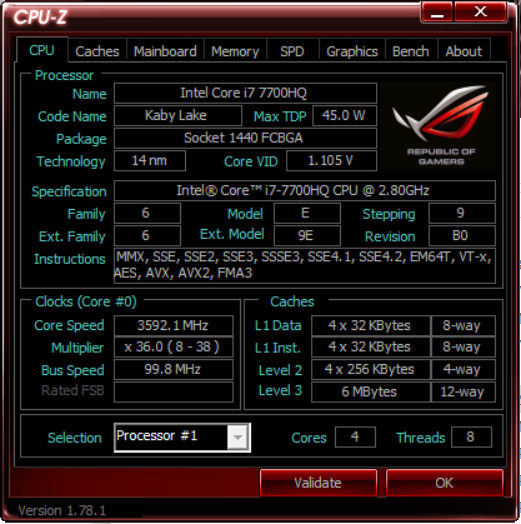
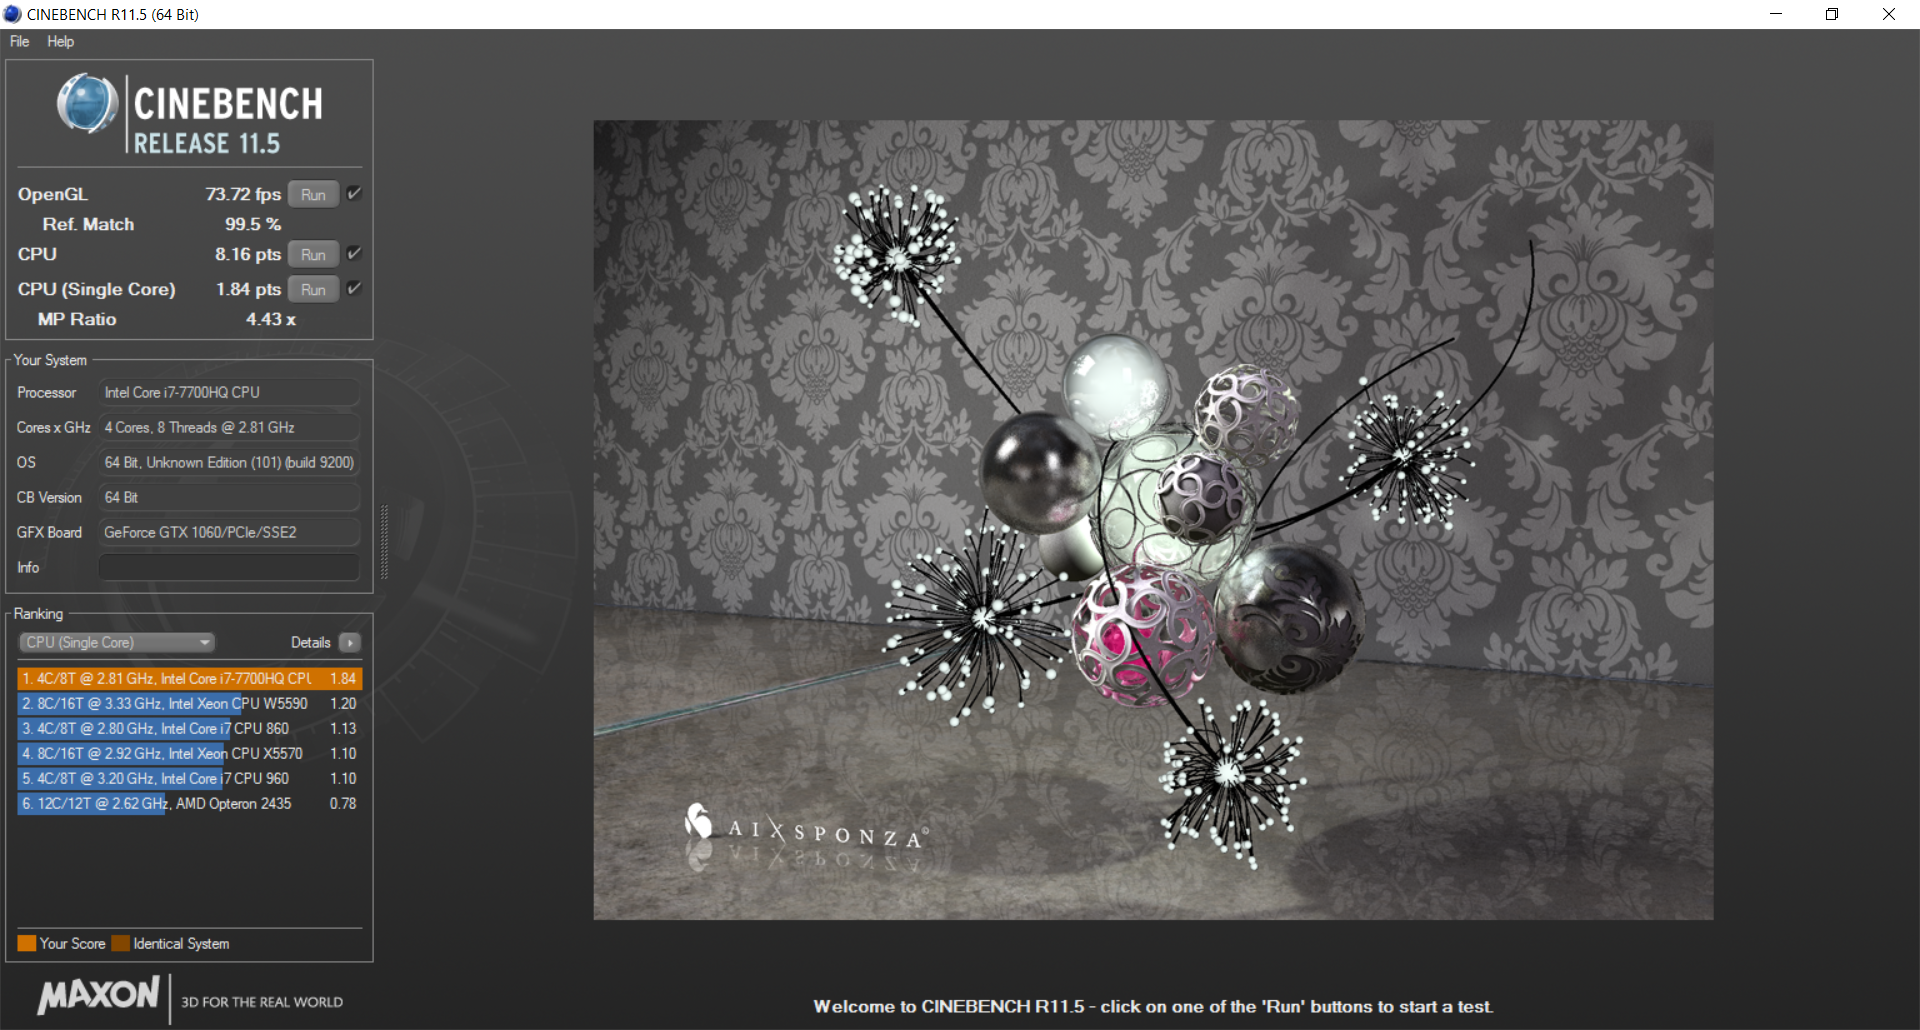
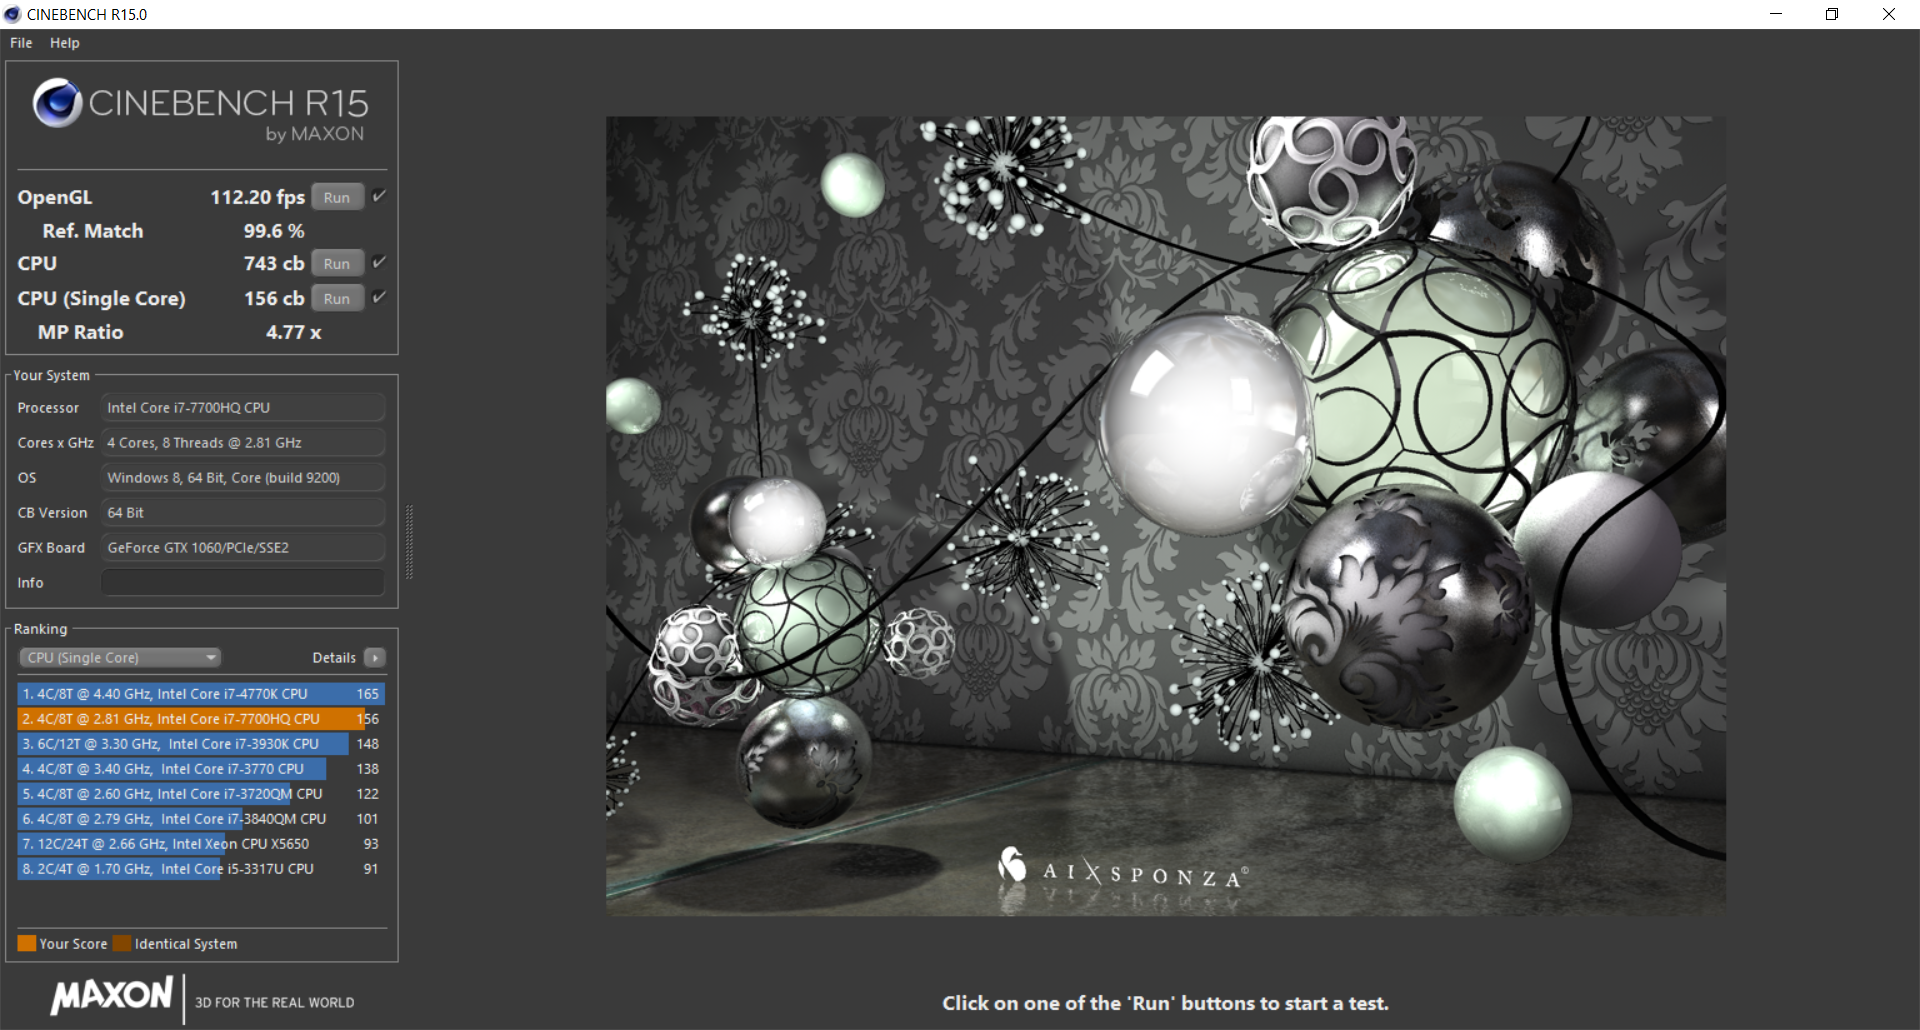
CineBench benchmarks rank the Kaby Lake i7-7700HQ 10 percent and 16 percent ahead of the Skylake i7-6700HQ in multi-threaded and single-threaded workloads, respectively. The i7-7700HQ runs at a faster 2.8 GHz base clock rate and 3.3 GHz Turbo Boost compared to 2.6 GHz and 3.1 GHz on the i7-6700HQ. Raw performance is above the overclockable i7-6820HK at base clock rates and very close to the desktop i7-6700K.
See our dedicated CPU page on the Core i7-7700HQ for more technical information and benchmark comparisons.
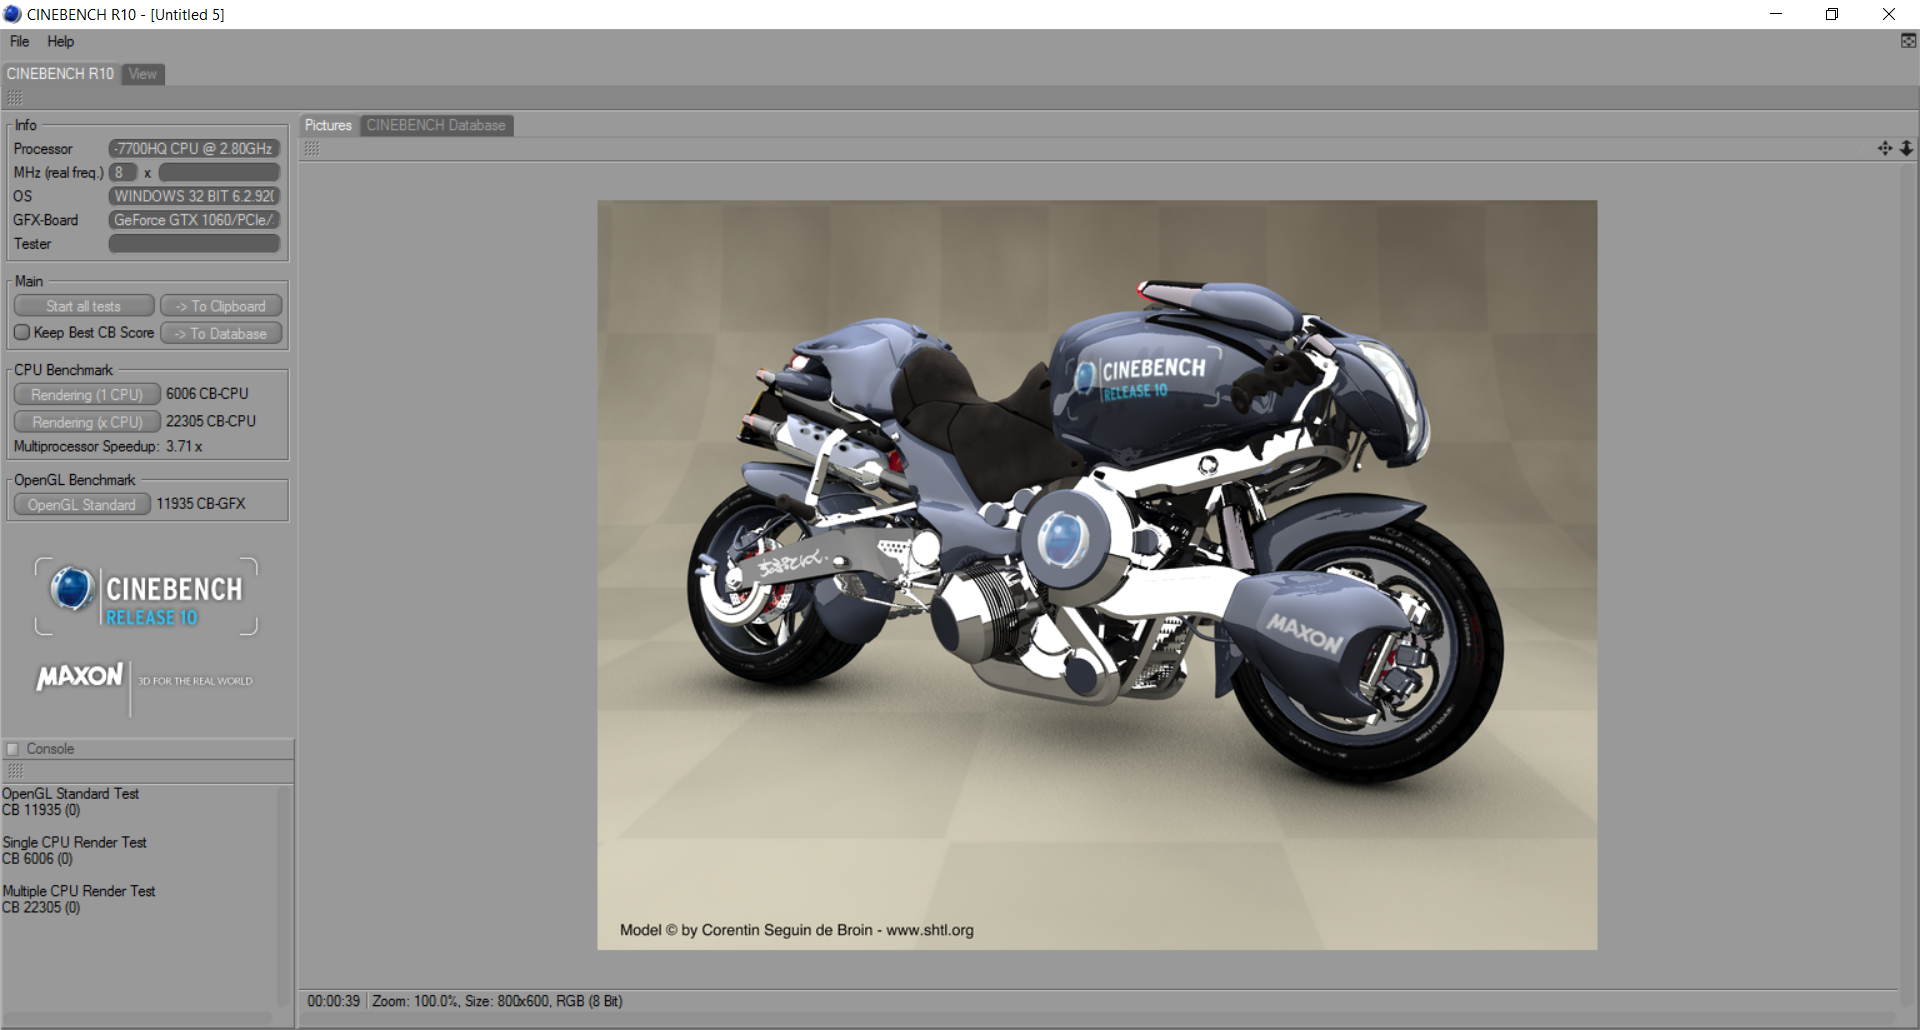
| Cinebench R10 | |
| Rendering Multiple CPUs 32Bit | |
| DogHouse Systems Mobius SS | |
| Asus Strix GL502VM-DS74 | |
| EVGA SC17 GTX 1070 | |
| Asus GL702VM-GC102D | |
| MSI GP62-2QEi781FD | |
| Rendering Single 32Bit | |
| DogHouse Systems Mobius SS | |
| Asus Strix GL502VM-DS74 | |
| EVGA SC17 GTX 1070 | |
| MSI GP62-2QEi781FD | |
| Asus GL702VM-GC102D | |
| wPrime 2.10 - 1024m | |
| EVGA SC17 GTX 1070 | |
| Asus Strix GL502VM-DS74 | |
| MSI GP62-2QEi781FD | |
| DogHouse Systems Mobius SS | |
| Super Pi Mod 1.5 XS 32M - 32M | |
| EVGA SC17 GTX 1070 | |
| MSI GP62-2QEi781FD | |
| Asus Strix GL502VM-DS74 | |
| DogHouse Systems Mobius SS | |
* ... smaller is better
System Performance
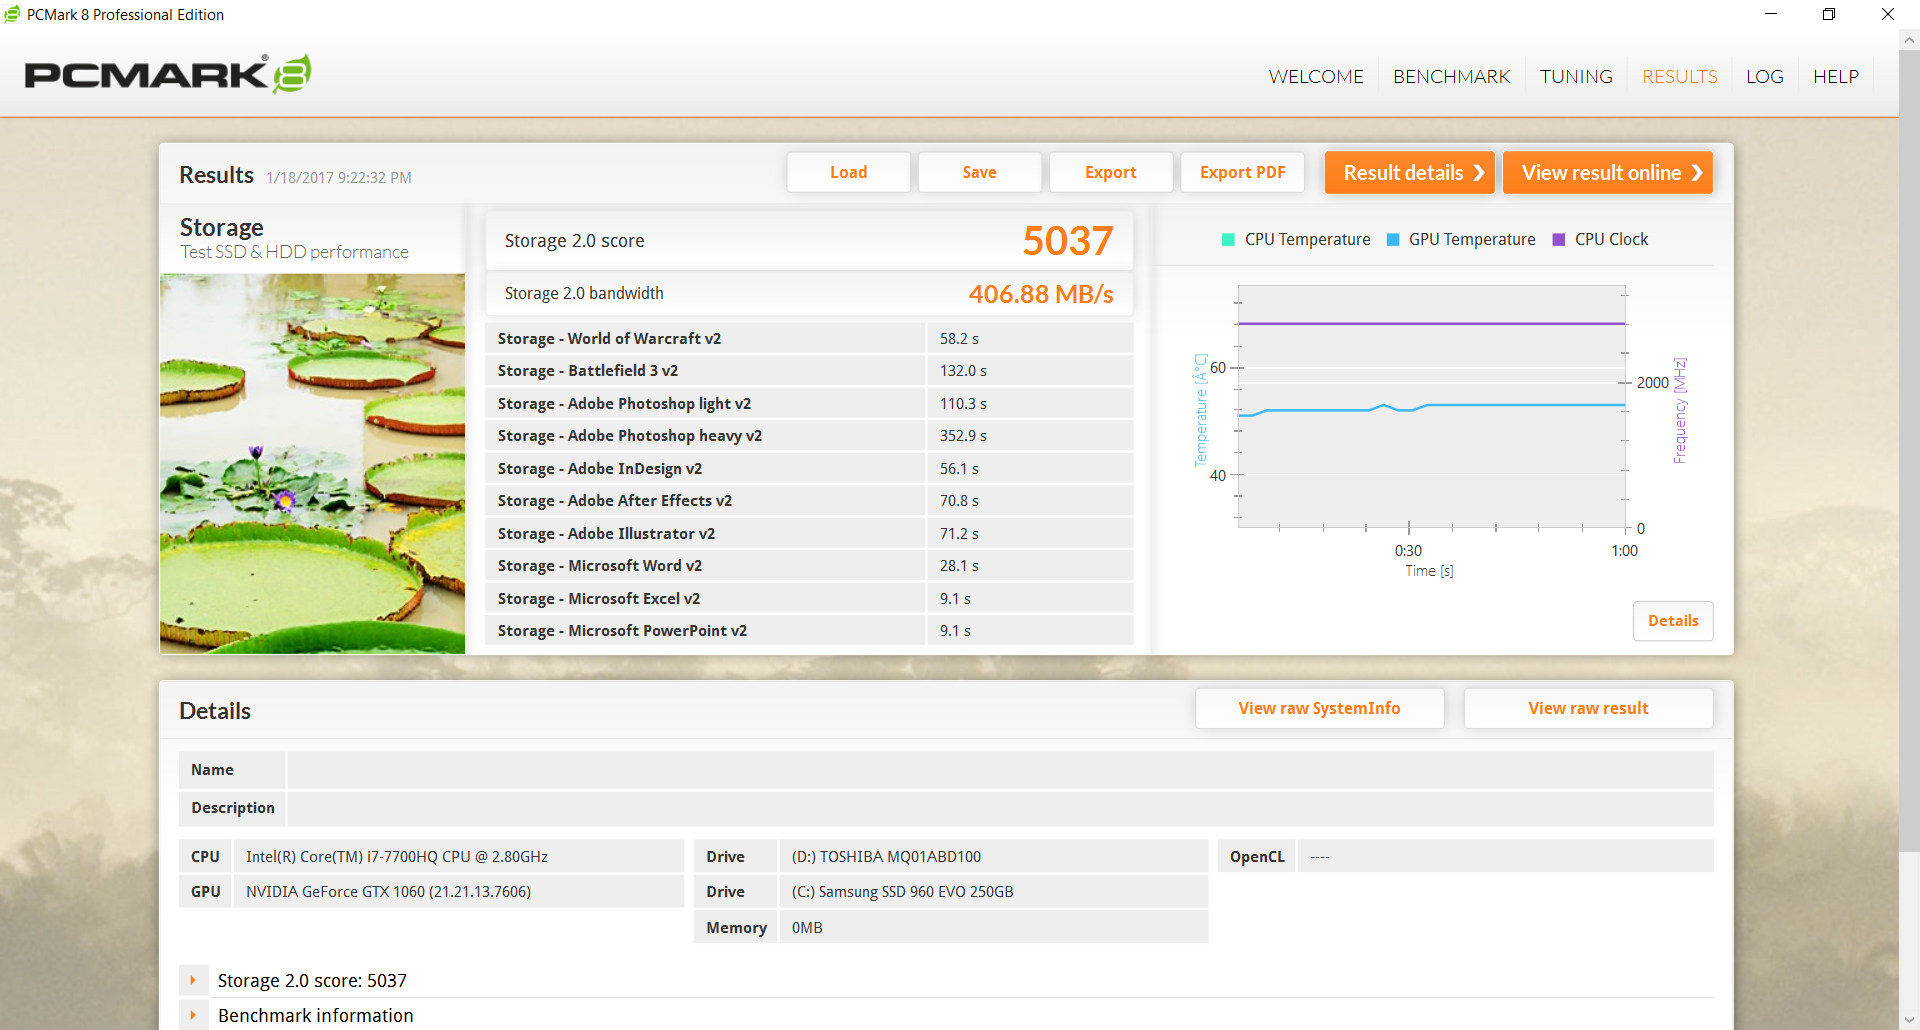
PCMark scores are high and very similar to other high-end gaming notebooks with Pascal GPUs like the Acer Predator 15. Our SKU also outscores our previous GL502VM likely due to the slightly faster Kaby Lake CPU and the NVMe SSD whereas our first unit was equipped with a SATA III SSD only.
Subjectively, the system was very responsive during testing and we experienced no notable issues related to software.
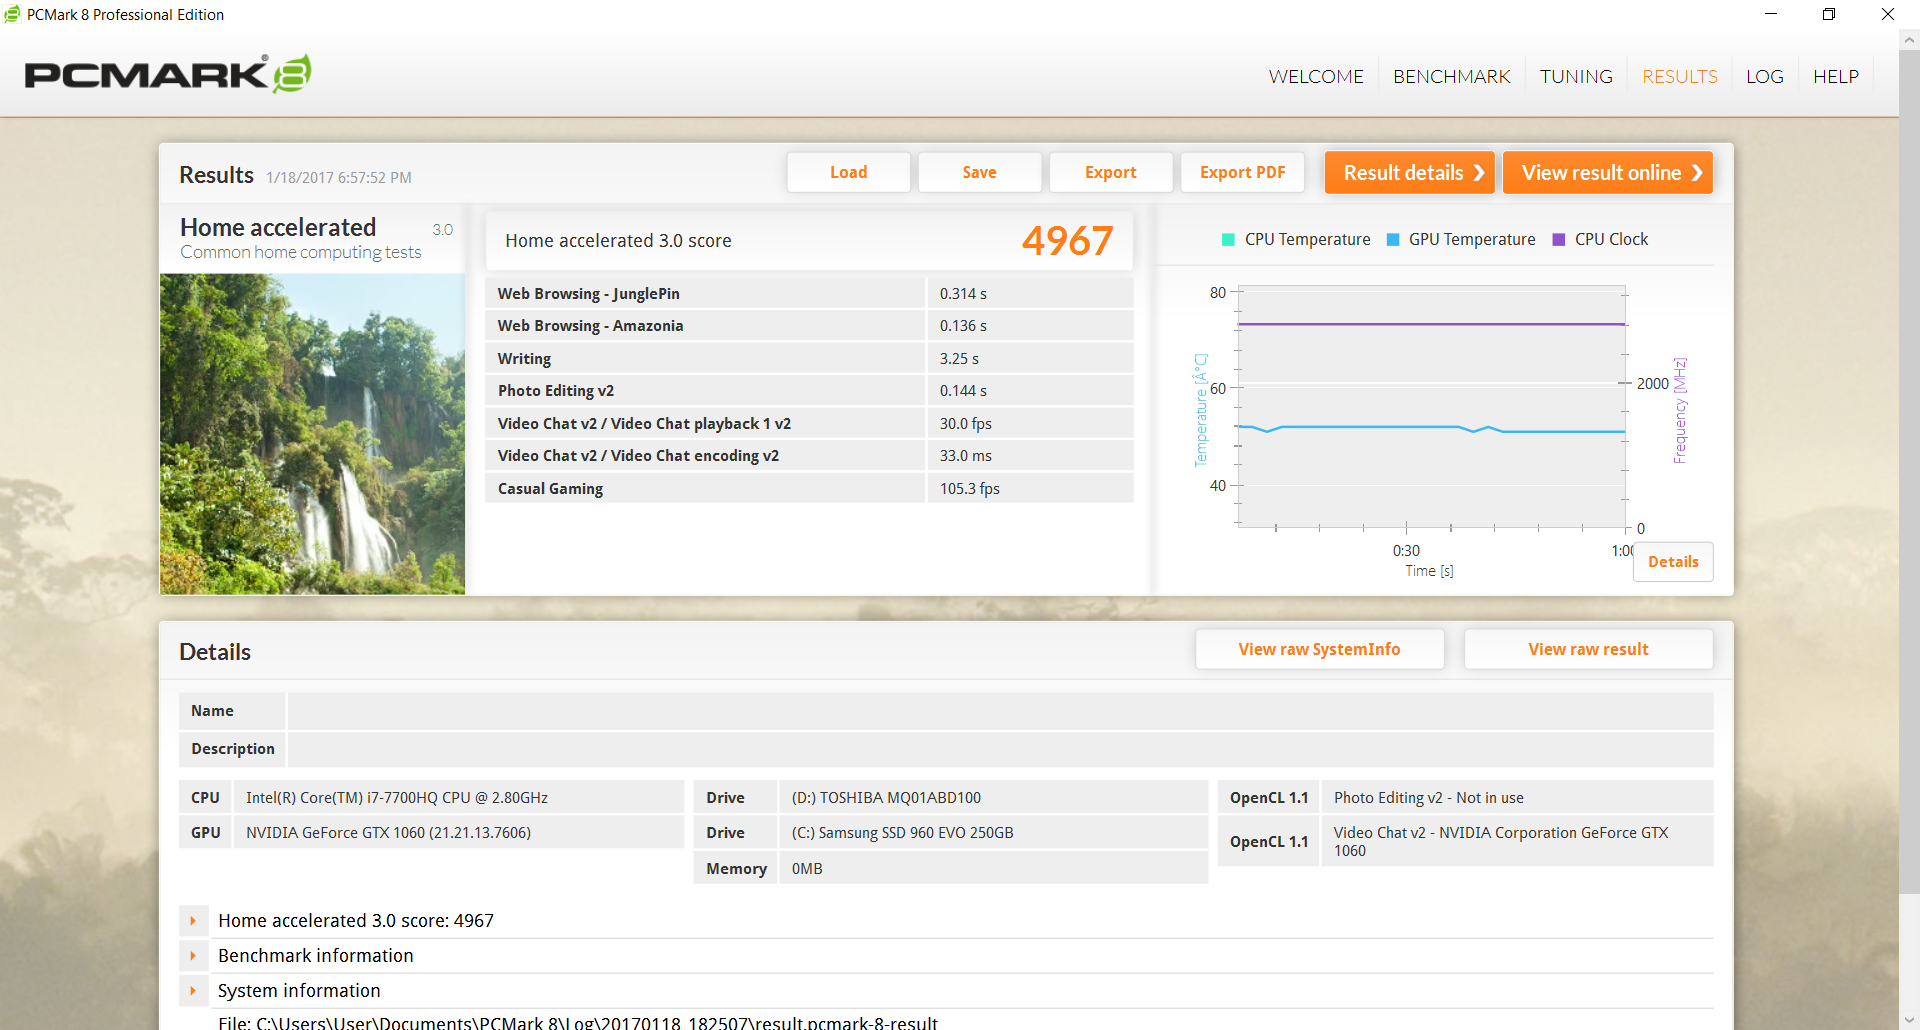
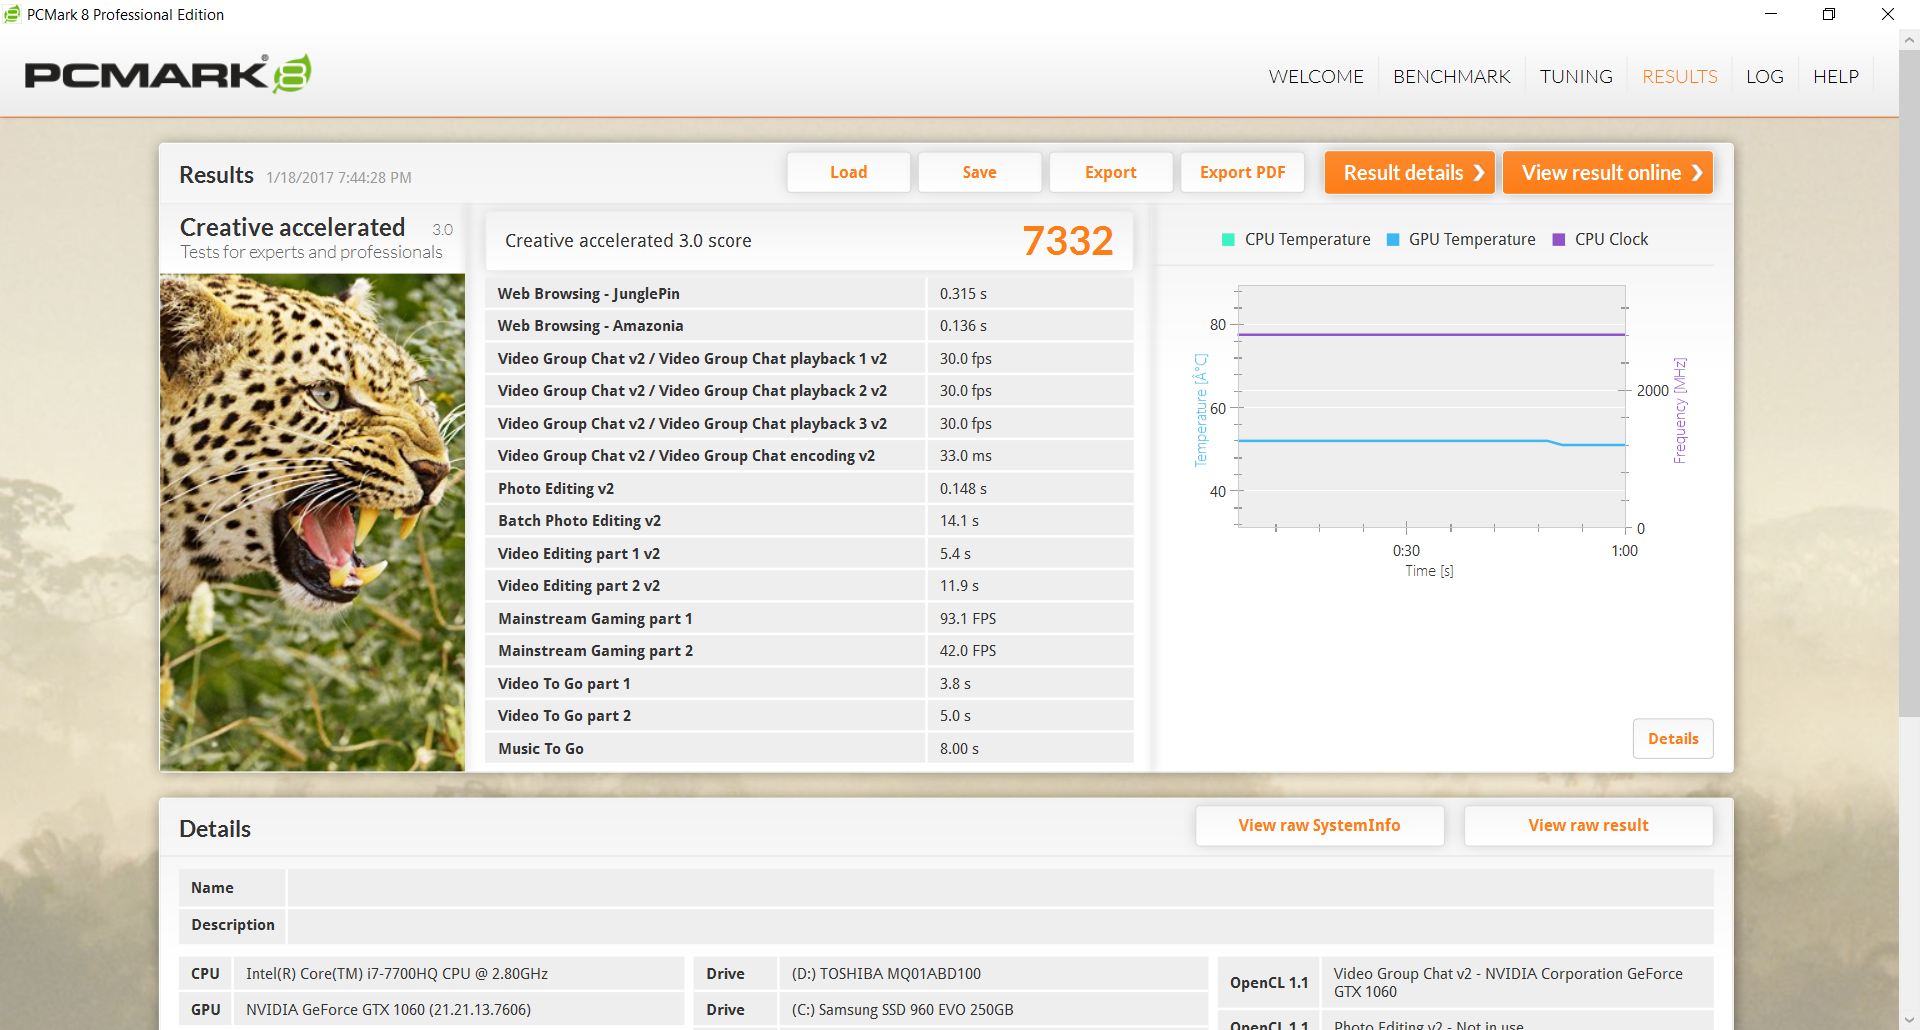
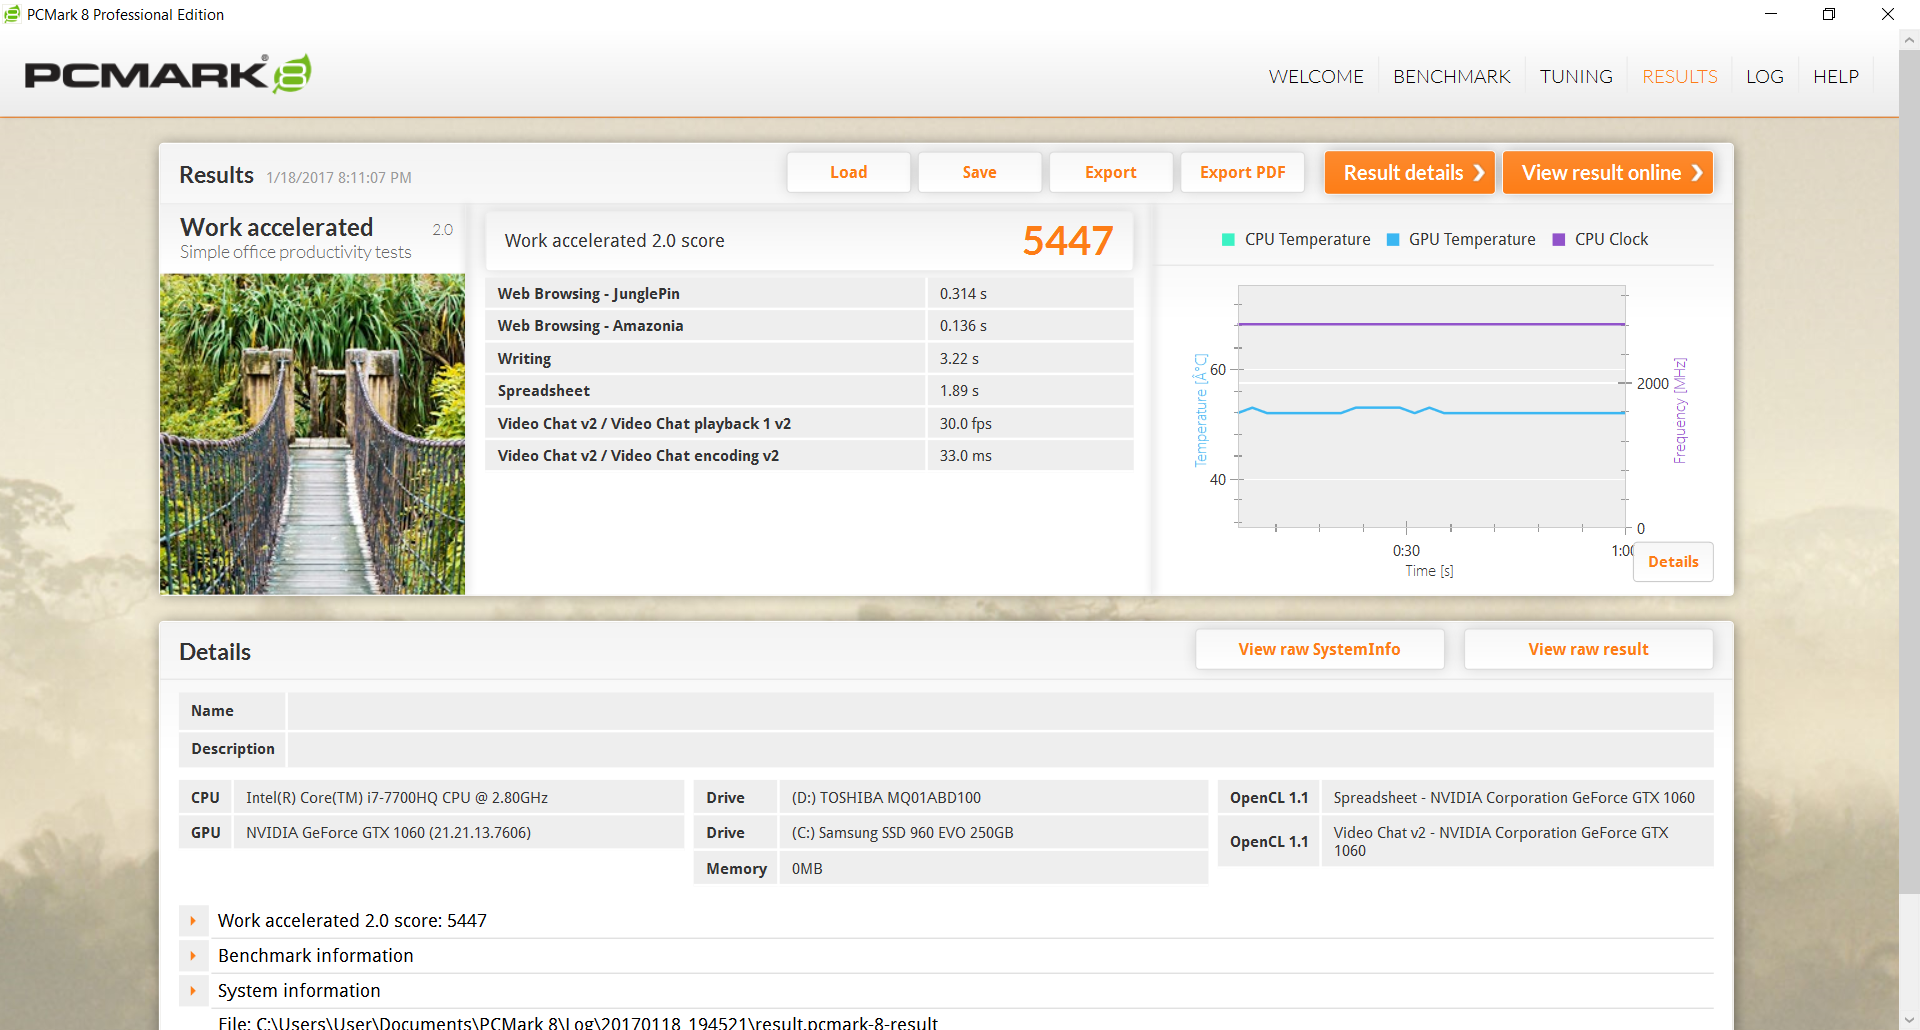
| PCMark 8 Home Score Accelerated v2 | 4967 points | |
| PCMark 8 Creative Score Accelerated v2 | 7332 points | |
| PCMark 8 Work Score Accelerated v2 | 5447 points | |
Help | ||
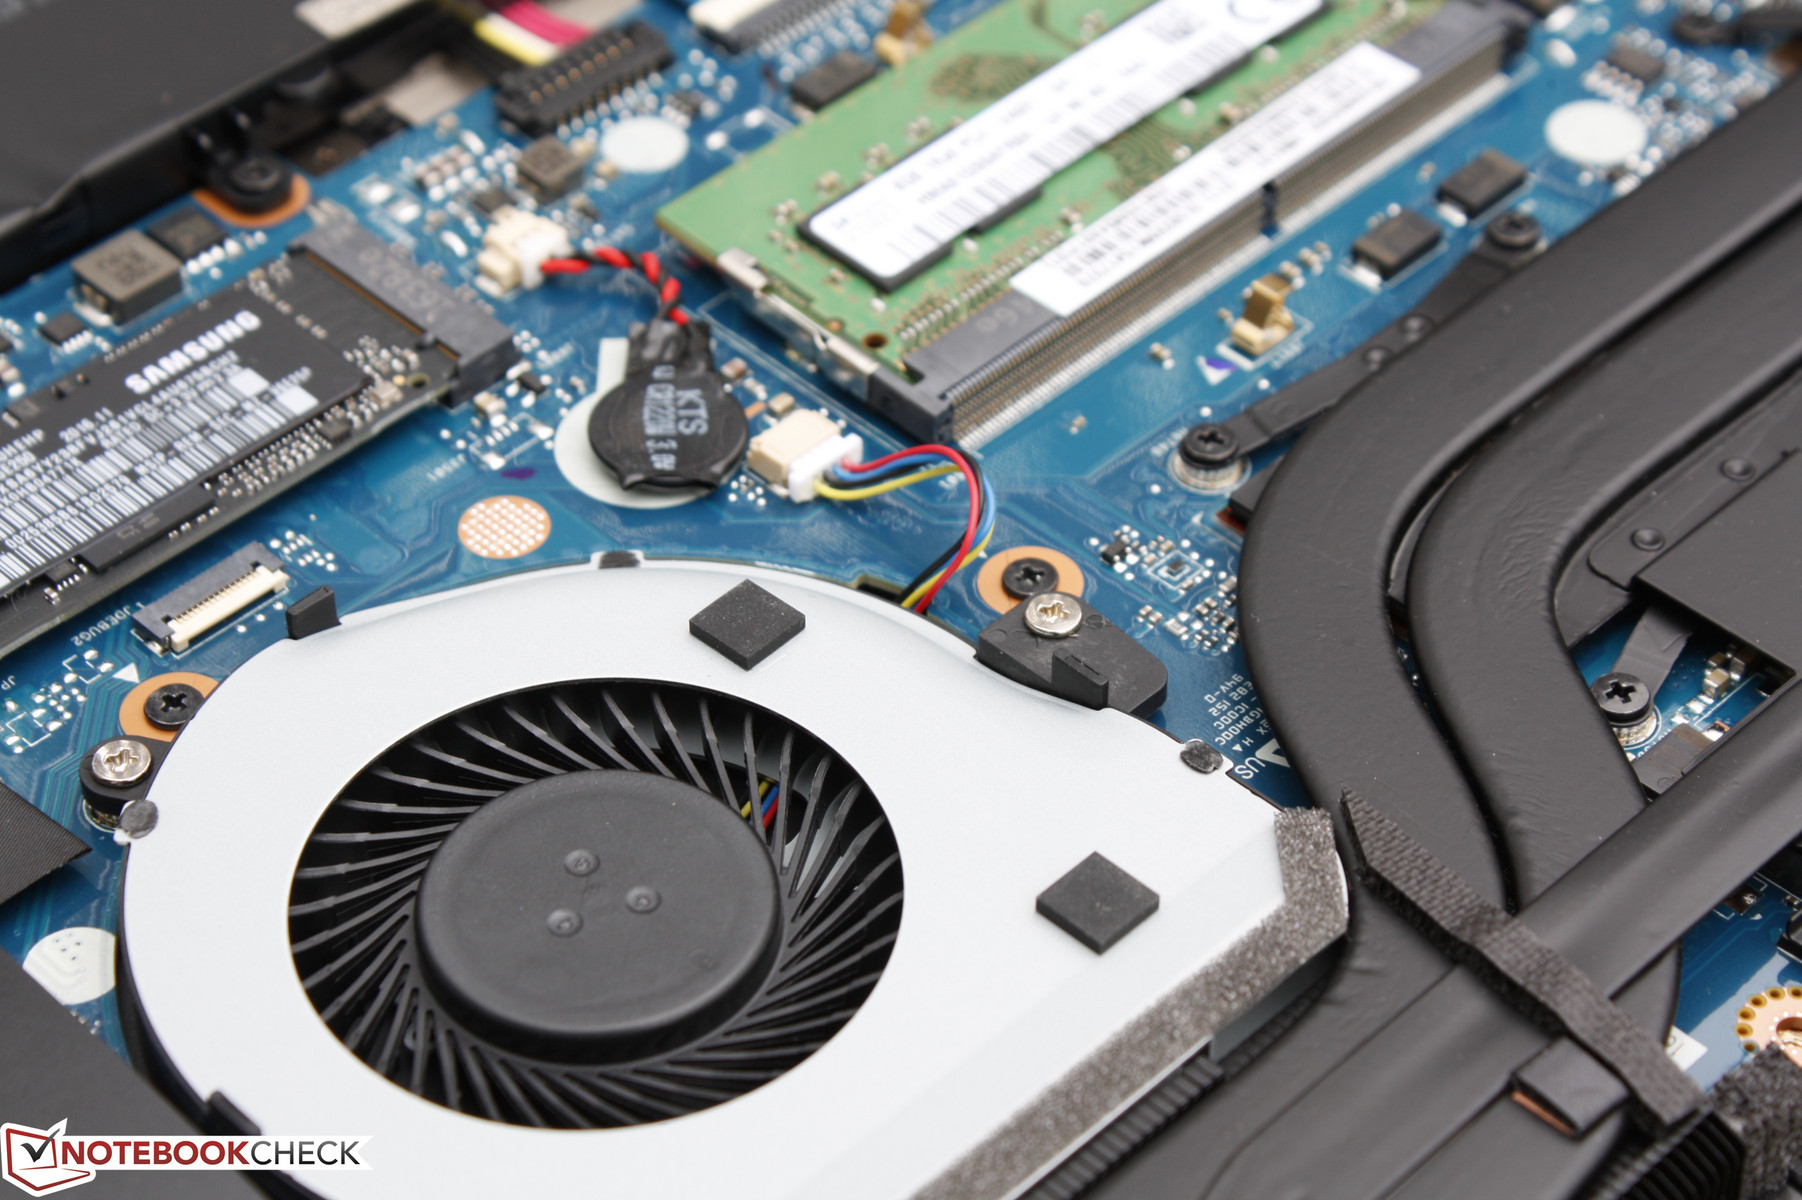
Storage Devices
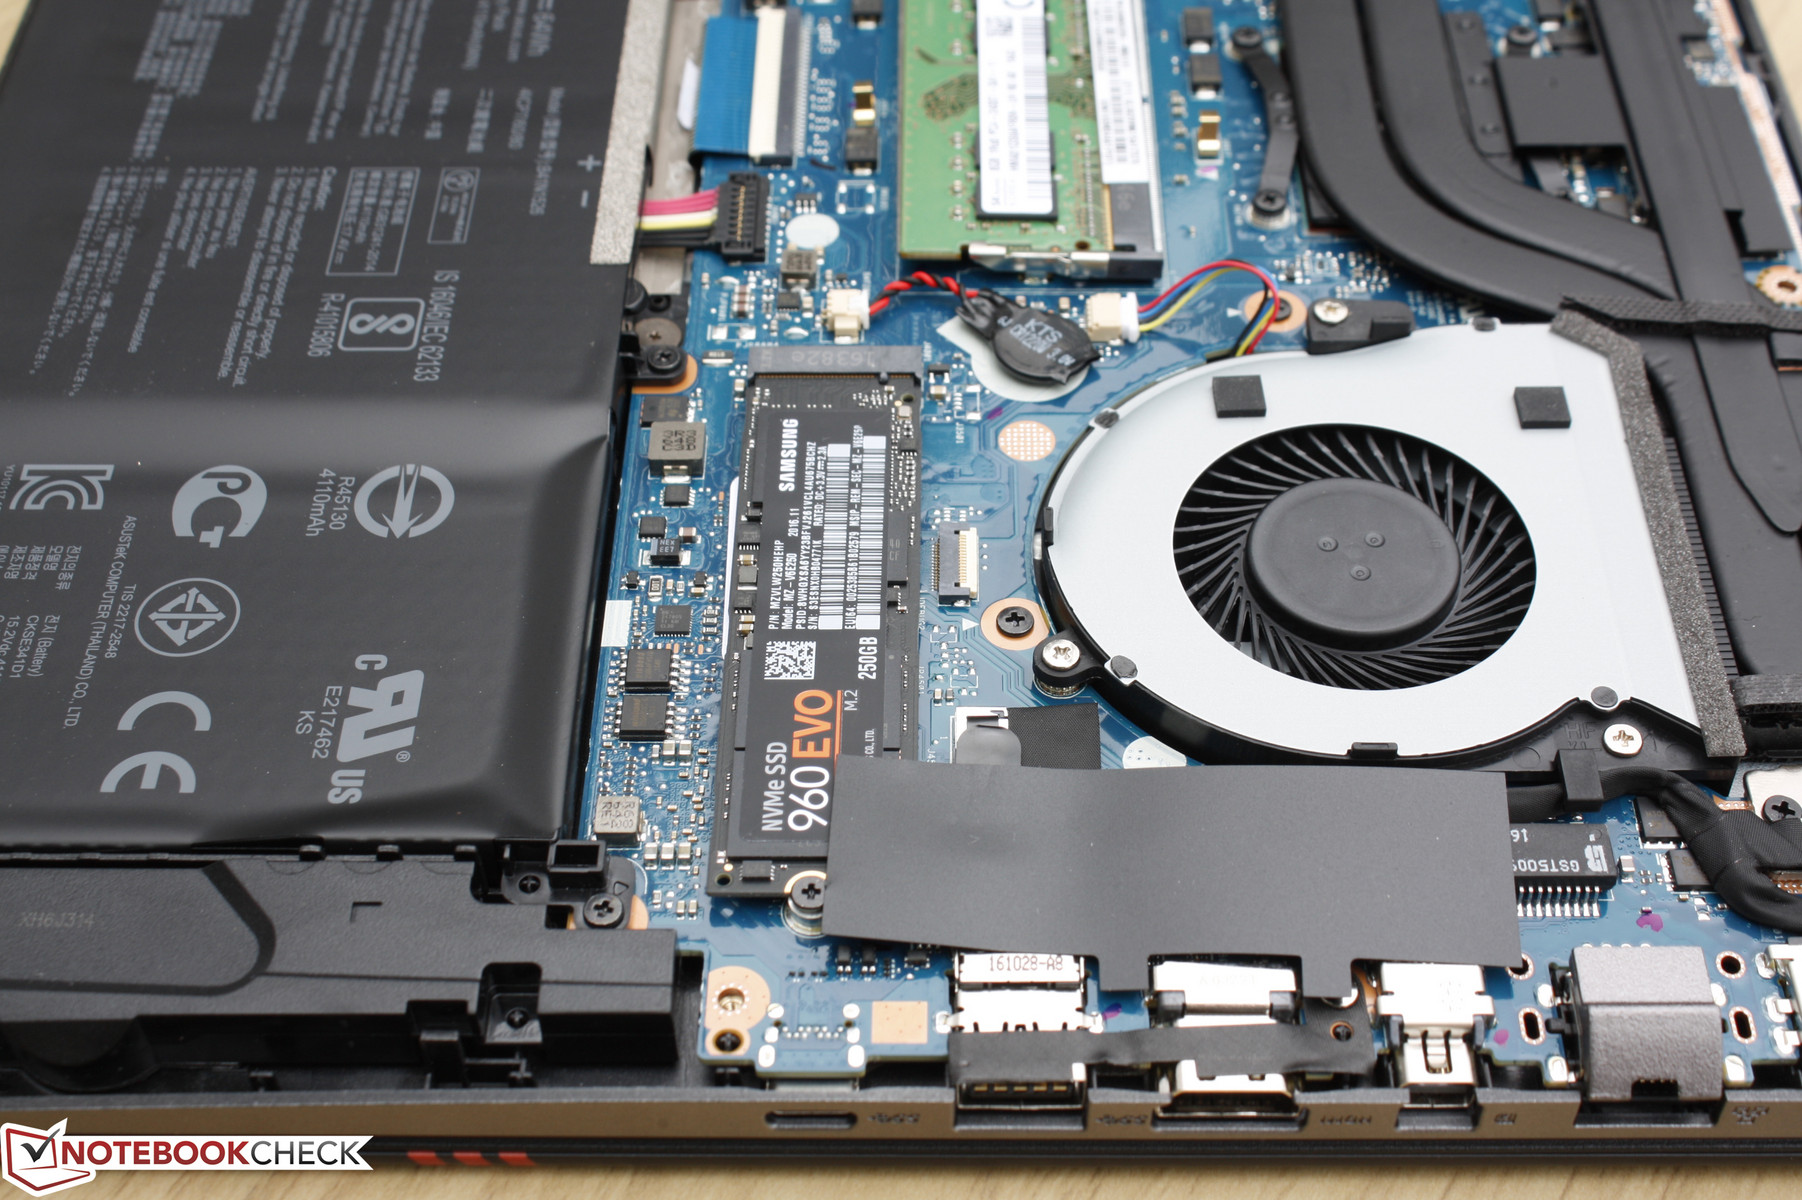
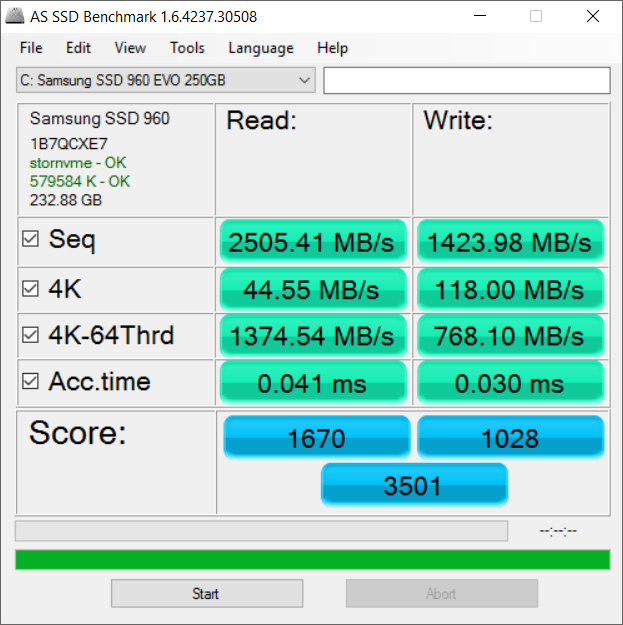
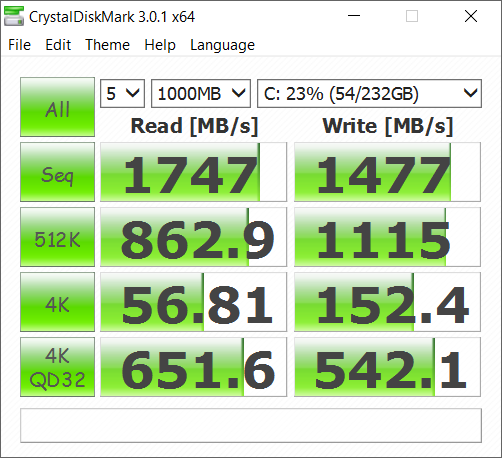
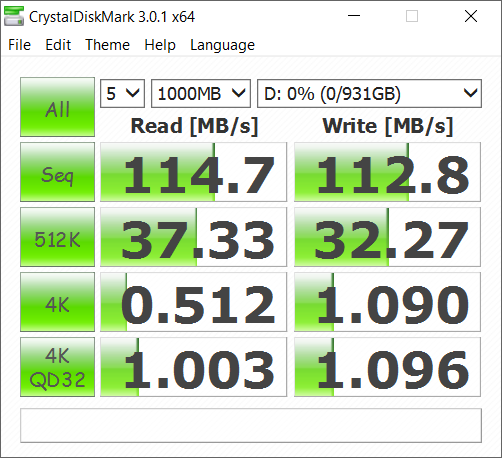
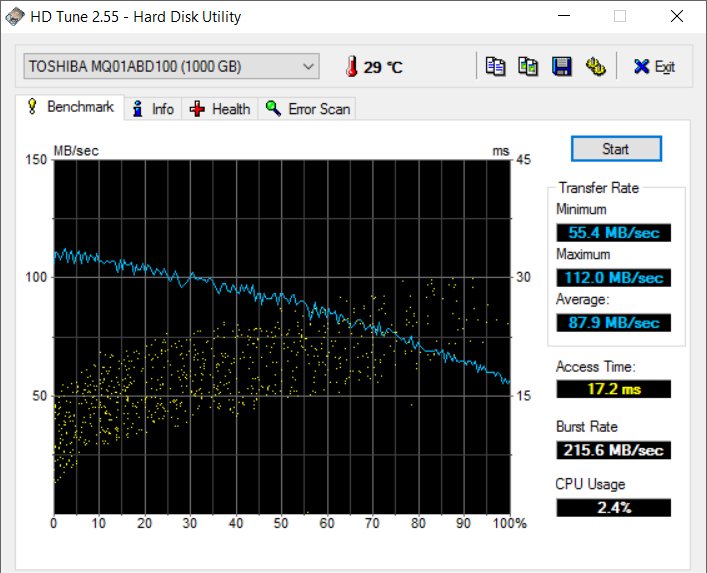
A total of two internal storage bays are available with the M.2 2280 NVMe slot and the 2.5-inch SATA III bay. Our test unit is equipped with a primary 250 GB NVMe Samsung SSD 960 EVO and a secondary 1 TB Toshiba HDD. RAID configurations are not supported on the GL502VM.
AS SSD and CrystalDiskMark results show the NVMe SSD performing as expected with sequential read and write rates each averaging about 1600 MB/s. In comparison, SSDs limited by the SATA III interface are just a fraction of the speed at up to about 500 MB/s on the same benchmark tests.
See our table of SSDs and HDDs for more benchmark comparisons.
| Asus Strix GL502VM-DS74 Samsung SSD 960 Evo 250GB m.2 NVMe | MSI GL62-6QFi781H11 Toshiba HG6 THNSNJ128G8NY | Eurocom Tornado F5 Samsung SSD 960 Pro 512 GB m.2 | Acer Predator 15 G9-593-765Q LiteOn CV1-8B512 | MSI GS63VR-6RF16H22 Stealth Pro Samsung SM951 MZVPV256HDGL m.2 PCI-e | |
|---|---|---|---|---|---|
| CrystalDiskMark 3.0 | -61% | 7% | -58% | -0% | |
| Read Seq | 1747 | 530 -70% | 2145 23% | 517 -70% | 1973 13% |
| Write Seq | 1477 | 442.7 -70% | 1724 17% | 449.7 -70% | 1292 -13% |
| Read 512 | 863 | 409.1 -53% | 715 -17% | 355.3 -59% | 1279 48% |
| Write 512 | 1115 | 417.3 -63% | 967 -13% | 433.7 -61% | 1288 16% |
| Read 4k | 56.8 | 21.81 -62% | 55.9 -2% | 27.69 -51% | 52.3 -8% |
| Write 4k | 152.4 | 93 -39% | 180.6 19% | 72.9 -52% | 153.2 1% |
| Read 4k QD32 | 652 | 257 -61% | 744 14% | 290.9 -55% | 464.4 -29% |
| Write 4k QD32 | 542 | 168.3 -69% | 634 17% | 273.8 -49% | 384.4 -29% |

GPU Performance
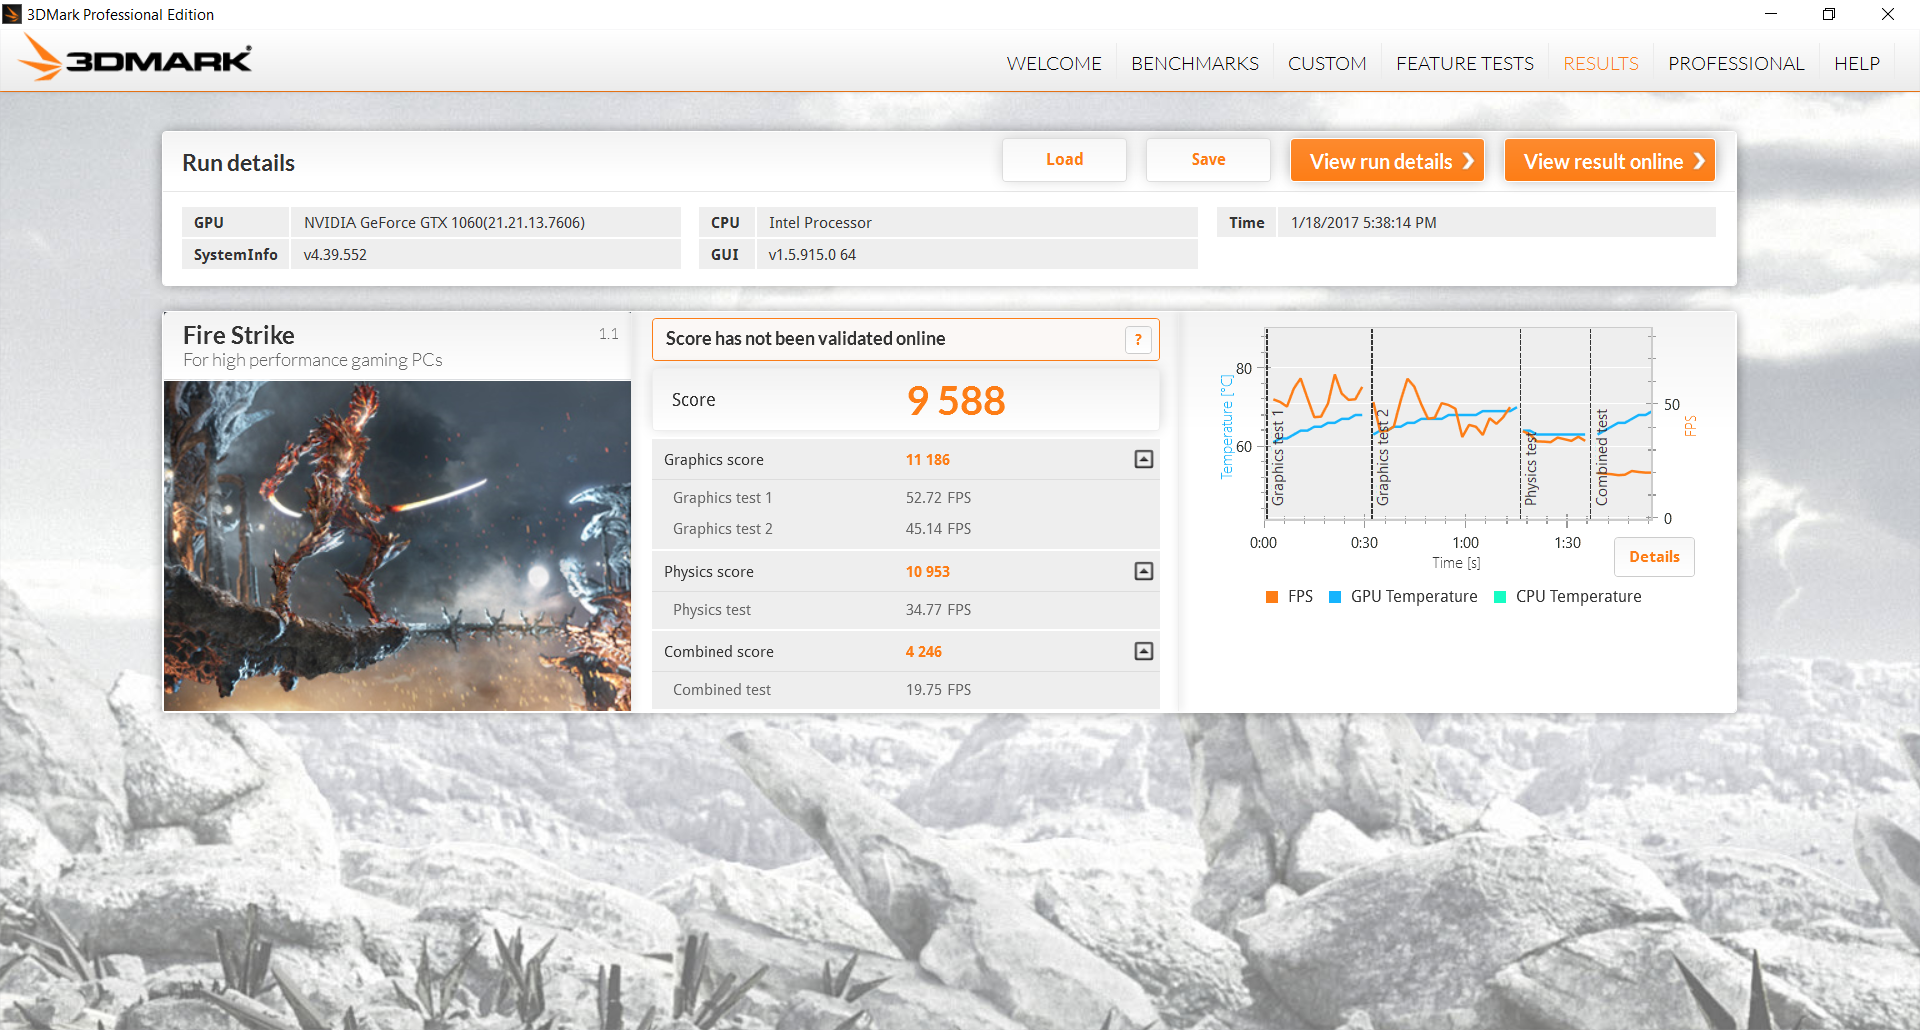
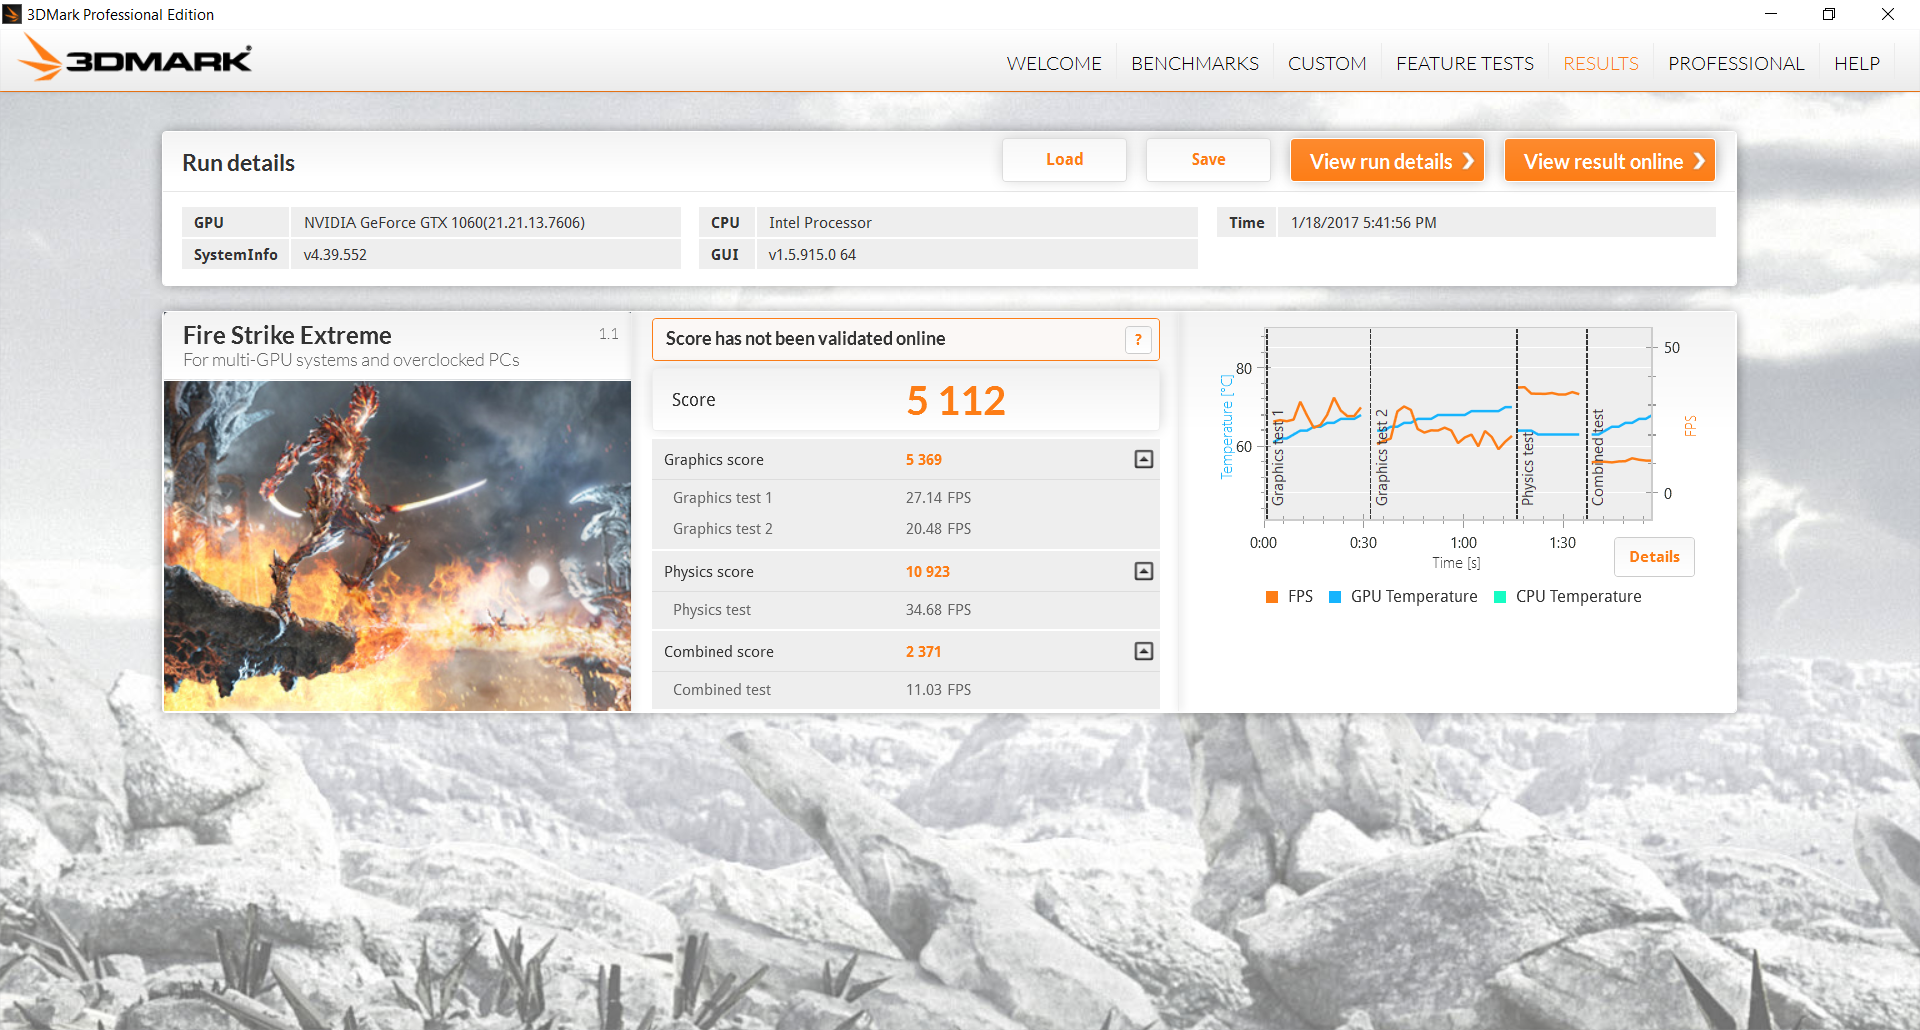
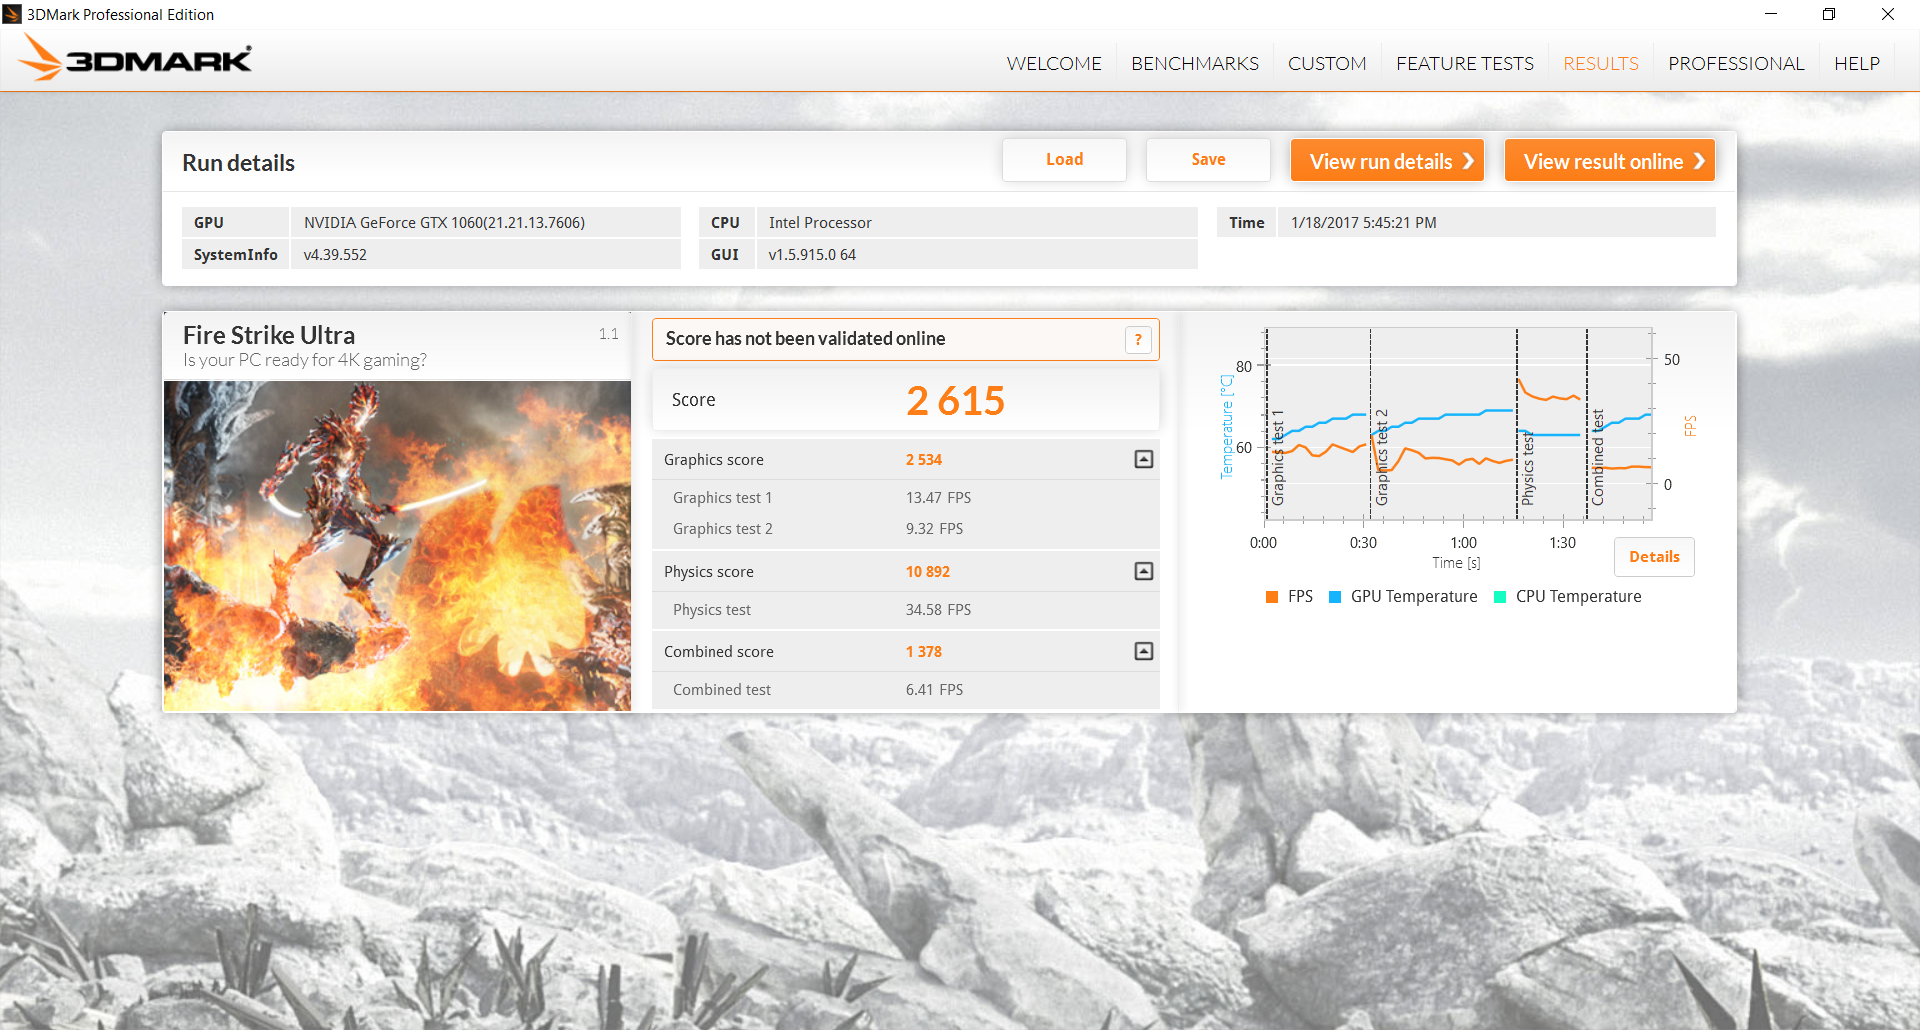
3DMark benchmarks rank our GTX 1060 in the Asus about 10 to 15 percent faster than the Maxwell GTX 980M. Our reference GTX 1060 Founder's Edition desktop card, however, is another 15 percent faster in raw performance than our mobile GTX 1060. Moving up from the recently announced GTX 1050 to the GTX 1060 will bring a performance boost of over 100 percent.
See our reviews on the GTX 1060 and the Pascal series for more technical information and data.
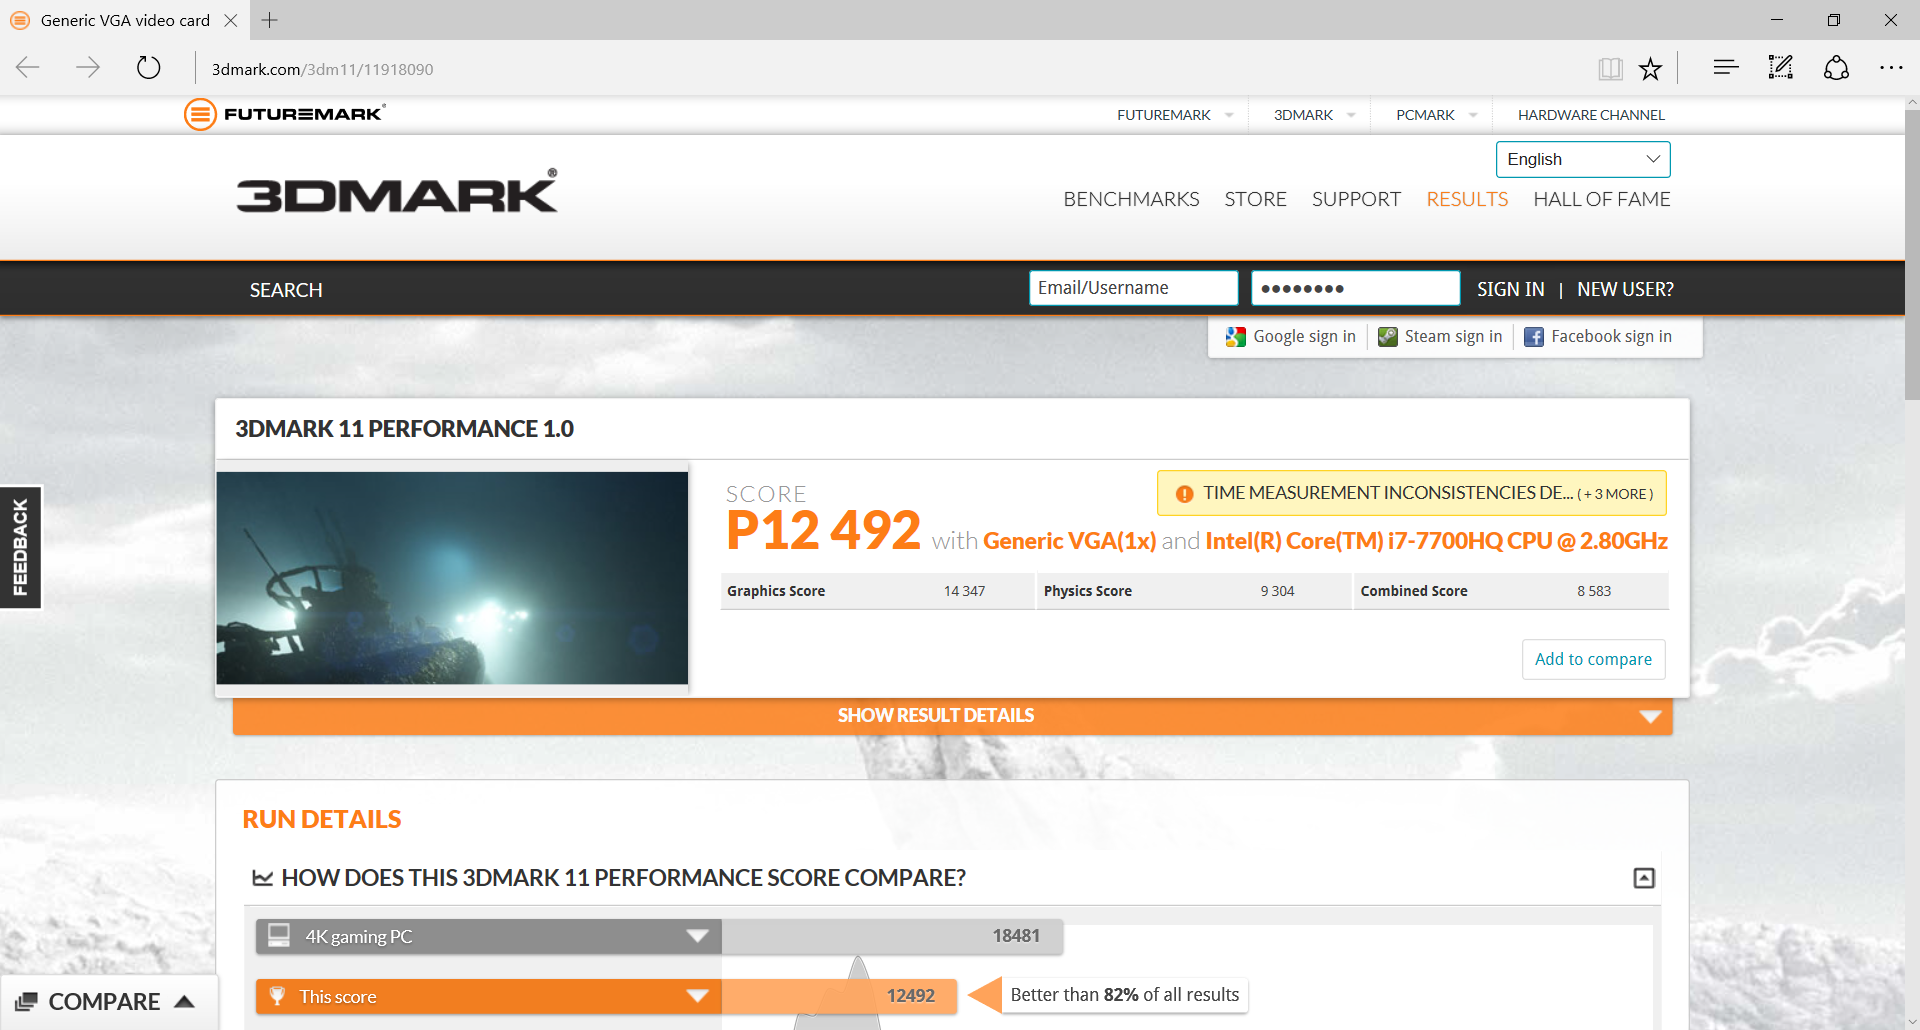
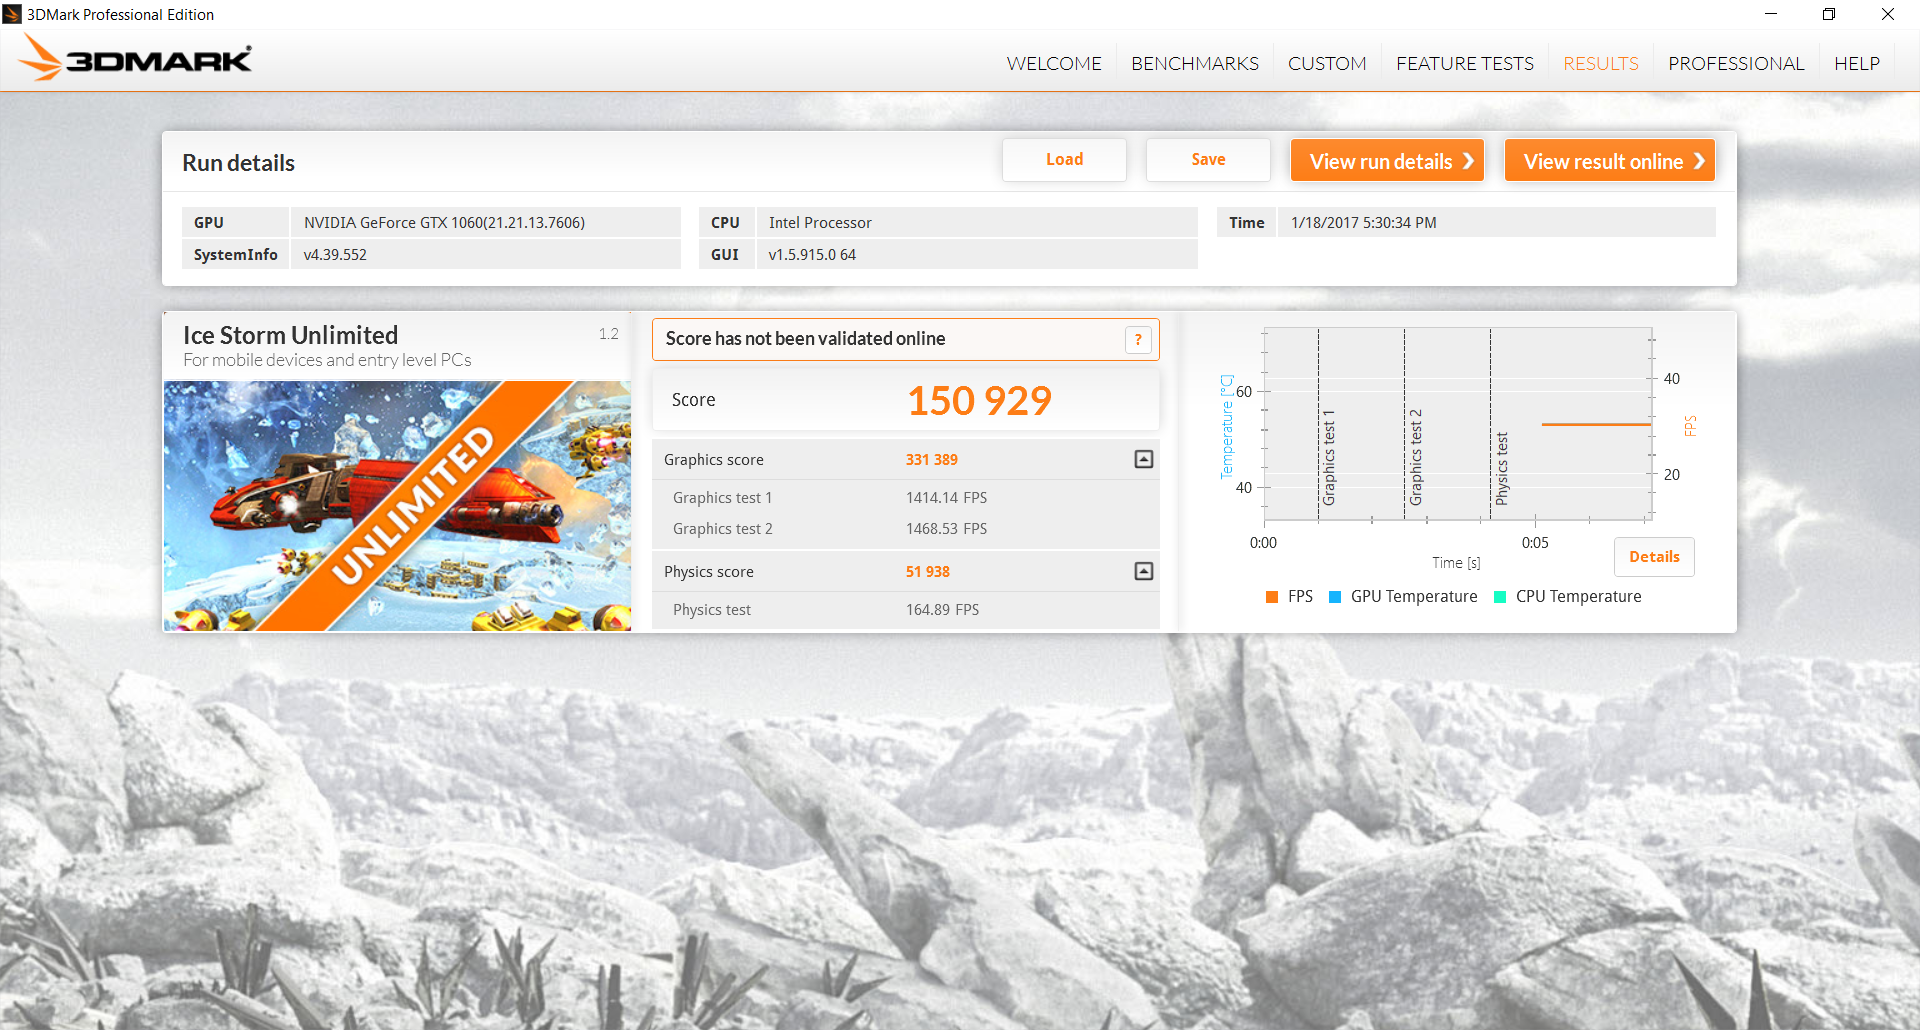
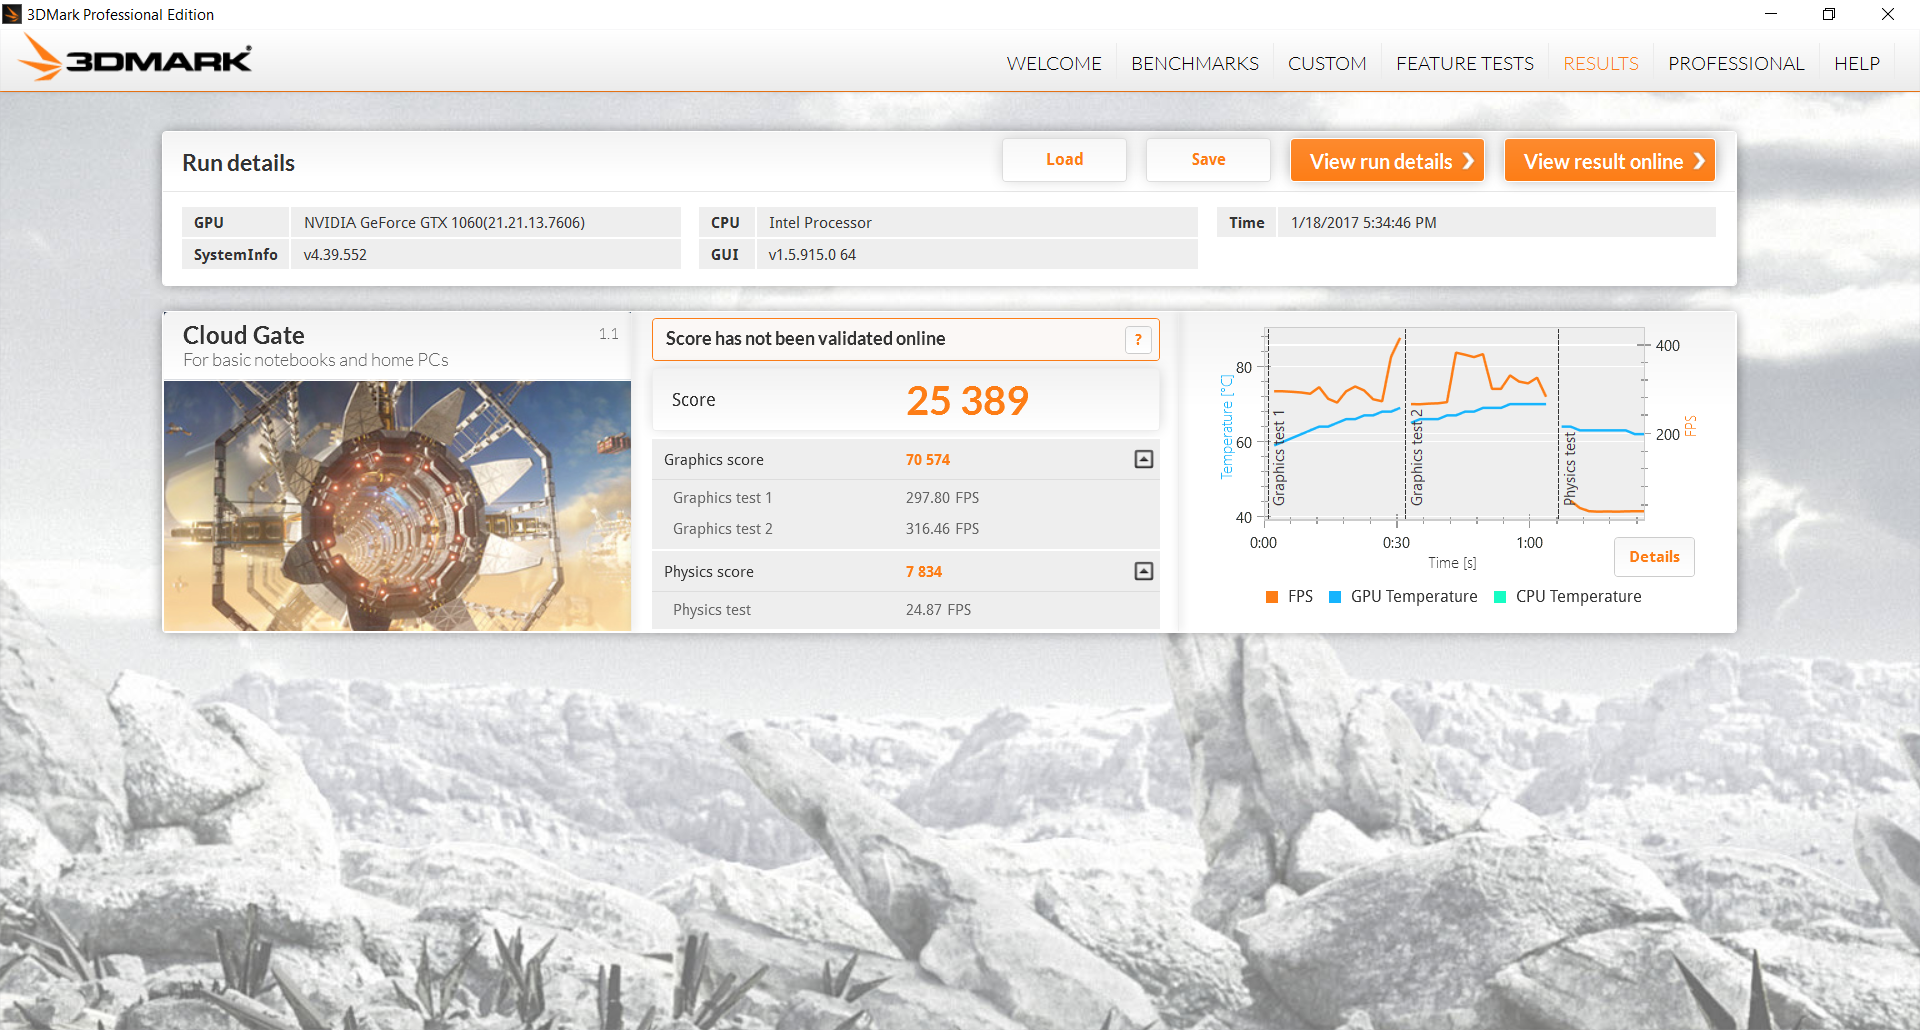
| 3DMark 11 Performance | 12492 points | |
| 3DMark Ice Storm Standard Score | 123983 points | |
| 3DMark Cloud Gate Standard Score | 25389 points | |
| 3DMark Fire Strike Score | 9588 points | |
| 3DMark Fire Strike Extreme Score | 5112 points | |
Help | ||
Gaming Performance
Like the RX 480, the GTX 1060 targets gamers who want 60 FPS on their native 1080p displays. Users will be able to run most games on High to Extreme graphical settings while still averaging 60 FPS, albeit newer or more demanding titles like Mafia 3 or Batman: Arkham Knight will require lower settings for the same frame rate results. Our reference GTX 1060 desktop outperforms the GTX 1060 in the Asus notebook by about 10 percent on nearly all tested games.
See our dedicated GPU page on the GTX 1060 for more benchmark comparisons.
| Rise of the Tomb Raider - 1920x1080 Very High Preset AA:FX AF:16x | |
| Eurocom Sky X7E2 | |
| Eurocom Tornado F5 | |
| Nvidia GeForce GTX 1060 Founders Edition 6 GB | |
| Nvidia GeForce GTX 1060 Founders Edition 6 GB | |
| Asus Strix GL502VM-DS74 | |
| DogHouse Systems Mobius SS | |
| Asus Strix GL753VD-GC045T | |
| BioShock Infinite - 1920x1080 Ultra Preset, DX11 (DDOF) | |
| Eurocom Sky X7E2 | |
| Eurocom Tornado F5 | |
| Asus Strix GL502VM-DS74 | |
| DogHouse Systems Mobius SS | |
| Metro: Last Light - 1920x1080 Very High (DX11) AF:16x | |
| Eurocom Sky X7E2 | |
| Eurocom Tornado F5 | |
| Asus Strix GL502VM-DS74 | |
| DogHouse Systems Mobius SS | |
| Asus Strix GL753VD-GC045T | |
| Thief - 1920x1080 Very High Preset AA:FXAA & High SS AF:8x | |
| Eurocom Sky X7E2 | |
| Asus Strix GL502VM-DS74 | |
| DogHouse Systems Mobius SS | |
| Batman: Arkham Knight - 1920x1080 High / On AA:SM AF:16x | |
| Eurocom Sky X7E2 | |
| Eurocom Tornado F5 | |
| Nvidia GeForce GTX 1060 Founders Edition 6 GB | |
| DogHouse Systems Mobius SS | |
| Asus Strix GL502VM-DS74 | |
| Fallout 4 - 1920x1080 Ultra Preset AA:T AF:16x | |
| Eurocom Sky X7E2 | |
| Eurocom Tornado F5 | |
| Nvidia GeForce GTX 1060 Founders Edition 6 GB | |
| Asus Strix GL502VM-DS74 | |
| DogHouse Systems Mobius SS | |
| Asus Strix GL753VD-GC045T | |
| Ashes of the Singularity - 1920x1080 high | |
| Eurocom Tornado F5 | |
| Asus Strix GL502VM-DS74 | |
| Asus Strix GL753VD-GC045T | |
| Doom - 1920x1080 Ultra Preset AA:SM | |
| Eurocom Sky X7E2 | |
| Eurocom Tornado F5 | |
| Asus Strix GL502VM-DS74 | |
| Nvidia GeForce GTX 1060 Founders Edition 6 GB | |
| Asus Strix GL753VD-GC045T | |
| Overwatch - 1920x1080 Epic (Render Scale 100 %) AA:SM AF:16x | |
| Eurocom Sky X7E2 | |
| Eurocom Tornado F5 | |
| Nvidia GeForce GTX 1060 Founders Edition 6 GB | |
| Asus Strix GL502VM-DS74 | |
| Asus Strix GL753VD-GC045T | |
| Mafia 3 - 1920x1080 High Preset | |
| Eurocom Tornado F5 | |
| Asus Strix GL502VM-DS74 | |
| Asus Strix GL753VD-GC045T | |
| low | med. | high | ultra | |
| BioShock Infinite (2013) | 102.8 | |||
| Metro: Last Light (2013) | 77.6 | |||
| Thief (2014) | 73.4 | |||
| Batman: Arkham Knight (2015) | 50 | |||
| Metal Gear Solid V (2015) | 60 | |||
| Fallout 4 (2015) | 70.4 | |||
| Rise of the Tomb Raider (2016) | 60.2 | |||
| Ashes of the Singularity (2016) | 55.2 | |||
| Doom (2016) | 103.3 | |||
| Overwatch (2016) | 106 | |||
| Mafia 3 (2016) | 43.7 |
Stress Test
We stress the notebook with unrealistic loads to identify for any throttling or stability issues. When under Prime95 stress, the CPU is able to maintain a stable Turbo Boost of 3.3 GHz or 500 MHz above its base clock rate. Core temperature plateaus at a respectable 76 C.
Running both Prime95 and FurMark will cause CPU and GPU temperatures to stabilize at 92 C and 81 C, respectively. CPU clock rate drops to a reasonable 3.1 GHz, though its running temperature of over 90 C is alarming nonetheless. Thicker gaming notebooks that can afford beefier cooling solutions like the MSI GT73VR or Asus' own G752 series will see CPU temperatures stabilize well below the 90 C mark when under similar conditions. Fortunately, the GL502VM will not throttle even when subjected to extreme processing conditions.
Running Unigine Valley is more indicative of real-world gaming loads. When under such conditions, we can see the CPU and GPU stabilizing at 78 C and 71 C, respectively, with higher Boost clock rates for each.
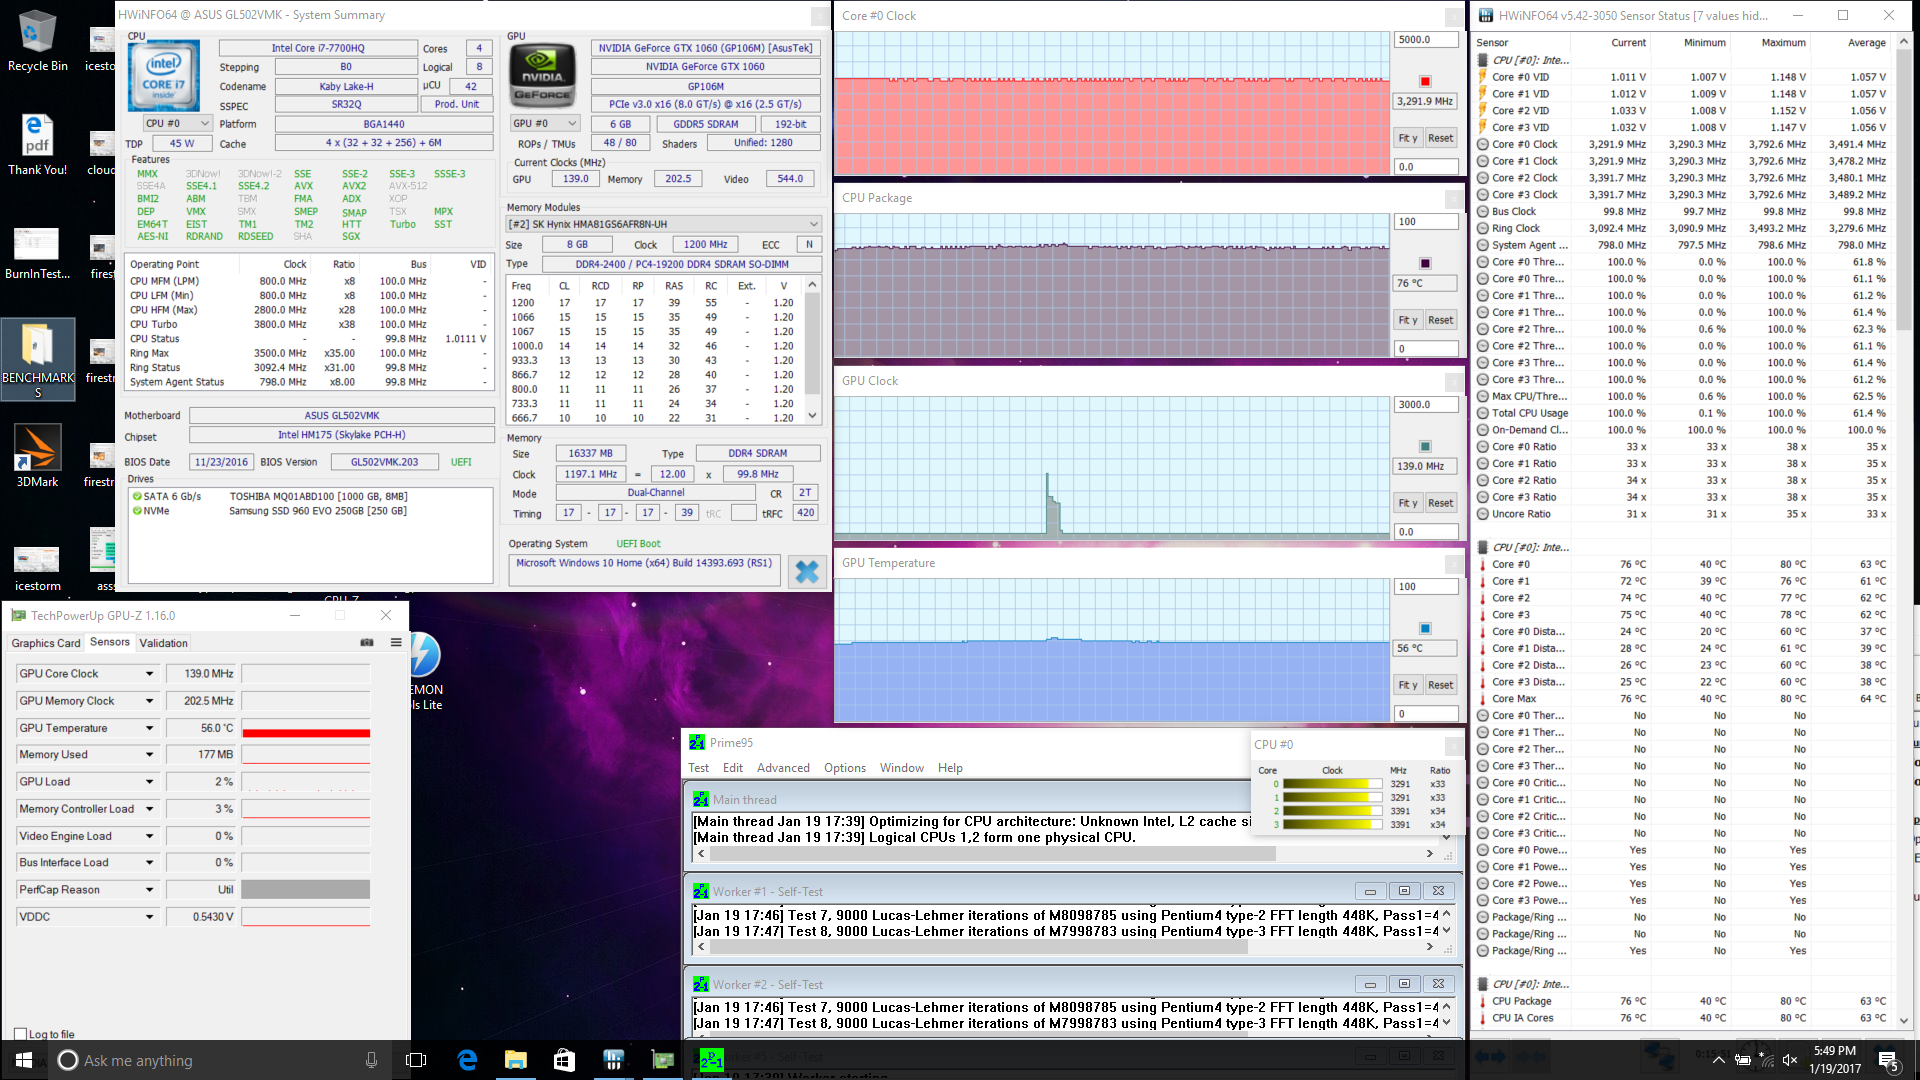
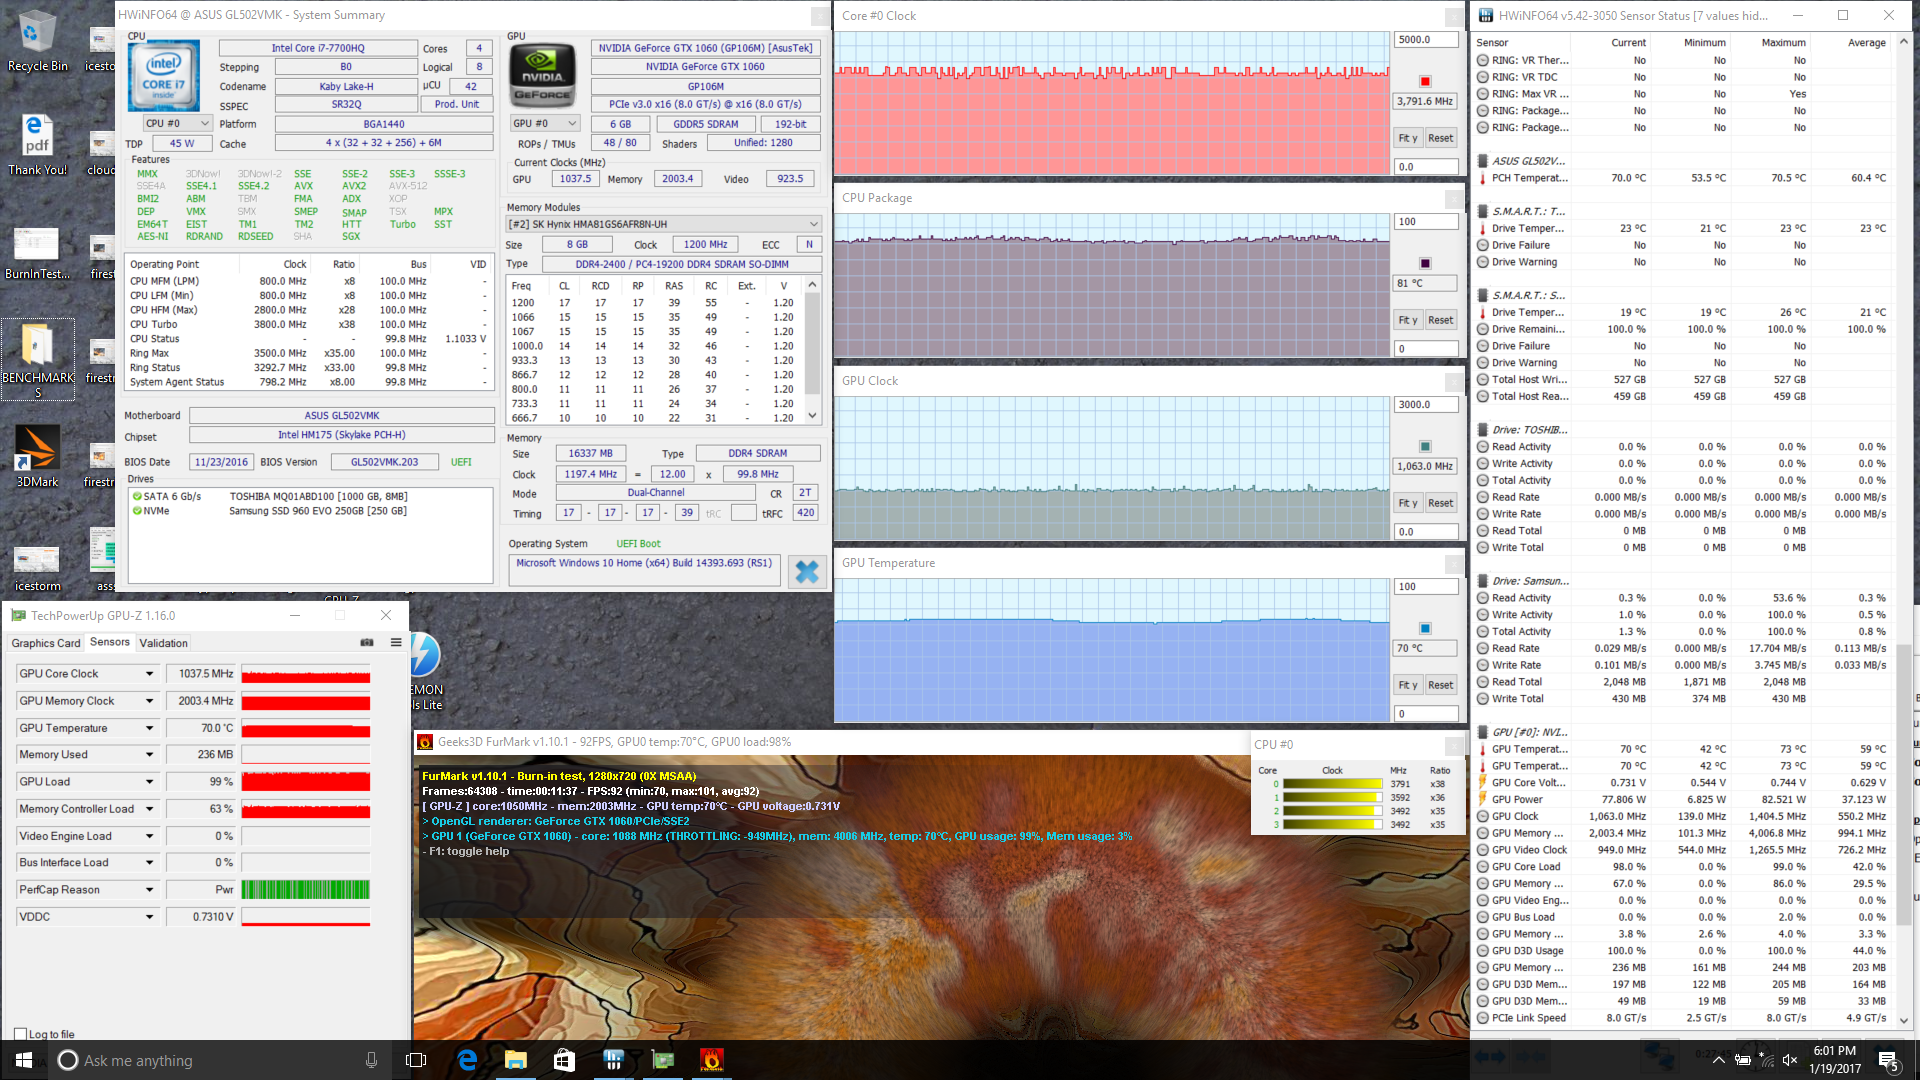
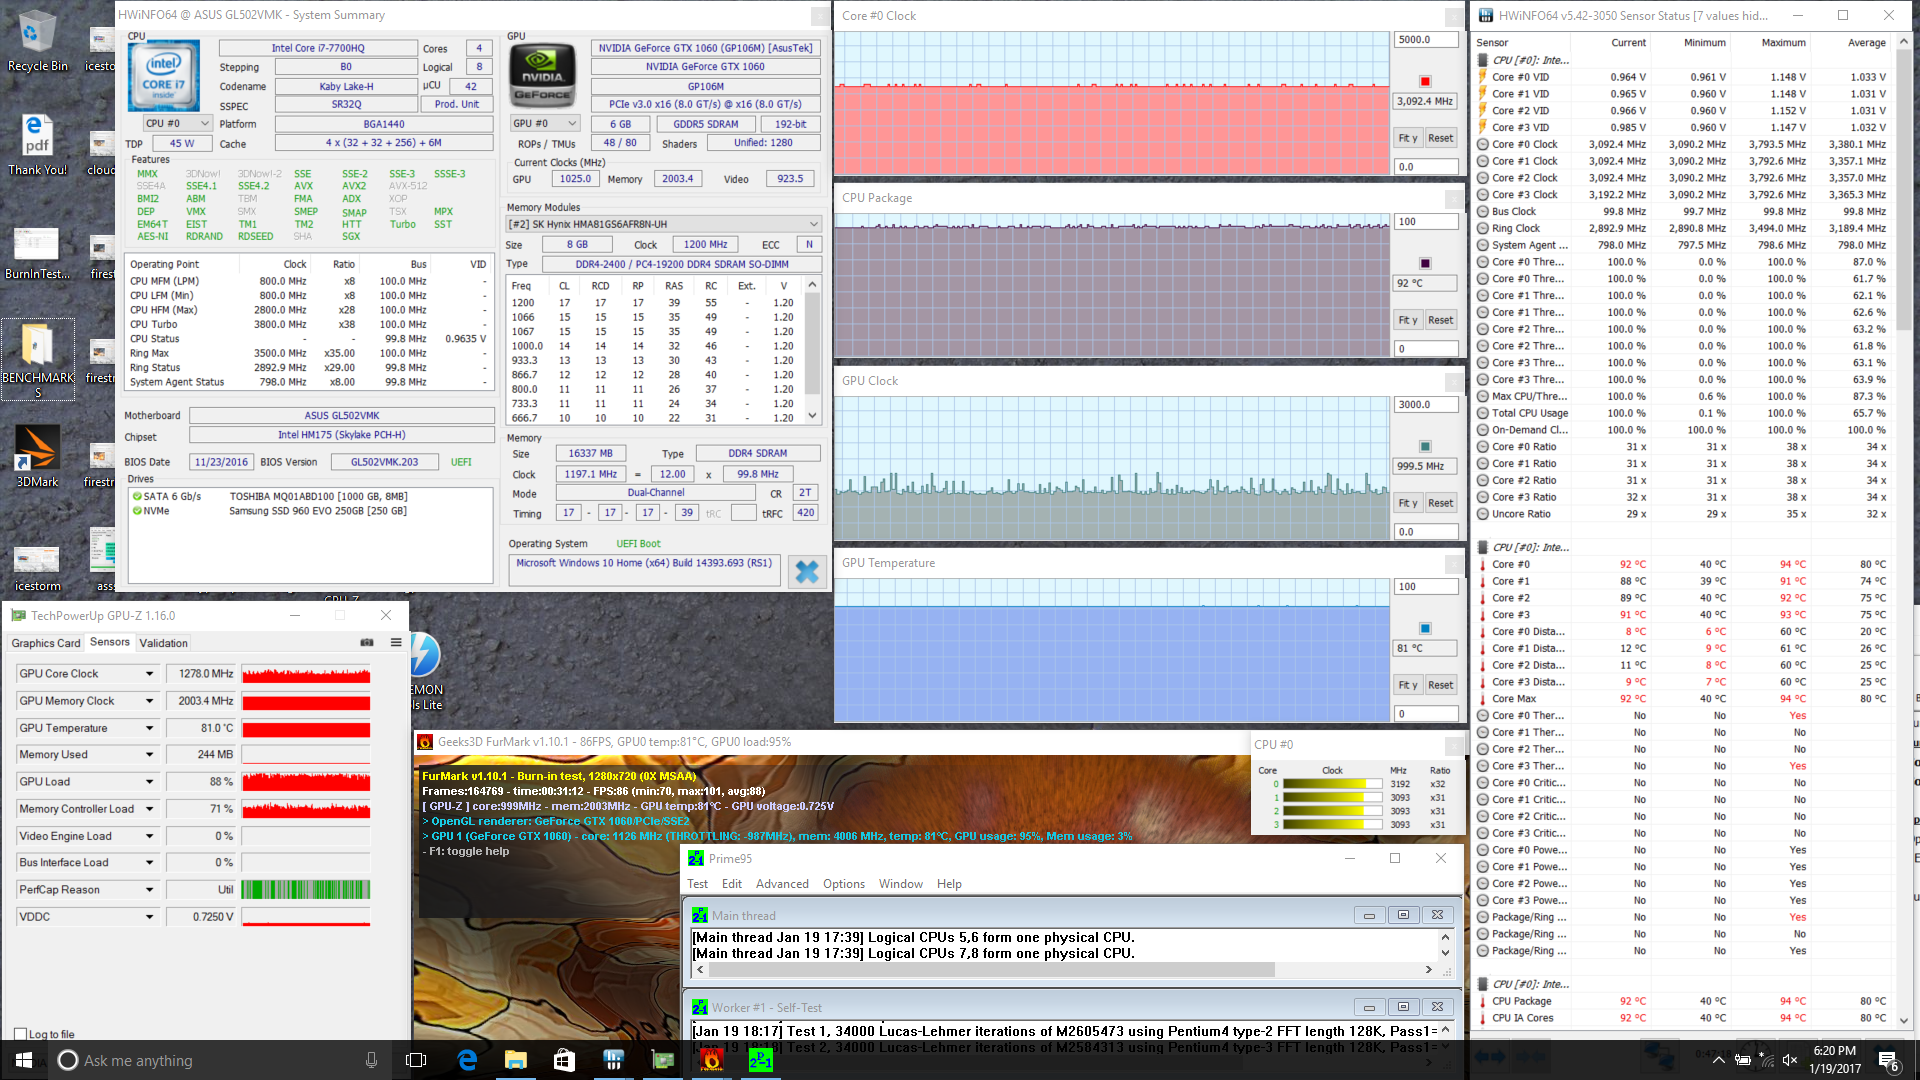
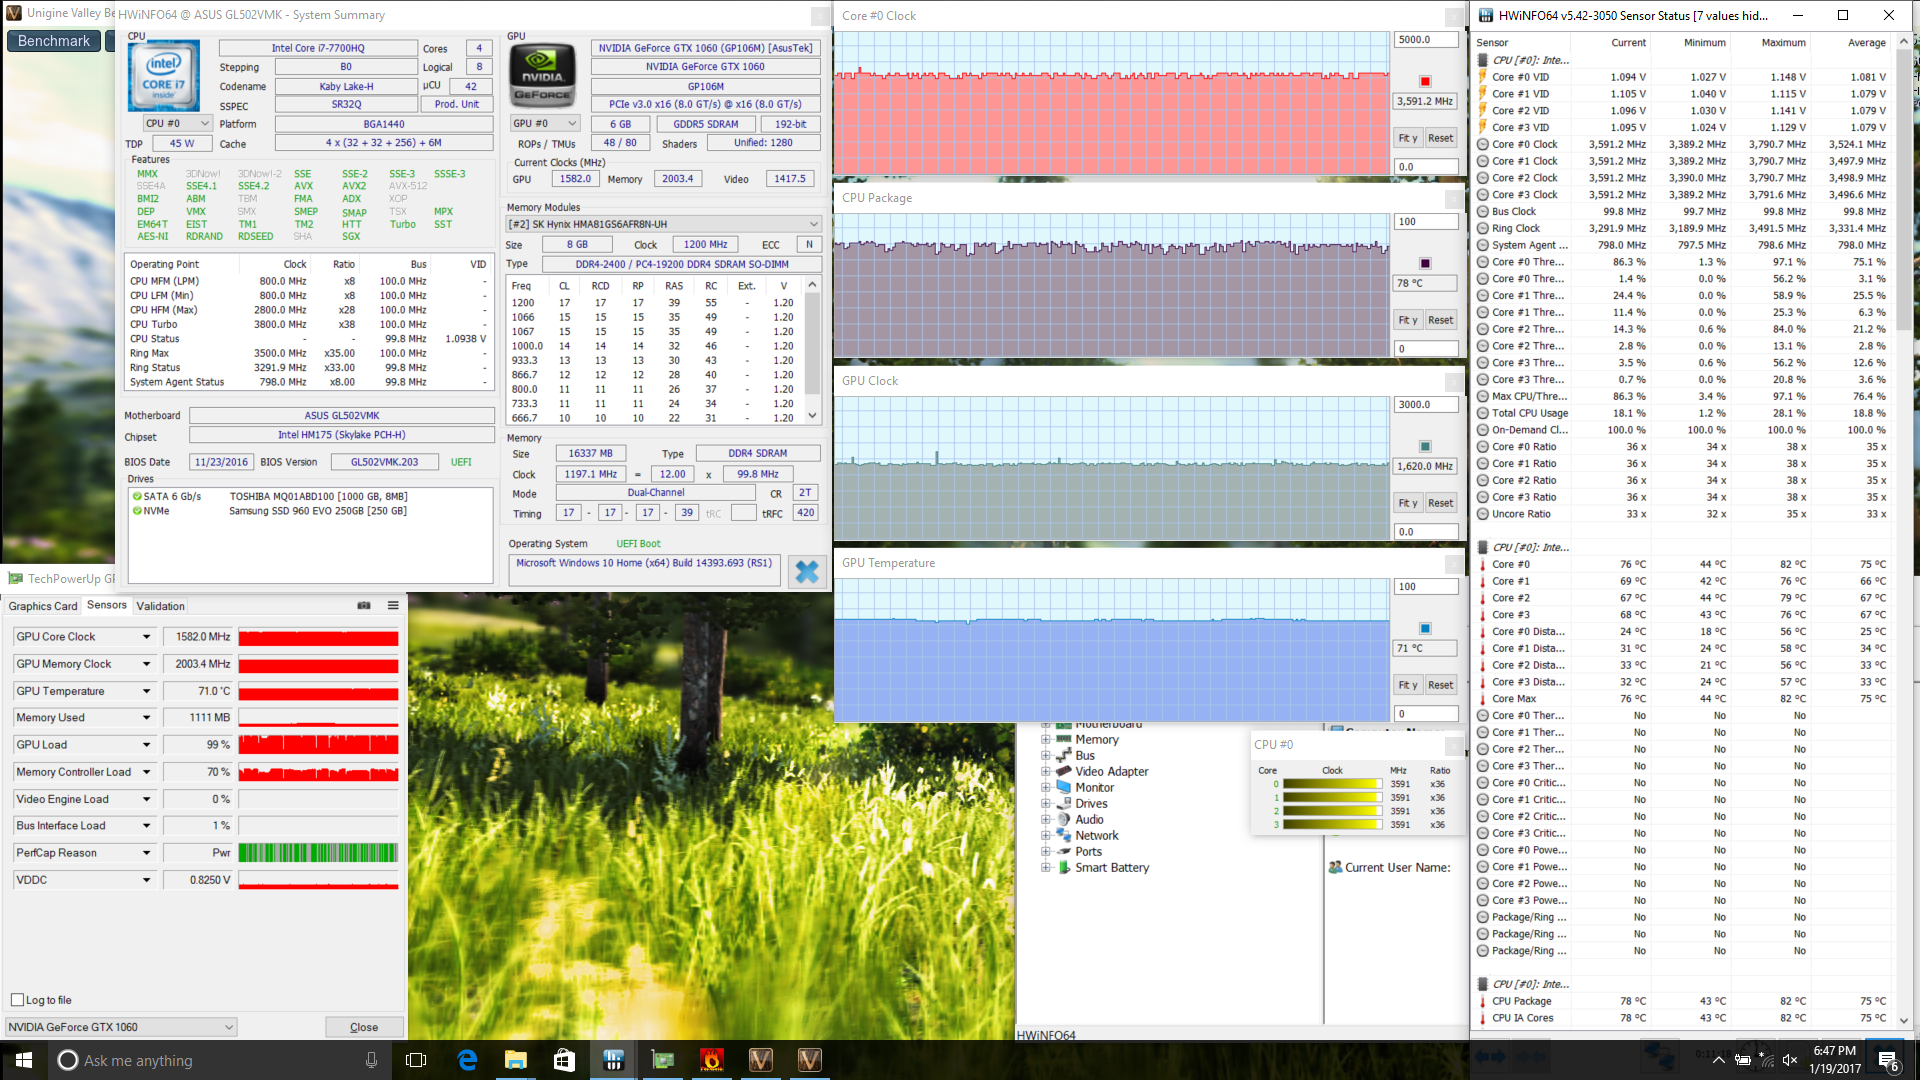
| CPU Clock (GHz) | GPU Clock (MHz) | Average CPU Temperature (°C) | Average GPU Temperature (°C) | |
| Prime95 Stress | 3.3 | -- | 76 | 56 |
| FurMark Stress | -- | 1063 | 81 | 70 |
| Prime95 + FurMark Stress | 3.1 | 1000 - 1278 | 92 | 81 |
| Unigine Valley Stress | 3.6 | 1582 - 1620 | 78 | 71 |
Emissions
System Noise
Twin fans and dual heat pipes are arranged in a symmetric layout for relatively equal cooling on both the CPU and GPU. The fans are always active no matter the workload at about 32 dB(A), but this is thankfully quiet enough to be easily ignored when browsing or during video playback. The fans are not sensitive to onscreen loads and will remain at their lowest operating states under WLAN or streaming loads.
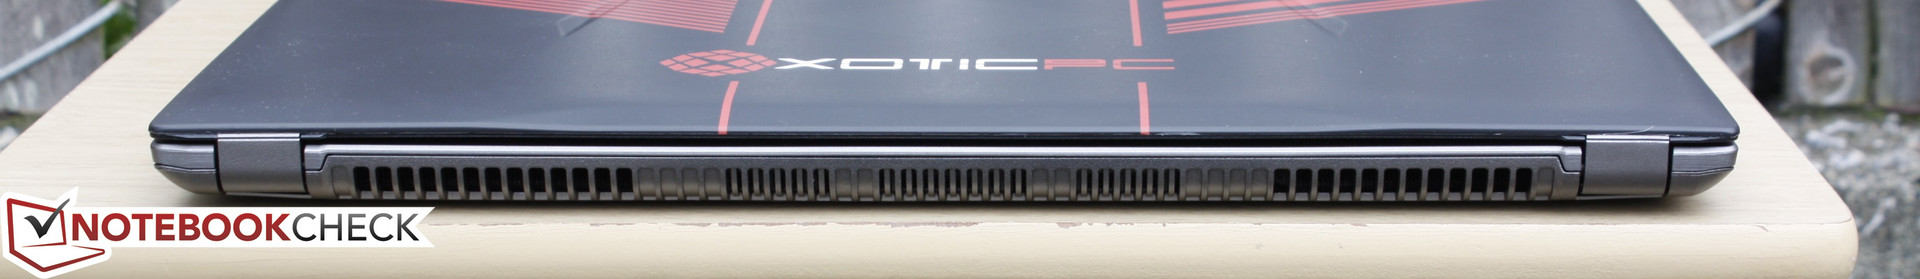
Gaming will steadily bump up fan noise before settling at just over 48 dB(A). This is very loud and noticeably louder than competing notebooks under similar loads including even the MSI GS63VR and Acer Predator 15. Maximum load with both Prime95 and FurMark will induce a fan noise of just over 51 dB(A).
Noise Level
| Idle |
| 32 / 32 / 32 dB(A) |
| Load |
| 48.3 / 51.2 dB(A) |
 | ||
30 dB silent 40 dB(A) audible 50 dB(A) loud |
||
min: | ||
| Asus Strix GL502VM-DS74 GeForce GTX 1060 Mobile, i7-7700HQ, Samsung SSD 960 Evo 250GB m.2 NVMe | MSI GL62-6QFi781H11 GeForce GTX 960M, 6700HQ, Toshiba HG6 THNSNJ128G8NY | Eurocom Tornado F5 GeForce GTX 1070 Mobile, i7-7700K, Samsung SSD 960 Pro 512 GB m.2 | Acer Predator 15 G9-593-765Q GeForce GTX 1070 Mobile, 6700HQ, LiteOn CV1-8B512 | MSI GS63VR-6RF16H22 Stealth Pro GeForce GTX 1060 Mobile, 6700HQ, Samsung SM951 MZVPV256HDGL m.2 PCI-e | |
|---|---|---|---|---|---|
| Noise | -2% | -1% | -1% | 5% | |
| off / environment * | 30.8 | 30 3% | 29.4 5% | 30 3% | 30 3% |
| Idle Minimum * | 32 | 35 -9% | 33.3 -4% | 31 3% | 32 -0% |
| Idle Average * | 32 | 36 -13% | 33.5 -5% | 35 -9% | 33 -3% |
| Idle Maximum * | 32 | 37 -16% | 33.5 -5% | 38 -19% | 34 -6% |
| Load Average * | 48.3 | 41 15% | 44.2 8% | 43 11% | 37 23% |
| Load Maximum * | 51.2 | 46 10% | 52.5 -3% | 49 4% | 46 10% |
* ... smaller is better
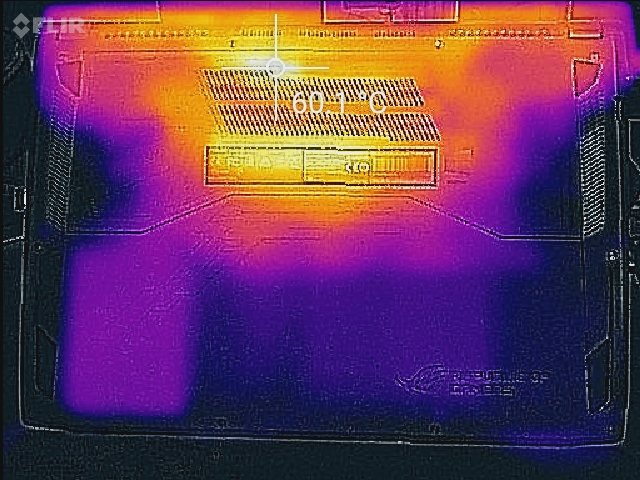
Temperature
Surface temperatures are very warm on the rear quadrants of the notebook while the frontal areas remain relatively cool when under heavy processing loads. The temperature maps below also show the WASD and NumPad keys remaining cool compared to the center area of the keyboard. The surface directly above the first row of keyboard keys can become very warm at 50 C to 60 C when under extreme loads, but this is thankfully away from the user's palms and fingers. In comparison, the thinner MSI GS63VR is warmer overall with a shallower temperature gradient than our Asus GL502VM.
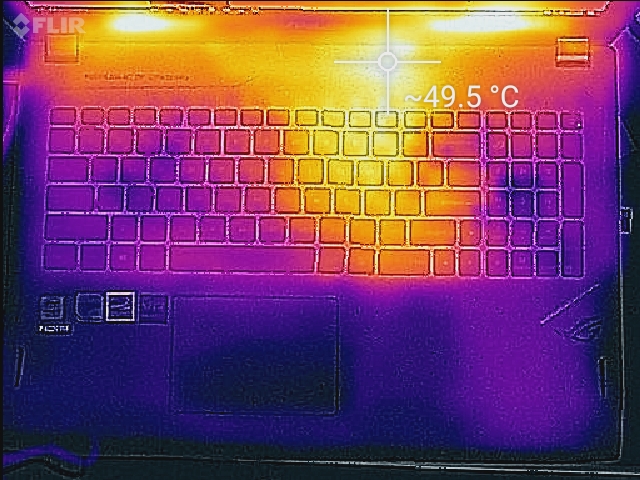
(-) The maximum temperature on the upper side is 50.2 °C / 122 F, compared to the average of 40.4 °C / 105 F, ranging from 21.2 to 68.8 °C for the class Gaming.
(-) The bottom heats up to a maximum of 60.2 °C / 140 F, compared to the average of 43.2 °C / 110 F
(+) In idle usage, the average temperature for the upper side is 27.5 °C / 82 F, compared to the device average of 33.8 °C / 93 F.
(+) The palmrests and touchpad are cooler than skin temperature with a maximum of 25.5 °C / 77.9 F and are therefore cool to the touch.
(+) The average temperature of the palmrest area of similar devices was 28.9 °C / 84 F (+3.4 °C / 6.1 F).
Speakers
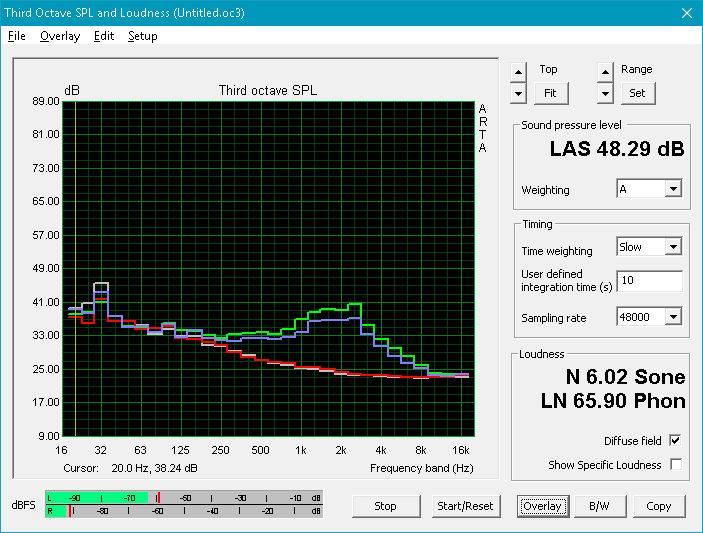
Sound quality from the internal B&O speakers are just average at their default settings. Our microphone measurements show a steady drop at lower frequencies to represent poorer bass reproduction especially when compared to the MSI GT72VR. Maximum volume is sufficiently loud for a small room with no noticeable static or major chassis vibrations, but its subpar sound balance will become much more noticeable in turn.


Apple MacBook 12 (Early 2016) 1.1 GHz audio analysis
(+) | speakers can play relatively loud (83.6 dB)
Bass 100 - 315 Hz
(±) | reduced bass - on average 11.3% lower than median
(±) | linearity of bass is average (14.2% delta to prev. frequency)
Mids 400 - 2000 Hz
(+) | balanced mids - only 2.4% away from median
(+) | mids are linear (5.5% delta to prev. frequency)
Highs 2 - 16 kHz
(+) | balanced highs - only 2% away from median
(+) | highs are linear (4.5% delta to prev. frequency)
Overall 100 - 16.000 Hz
(+) | overall sound is linear (10.2% difference to median)
Compared to same class
» 5% of all tested devices in this class were better, 2% similar, 93% worse
» The best had a delta of 5%, average was 19%, worst was 53%
Compared to all devices tested
» 3% of all tested devices were better, 1% similar, 96% worse
» The best had a delta of 4%, average was 25%, worst was 134%
Frequency Comparison (Checkbox selectable!)
Graph 1: Pink Noise 100% Vol.; Graph 2: Audio off
Energy Management
Power Consumption
The Xotic PC version of the GL502VM consumes significantly more power than other systems with similar specifications. Simply idling on desktop will already draw about 40 W or about double of its competitors under similar conditions. The high power demand of the system is also directly responsible for the shorter battery life as shown in our next section.
Running 3DMark will draw about 110 W compared to 70 W to 80 W on the vanilla GL502VM or MSI GS63VR. Running both Prime95 and FurMark simultaneously will demand about 156 W from a power adapter rated for up to 180 W.
| Off / Standby | |
| Idle | |
| Load |
|
| Asus Strix GL502VM-DS74 i7-7700HQ, GeForce GTX 1060 Mobile, Samsung SSD 960 Evo 250GB m.2 NVMe, IPS, 1920x1080, 15.60 | MSI GL62-6QFi781H11 6700HQ, GeForce GTX 960M, Toshiba HG6 THNSNJ128G8NY, TN LED, 1920x1080, 15.60 | Acer Predator 15 G9-593-765Q 6700HQ, GeForce GTX 1070 Mobile, LiteOn CV1-8B512, IPS, 1920x1080, 15.60 | MSI GS63VR-6RF16H22 Stealth Pro 6700HQ, GeForce GTX 1060 Mobile, Samsung SM951 MZVPV256HDGL m.2 PCI-e, IPS, 1920x1080, 15.60 | Asus Strix GL502VM-FY039T 6700HQ, GeForce GTX 1060 Mobile, Micron SSD 1100 (MTFDDAV256TBN), IPS, 1920x1080, 15.60 | |
|---|---|---|---|---|---|
| Power Consumption | 49% | 24% | 30% | 39% | |
| Idle Minimum * | 38.3 | 10 74% | 18 53% | 18 53% | 16 58% |
| Idle Average * | 40.5 | 14 65% | 24 41% | 22 46% | 19 53% |
| Idle Maximum * | 42.2 | 19 55% | 29 31% | 30 29% | 23 45% |
| Load Average * | 110.4 | 82 26% | 86 22% | 77 30% | 68 38% |
| Load Maximum * | 155.7 | 118 24% | 201 -29% | 165 -6% | 157 -1% |
* ... smaller is better
Battery Life
Runtimes from Xotic PC notebooks are always significantly shorter than competing models from what we have seen. This may be due to software, utilities, or factory overclocking imposed by the reseller that the original manufacturer would not have otherwise performed. Our Skylake GL502VM test unit from Asus, for example, clocked in at over 3.5 hours in real-world WLAN use compared to less than 1.5 on our Kaby Lake Xotic PC unit. Even idling on desktop at the most power-efficient settings (Power Saver, minimum brightness, wireless disabled, and GPU to optimal power) will result in a runtime of just 1:44 hours.
Charging from near empty to full capacity will take 2 to 2.5 hours.
| Asus Strix GL502VM-DS74 i7-7700HQ, GeForce GTX 1060 Mobile, 64 Wh | MSI GL62-6QFi781H11 6700HQ, GeForce GTX 960M, 41.4 Wh | Acer Predator 15 G9-593-765Q 6700HQ, GeForce GTX 1070 Mobile, Wh | MSI GS63VR-6RF16H22 Stealth Pro 6700HQ, GeForce GTX 1060 Mobile, 65 Wh | Asus Strix GL502VM-FY039T 6700HQ, GeForce GTX 1060 Mobile, 64 Wh | |
|---|---|---|---|---|---|
| Battery Runtime | 110% | 162% | 139% | 135% | |
| Reader / Idle | 104 | 339 226% | 358 244% | 315 203% | |
| WiFi v1.3 | 88 | 158 80% | 285 224% | 210 139% | 220 150% |
| Load | 57 | 71 25% | 114 100% | 76 33% | 87 53% |
Pros
Cons
Verdict

Similar to our conclusions between the Skylake XPS 13 9350 and Kaby Lake XPS 13 9360, the Skylake GL502VM and Kaby Lake GL502VM are essentially interchangeable. Even gamers will be hard pressed to find any real-world performance advantages from the Kaby Lake update especially after considering that most modern titles are GPU bound and do not rely heavily on raw CPU performance. The Kaby Lake GL502VM would have been an easier recommendation if it had returned longer runtimes, cooler temperatures, lower power consumption, and quieter fan noise due to its brand new CPU. Unfortunately, our measurements don't show this to be the case at all.
The GL502 series is still a strong mainstream solution for gamers who may also be considering the MSI GE/GS series, HP Omen series, Lenovo Y series, or Dell Inspiron Gaming series. Hopefully Asus will add more features to the GL502 family in a future refresh beyond the simple CPU swap that we have here. Options such as Thunderbolt 3 or 120 Hz/5 ms displays or even software updates with better fan controls and power settings can go a long way for the GL502VM.
The GL502VM is attractive with a relatively light and sturdy chassis. It feels more barebones than it should, however, with more limited hardware options compared to the competition. Fan noise and battery life are particularly disappointing on our Xotic PC test unit and the new Kaby Lake CPU provides almost no gaming benefits over the Skylake SKU.
Asus Strix GL502VM-DS74
-
01/24/2017 v6(old)
Allen Ngo
Pricecompare
