 Deutsch
 English
 Español
 Français
 Italiano
 Nederlands
 Polski
 Português
 Русский
 Türkçe
 Svenska
 Chinese
 Magyar
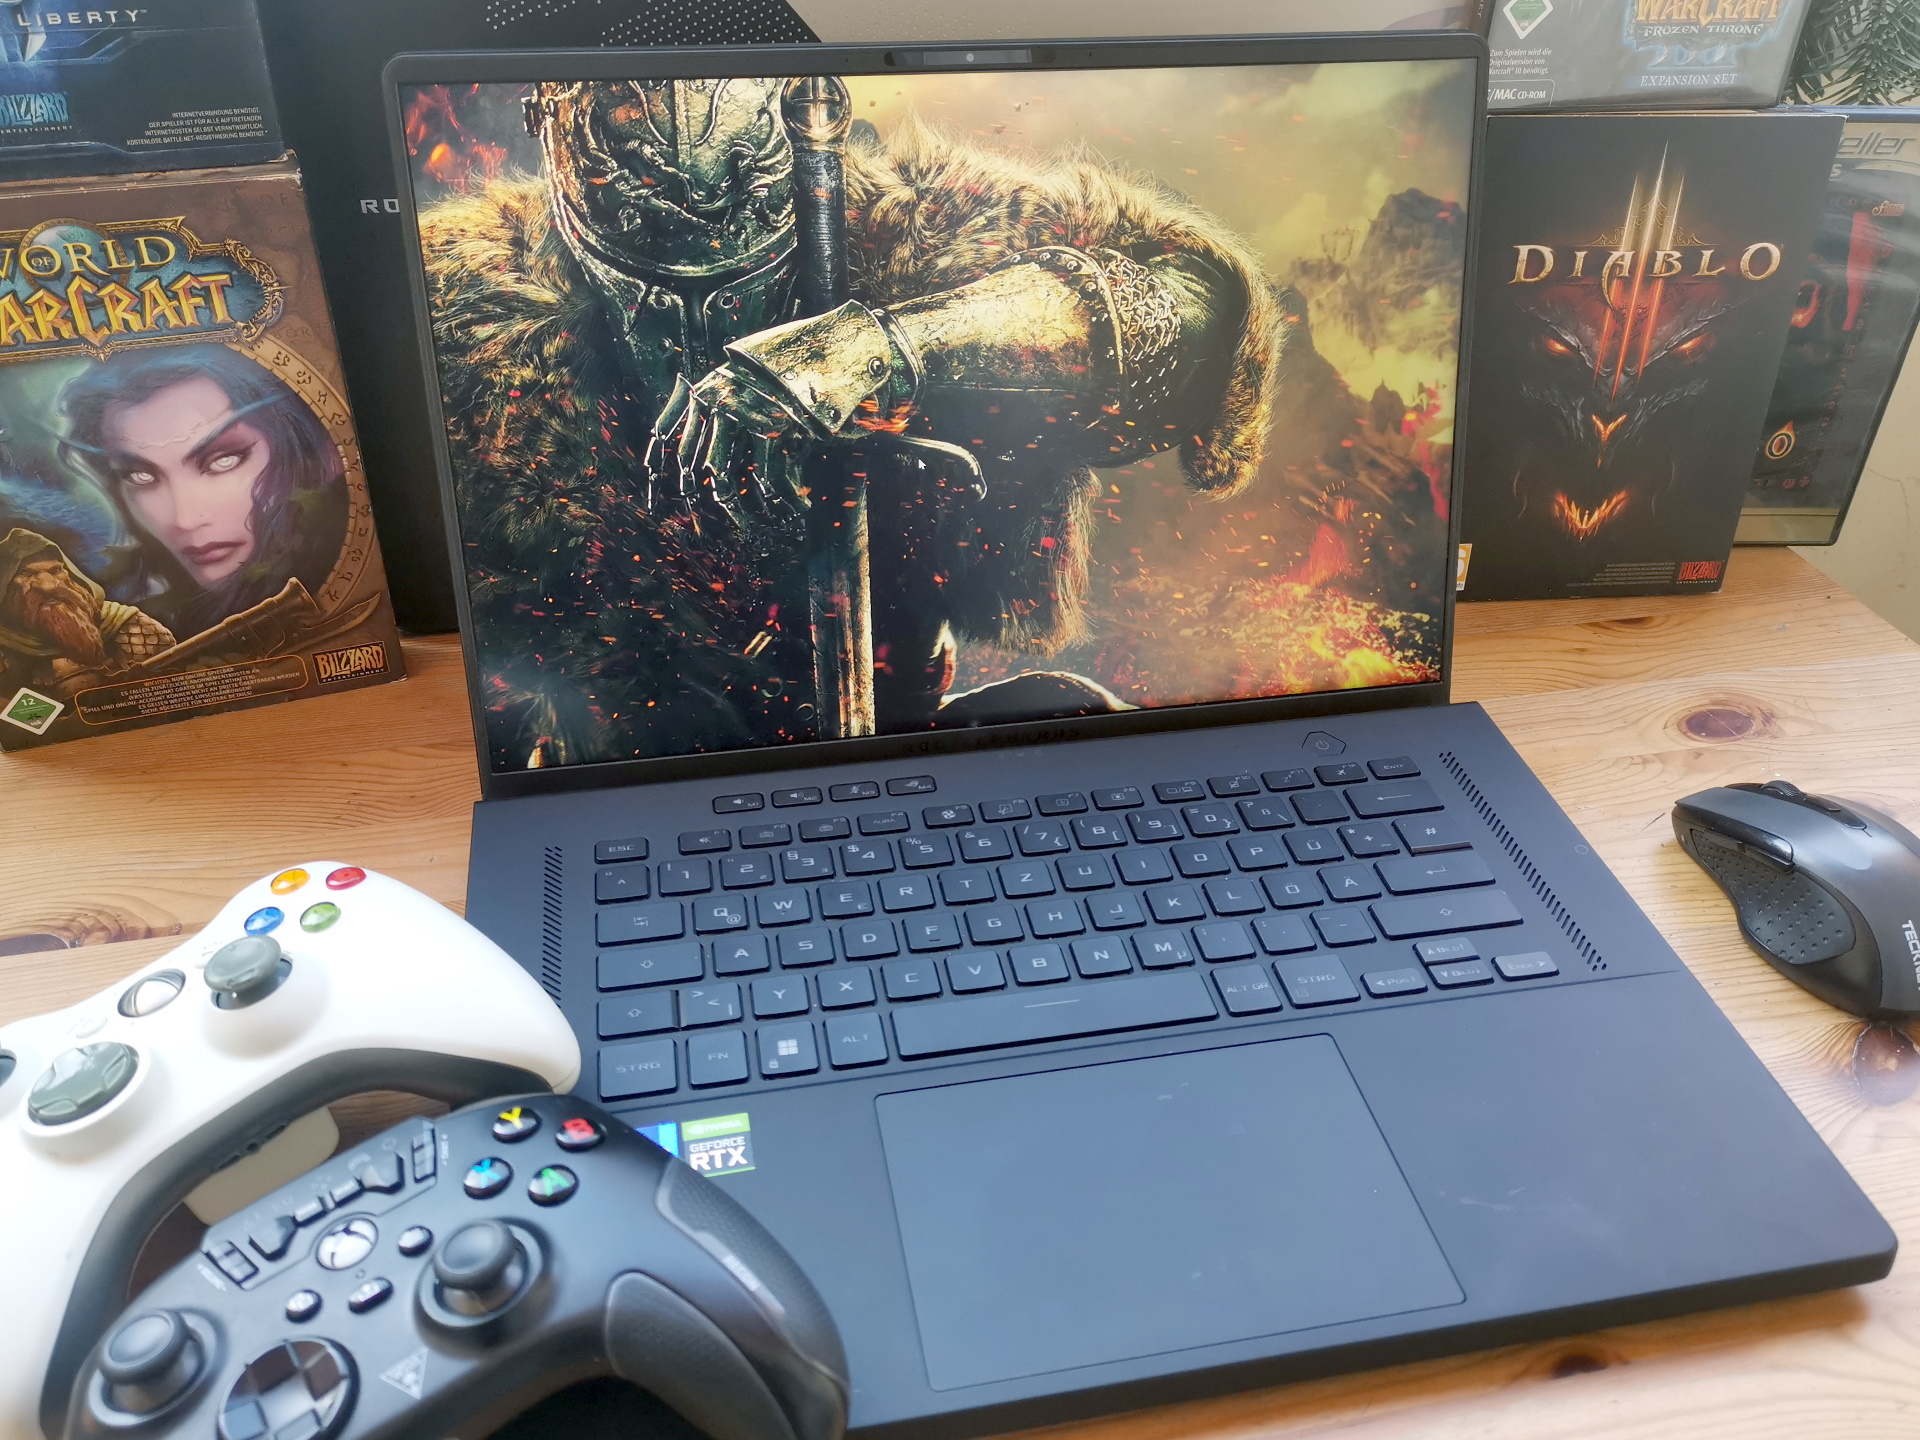
Asus ROG Zephyrus M16 laptop review: A well-rounded gaming package

The M16 (2022) GU603zw inherits from its predecessor of the same name, upgrading the package with a powerful i9 Alder Lake CPU and RTX 3070 Ti. All that comes in a fairly slim and compact 16-inch form factor with a 16:10 display (2,560 x 1,500 pixels) that just barely misses our list of best mobile gaming laptops, since it weighs only 75 grams (~2.6 oz) too much (>2 kg = 4.4 lb). This would have been the first 16-inch device in the list.
Since 16-inch gaming laptops with a 16:10 display are still the minority, we also include "conventional" 16:9 devices with similar hardware in our comparison. In addition to the predecessor, these are particularly the Schenker Vision 16 Pro and the Lenovo Legion 5 Pro, but also the Schenker XMG Focus 16 and the Corsair Voyager a1600.
Possible Competitors in Comparison
Rating | Date | Model | Weight | Height | Size | Resolution | Best Price |
|---|---|---|---|---|---|---|---|
| 87.8 % | 02/2023 | Asus ROG Zephyrus M16 GU603Z i9-12900H, GeForce RTX 3070 Ti Laptop GPU | 2.1 kg | 19.9 mm | 16.00" | 2560x1600 | |
| 85.6 % | 07/2021 | Asus ROG Zephyrus M16 GU603H i9-11900H, GeForce RTX 3070 Laptop GPU | 2 kg | 20 mm | 16.00" | 2560x1600 | |
| 87.8 % | 11/2022 | SCHENKER Vision 16 Pro RTX 3070 Ti i7-12700H, GeForce RTX 3070 Ti Laptop GPU | 1.7 kg | 17.1 mm | 16.00" | 2560x1600 | |
| 87.7 % | 10/2022 | Lenovo Legion 5 Pro 16ARH7H RTX 3070 Ti R7 6800H, GeForce RTX 3070 Ti Laptop GPU | 2.6 kg | 26.6 mm | 16.00" | 2560x1600 | |
| 87 % | 01/2023 | SCHENKER XMG Focus 16 (i7-12700H, RTX 3060) i7-12700H, GeForce RTX 3060 Laptop GPU | 2.2 kg | 24.3 mm | 16.00" | 2560x1600 | |
| 86.6 % | 12/2022 | Corsair Voyager a1600 R9 6900HS, Radeon RX 6800M | 2.4 kg | 19.9 mm | 16.00" | 2560x1600 |
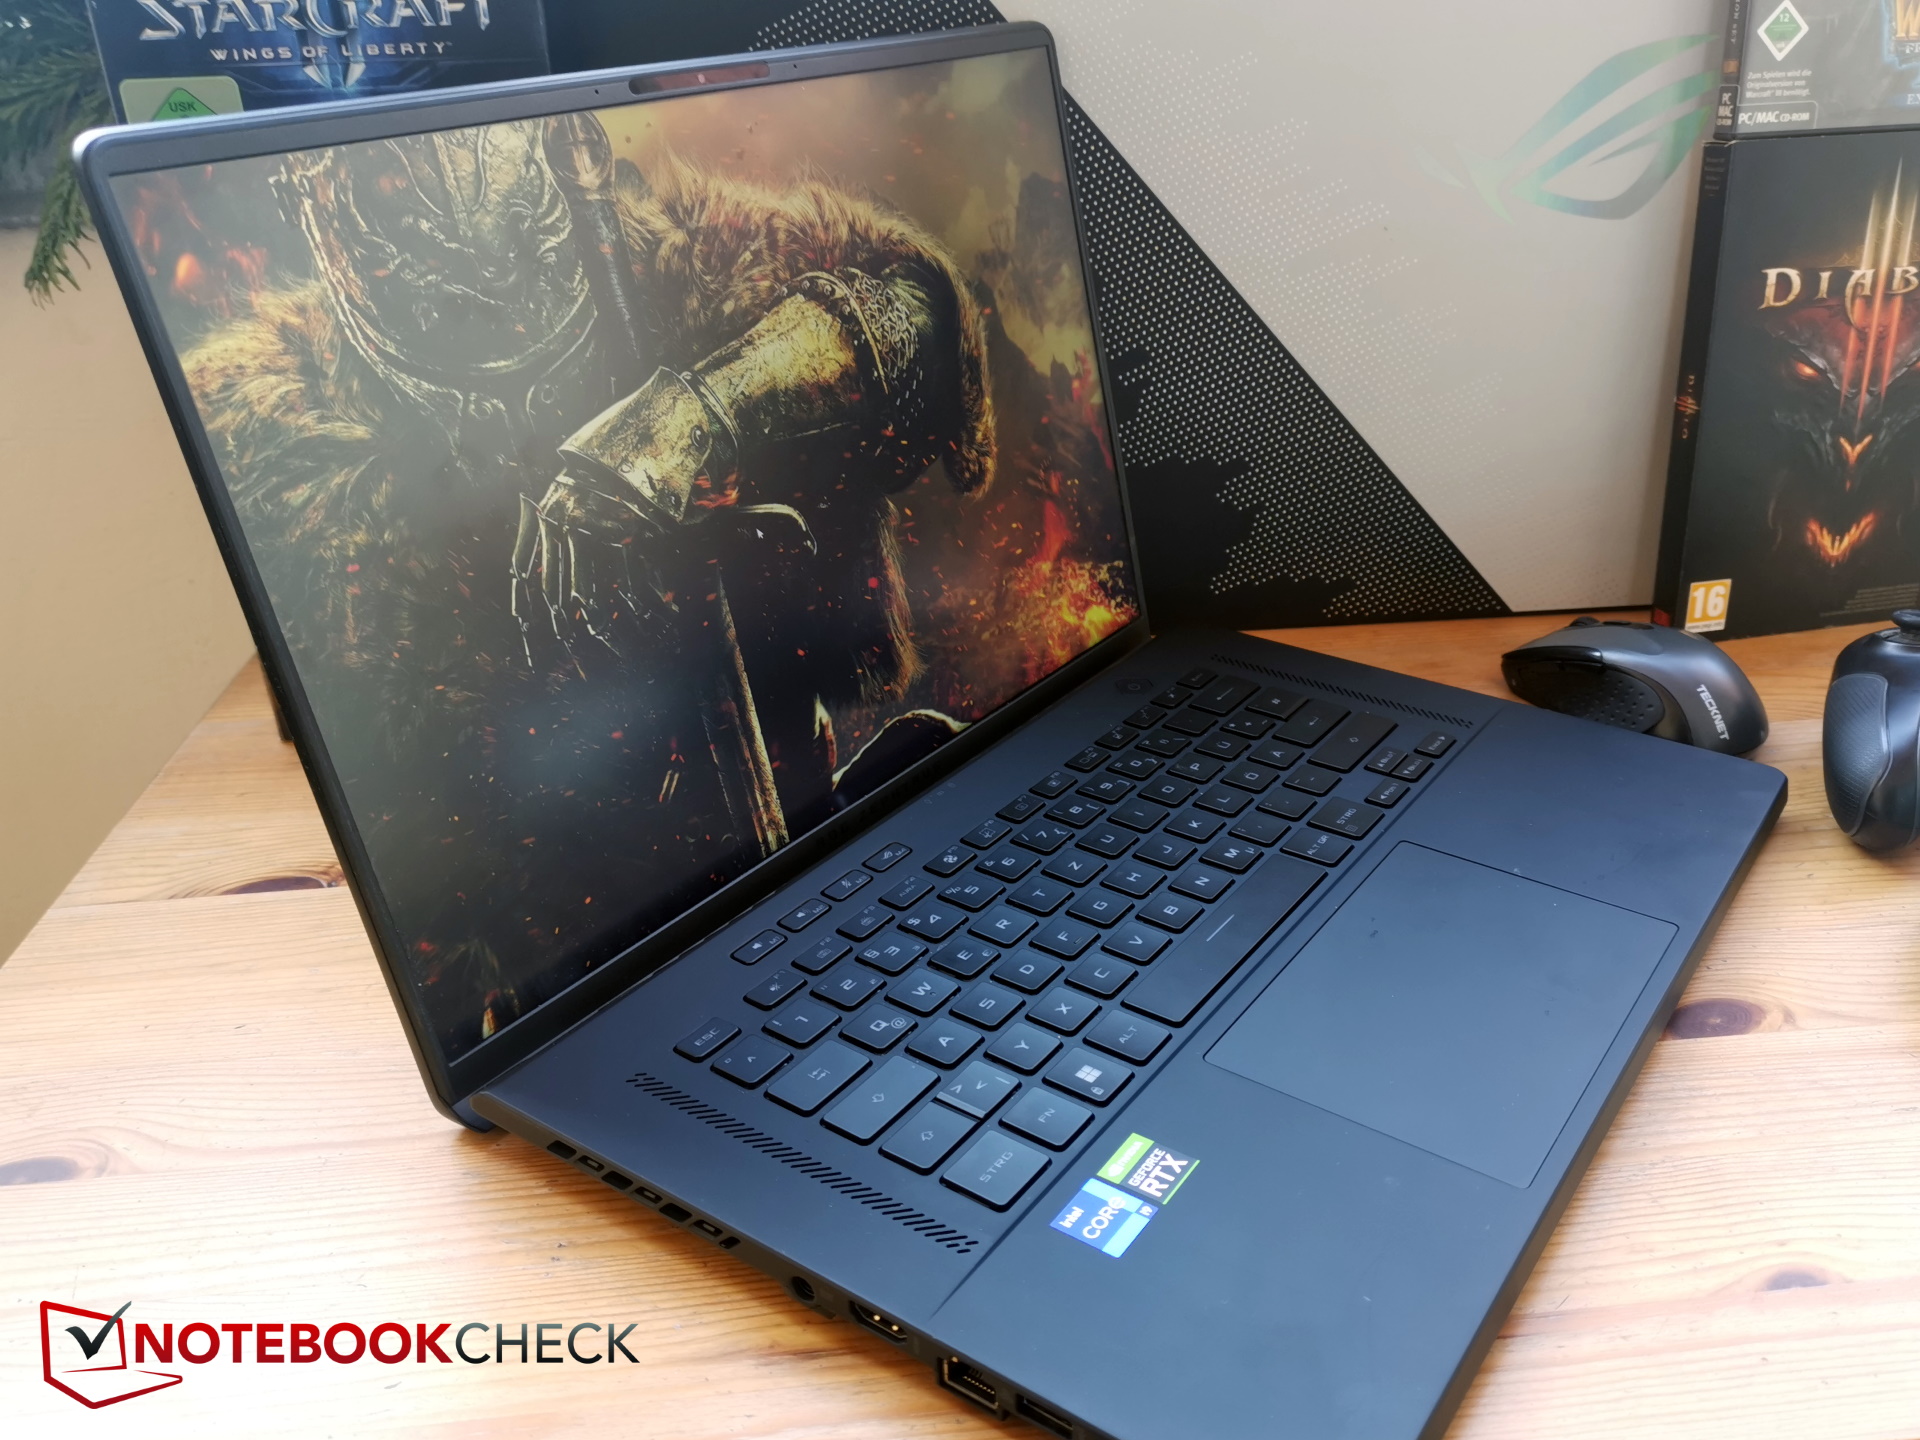
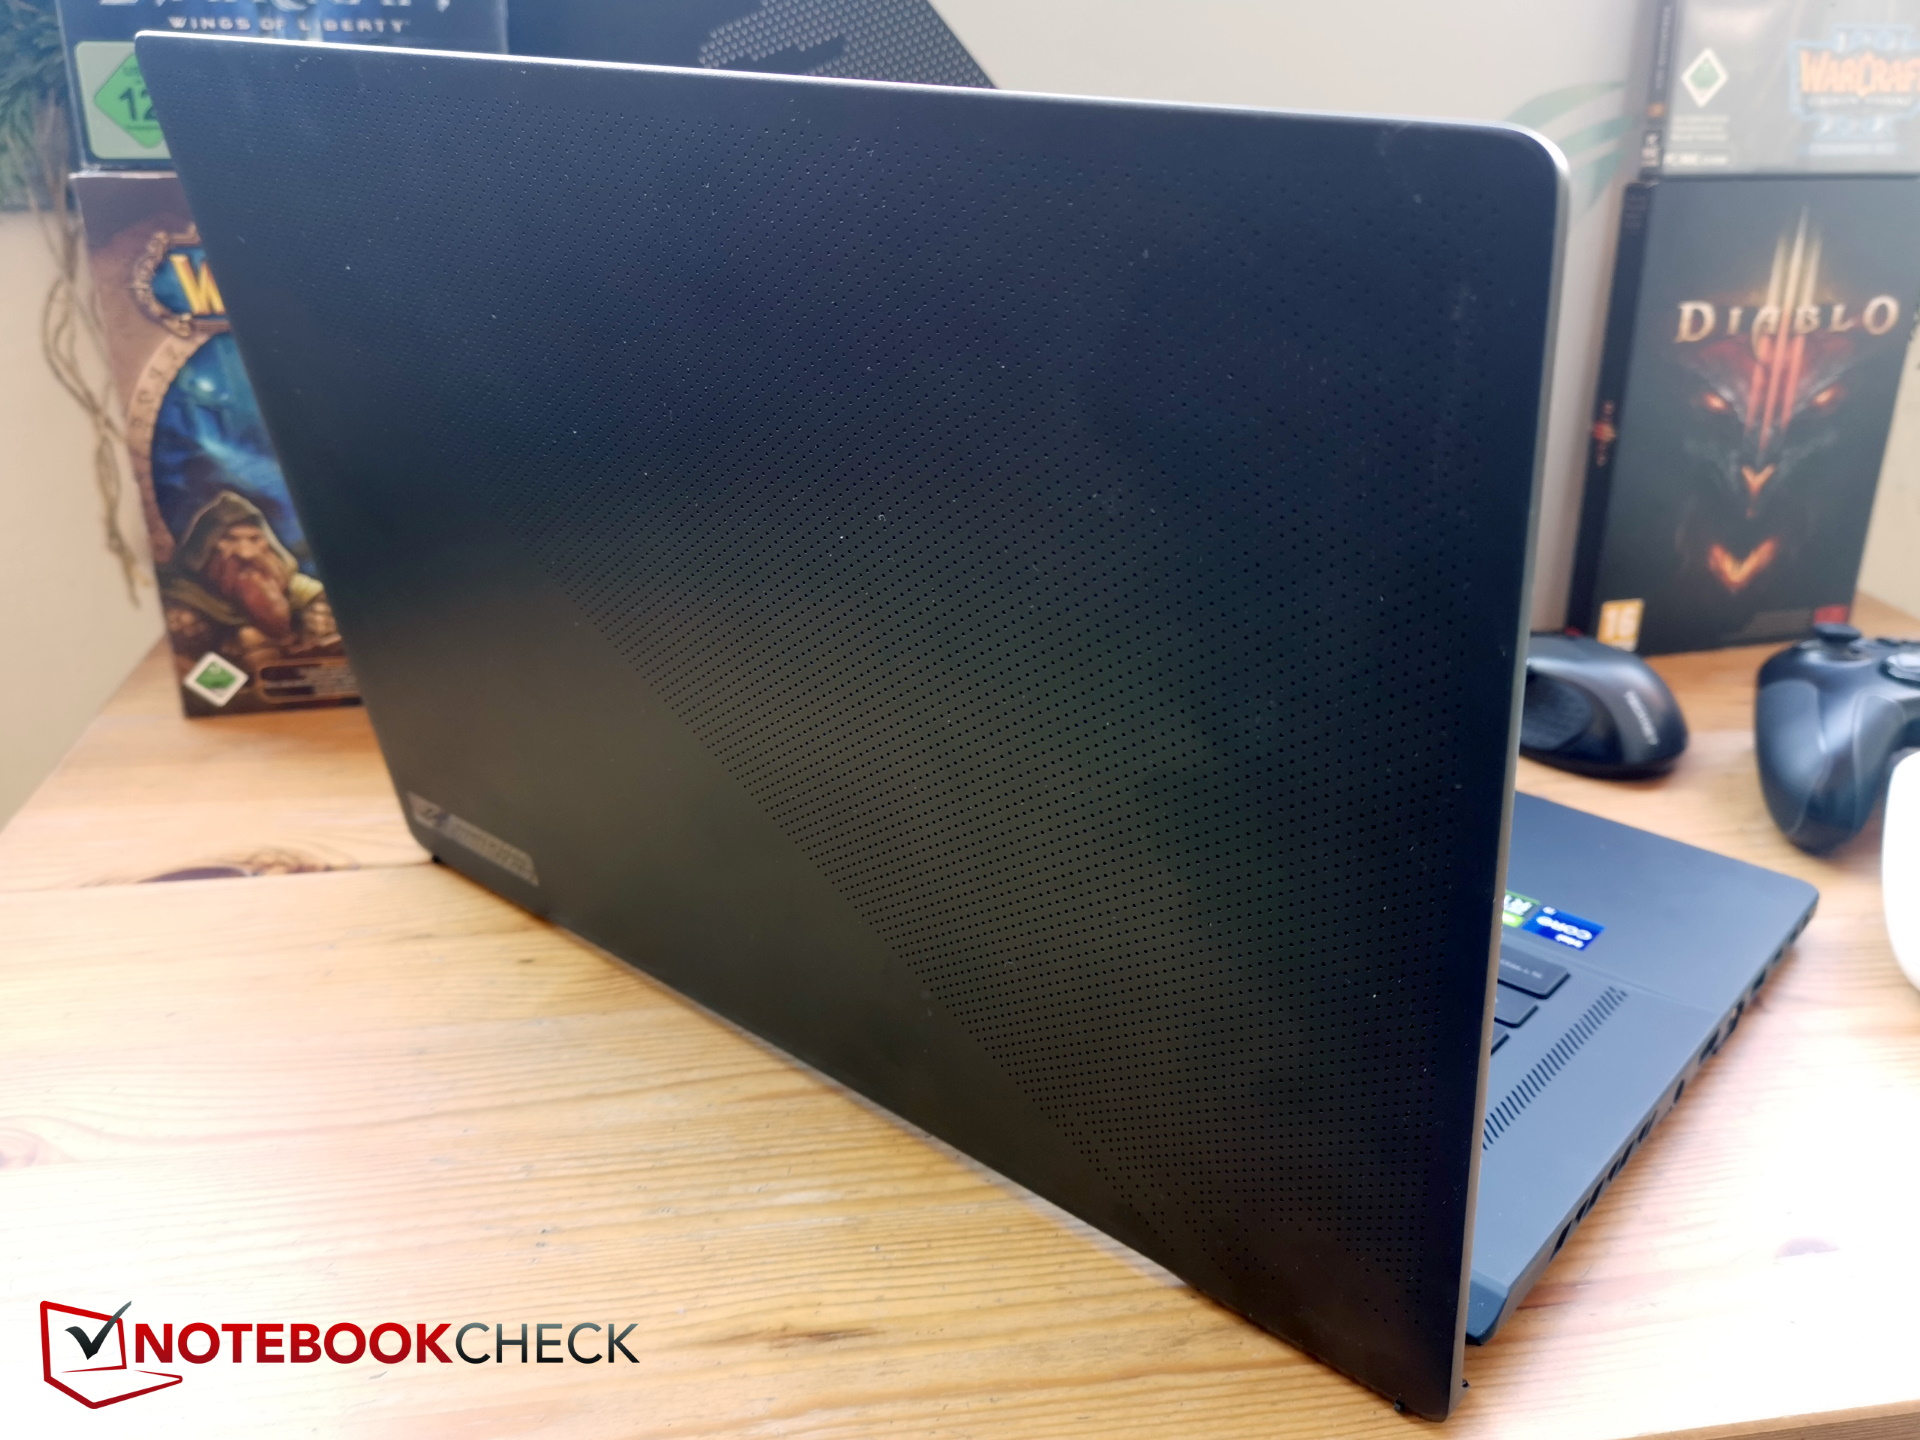
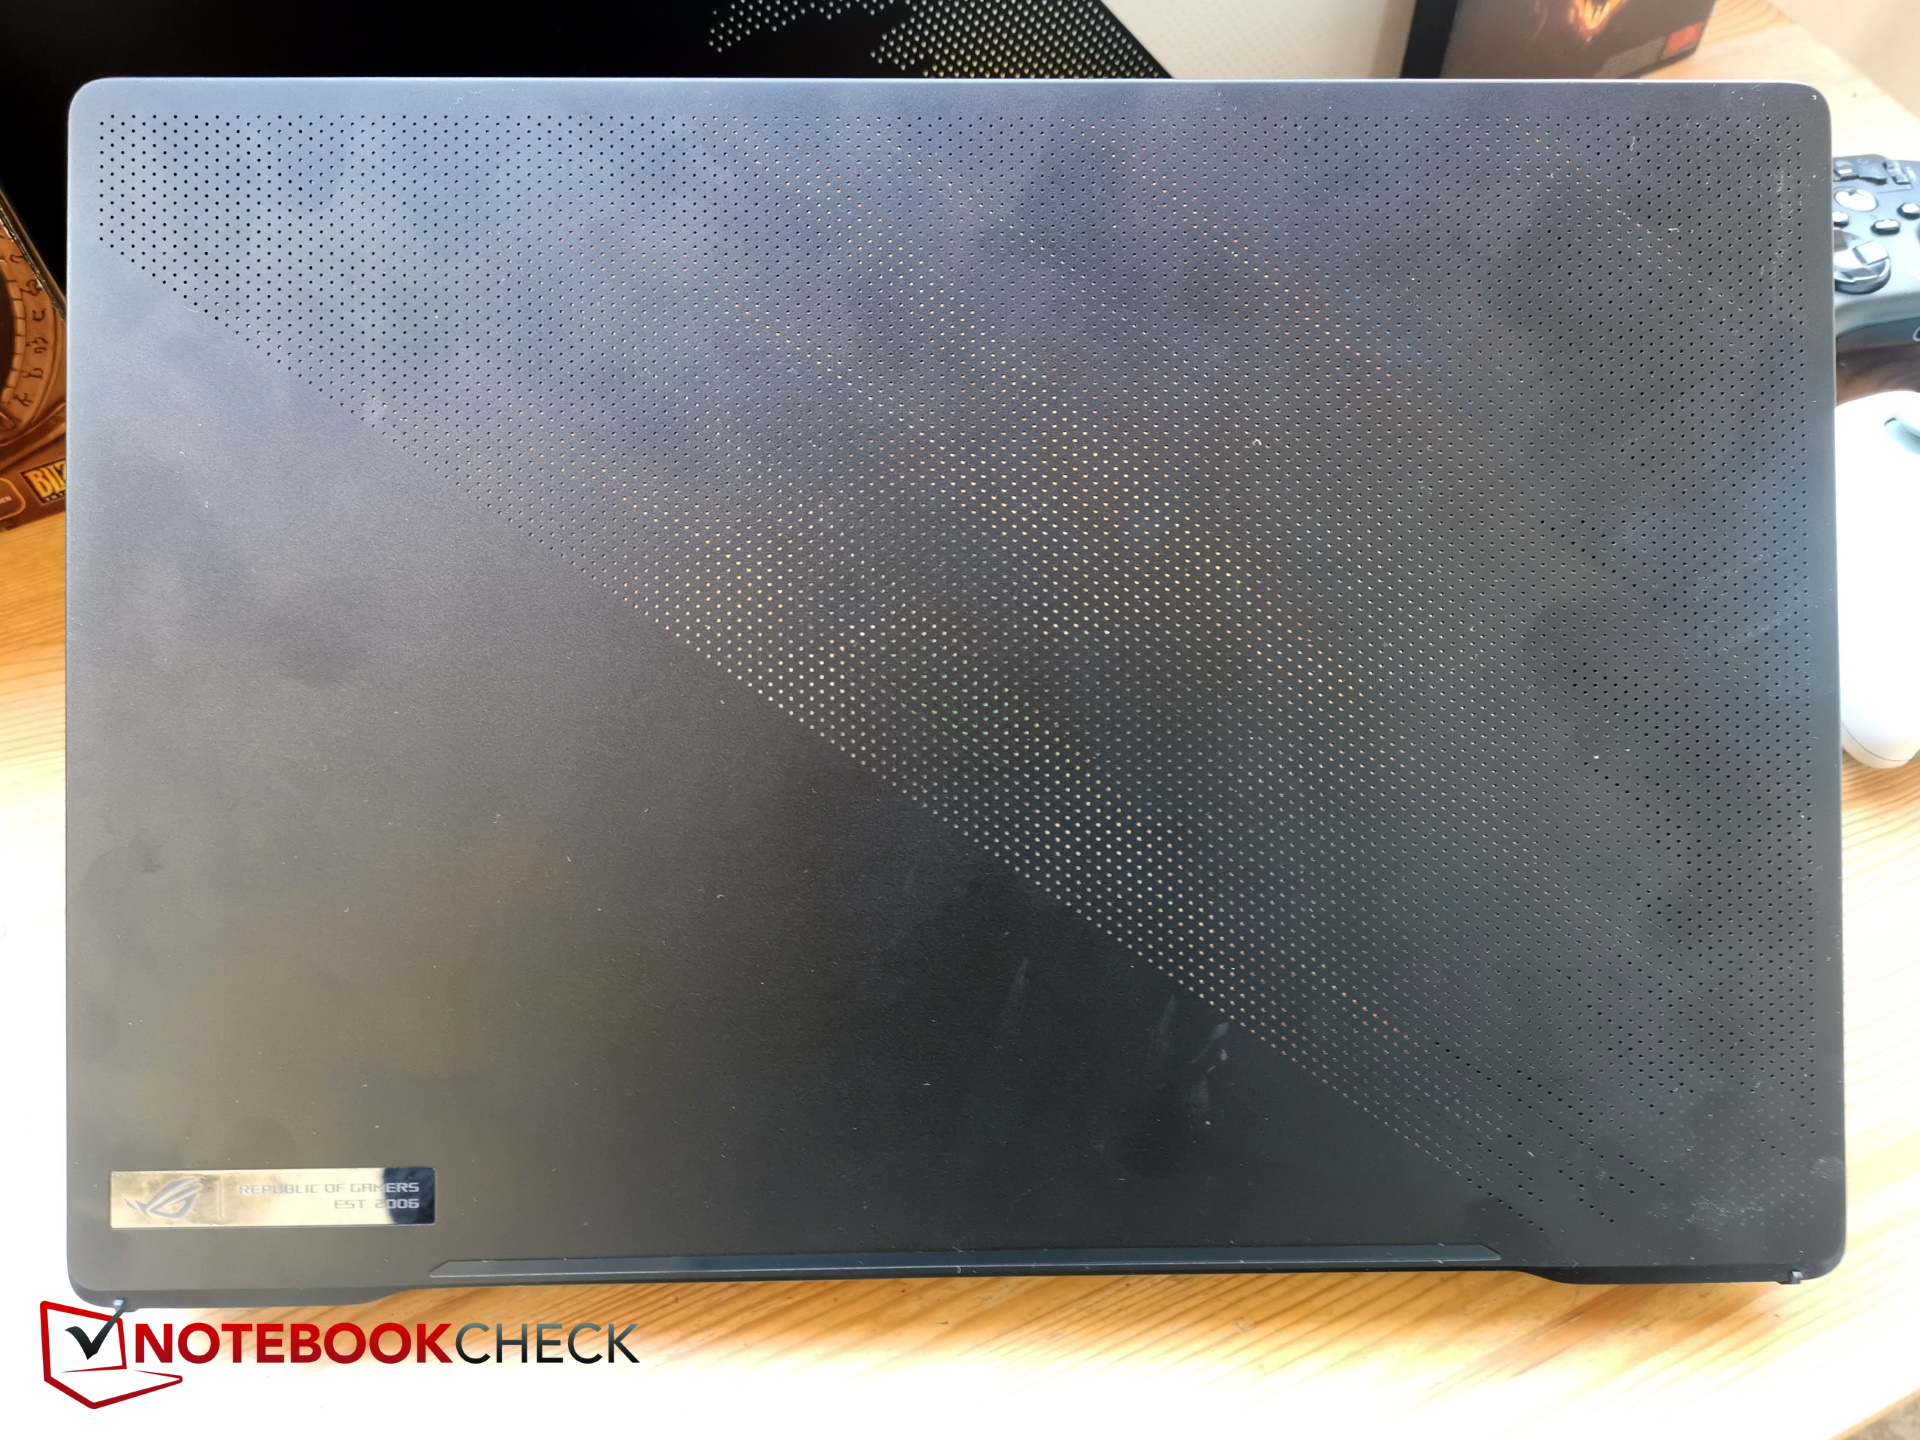
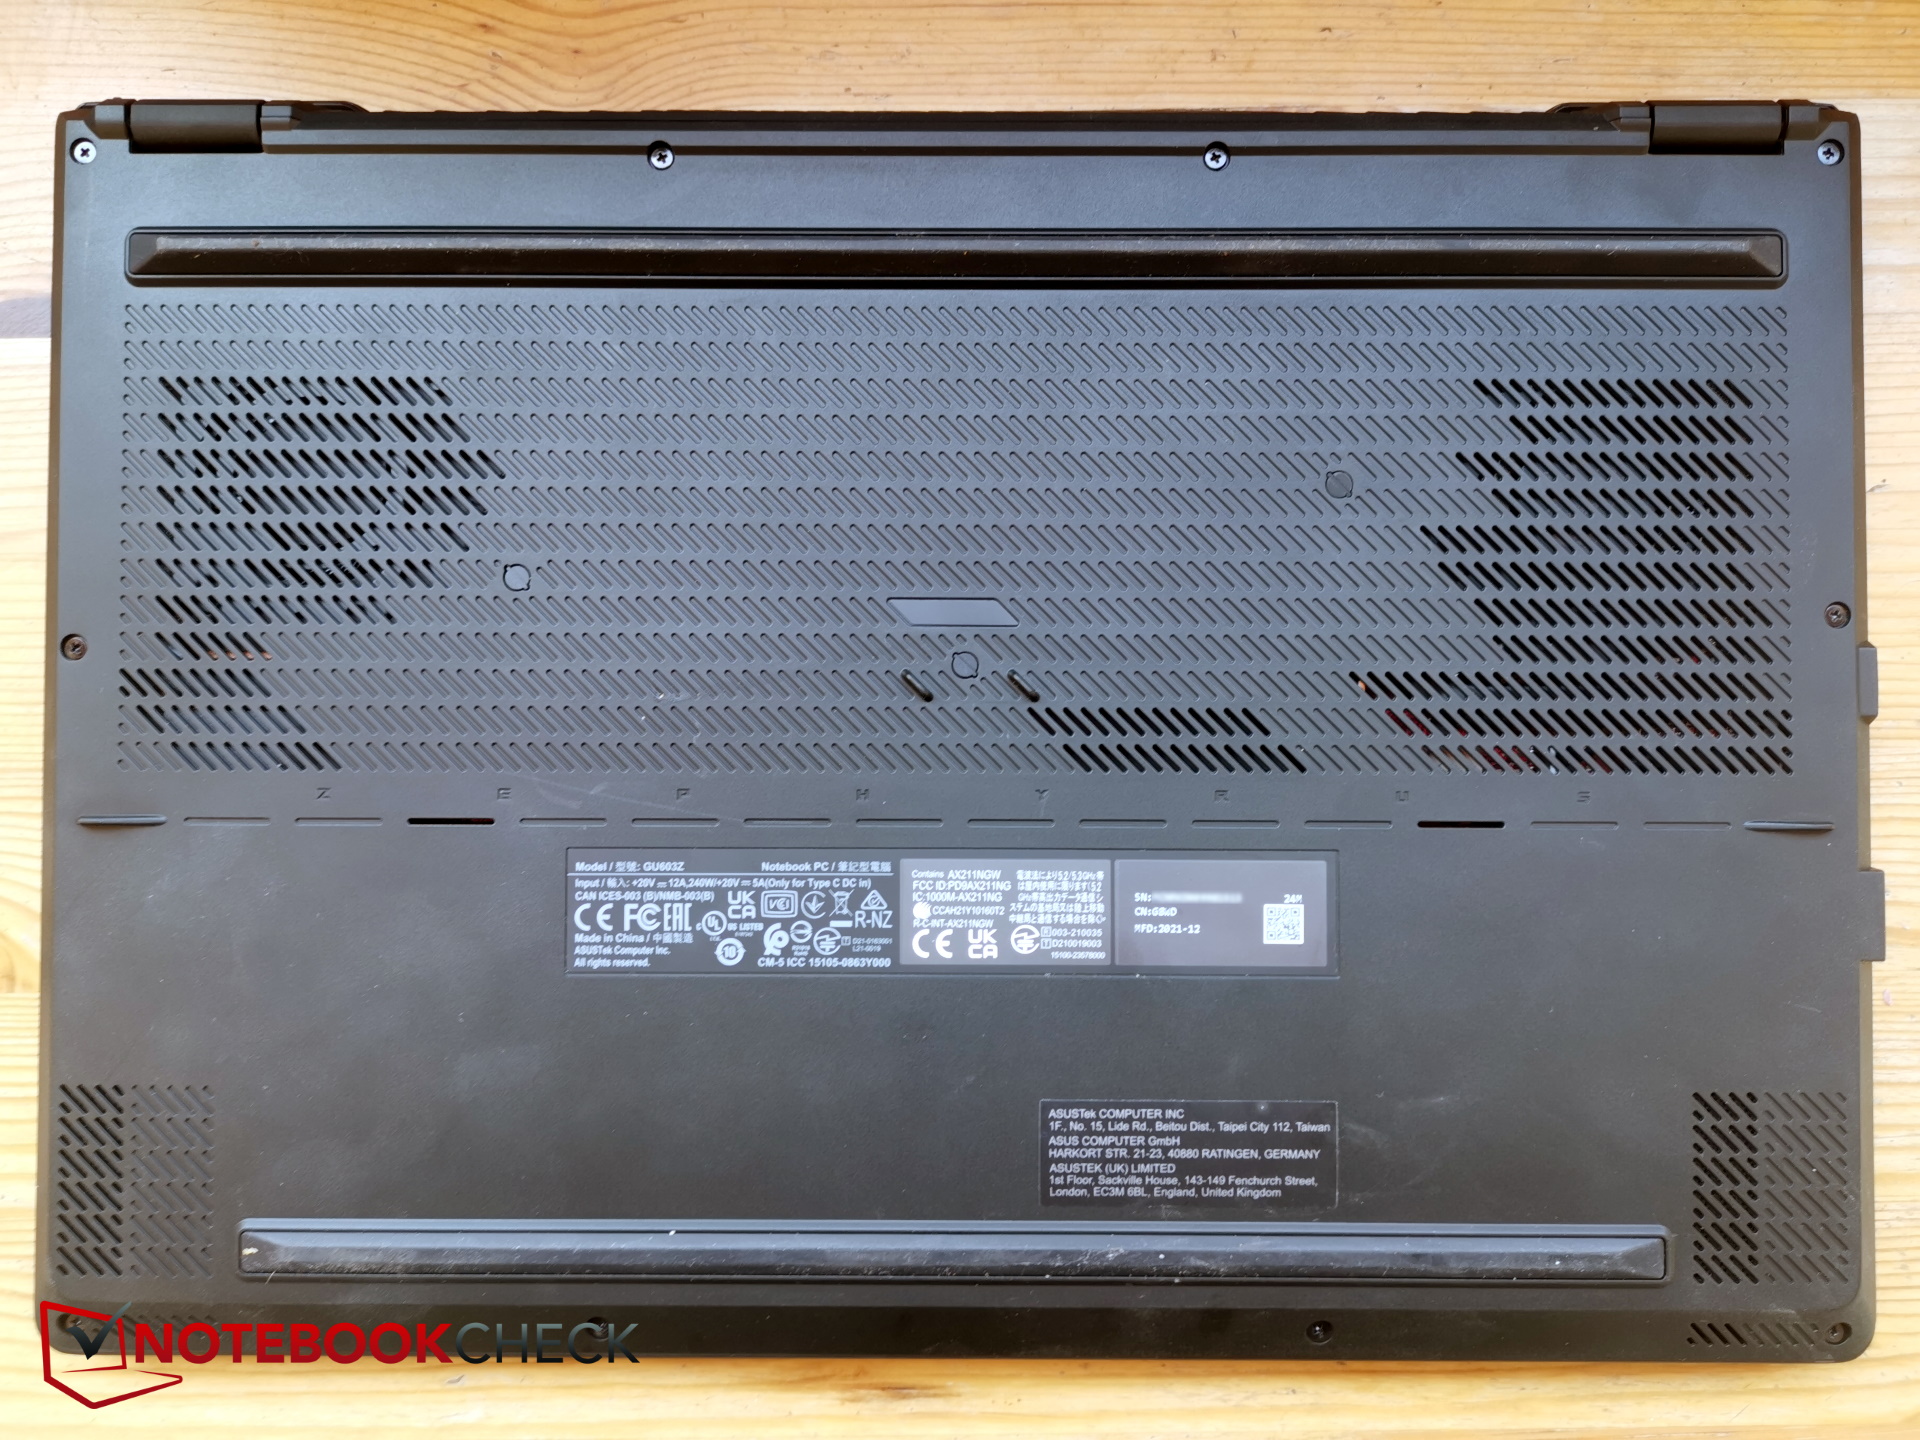
Case - Slim 16-inch gaming laptop
Since practically nothing has changed in the case, we refer you to our test of the M16 from 2021, which gives detailed descriptions of the case, maintenance options, and input devices.
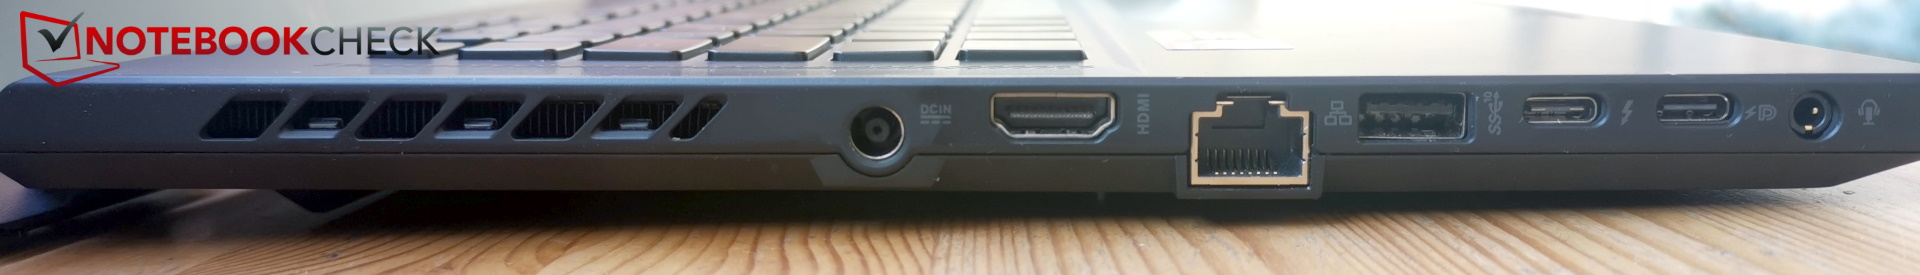
Connection Equipment - HDMI 2.1 and Thunderbolt 4

SD Card Reader
The SC card reader is limited to microSD cards, but at least our AV PRO microSD 128 GB V60 fits snugly without sticking out. Compared to the predecessor, which already performed well, the speed is again slightly increased.
| SD Card Reader | |
| average JPG Copy Test (av. of 3 runs) | |
| Asus ROG Zephyrus M16 GU603Z | |
| Average of class Gaming (19 - 202, n=100, last 2 years) | |
| Asus ROG Zephyrus M16 GU603H (AV PRO microSD 128 GB V60) | |
| Corsair Voyager a1600 (AV Pro SD microSD 128 GB V60) | |
| SCHENKER Vision 16 Pro RTX 3070 Ti (AV Pro V60) | |
| SCHENKER XMG Focus 16 (i7-12700H, RTX 3060) (AV Pro SD microSD 128 GB V60) | |
| maximum AS SSD Seq Read Test (1GB) | |
| Asus ROG Zephyrus M16 GU603Z | |
| Asus ROG Zephyrus M16 GU603H (AV PRO microSD 128 GB V60) | |
| Average of class Gaming (25.8 - 269, n=94, last 2 years) | |
| Corsair Voyager a1600 (AV Pro SD microSD 128 GB V60) | |
| SCHENKER XMG Focus 16 (i7-12700H, RTX 3060) (AV Pro SD microSD 128 GB V60) | |
| SCHENKER Vision 16 Pro RTX 3070 Ti (AV Pro V60) | |
Communication
Asus uses the Intel AX211 module, which also supports the 6-Ghz network. Compared to the MediaTek module from the predecessor, the transfer rates increase significantly. The performance is very constant.
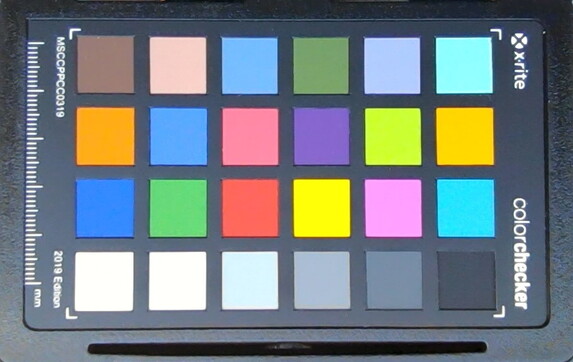
Webcam


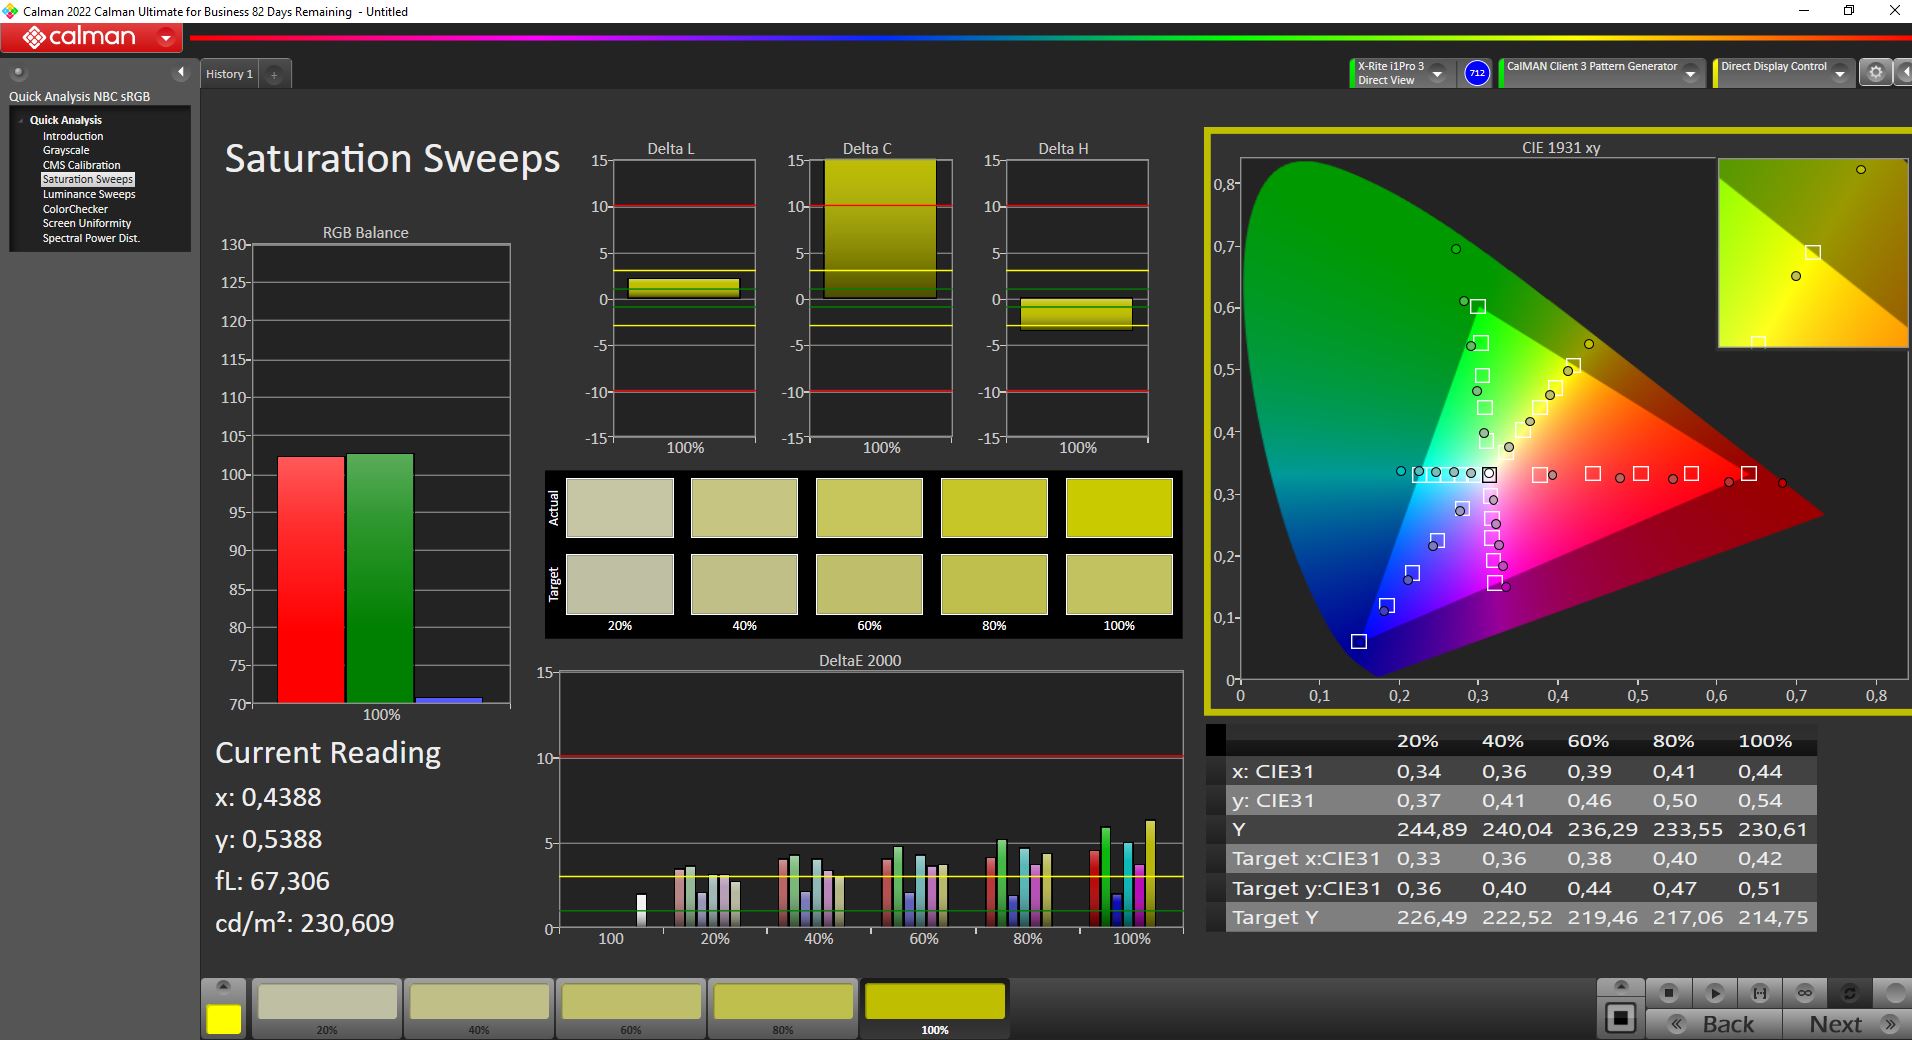
Display - 16 inches with QHD+ and 165 Hz
Even though it shares the same basic specs (16 in, IPS, 16:10, 2,560 x 1,600, 165 Hz) with the predecessor, Asus uses a different panel now. Instead of using a panel from AU Optronics, this time it comes from BOE. While the panel is even slightly brighter (481 nits), the brightness distribution is more uneven, and the brightness decreases considerably toward the left bottom corner in particular. Due to a significantly improved black value, the contrast value increases positively.
The response times are relatively fast, although the predecessor responded even faster here. PWM is not used for brightness control, and some slight screen bleeding is only apparent in dark scenes.

| |||||||||||||||||||||||||
Brightness Distribution: 82 %
Center on Battery: 484 cd/m²
Contrast: 2367:1 (Black: 0.21 cd/m²)
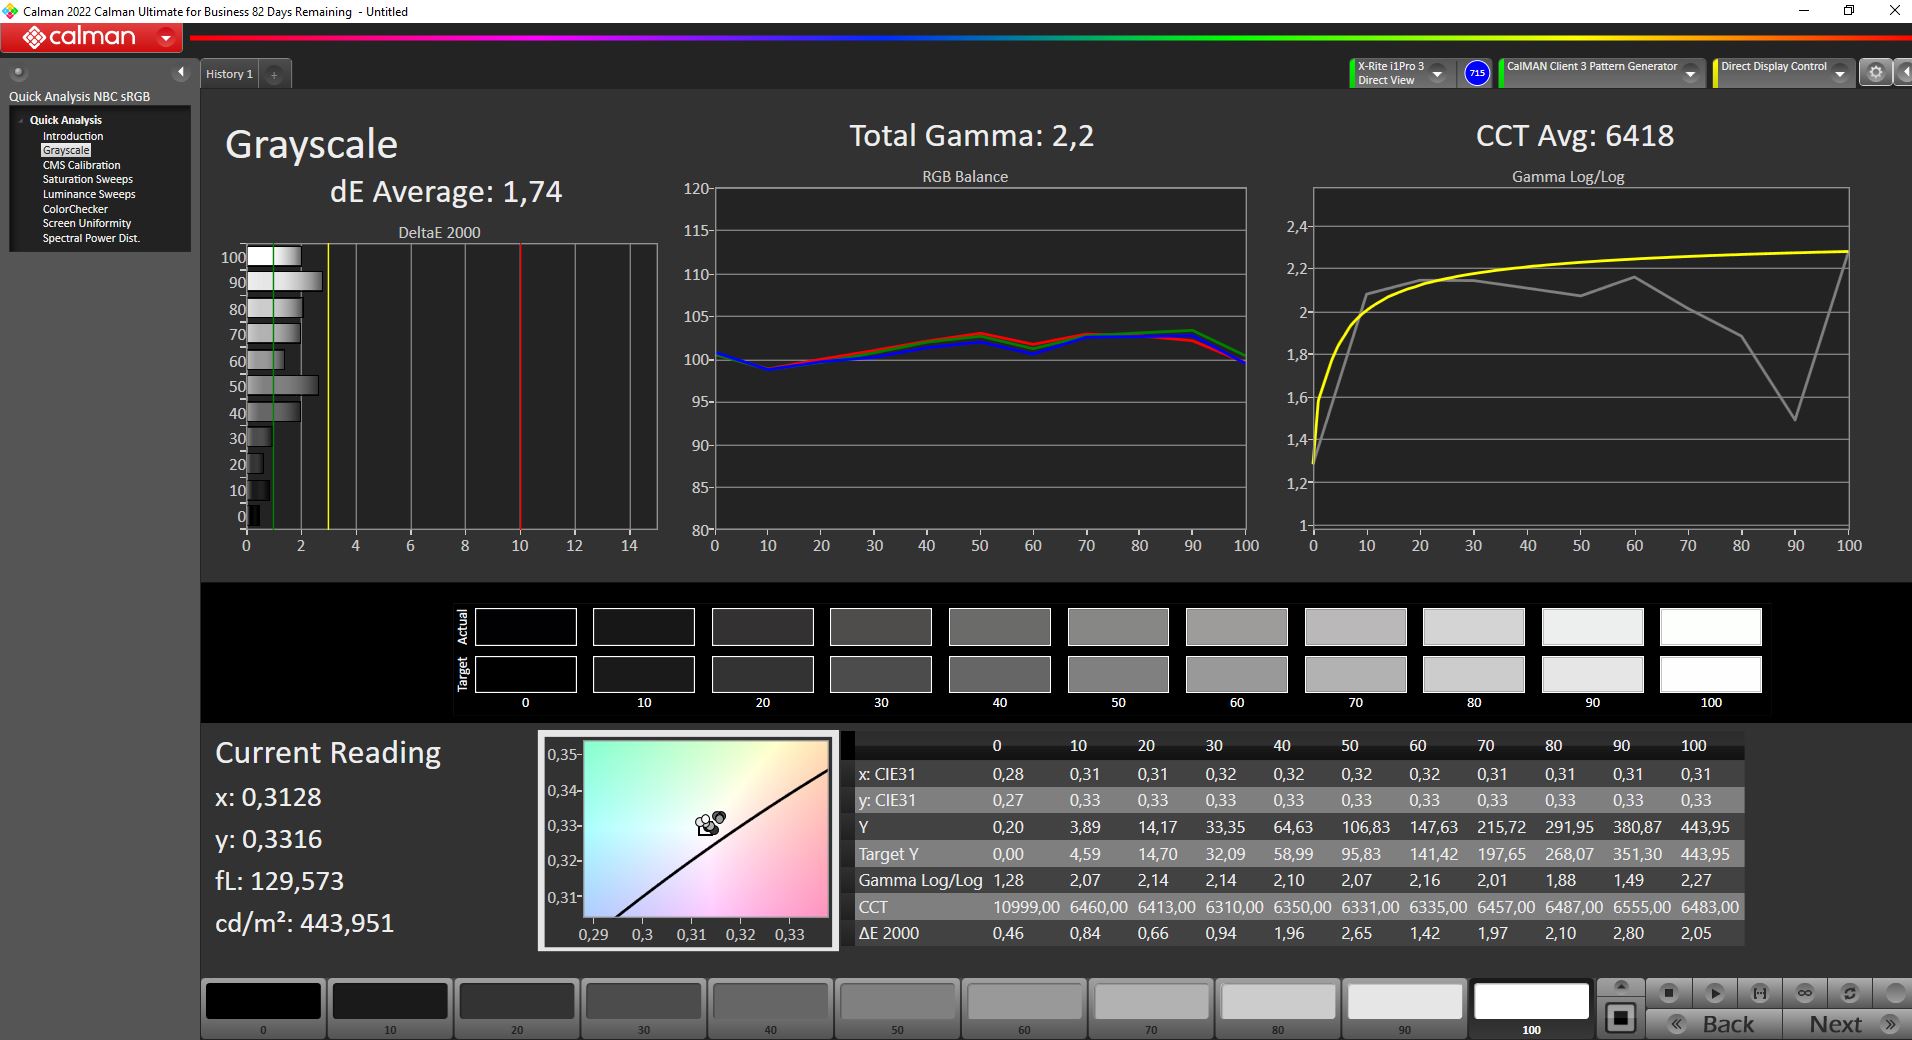
ΔE Color 3.53 | 0.5-29.43 Ø5, calibrated: 3.53
ΔE Greyscale 1.74 | 0.57-98 Ø5.3
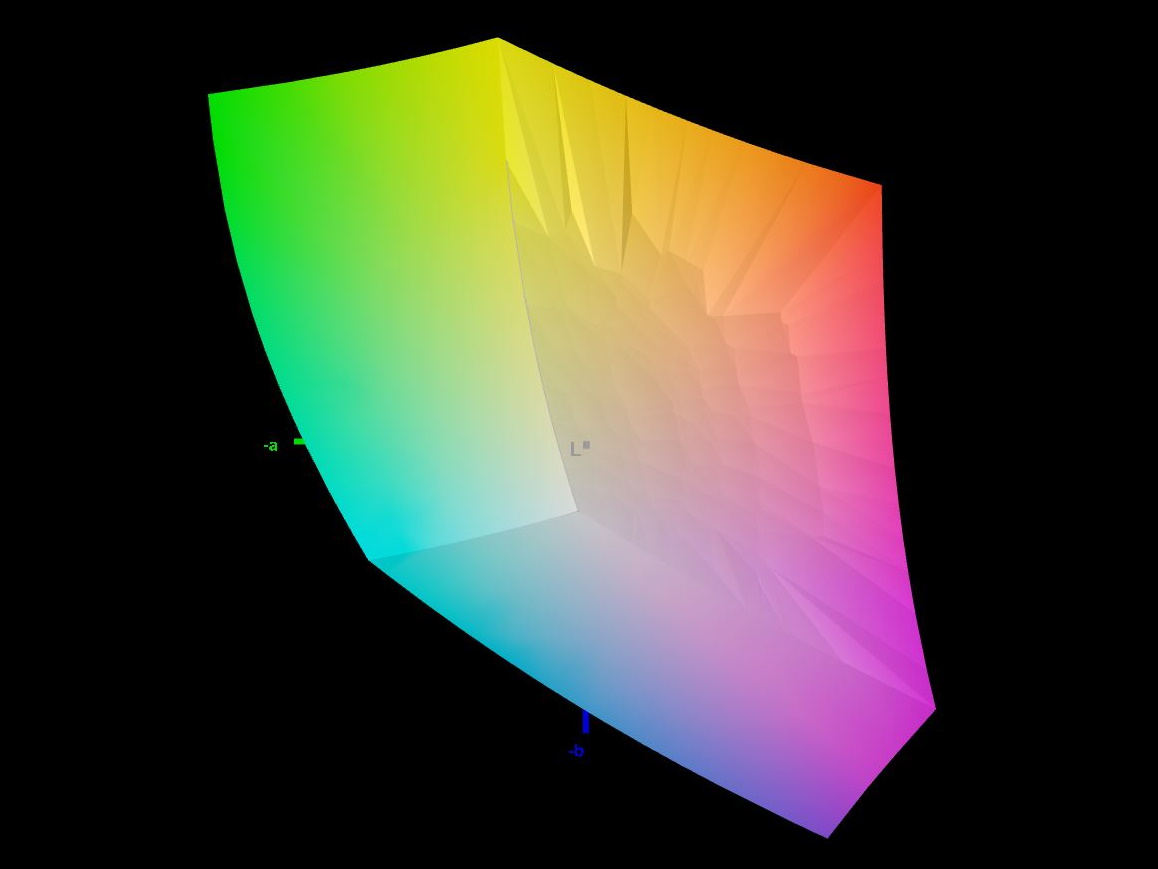
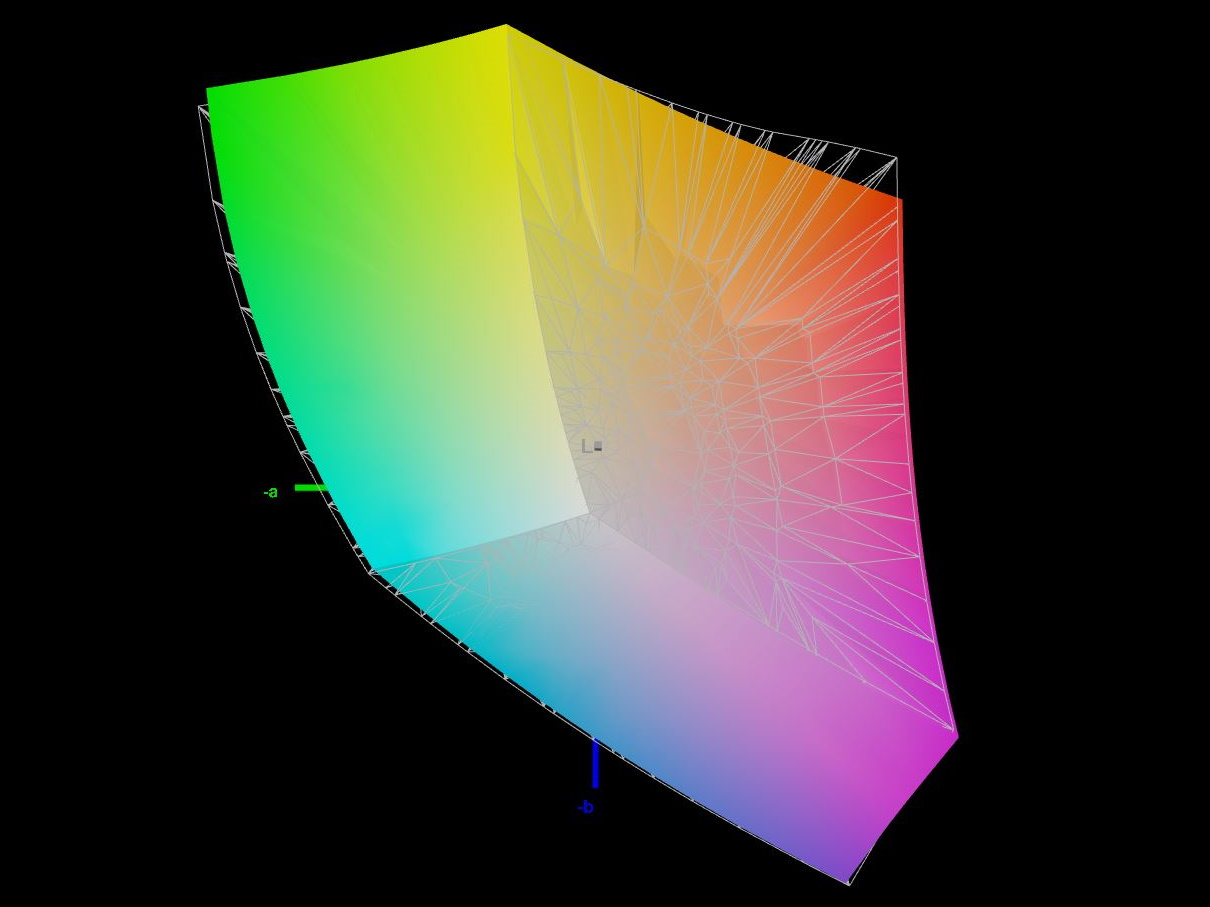
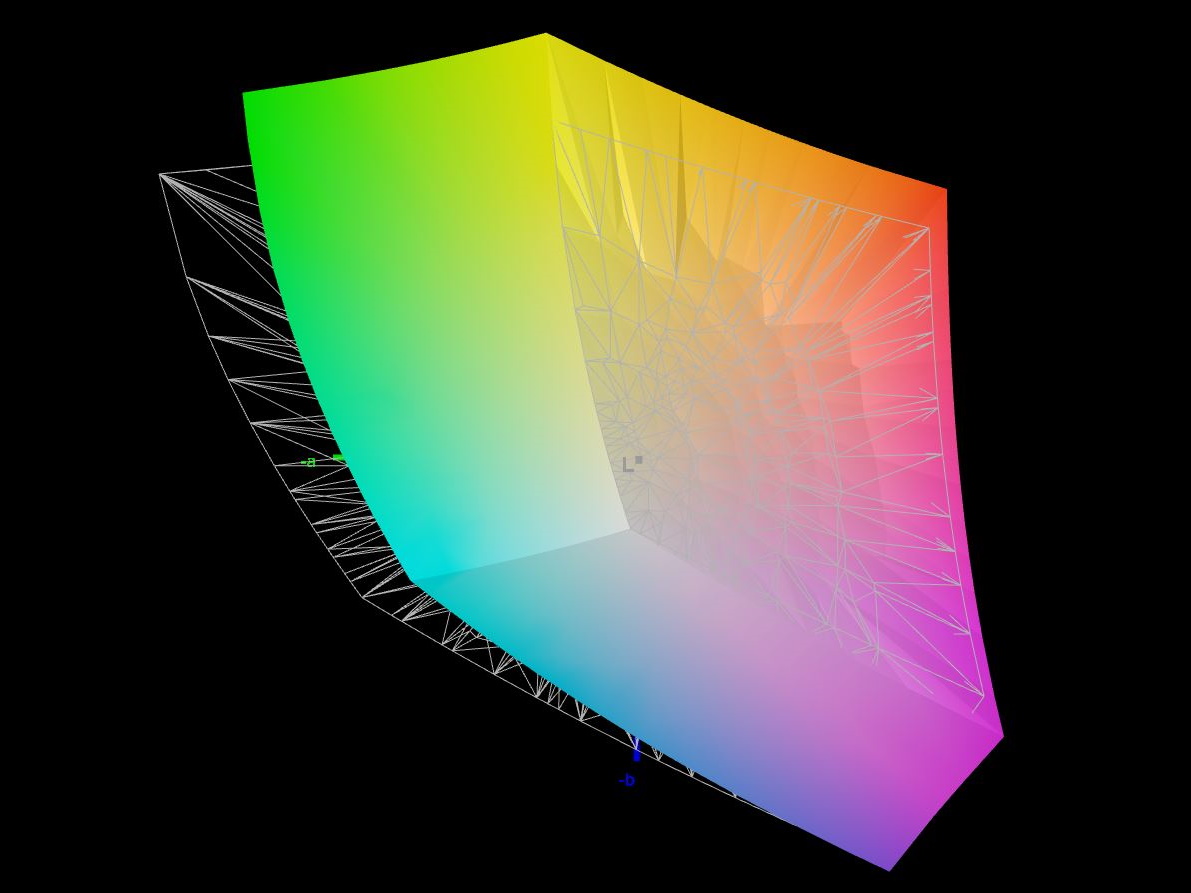
83.1% AdobeRGB 1998 (Argyll 2.2.0 3D)
98.5% sRGB (Argyll 2.2.0 3D)
92.8% Display P3 (Argyll 2.2.0 3D)
Gamma: 2.2
| Asus ROG Zephyrus M16 GU603Z BOE0A0B (BOE CQ NE160QDM-NY3), IPS, 2560x1600, 16.00 | Asus ROG Zephyrus M16 GU603H AU Optronics AUOC199, IPS, 2560x1600, 16.00 | SCHENKER Vision 16 Pro RTX 3070 Ti N160QDM-NZ1, IPS, 2560x1600, 16.00 | Lenovo Legion 5 Pro 16ARH7H RTX 3070 Ti BOE CQ NE160QDM-NY1, IPS, 2560x1600, 16.00 | SCHENKER XMG Focus 16 (i7-12700H, RTX 3060) BOE NE16oQDM-NY1, IPS, 2560x1600, 16.00 | Corsair Voyager a1600 BOE0A3B, IPS, 2560x1600, 16.00 | |
|---|---|---|---|---|---|---|
| Display | -15% | -15% | -14% | -14% | ||
| Display P3 Coverage | 92.8 | 68.7 -26% | 67.3 -27% | 68.3 -26% | 68.7 -26% | |
| sRGB Coverage | 98.5 | 96.7 -2% | 96.1 -2% | 96.6 -2% | 98.2 0% | |
| AdobeRGB 1998 Coverage | 83.1 | 70 -16% | 69.5 -16% | 70.6 -15% | 70.1 -16% | |
| Response Times | 39% | -37% | -51% | -62% | -36% | |
| Response Time Grey 50% / Grey 80% * | 7.6 ? | 4.8 ? 37% | 14.3 ? -88% | 14.4 ? -89% | 16.4 ? -116% | 13 ? -71% |
| Response Time Black / White * | 10 ? | 6 ? 40% | 8.6 ? 14% | 11.2 ? -12% | 10.8 ? -8% | 10 ? -0% |
| PWM Frequency | ||||||
| Screen | -28% | -34% | -11% | -40% | -21% | |
| Brightness middle | 497 | 448 -10% | 364 -27% | 522.8 5% | 460 -7% | 355 -29% |
| Brightness | 481 | 446 -7% | 347 -28% | 503 5% | 442 -8% | 340 -29% |
| Brightness Distribution | 82 | 86 5% | 89 9% | 84 2% | 89 9% | 91 11% |
| Black Level * | 0.21 | 0.48 -129% | 0.3 -43% | 0.41 -95% | 0.32 -52% | 0.53 -152% |
| Contrast | 2367 | 933 -61% | 1213 -49% | 1275 -46% | 1438 -39% | 670 -72% |
| Colorchecker dE 2000 * | 3.53 | 2.76 22% | 3.3 7% | 2.47 30% | 3.65 -3% | 2.43 31% |
| Colorchecker dE 2000 max. * | 6.15 | 7.09 -15% | 6.6 -7% | 6.56 -7% | 7.49 -22% | 4.31 30% |
| Colorchecker dE 2000 calibrated * | 3.53 | 2.86 19% | 2.5 29% | 0.61 83% | 3.65 -3% | 1.14 68% |
| Greyscale dE 2000 * | 1.74 | 3.1 -78% | 5.2 -199% | 3 -72% | 5.87 -237% | 2.62 -51% |
| Gamma | 2.2 100% | 2.153 102% | 2.14 103% | 2.27 97% | 2.42 91% | 2.28 96% |
| CCT | 6418 101% | 6826 95% | 6331 103% | 6719 97% | 6711 97% | 6909 94% |
| Color Space (Percent of AdobeRGB 1998) | 87 | |||||
| Color Space (Percent of sRGB) | 100 | |||||
| Total Average (Program / Settings) | 6% /
-16% | -29% /
-30% | -26% /
-17% | -39% /
-38% | -24% /
-22% |
* ... smaller is better
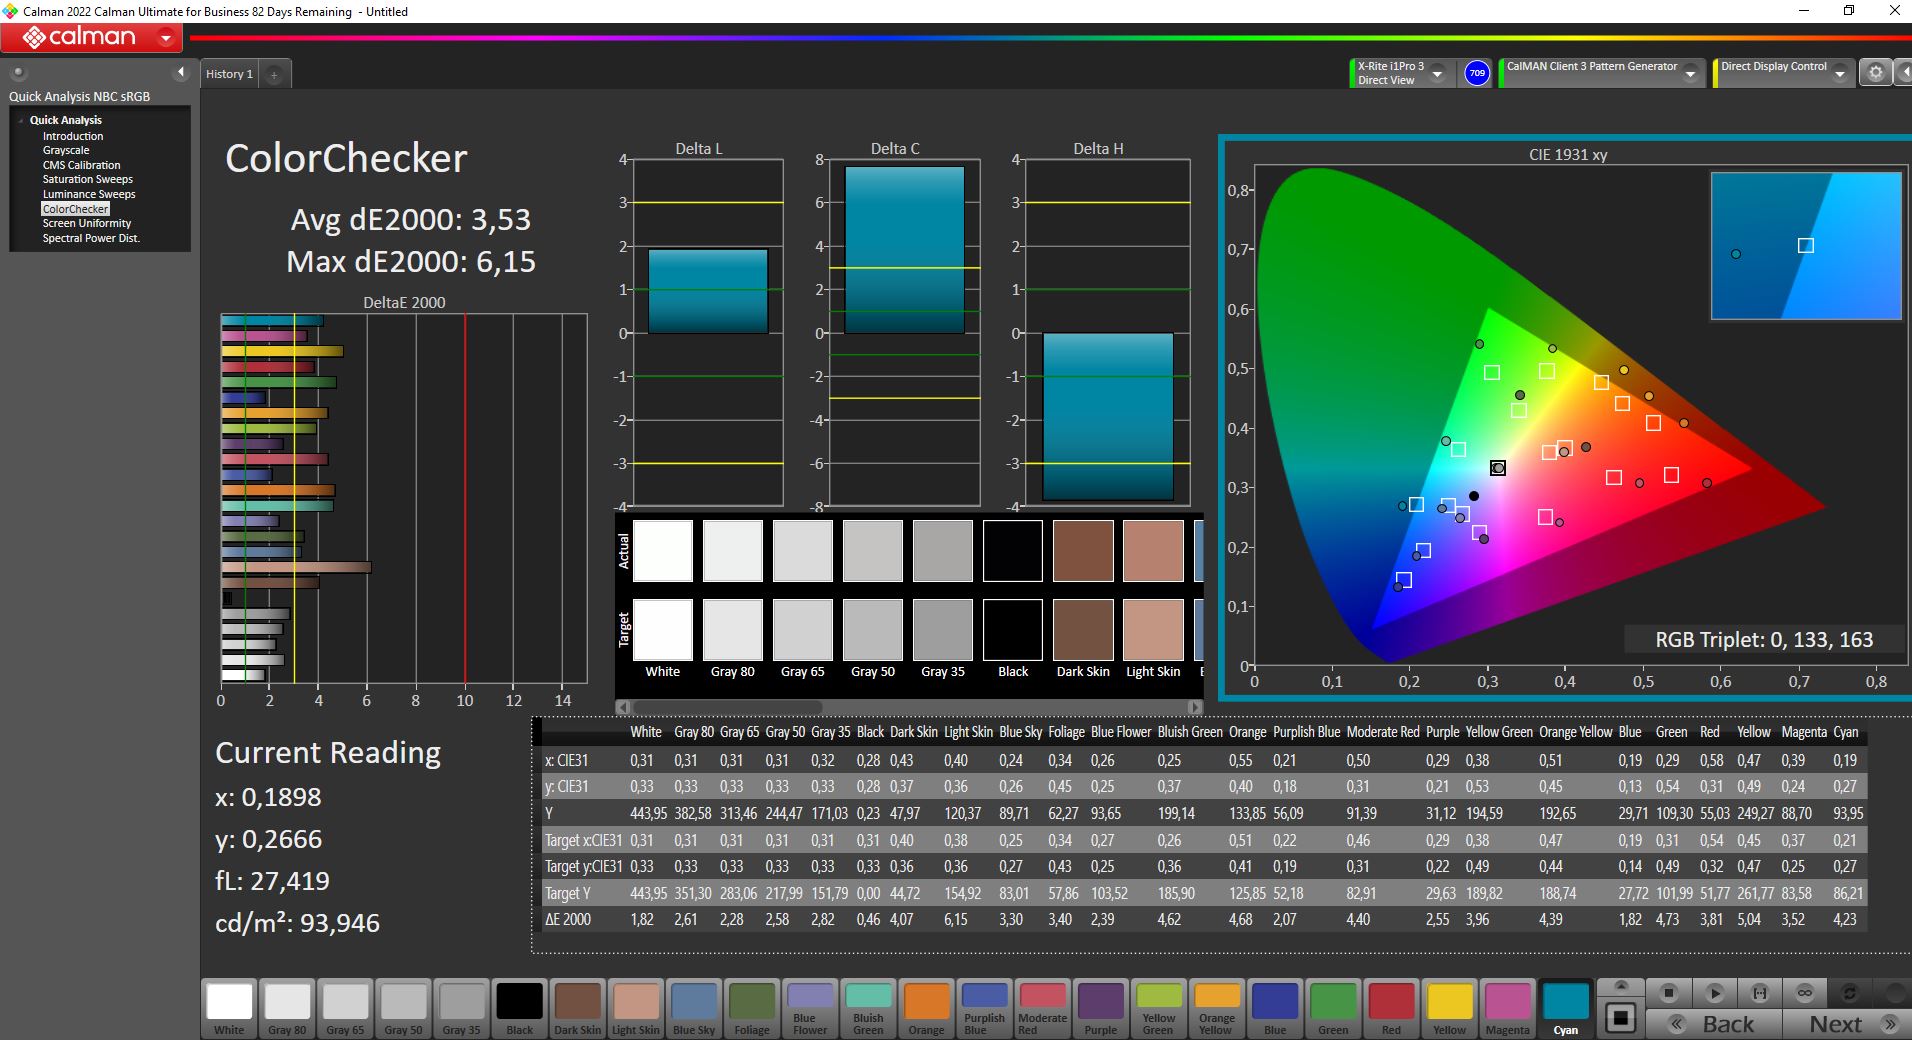
Asus advertises 100% coverage of the DCI-P3 color space, but we measure "only" 92.8%. The AdobeRGB color space is still covered to 83%. At least in the test field of our selected competitors, this still results in the top position. Overall, the display is also suited for professional editing of pictures and videos.
In the state of delivery, the panel is already well calibrated. At only 1.74, the DeltaE value of the gray scale is particularly low. In the ColorChecker, our Portrait Display Calman Color Calibration tool measures slightly higher deviations. An additional calibration doesn't improve these values further, but rather messes up the grayscale that is already very good.
Display Response Times
| ↔ Response Time Black to White | ||
|---|---|---|
| 10 ms ... rise ↗ and fall ↘ combined | ↗ 4.6 ms rise | 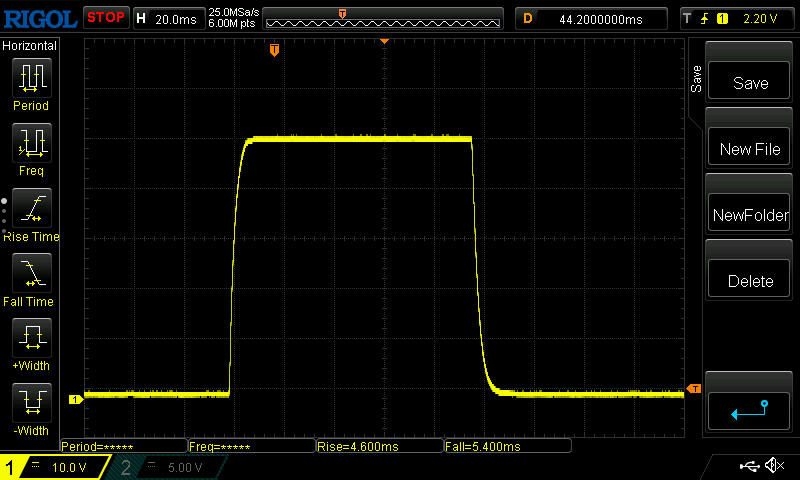 |
| ↘ 5.4 ms fall | ||
| The screen shows good response rates in our tests, but may be too slow for competitive gamers. In comparison, all tested devices range from 0.1 (minimum) to 240 (maximum) ms. » 22 % of all devices are better. This means that the measured response time is better than the average of all tested devices (21.5 ms). | ||
| ↔ Response Time 50% Grey to 80% Grey | ||
| 7.6 ms ... rise ↗ and fall ↘ combined | ↗ 3.4 ms rise | 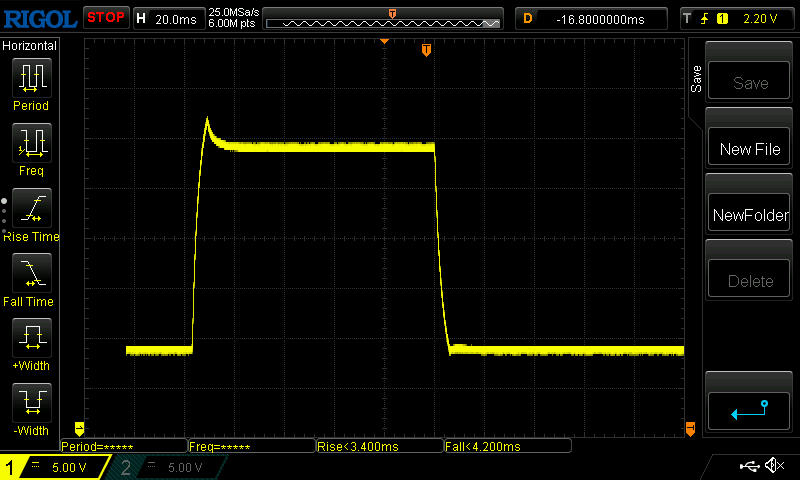 |
| ↘ 4.2 ms fall | ||
| The screen shows very fast response rates in our tests and should be very well suited for fast-paced gaming. In comparison, all tested devices range from 0.2 (minimum) to 636 (maximum) ms. » 15 % of all devices are better. This means that the measured response time is better than the average of all tested devices (33.7 ms). | ||
Screen Flickering / PWM (Pulse-Width Modulation)
| Screen flickering / PWM not detected |  | ||
In comparison: 53 % of all tested devices do not use PWM to dim the display. If PWM was detected, an average of 17900 (minimum: 5 - maximum: 3846000) Hz was measured. | |||
Despite the good brightness of the display, you should still avoid direct sunlight outdoors and make sure you look at the screen straight from the front, since otherwise the visibility drops quickly.

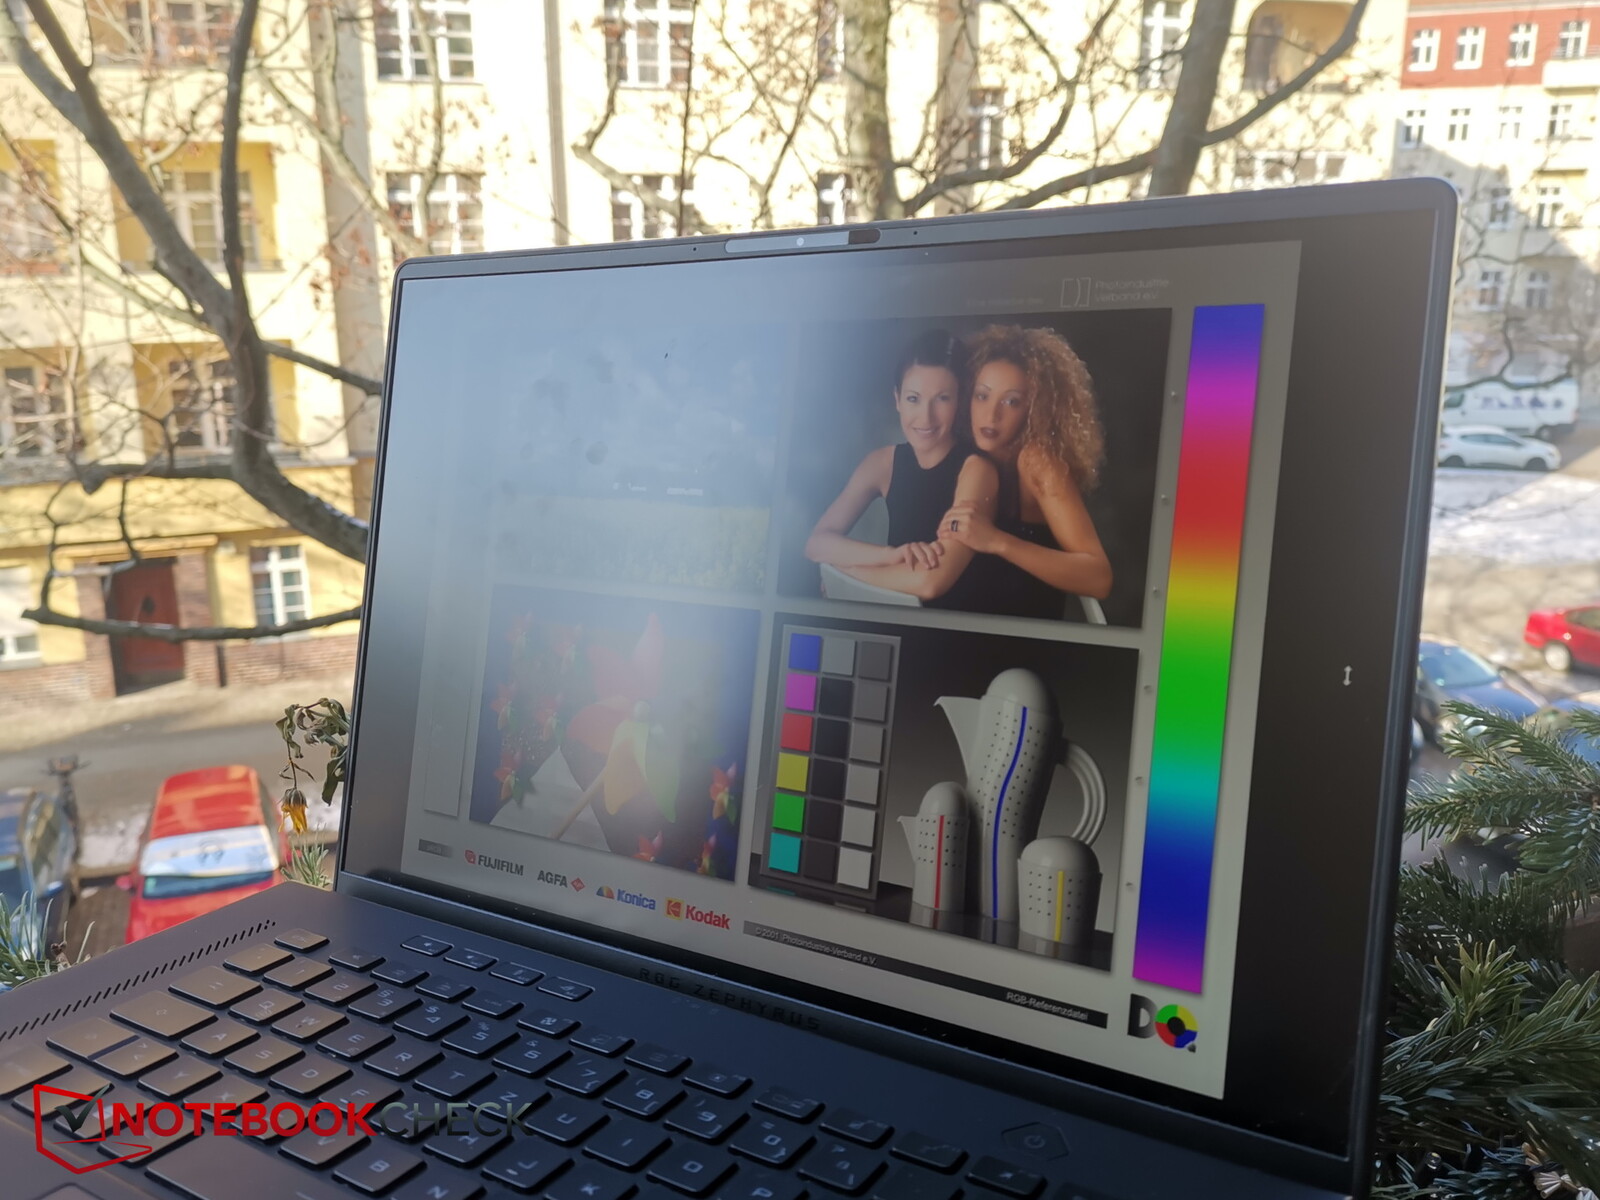
The display contents can be read easily even from extreme viewing angles. When looking at the screen from the sides, the brightness is lower than when looking from top or bottom viewing angles.

Performance - 120-Watt RTX 3070-Ti slightly below average
The ROG Zephyrus is available in various equipment configurations. The M16 is also supposed to be available with an Intel CPU of the 13th generation and RTX 40xx soon, while our test unit still uses a Core i9-12900H and RTX 3070 Ti.
Alternatively, almost anything is possible starting from the RTX 3050 Ti up to the RTX 3080 Ti. With the processor, you currently have the choice between the i7-12700H and our top model. The equipment is completed by 32 GB of RAM, but there are also numerous options available here.
Test Conditions
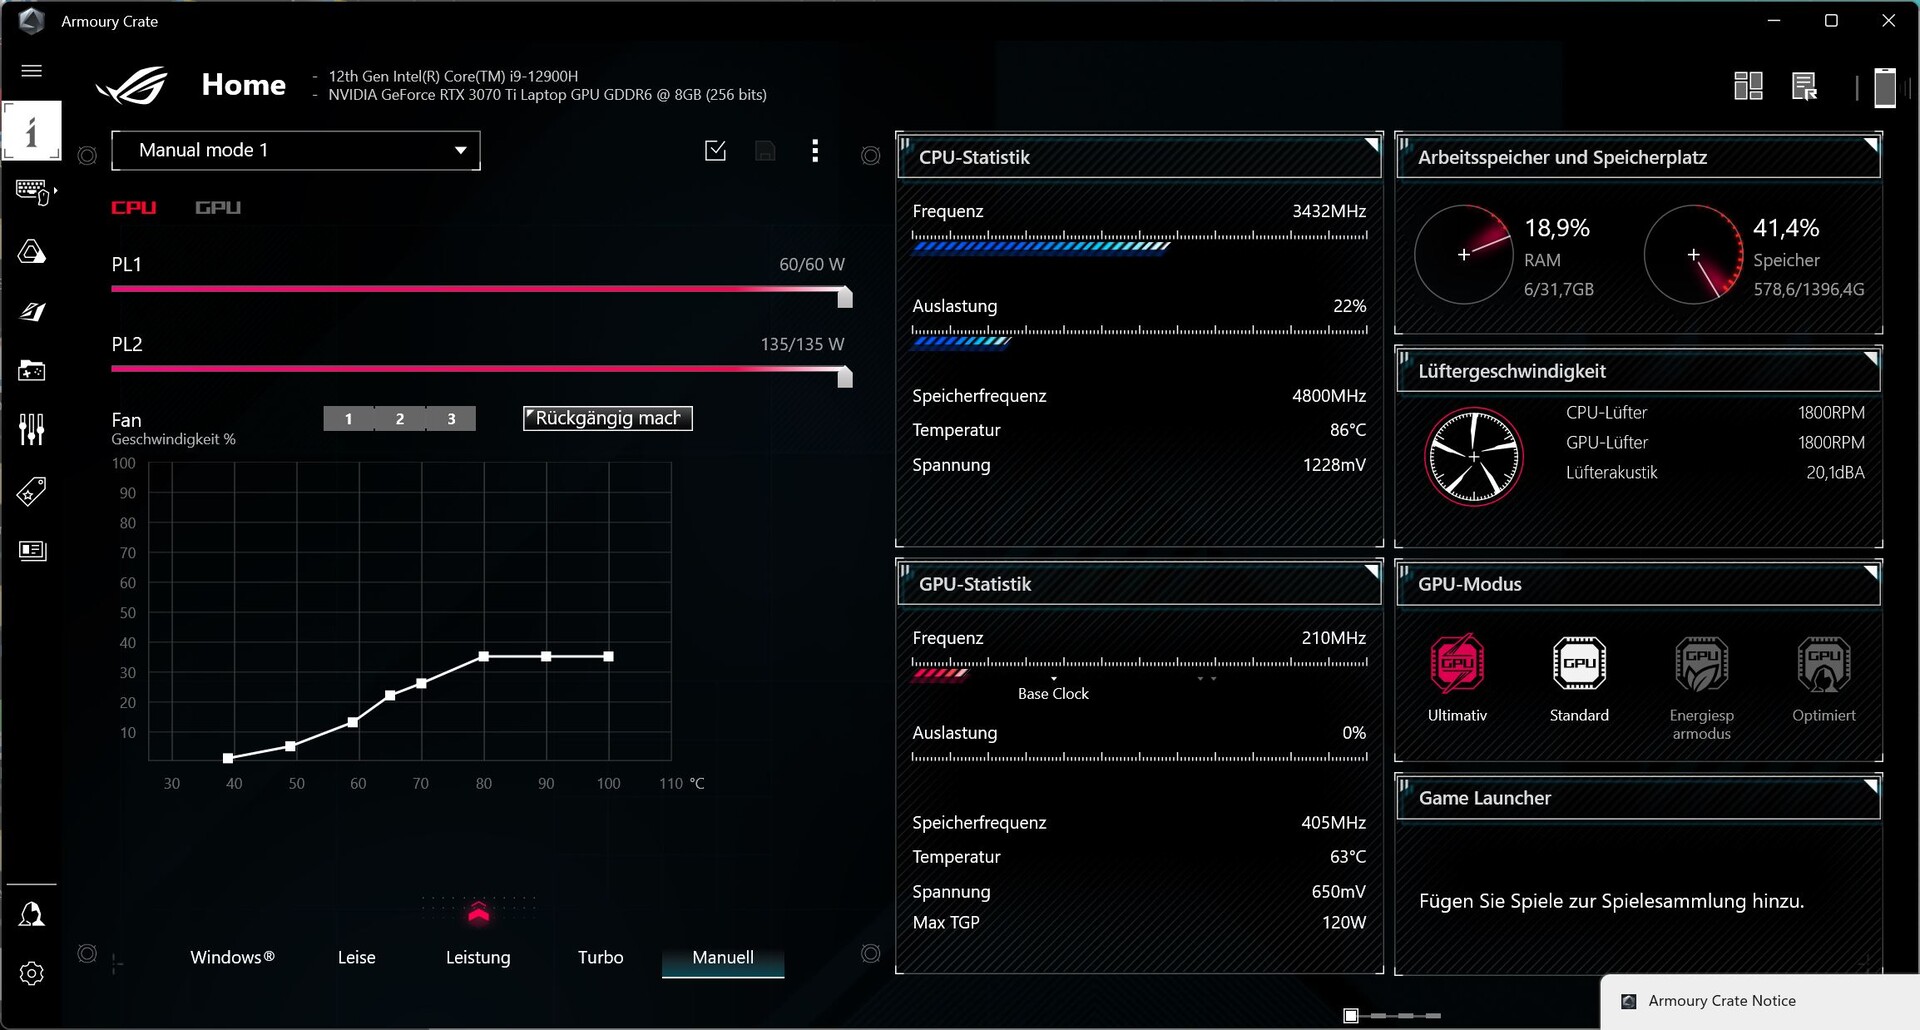
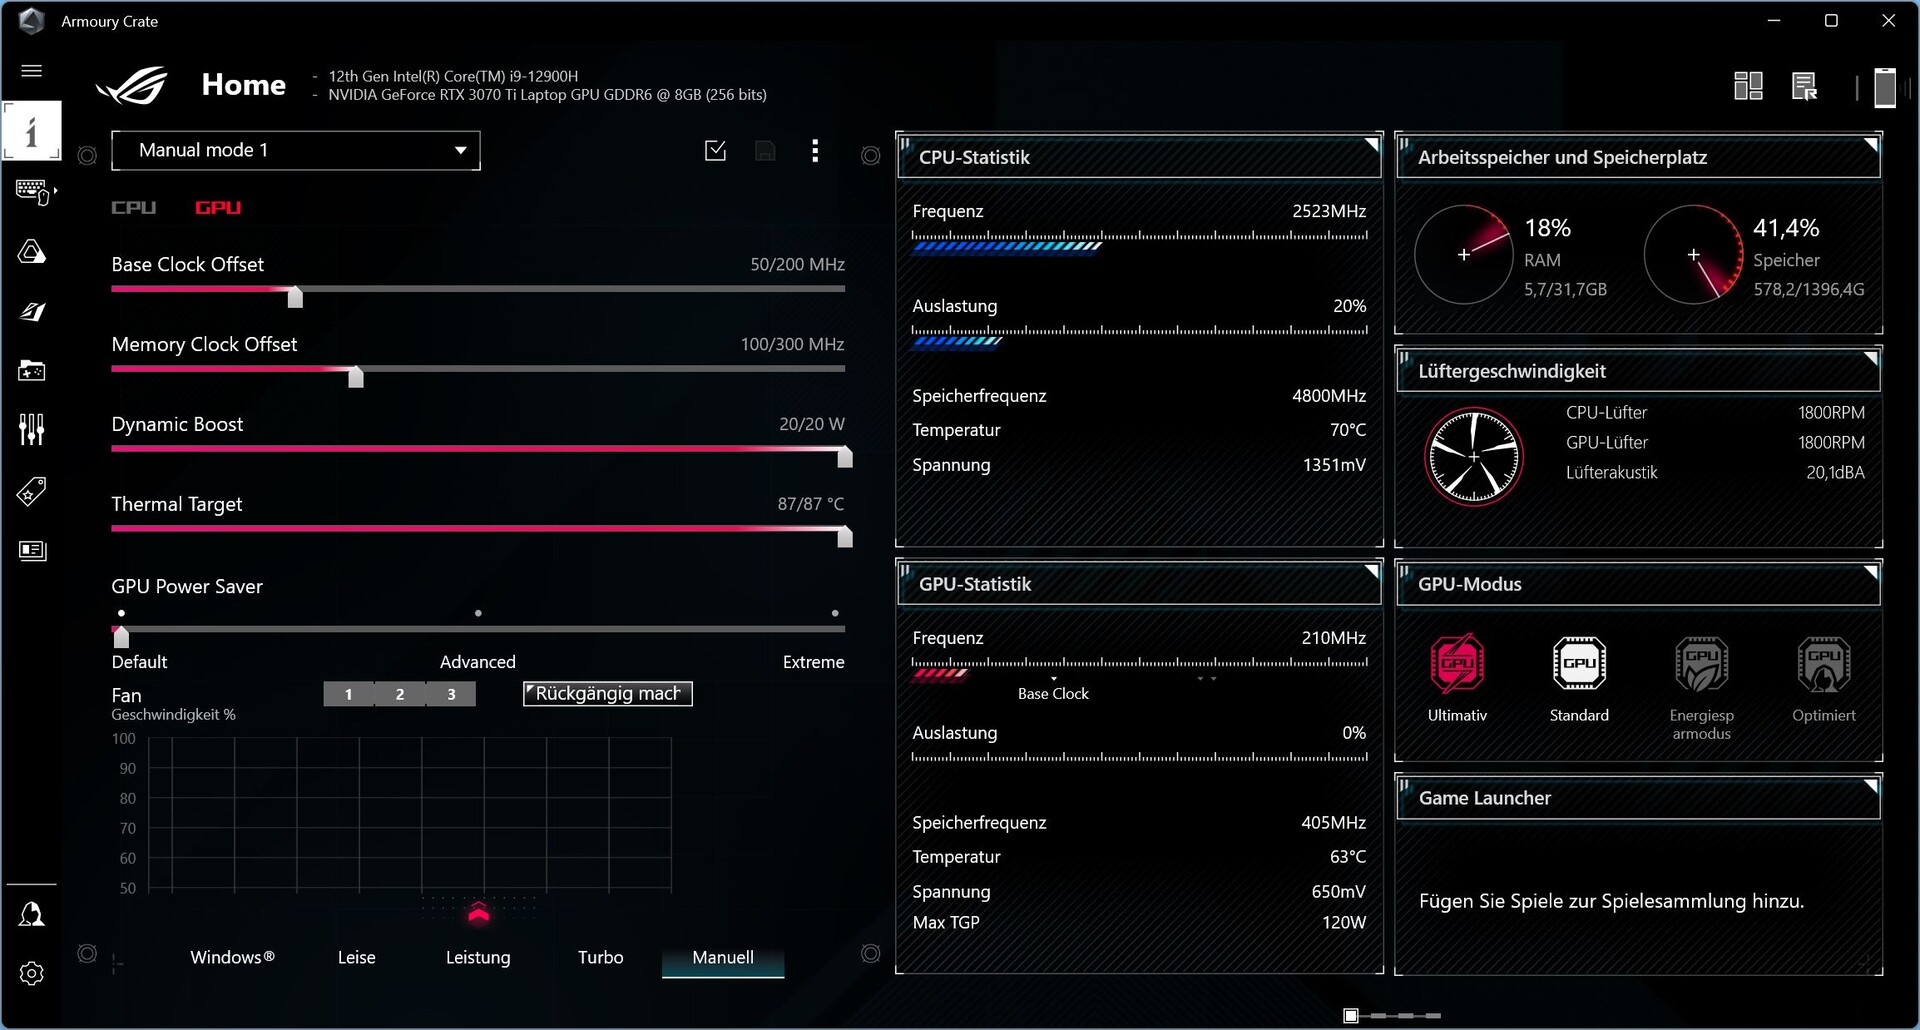
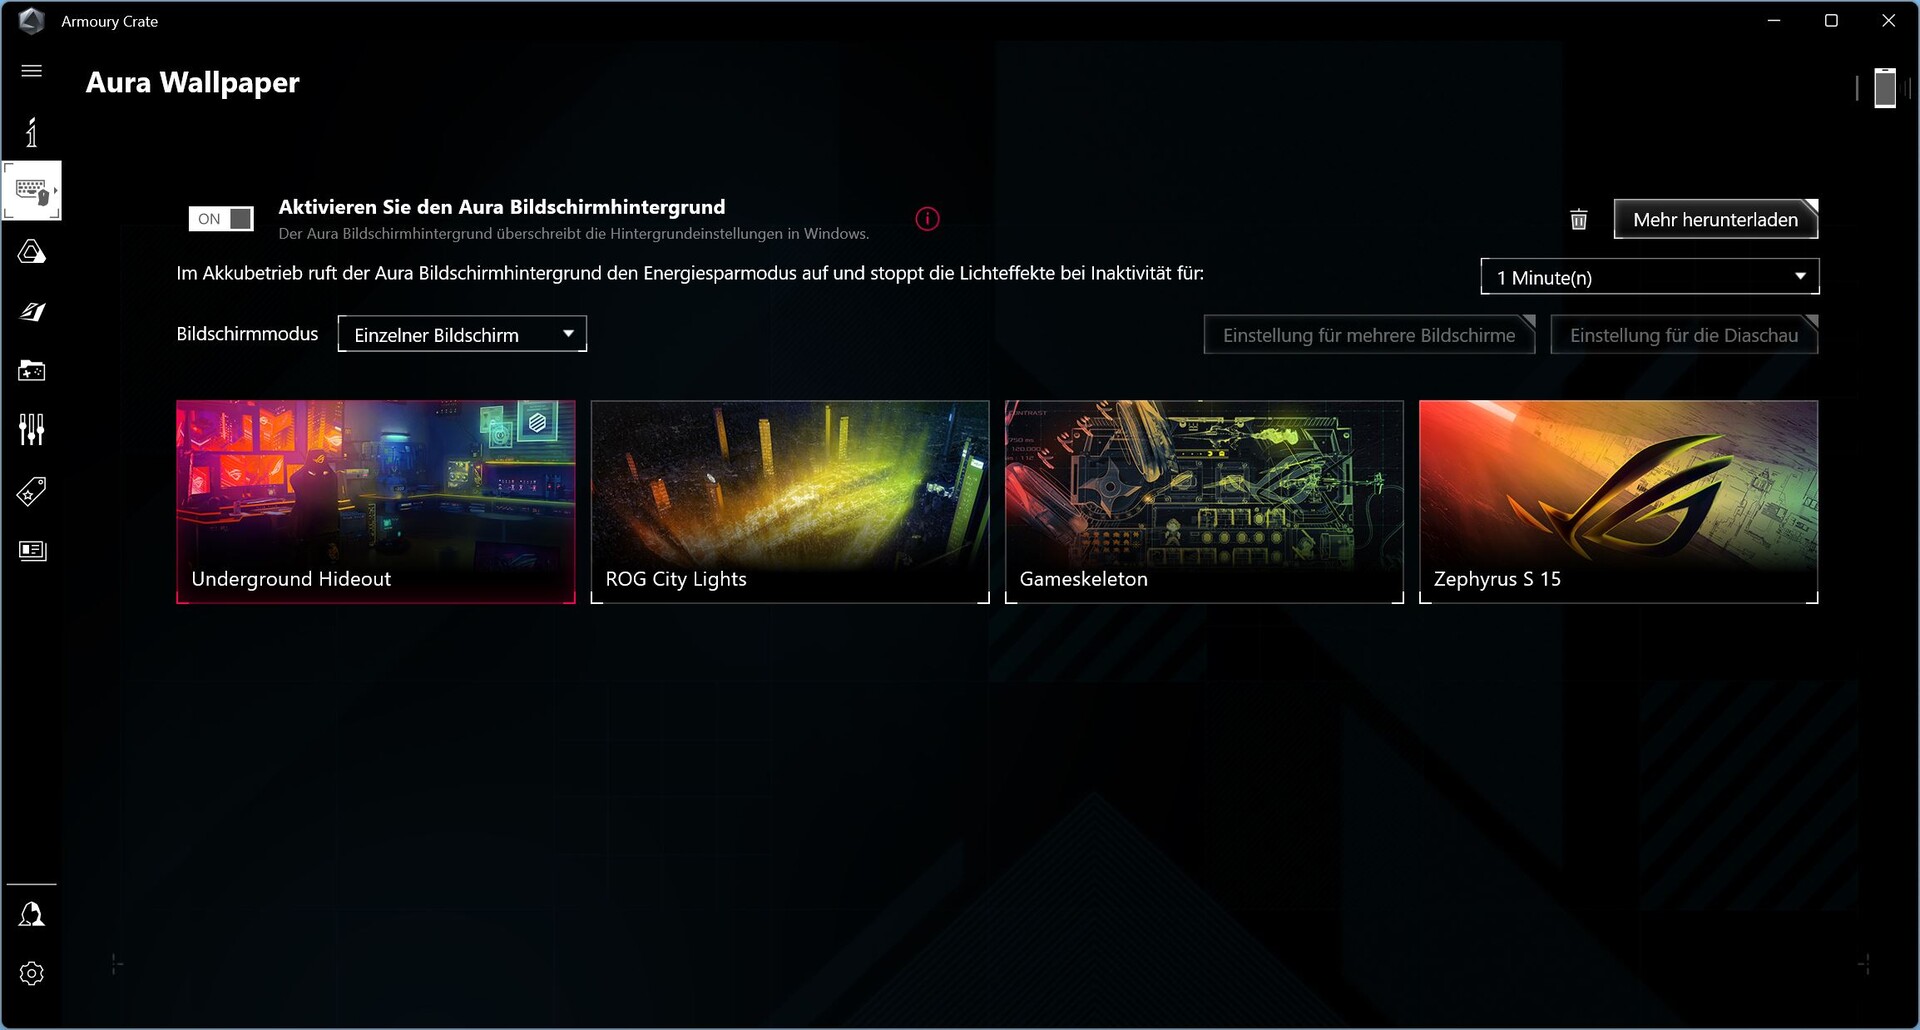
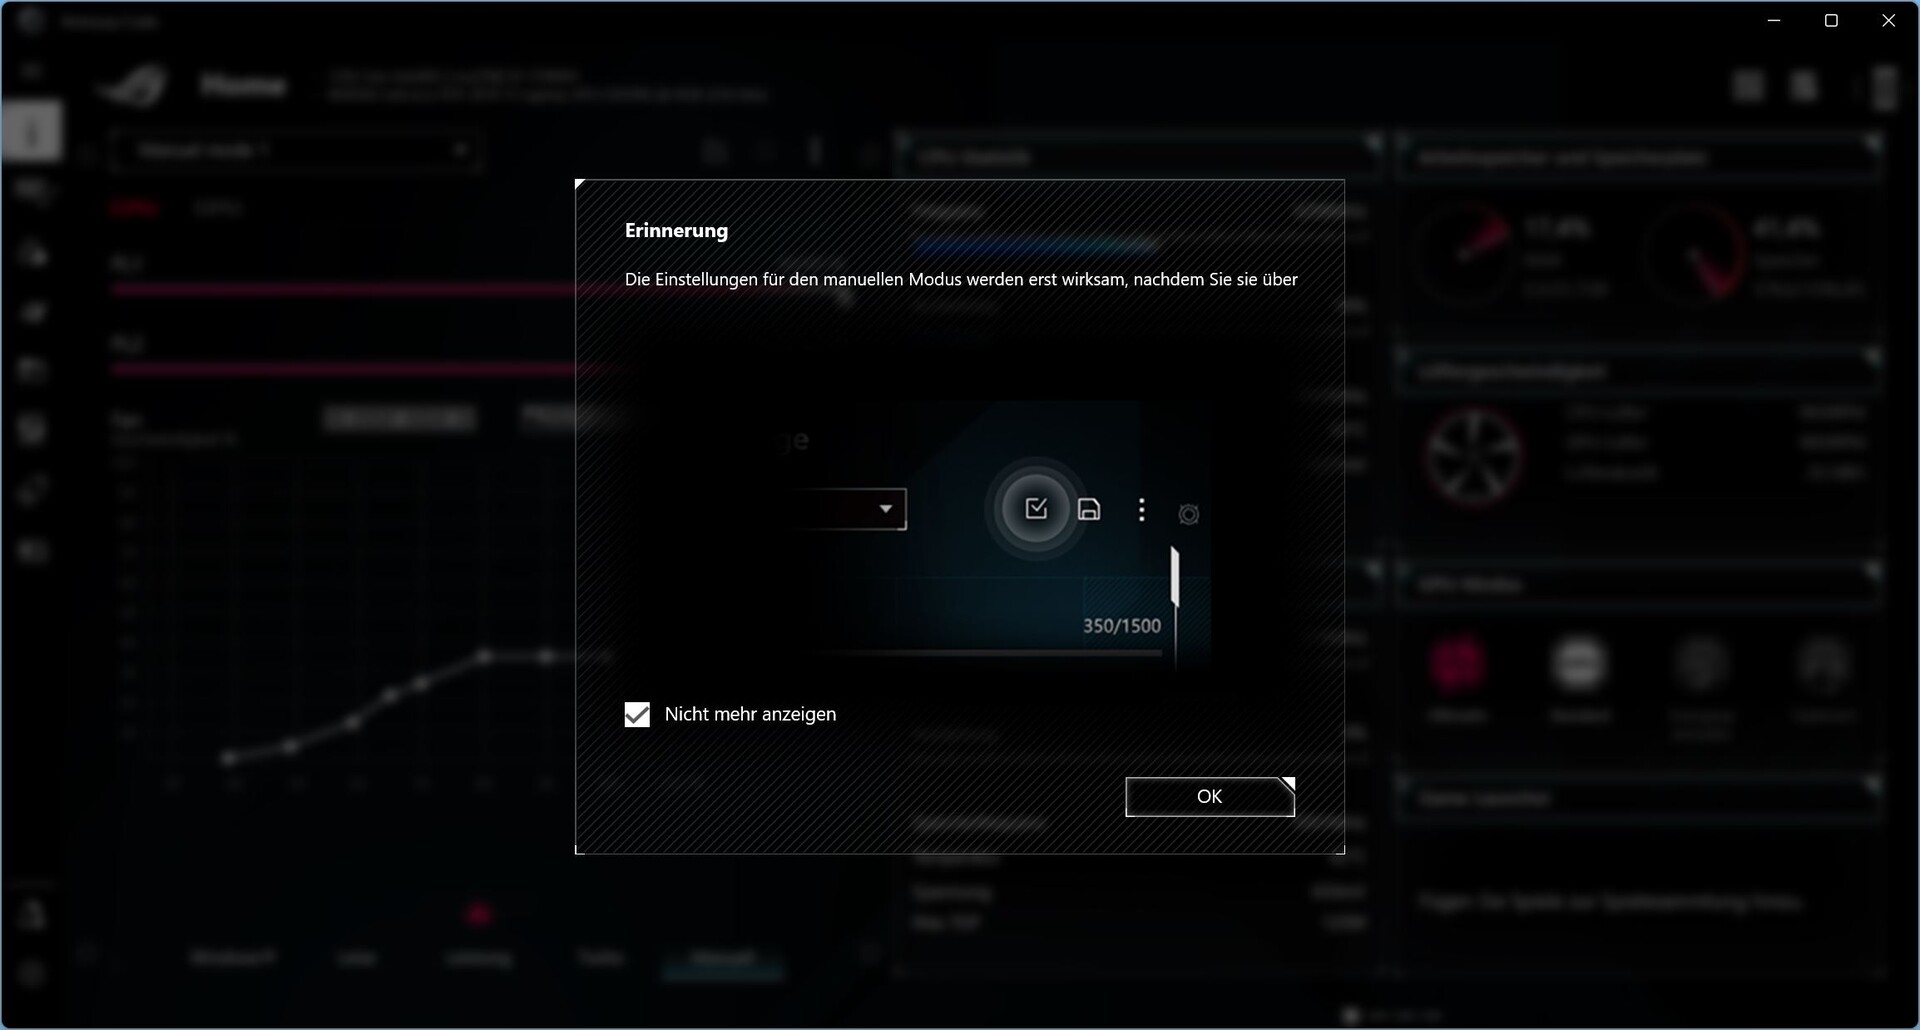
The Asus Armoury Crate software allows you to adjust various settings in the laptop, so the user should become familiar with this. It offers the options to look for device updates, select colorful and dynamic Aura wallpapers, or control the performance.
The manufacturer offers three performance modes (Quiet, Performance, and Turbo) and also gives the option to control the performance using the Windows performance modes or even set several power limits yourself in a manual mode - options that are lacking with many other manufacturers.
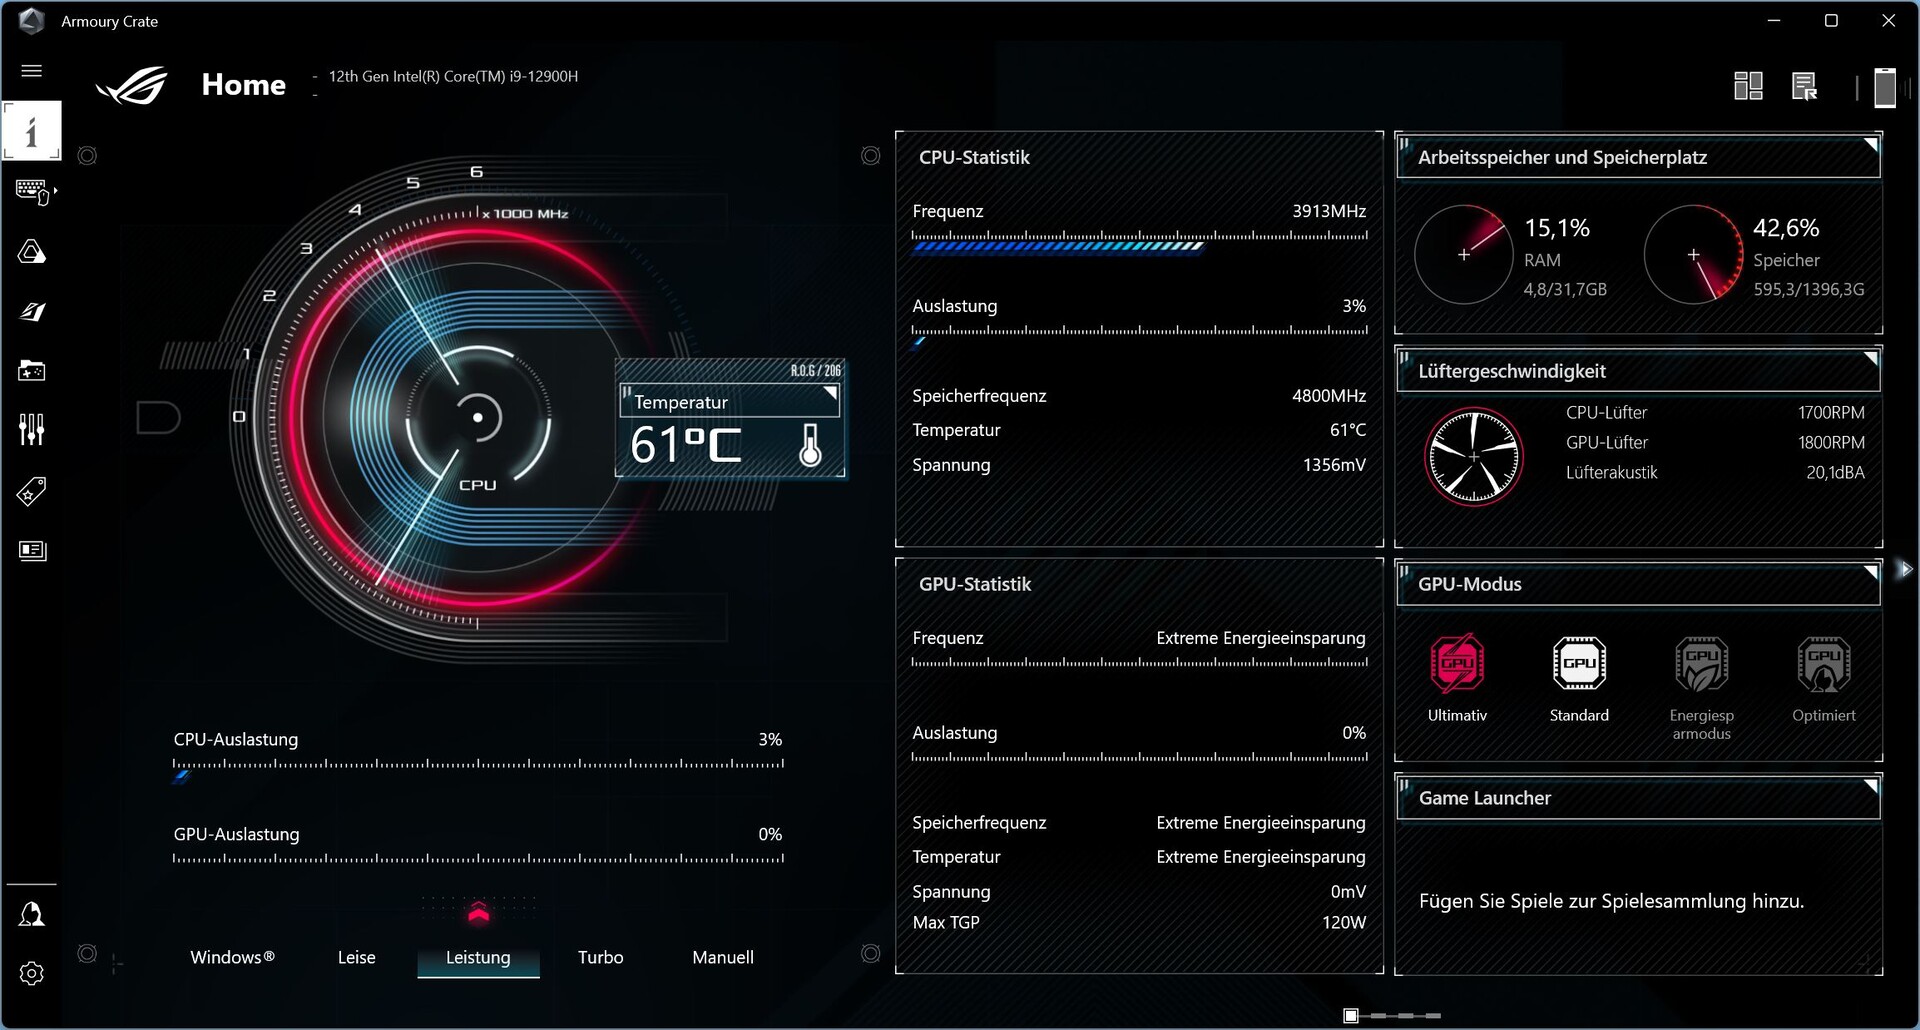
Since in Turbo mode, the laptop is already very loud during idle operation, we run all the benchmark in the "Performance" mode. The "Quiet" mode is only used for the battery tests - there is no separate power saving mode.
Even though the software itself is well organized, various translation errors or incomplete sentences (in the German language version) still prevent a good overall impression.

Processor
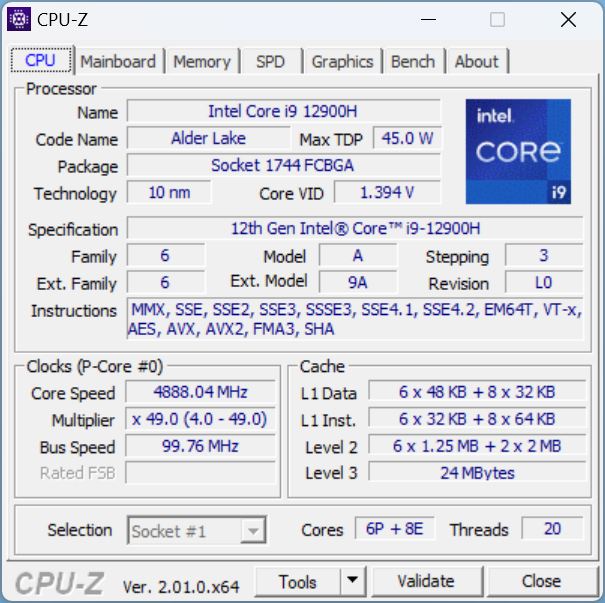
Asus has already announced the M16 with Intel Gen13. Until that becomes available, we are currently still using an Intel Core i9-12900H in our test unit. The high-end CPU offers 6 Performance and 8 Efficiency cores. The Performance cores have a clock speed of up to 5 GHz, and the basic clock speed of the Efficiency cores is 1.8 GHz. Since only the P cores support hyperthreading, we get a total of 12 threads.
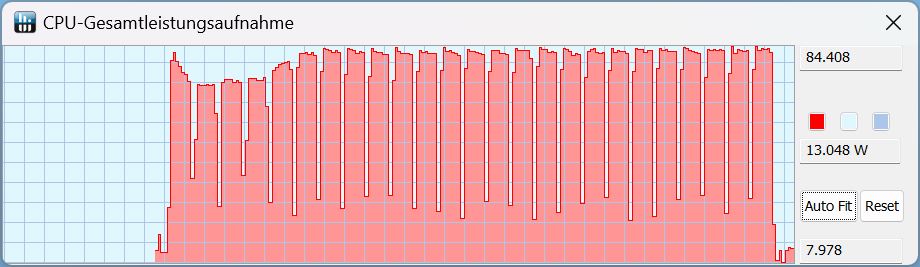
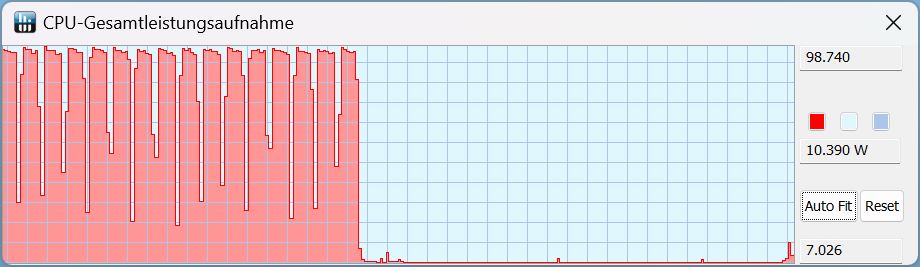
In the Cinebench loop, the constant performance is very stable, with the maximum TDP reaching about 84 watts in the Performance mode. The performance of the i7-12700H in the very powerful XMG Focus 16 turns out even slightly better in the beginning. But after the 4th run the latest, its performance drops below that of our M16, which also beats the Ryzen 7 6800 in the Legion 5.
By the way, instead of 84 watts, a powerful 99 watts are available in Turbo mode! During battery operation, this is only about 40 watts, with the performance dropping correspondingly.
Across all tests, the 2022 M16 is about 20% faster than the predecessor with an i9-11900H.
Cinebench R15 Multi Constant Load Test
Cinebench R23: Multi Core | Single Core
Cinebench R20: CPU (Multi Core) | CPU (Single Core)
Cinebench R15: CPU Multi 64Bit | CPU Single 64Bit
Blender: v2.79 BMW27 CPU
7-Zip 18.03: 7z b 4 | 7z b 4 -mmt1
Geekbench 5.5: Multi-Core | Single-Core
HWBOT x265 Benchmark v2.2: 4k Preset
LibreOffice : 20 Documents To PDF
R Benchmark 2.5: Overall mean
| CPU Performance Rating | |
| Average of class Gaming | |
| Asus ROG Zephyrus M16 GU603Z | |
| SCHENKER XMG Focus 16 (i7-12700H, RTX 3060) | |
| Average Intel Core i9-12900H | |
| Lenovo Legion 5 Pro 16ARH7H RTX 3070 Ti | |
| SCHENKER Vision 16 Pro RTX 3070 Ti | |
| Corsair Voyager a1600 | |
| Asus ROG Zephyrus M16 GU603H -2! | |
| Cinebench R23 / Multi Core | |
| Average of class Gaming (2435 - 34613, n=232, last 2 years) | |
| SCHENKER XMG Focus 16 (i7-12700H, RTX 3060) | |
| Asus ROG Zephyrus M16 GU603Z | |
| Average Intel Core i9-12900H (7359 - 19648, n=26) | |
| Lenovo Legion 5 Pro 16ARH7H RTX 3070 Ti | |
| Corsair Voyager a1600 | |
| SCHENKER Vision 16 Pro RTX 3070 Ti | |
| Cinebench R23 / Single Core | |
| Asus ROG Zephyrus M16 GU603Z | |
| Average Intel Core i9-12900H (1634 - 1921, n=26) | |
| Average of class Gaming (527 - 2235, n=230, last 2 years) | |
| SCHENKER Vision 16 Pro RTX 3070 Ti | |
| SCHENKER XMG Focus 16 (i7-12700H, RTX 3060) | |
| Corsair Voyager a1600 | |
| Lenovo Legion 5 Pro 16ARH7H RTX 3070 Ti | |
| Cinebench R20 / CPU (Multi Core) | |
| Average of class Gaming (930 - 13769, n=230, last 2 years) | |
| SCHENKER XMG Focus 16 (i7-12700H, RTX 3060) | |
| Asus ROG Zephyrus M16 GU603Z | |
| Average Intel Core i9-12900H (2681 - 7471, n=26) | |
| Lenovo Legion 5 Pro 16ARH7H RTX 3070 Ti | |
| Asus ROG Zephyrus M16 GU603H | |
| Corsair Voyager a1600 | |
| SCHENKER Vision 16 Pro RTX 3070 Ti | |
| Cinebench R20 / CPU (Single Core) | |
| Asus ROG Zephyrus M16 GU603Z | |
| Average Intel Core i9-12900H (624 - 738, n=26) | |
| SCHENKER Vision 16 Pro RTX 3070 Ti | |
| Average of class Gaming (169 - 855, n=230, last 2 years) | |
| SCHENKER XMG Focus 16 (i7-12700H, RTX 3060) | |
| Asus ROG Zephyrus M16 GU603H | |
| Lenovo Legion 5 Pro 16ARH7H RTX 3070 Ti | |
| Corsair Voyager a1600 | |
| Cinebench R15 / CPU Multi 64Bit | |
| Average of class Gaming (400 - 5663, n=235, last 2 years) | |
| SCHENKER Vision 16 Pro RTX 3070 Ti | |
| SCHENKER Vision 16 Pro RTX 3070 Ti | |
| SCHENKER XMG Focus 16 (i7-12700H, RTX 3060) | |
| Asus ROG Zephyrus M16 GU603Z | |
| Average Intel Core i9-12900H (1395 - 3077, n=26) | |
| Lenovo Legion 5 Pro 16ARH7H RTX 3070 Ti | |
| Asus ROG Zephyrus M16 GU603H | |
| Corsair Voyager a1600 | |
| Cinebench R15 / CPU Single 64Bit | |
| Average of class Gaming (79.2 - 318, n=234, last 2 years) | |
| Asus ROG Zephyrus M16 GU603Z | |
| Average Intel Core i9-12900H (235 - 277, n=27) | |
| SCHENKER Vision 16 Pro RTX 3070 Ti | |
| SCHENKER XMG Focus 16 (i7-12700H, RTX 3060) | |
| Lenovo Legion 5 Pro 16ARH7H RTX 3070 Ti | |
| Corsair Voyager a1600 | |
| Asus ROG Zephyrus M16 GU603H | |
| Blender / v2.79 BMW27 CPU | |
| SCHENKER Vision 16 Pro RTX 3070 Ti | |
| Asus ROG Zephyrus M16 GU603H | |
| Average Intel Core i9-12900H (160 - 451, n=26) | |
| Corsair Voyager a1600 | |
| Lenovo Legion 5 Pro 16ARH7H RTX 3070 Ti | |
| SCHENKER XMG Focus 16 (i7-12700H, RTX 3060) | |
| Average of class Gaming (87 - 1259, n=228, last 2 years) | |
| Asus ROG Zephyrus M16 GU603Z | |
| 7-Zip 18.03 / 7z b 4 | |
| Average of class Gaming (11386 - 140932, n=229, last 2 years) | |
| Asus ROG Zephyrus M16 GU603Z | |
| Lenovo Legion 5 Pro 16ARH7H RTX 3070 Ti | |
| SCHENKER XMG Focus 16 (i7-12700H, RTX 3060) | |
| Corsair Voyager a1600 | |
| Average Intel Core i9-12900H (34684 - 76677, n=26) | |
| Asus ROG Zephyrus M16 GU603H | |
| SCHENKER Vision 16 Pro RTX 3070 Ti | |
| 7-Zip 18.03 / 7z b 4 -mmt1 | |
| Asus ROG Zephyrus M16 GU603Z | |
| Average of class Gaming (2685 - 7581, n=229, last 2 years) | |
| SCHENKER Vision 16 Pro RTX 3070 Ti | |
| Average Intel Core i9-12900H (5302 - 6289, n=26) | |
| Corsair Voyager a1600 | |
| Lenovo Legion 5 Pro 16ARH7H RTX 3070 Ti | |
| SCHENKER XMG Focus 16 (i7-12700H, RTX 3060) | |
| Asus ROG Zephyrus M16 GU603H | |
| Geekbench 5.5 / Multi-Core | |
| Average of class Gaming (1946 - 22200, n=234, last 2 years) | |
| Asus ROG Zephyrus M16 GU603Z | |
| Average Intel Core i9-12900H (8519 - 14376, n=27) | |
| SCHENKER XMG Focus 16 (i7-12700H, RTX 3060) | |
| SCHENKER Vision 16 Pro RTX 3070 Ti | |
| Lenovo Legion 5 Pro 16ARH7H RTX 3070 Ti | |
| Corsair Voyager a1600 | |
| Asus ROG Zephyrus M16 GU603H | |
| Geekbench 5.5 / Single-Core | |
| Asus ROG Zephyrus M16 GU603Z | |
| SCHENKER Vision 16 Pro RTX 3070 Ti | |
| Average of class Gaming (158 - 2210, n=234, last 2 years) | |
| Average Intel Core i9-12900H (1631 - 1892, n=27) | |
| SCHENKER XMG Focus 16 (i7-12700H, RTX 3060) | |
| Asus ROG Zephyrus M16 GU603H | |
| Lenovo Legion 5 Pro 16ARH7H RTX 3070 Ti | |
| Corsair Voyager a1600 | |
| HWBOT x265 Benchmark v2.2 / 4k Preset | |
| Average of class Gaming (3 - 37.6, n=232, last 2 years) | |
| Asus ROG Zephyrus M16 GU603Z | |
| Lenovo Legion 5 Pro 16ARH7H RTX 3070 Ti | |
| SCHENKER XMG Focus 16 (i7-12700H, RTX 3060) | |
| Average Intel Core i9-12900H (8.05 - 22.5, n=26) | |
| Corsair Voyager a1600 | |
| Asus ROG Zephyrus M16 GU603H | |
| SCHENKER Vision 16 Pro RTX 3070 Ti | |
| LibreOffice / 20 Documents To PDF | |
| Corsair Voyager a1600 | |
| Lenovo Legion 5 Pro 16ARH7H RTX 3070 Ti | |
| Average of class Gaming (32.8 - 332, n=226, last 2 years) | |
| SCHENKER XMG Focus 16 (i7-12700H, RTX 3060) | |
| SCHENKER Vision 16 Pro RTX 3070 Ti | |
| Average Intel Core i9-12900H (36.8 - 59.8, n=26) | |
| Asus ROG Zephyrus M16 GU603Z | |
| Asus ROG Zephyrus M16 GU603H | |
| R Benchmark 2.5 / Overall mean | |
| Asus ROG Zephyrus M16 GU603H | |
| Corsair Voyager a1600 | |
| Lenovo Legion 5 Pro 16ARH7H RTX 3070 Ti | |
| Average of class Gaming (0.3609 - 4.47, n=229, last 2 years) | |
| SCHENKER XMG Focus 16 (i7-12700H, RTX 3060) | |
| SCHENKER Vision 16 Pro RTX 3070 Ti | |
| Average Intel Core i9-12900H (0.4218 - 0.506, n=26) | |
| Asus ROG Zephyrus M16 GU603Z | |
* ... smaller is better
AIDA64: FP32 Ray-Trace | FPU Julia | CPU SHA3 | CPU Queen | FPU SinJulia | FPU Mandel | CPU AES | CPU ZLib | FP64 Ray-Trace | CPU PhotoWorxx
| Performance Rating | |
| Average of class Gaming | |
| Lenovo Legion 5 Pro 16ARH7H RTX 3070 Ti | |
| Corsair Voyager a1600 | |
| Asus ROG Zephyrus M16 GU603Z | |
| SCHENKER XMG Focus 16 (i7-12700H, RTX 3060) | |
| Average Intel Core i9-12900H | |
| SCHENKER Vision 16 Pro RTX 3070 Ti | |
| Asus ROG Zephyrus M16 GU603H -9! | |
| AIDA64 / FP32 Ray-Trace | |
| Average of class Gaming (3069 - 60169, n=225, last 2 years) | |
| Lenovo Legion 5 Pro 16ARH7H RTX 3070 Ti | |
| Corsair Voyager a1600 | |
| Asus ROG Zephyrus M16 GU603Z | |
| SCHENKER XMG Focus 16 (i7-12700H, RTX 3060) | |
| SCHENKER Vision 16 Pro RTX 3070 Ti | |
| Average Intel Core i9-12900H (4074 - 18289, n=26) | |
| AIDA64 / FPU Julia | |
| Lenovo Legion 5 Pro 16ARH7H RTX 3070 Ti | |
| Corsair Voyager a1600 | |
| Average of class Gaming (18567 - 252486, n=225, last 2 years) | |
| SCHENKER XMG Focus 16 (i7-12700H, RTX 3060) | |
| Asus ROG Zephyrus M16 GU603Z | |
| SCHENKER Vision 16 Pro RTX 3070 Ti | |
| Average Intel Core i9-12900H (22307 - 93236, n=26) | |
| AIDA64 / CPU SHA3 | |
| Average of class Gaming (629 - 10389, n=225, last 2 years) | |
| SCHENKER XMG Focus 16 (i7-12700H, RTX 3060) | |
| Lenovo Legion 5 Pro 16ARH7H RTX 3070 Ti | |
| Asus ROG Zephyrus M16 GU603Z | |
| Corsair Voyager a1600 | |
| Average Intel Core i9-12900H (1378 - 4215, n=26) | |
| SCHENKER Vision 16 Pro RTX 3070 Ti | |
| AIDA64 / CPU Queen | |
| Average of class Gaming (15371 - 200651, n=225, last 2 years) | |
| Lenovo Legion 5 Pro 16ARH7H RTX 3070 Ti | |
| Asus ROG Zephyrus M16 GU603Z | |
| Corsair Voyager a1600 | |
| SCHENKER XMG Focus 16 (i7-12700H, RTX 3060) | |
| Average Intel Core i9-12900H (78172 - 111241, n=26) | |
| SCHENKER Vision 16 Pro RTX 3070 Ti | |
| AIDA64 / FPU SinJulia | |
| Corsair Voyager a1600 | |
| Lenovo Legion 5 Pro 16ARH7H RTX 3070 Ti | |
| Average of class Gaming (2137 - 32988, n=225, last 2 years) | |
| SCHENKER XMG Focus 16 (i7-12700H, RTX 3060) | |
| Asus ROG Zephyrus M16 GU603Z | |
| Average Intel Core i9-12900H (5709 - 10410, n=26) | |
| SCHENKER Vision 16 Pro RTX 3070 Ti | |
| AIDA64 / FPU Mandel | |
| Lenovo Legion 5 Pro 16ARH7H RTX 3070 Ti | |
| Corsair Voyager a1600 | |
| Average of class Gaming (10291 - 134044, n=225, last 2 years) | |
| SCHENKER XMG Focus 16 (i7-12700H, RTX 3060) | |
| Asus ROG Zephyrus M16 GU603Z | |
| SCHENKER Vision 16 Pro RTX 3070 Ti | |
| Average Intel Core i9-12900H (11257 - 45581, n=26) | |
| AIDA64 / CPU AES | |
| Lenovo Legion 5 Pro 16ARH7H RTX 3070 Ti | |
| Corsair Voyager a1600 | |
| Asus ROG Zephyrus M16 GU603Z | |
| Average of class Gaming (19065 - 328679, n=225, last 2 years) | |
| Average Intel Core i9-12900H (31935 - 151546, n=26) | |
| SCHENKER XMG Focus 16 (i7-12700H, RTX 3060) | |
| SCHENKER Vision 16 Pro RTX 3070 Ti | |
| AIDA64 / CPU ZLib | |
| Average of class Gaming (150.9 - 2409, n=225, last 2 years) | |
| SCHENKER XMG Focus 16 (i7-12700H, RTX 3060) | |
| Asus ROG Zephyrus M16 GU603Z | |
| Average Intel Core i9-12900H (449 - 1193, n=26) | |
| Lenovo Legion 5 Pro 16ARH7H RTX 3070 Ti | |
| Corsair Voyager a1600 | |
| SCHENKER Vision 16 Pro RTX 3070 Ti | |
| Asus ROG Zephyrus M16 GU603H | |
| AIDA64 / FP64 Ray-Trace | |
| Average of class Gaming (1518 - 31796, n=225, last 2 years) | |
| Lenovo Legion 5 Pro 16ARH7H RTX 3070 Ti | |
| Corsair Voyager a1600 | |
| Asus ROG Zephyrus M16 GU603Z | |
| SCHENKER XMG Focus 16 (i7-12700H, RTX 3060) | |
| SCHENKER Vision 16 Pro RTX 3070 Ti | |
| Average Intel Core i9-12900H (2235 - 10511, n=26) | |
| AIDA64 / CPU PhotoWorxx | |
| SCHENKER Vision 16 Pro RTX 3070 Ti | |
| Asus ROG Zephyrus M16 GU603Z | |
| Average of class Gaming (10805 - 60161, n=226, last 2 years) | |
| Average Intel Core i9-12900H (20960 - 48269, n=27) | |
| Lenovo Legion 5 Pro 16ARH7H RTX 3070 Ti | |
| SCHENKER XMG Focus 16 (i7-12700H, RTX 3060) | |
| Corsair Voyager a1600 | |
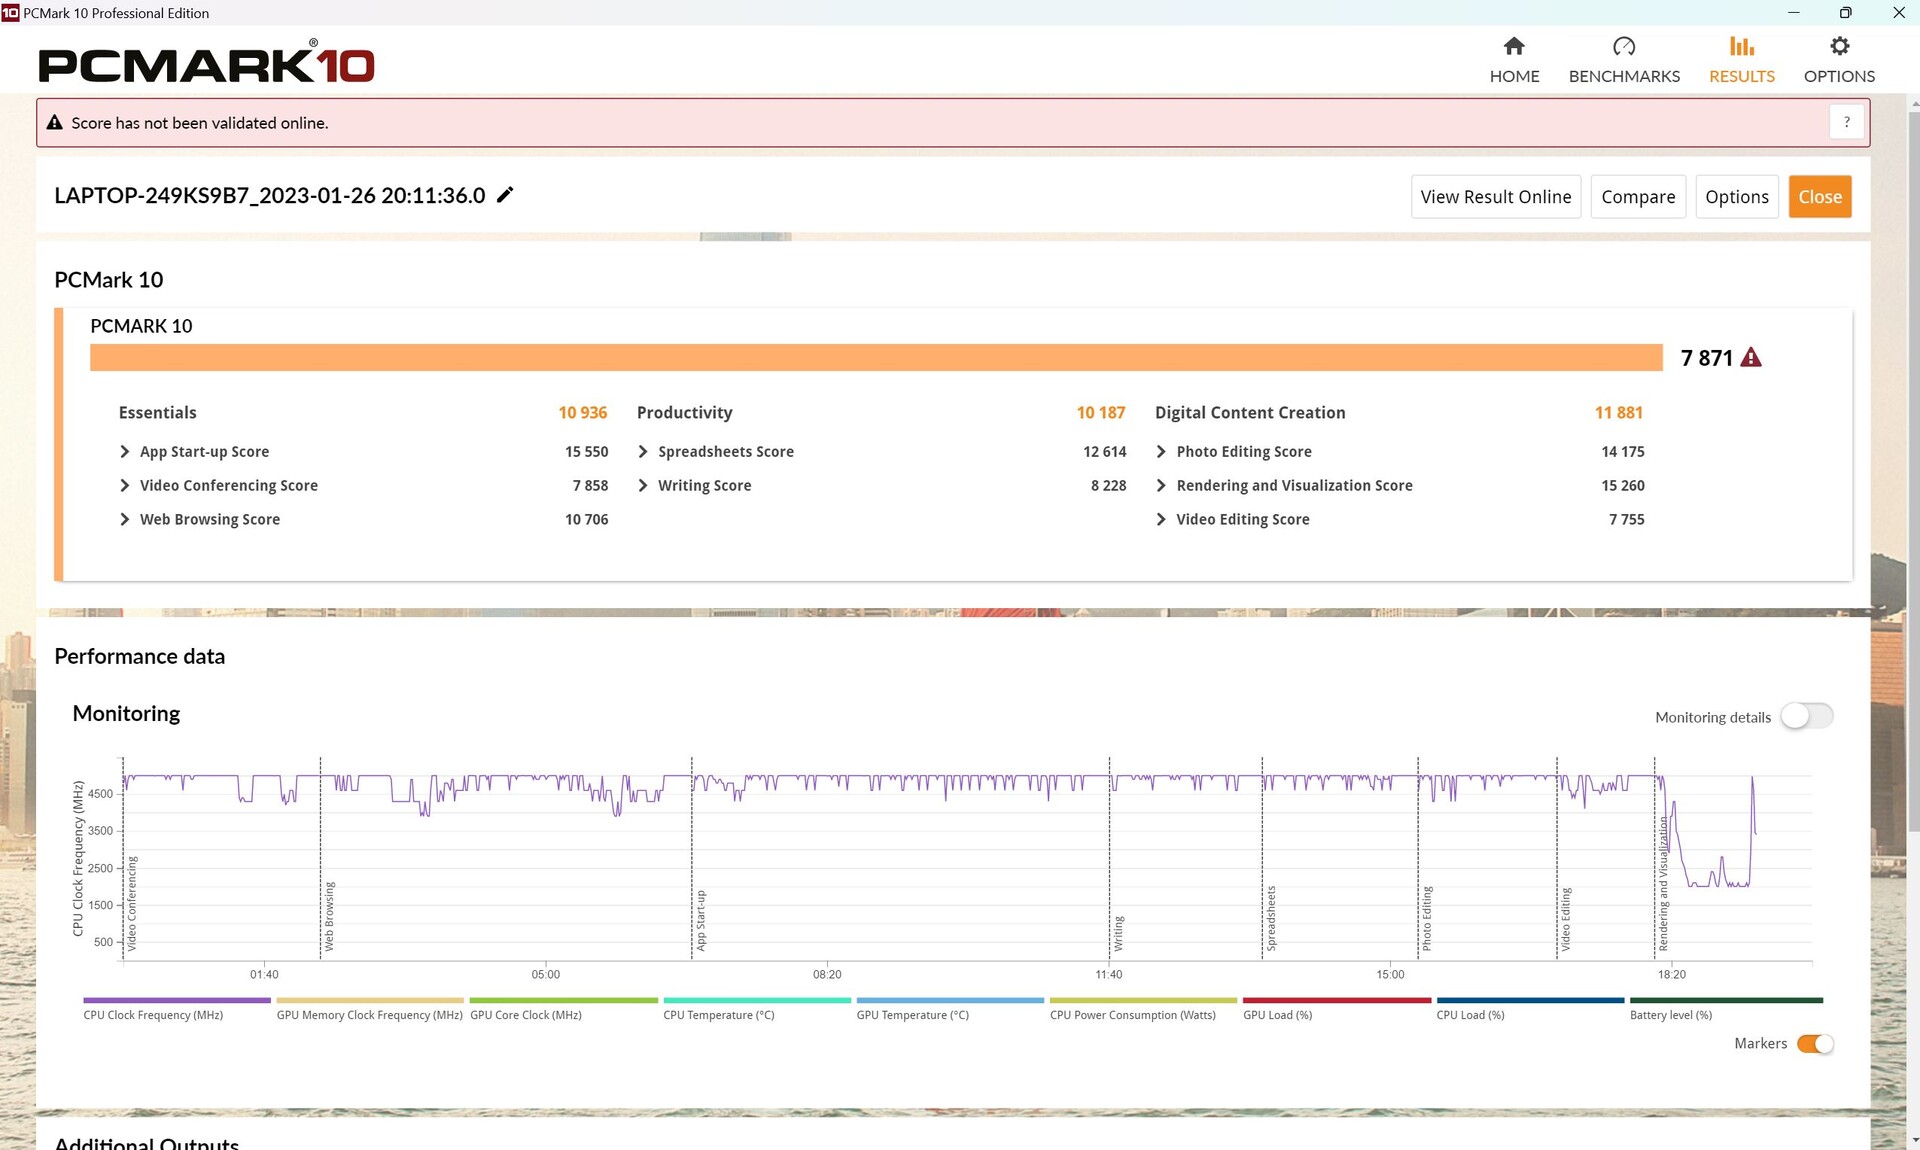
System Performance
In the PCMark, the combination of i9 and RTX 3070 Ti takes the lead in all benchmarks, but this is also the level of performance that is expected. The same goes for the CrossMark benchmarks.
CrossMark: Overall | Productivity | Creativity | Responsiveness
| PCMark 10 / Score | |
| Asus ROG Zephyrus M16 GU603Z | |
| Average Intel Core i9-12900H, NVIDIA GeForce RTX 3070 Ti Laptop GPU (7087 - 8072, n=6) | |
| Average of class Gaming (5235 - 9852, n=200, last 2 years) | |
| Lenovo Legion 5 Pro 16ARH7H RTX 3070 Ti | |
| Corsair Voyager a1600 | |
| SCHENKER XMG Focus 16 (i7-12700H, RTX 3060) | |
| Asus ROG Zephyrus M16 GU603H | |
| PCMark 10 / Essentials | |
| Asus ROG Zephyrus M16 GU603Z | |
| Average Intel Core i9-12900H, NVIDIA GeForce RTX 3070 Ti Laptop GPU (10266 - 11663, n=6) | |
| Average of class Gaming (8300 - 12334, n=199, last 2 years) | |
| Asus ROG Zephyrus M16 GU603H | |
| Lenovo Legion 5 Pro 16ARH7H RTX 3070 Ti | |
| SCHENKER XMG Focus 16 (i7-12700H, RTX 3060) | |
| Corsair Voyager a1600 | |
| PCMark 10 / Productivity | |
| Asus ROG Zephyrus M16 GU603Z | |
| Average Intel Core i9-12900H, NVIDIA GeForce RTX 3070 Ti Laptop GPU (9402 - 10742, n=6) | |
| SCHENKER XMG Focus 16 (i7-12700H, RTX 3060) | |
| Average of class Gaming (6662 - 11833, n=199, last 2 years) | |
| Lenovo Legion 5 Pro 16ARH7H RTX 3070 Ti | |
| Asus ROG Zephyrus M16 GU603H | |
| Corsair Voyager a1600 | |
| PCMark 10 / Digital Content Creation | |
| Asus ROG Zephyrus M16 GU603Z | |
| Lenovo Legion 5 Pro 16ARH7H RTX 3070 Ti | |
| Average of class Gaming (6462 - 18475, n=199, last 2 years) | |
| Average Intel Core i9-12900H, NVIDIA GeForce RTX 3070 Ti Laptop GPU (10009 - 12541, n=6) | |
| Corsair Voyager a1600 | |
| Asus ROG Zephyrus M16 GU603H | |
| SCHENKER XMG Focus 16 (i7-12700H, RTX 3060) | |
| CrossMark / Overall | |
| Asus ROG Zephyrus M16 GU603Z | |
| Average of class Gaming (1247 - 2334, n=170, last 2 years) | |
| Average Intel Core i9-12900H, NVIDIA GeForce RTX 3070 Ti Laptop GPU (1664 - 2044, n=6) | |
| SCHENKER XMG Focus 16 (i7-12700H, RTX 3060) | |
| SCHENKER Vision 16 Pro RTX 3070 Ti | |
| Lenovo Legion 5 Pro 16ARH7H RTX 3070 Ti | |
| Corsair Voyager a1600 | |
| CrossMark / Productivity | |
| Asus ROG Zephyrus M16 GU603Z | |
| Average of class Gaming (1299 - 2204, n=170, last 2 years) | |
| Average Intel Core i9-12900H, NVIDIA GeForce RTX 3070 Ti Laptop GPU (1591 - 1968, n=6) | |
| Lenovo Legion 5 Pro 16ARH7H RTX 3070 Ti | |
| SCHENKER XMG Focus 16 (i7-12700H, RTX 3060) | |
| SCHENKER Vision 16 Pro RTX 3070 Ti | |
| Corsair Voyager a1600 | |
| CrossMark / Creativity | |
| Average of class Gaming (1275 - 2514, n=170, last 2 years) | |
| Asus ROG Zephyrus M16 GU603Z | |
| Average Intel Core i9-12900H, NVIDIA GeForce RTX 3070 Ti Laptop GPU (1797 - 2148, n=6) | |
| SCHENKER Vision 16 Pro RTX 3070 Ti | |
| SCHENKER XMG Focus 16 (i7-12700H, RTX 3060) | |
| Lenovo Legion 5 Pro 16ARH7H RTX 3070 Ti | |
| Corsair Voyager a1600 | |
| CrossMark / Responsiveness | |
| Asus ROG Zephyrus M16 GU603Z | |
| Average Intel Core i9-12900H, NVIDIA GeForce RTX 3070 Ti Laptop GPU (1514 - 2069, n=6) | |
| Average of class Gaming (1030 - 2330, n=170, last 2 years) | |
| Lenovo Legion 5 Pro 16ARH7H RTX 3070 Ti | |
| SCHENKER XMG Focus 16 (i7-12700H, RTX 3060) | |
| SCHENKER Vision 16 Pro RTX 3070 Ti | |
| Corsair Voyager a1600 | |
| PCMark 10 Score | 7871 points | |
Help | ||
| AIDA64 / Memory Copy | |
| Asus ROG Zephyrus M16 GU603Z | |
| SCHENKER Vision 16 Pro RTX 3070 Ti | |
| Average of class Gaming (21842 - 92565, n=225, last 2 years) | |
| Average Intel Core i9-12900H (34438 - 74264, n=26) | |
| Lenovo Legion 5 Pro 16ARH7H RTX 3070 Ti | |
| Corsair Voyager a1600 | |
| SCHENKER XMG Focus 16 (i7-12700H, RTX 3060) | |
| AIDA64 / Memory Read | |
| Asus ROG Zephyrus M16 GU603Z | |
| SCHENKER Vision 16 Pro RTX 3070 Ti | |
| Average of class Gaming (24879 - 90647, n=225, last 2 years) | |
| Average Intel Core i9-12900H (36365 - 74642, n=26) | |
| Lenovo Legion 5 Pro 16ARH7H RTX 3070 Ti | |
| Corsair Voyager a1600 | |
| SCHENKER XMG Focus 16 (i7-12700H, RTX 3060) | |
| AIDA64 / Memory Write | |
| Asus ROG Zephyrus M16 GU603Z | |
| SCHENKER Vision 16 Pro RTX 3070 Ti | |
| Average of class Gaming (21619 - 103259, n=225, last 2 years) | |
| Average Intel Core i9-12900H (32276 - 67858, n=26) | |
| Lenovo Legion 5 Pro 16ARH7H RTX 3070 Ti | |
| Corsair Voyager a1600 | |
| SCHENKER XMG Focus 16 (i7-12700H, RTX 3060) | |
| AIDA64 / Memory Latency | |
| Corsair Voyager a1600 | |
| SCHENKER Vision 16 Pro RTX 3070 Ti | |
| SCHENKER XMG Focus 16 (i7-12700H, RTX 3060) | |
| Asus ROG Zephyrus M16 GU603Z | |
| Average of class Gaming (59.5 - 152.5, n=222, last 2 years) | |
| Lenovo Legion 5 Pro 16ARH7H RTX 3070 Ti | |
| Average Intel Core i9-12900H (74.7 - 118.1, n=25) | |
| Asus ROG Zephyrus M16 GU603H | |
* ... smaller is better
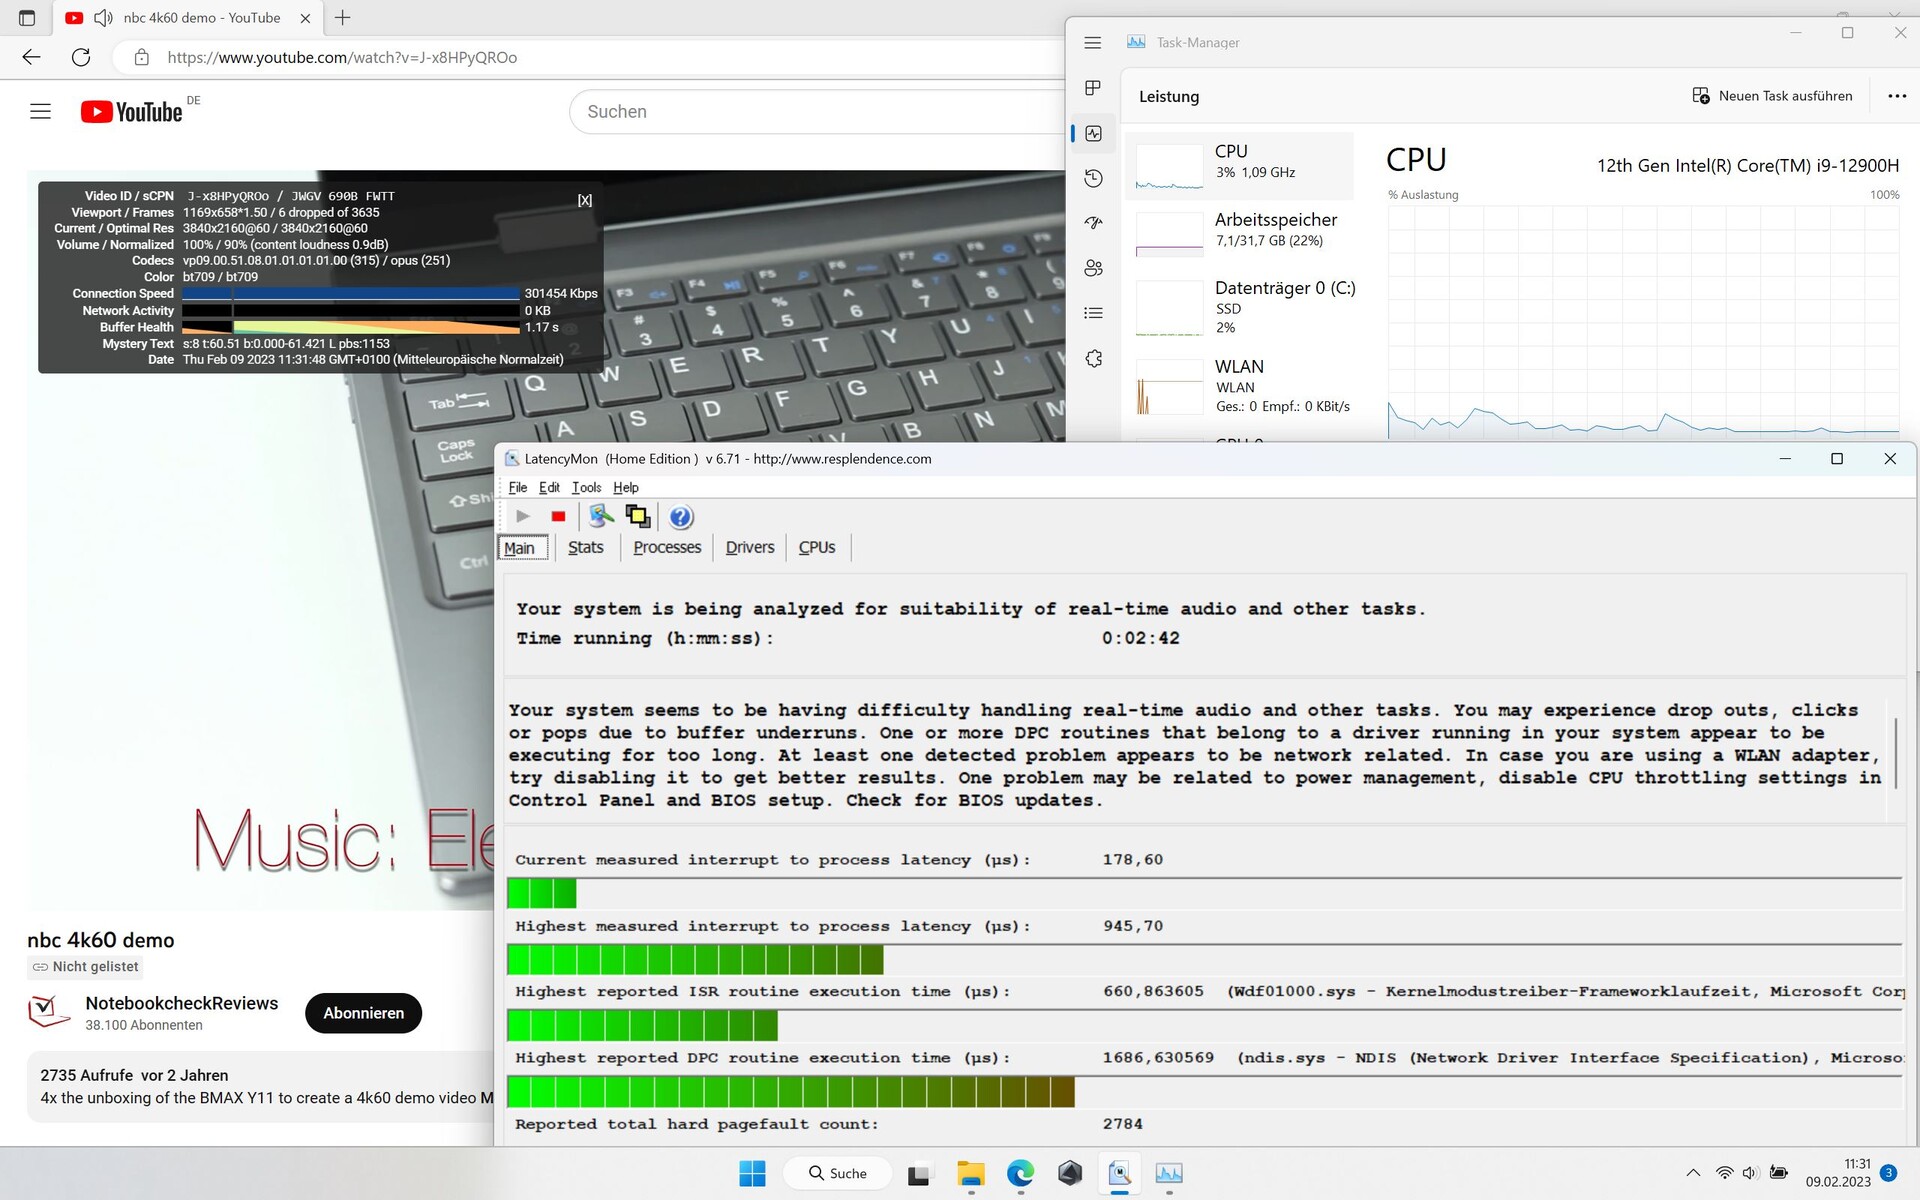
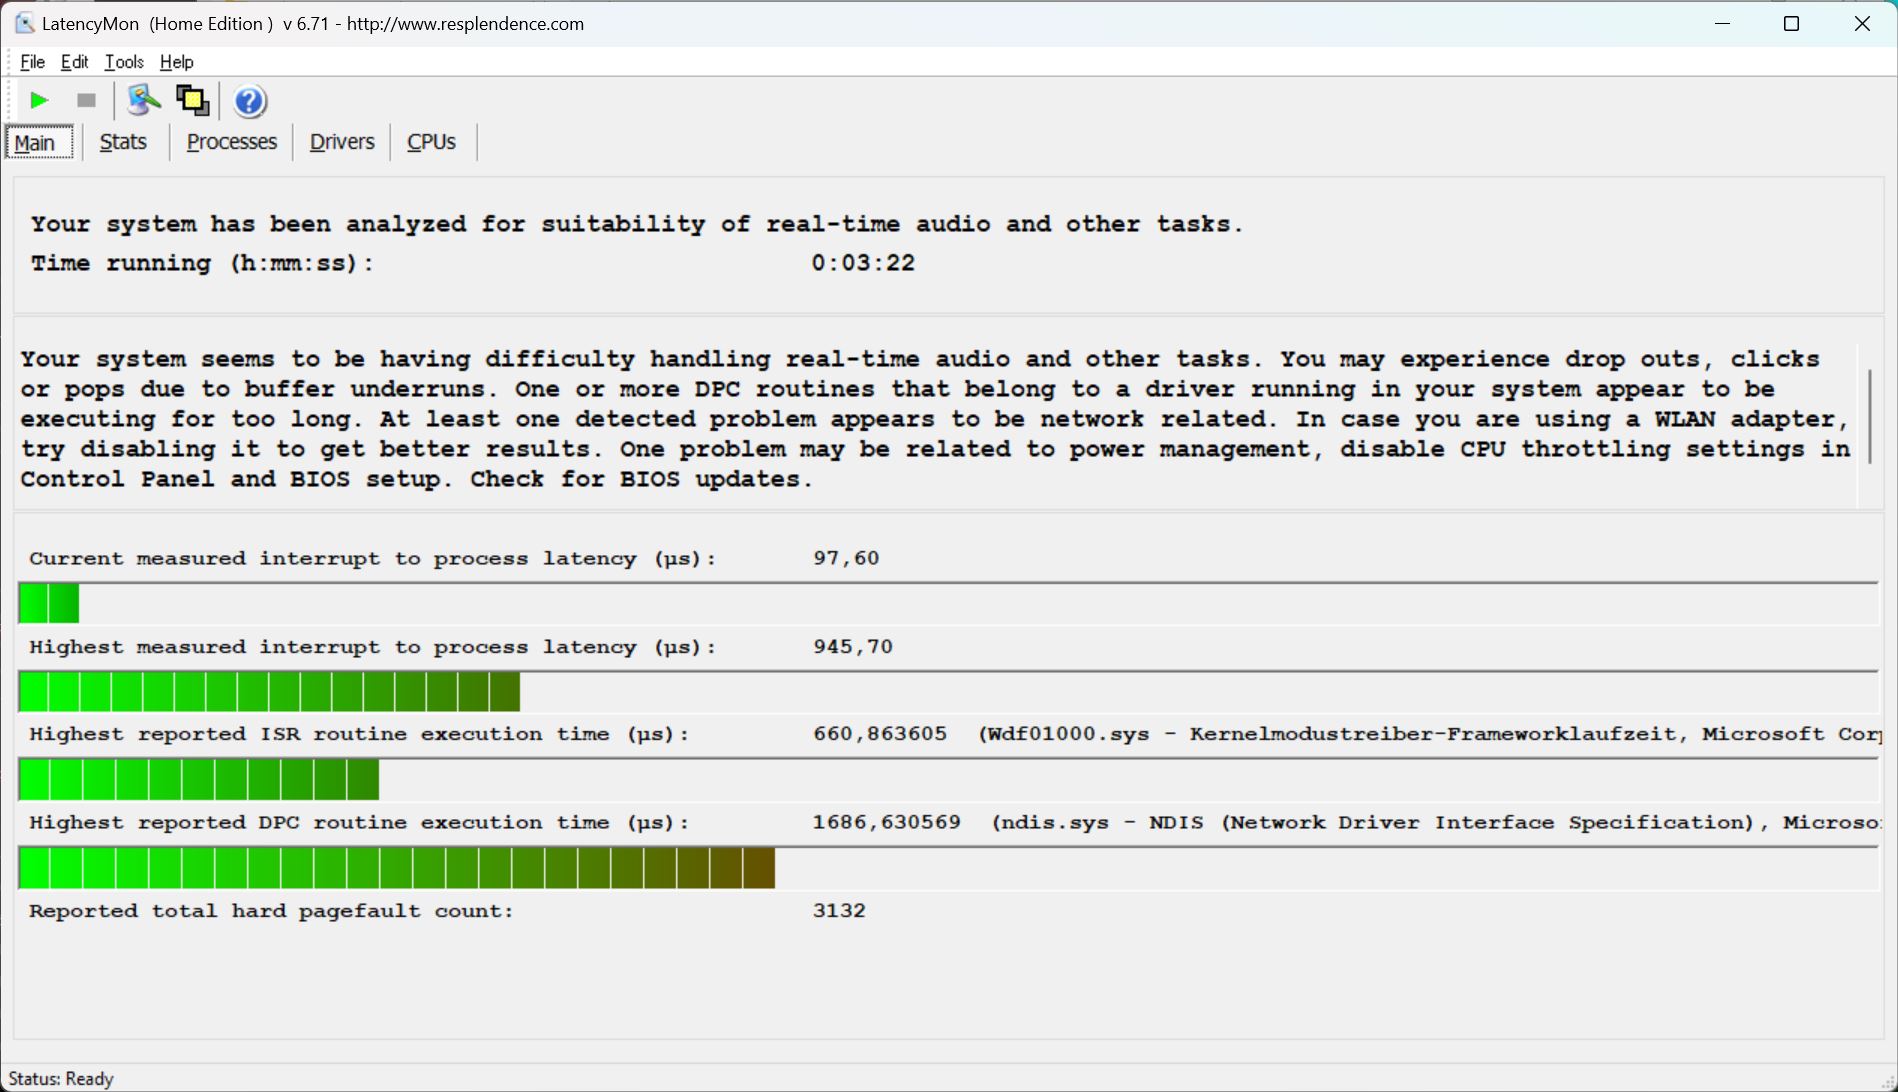
DPC Latencies
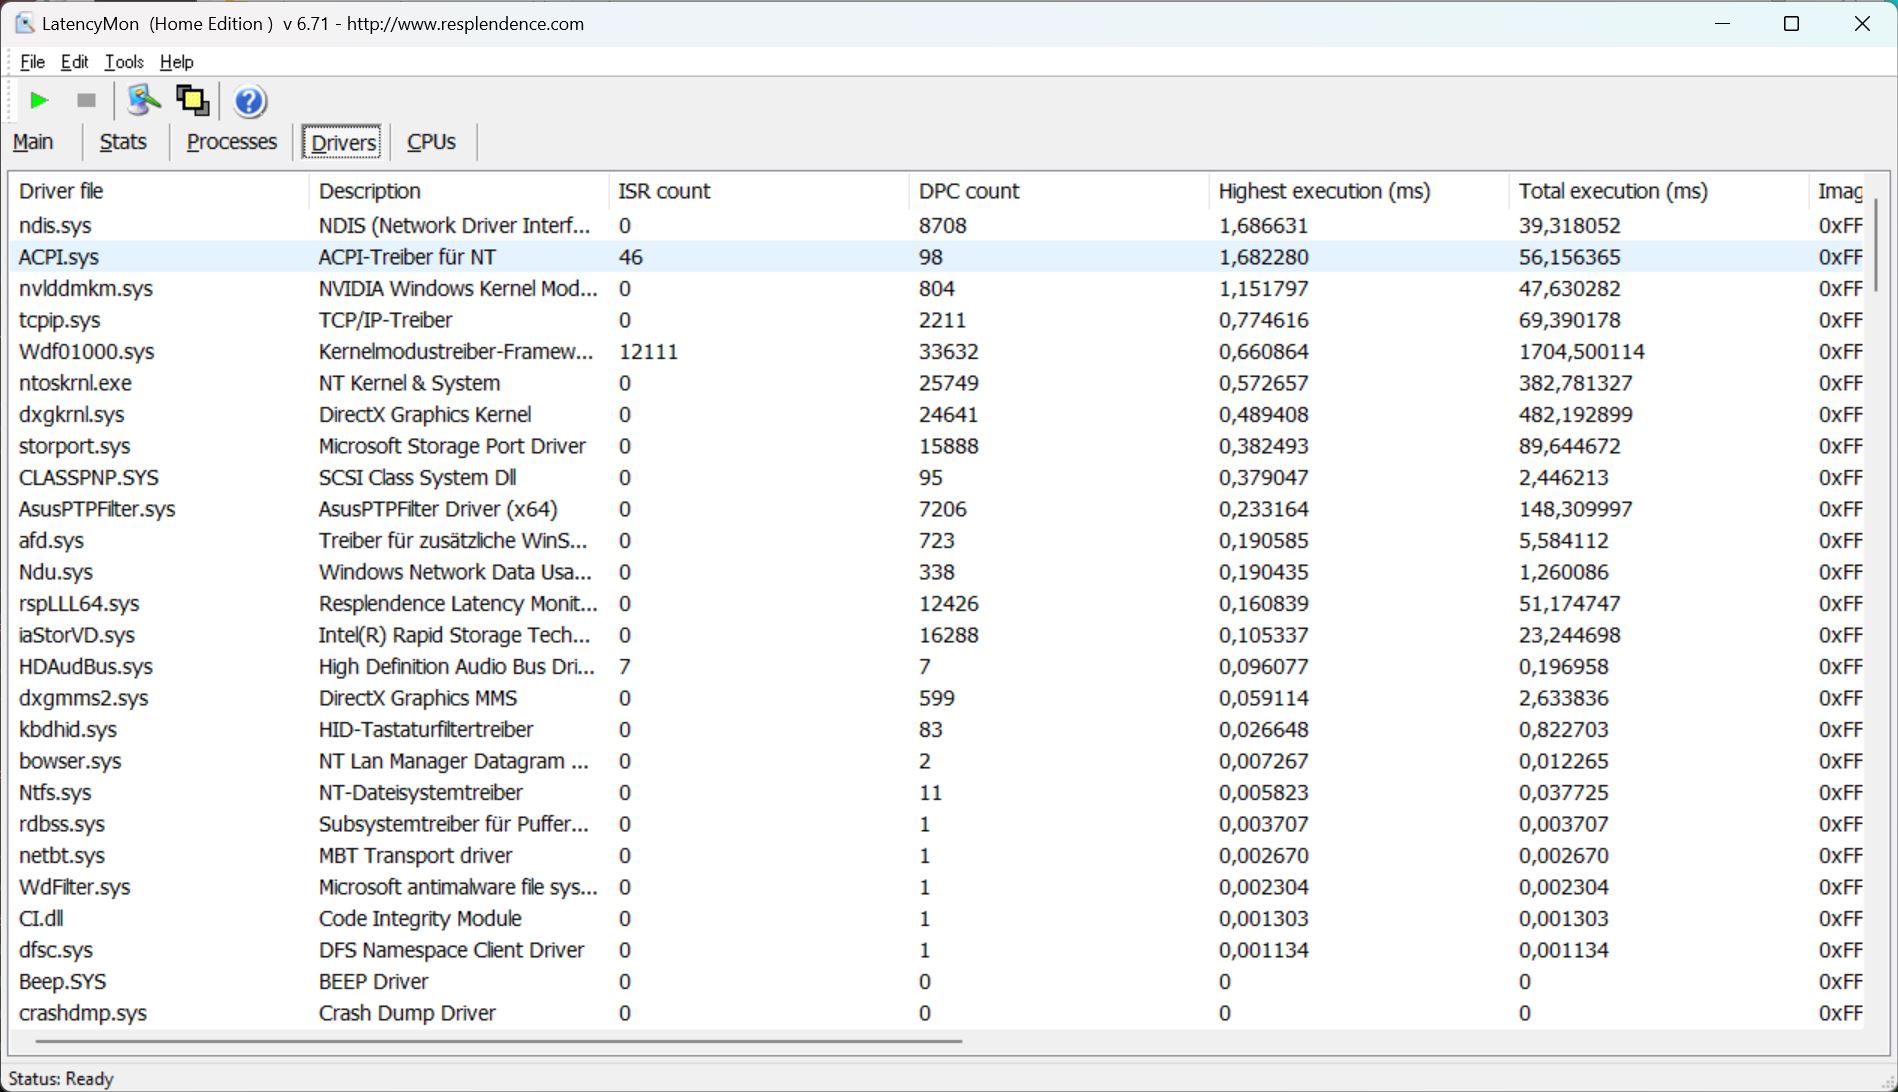
LatencyMon unfortunately already finds the first latencies when starting the software, even if there are no additional actions. When opening the browser with multiple tabs, the latencies increase further.
Our 4K/60-fps YouTube video is also not reproduced without any dropped frames (6). However, the latency values are not particularly high overall and lower than in the XMG Focus 16, for example. On the other hand, they become evident earlier.
| DPC Latencies / LatencyMon - interrupt to process latency (max), Web, Youtube, Prime95 | |
| SCHENKER XMG Focus 16 (i7-12700H, RTX 3060) | |
| Asus ROG Zephyrus M16 GU603H | |
| Asus ROG Zephyrus M16 GU603Z | |
| Lenovo Legion 5 Pro 16ARH7H RTX 3070 Ti | |
| Corsair Voyager a1600 | |
| SCHENKER Vision 16 Pro RTX 3070 Ti | |
* ... smaller is better
Storage Solution
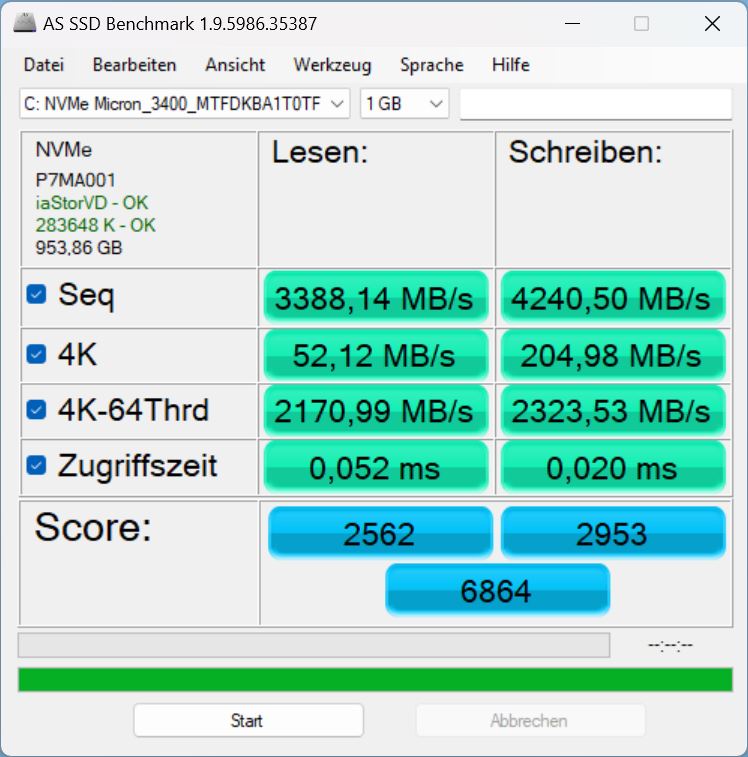
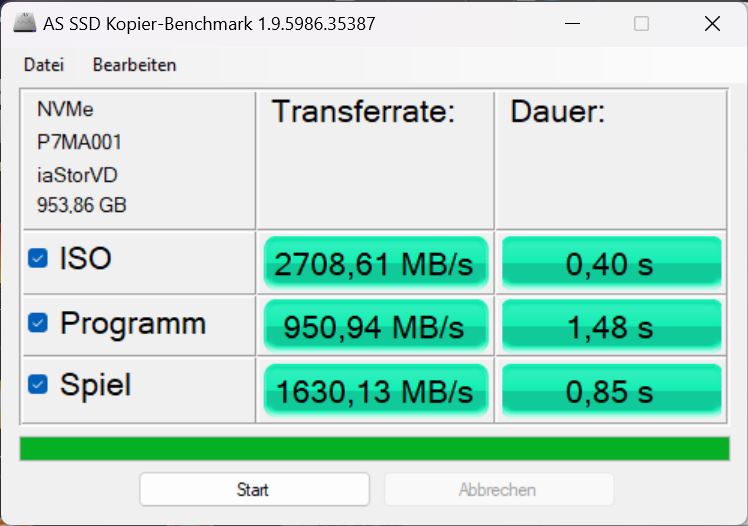
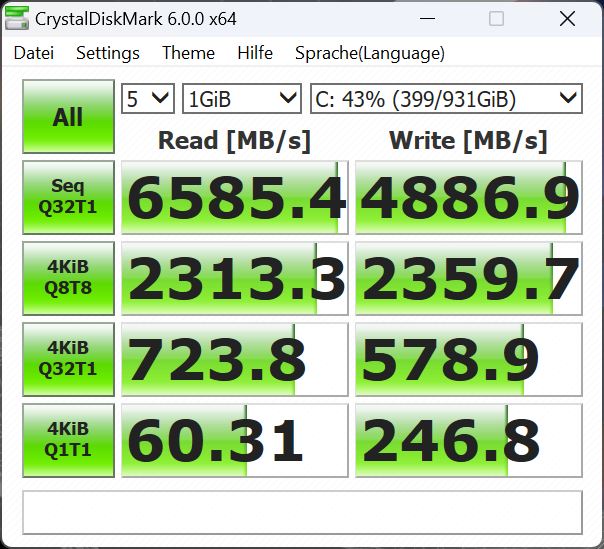
Our test model uses a PCIe Gen4 SSD from Micron with 1 TB of storage. In our list of best SSDs, it places at rank 74, so there are also many faster models. The benchmarks confirm decent values for the storage solution. However, the measured values of the Samsung storage in the predecessor or the Legion 5, are faster.
The SSD isn't quite able to maintain its performance in the long run, but the performance drop is only small.

* ... smaller is better
Disk Throttling: DiskSpd Read Loop, Queue Depth 8
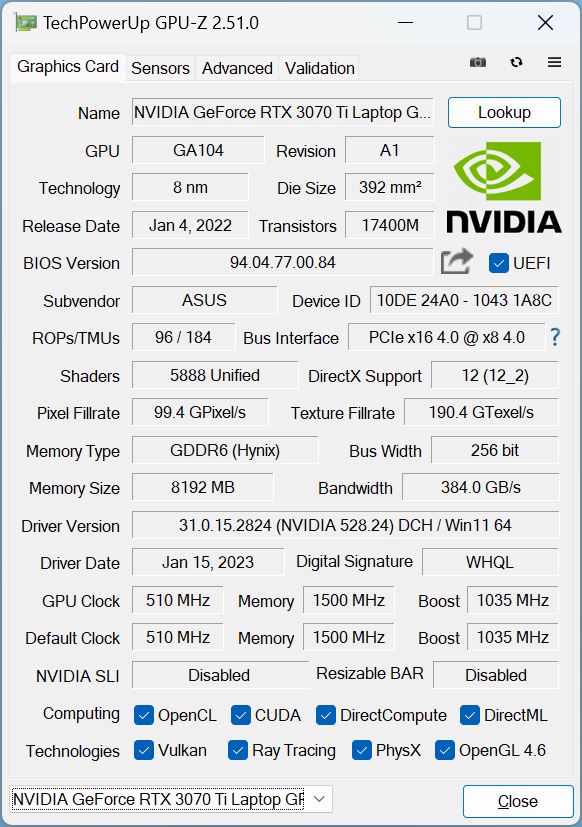
Graphics Card
Our test system uses an RTX 3070 Ti. Even though it is really one of the most powerful laptop GPUs, it is "only" allowed to use 100 W plus 20 W Dynamic Boost in the M16. It is not very surprising that when allowed to use 150 W, the same GPU is faster in the Legion 5 Pro, even by up to 27%!
At least, the predecessor with RTX 3070 (without "Ti") is surpassed by 38%. The XMG Vision 16 Pro only allows a maximum of 95 W for the GPU, so that also remains significantly behind the M16.
Overall, the speed of the 120-W graphics card is about 7 to 12% slower than the average RTX 3070 Ti in our database.
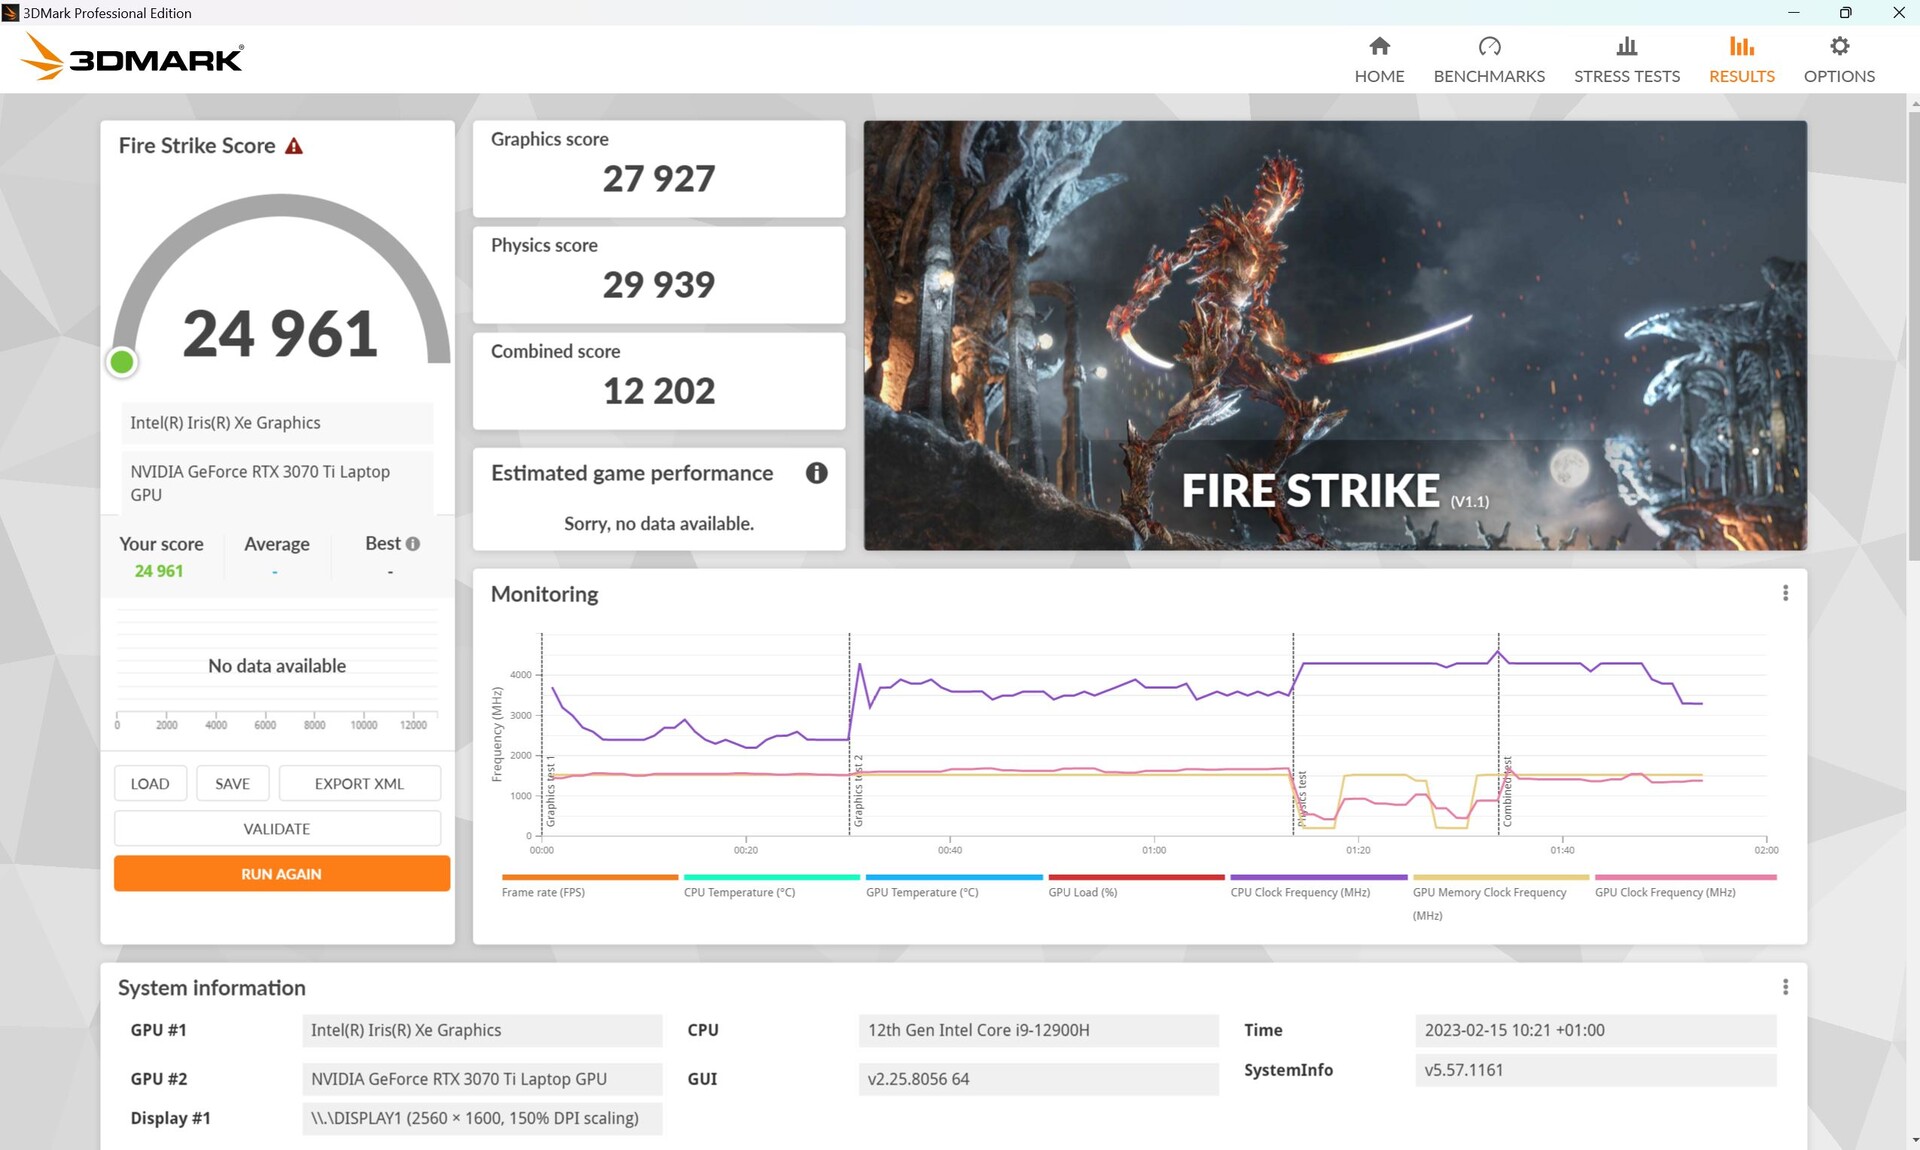
In Turbo mode, the performance and consumption increase slightly, and another Fire-Strike test results in a graphics score that is about 13% higher.
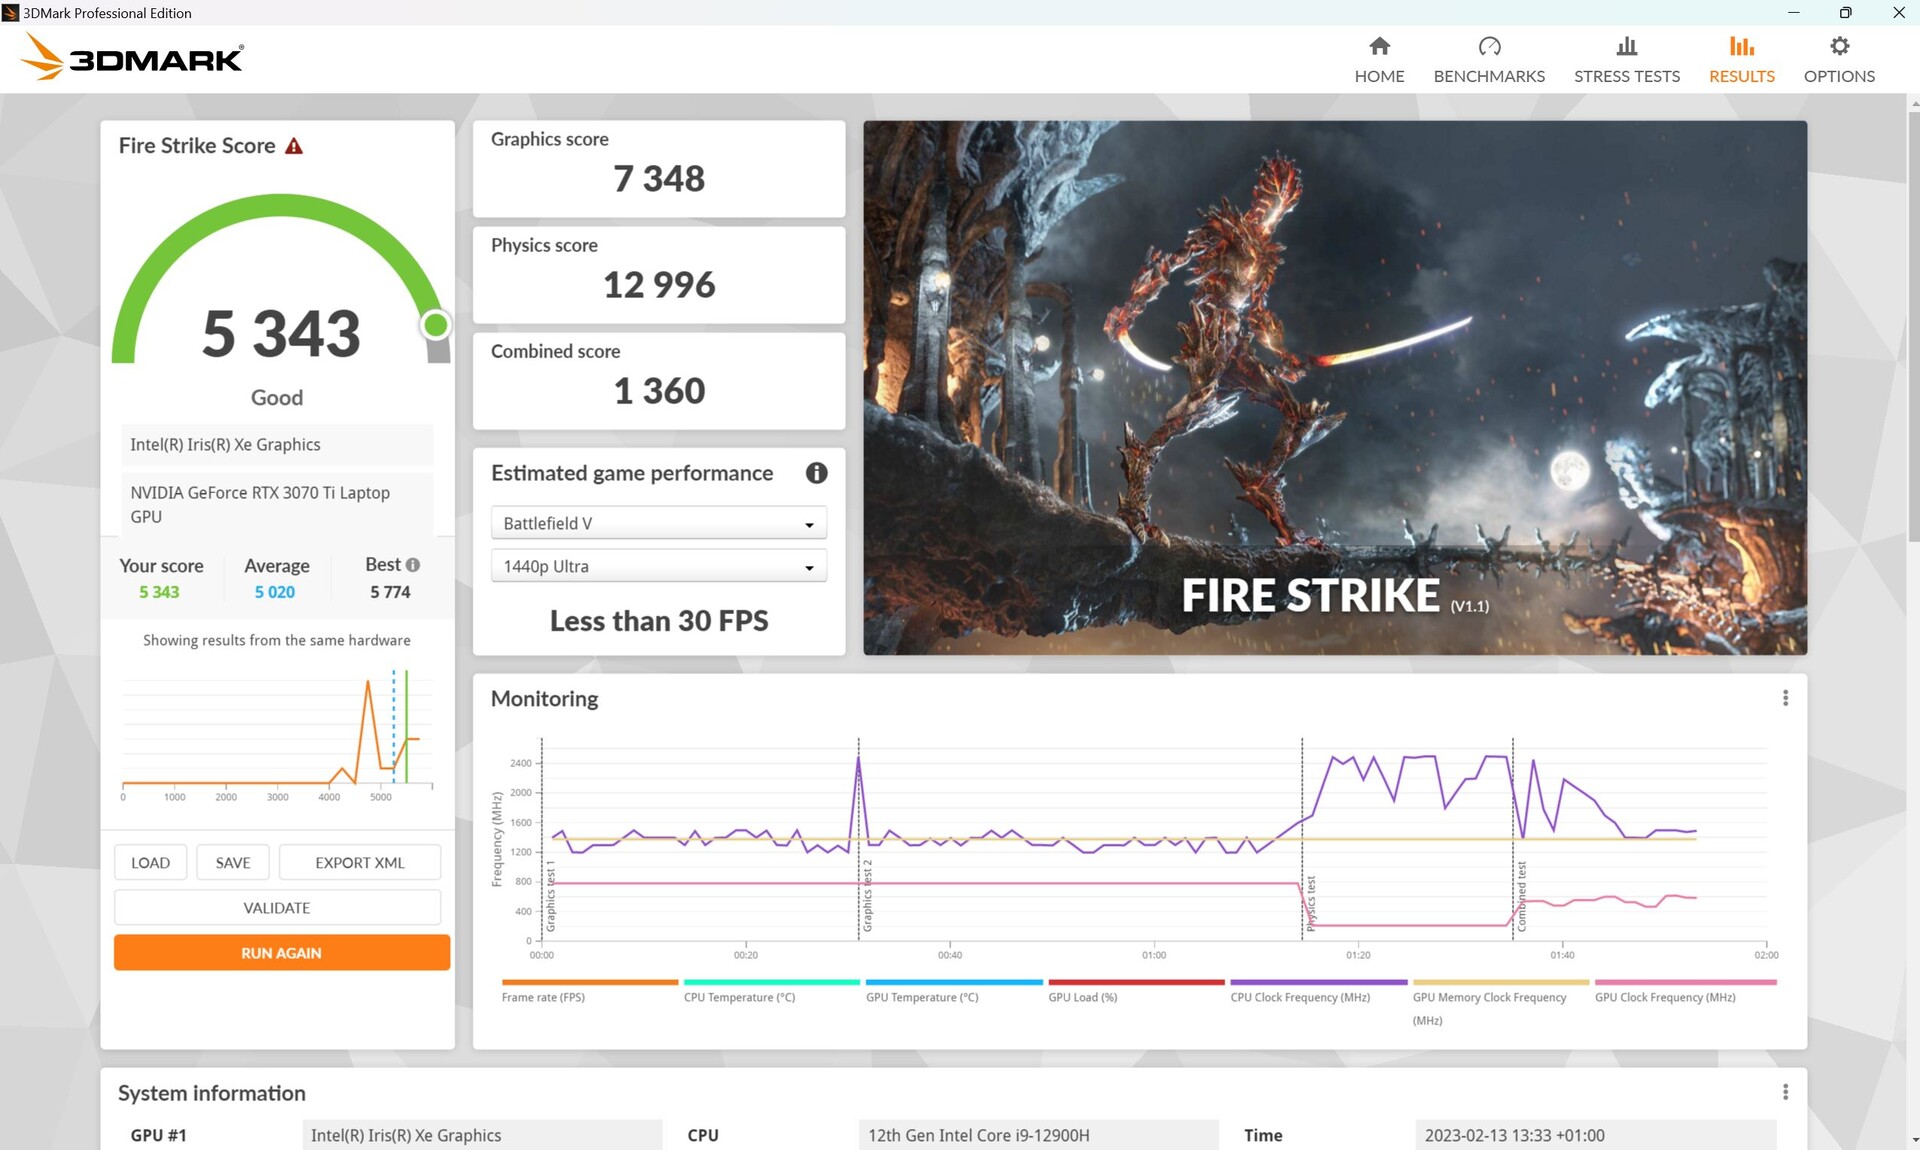
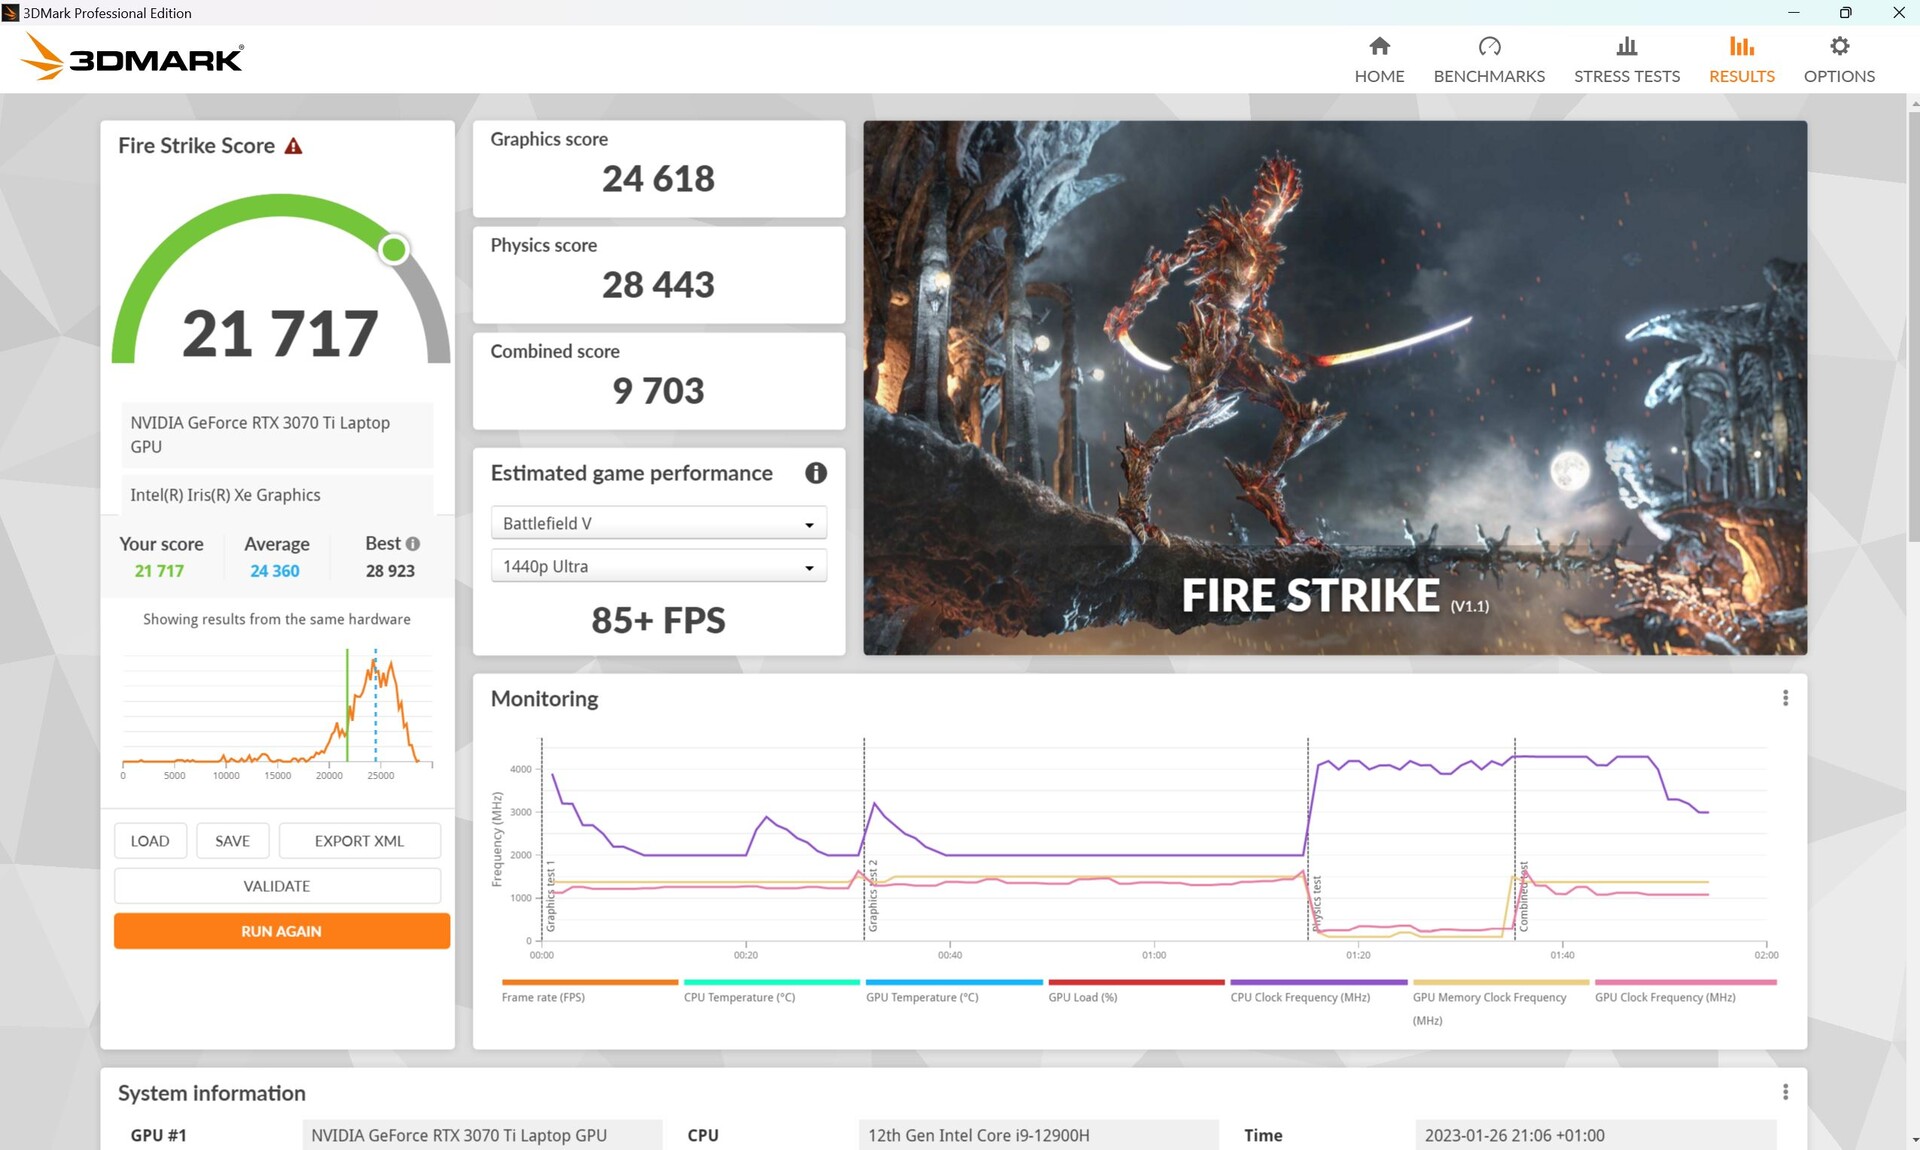
During battery operation, the 3D performance drops significantly. Compared to the 24,618 graphics points in Fire Strike during mains operation, only 7,348 3D points remain in battery operation, which corresponds to a drop of 70%!
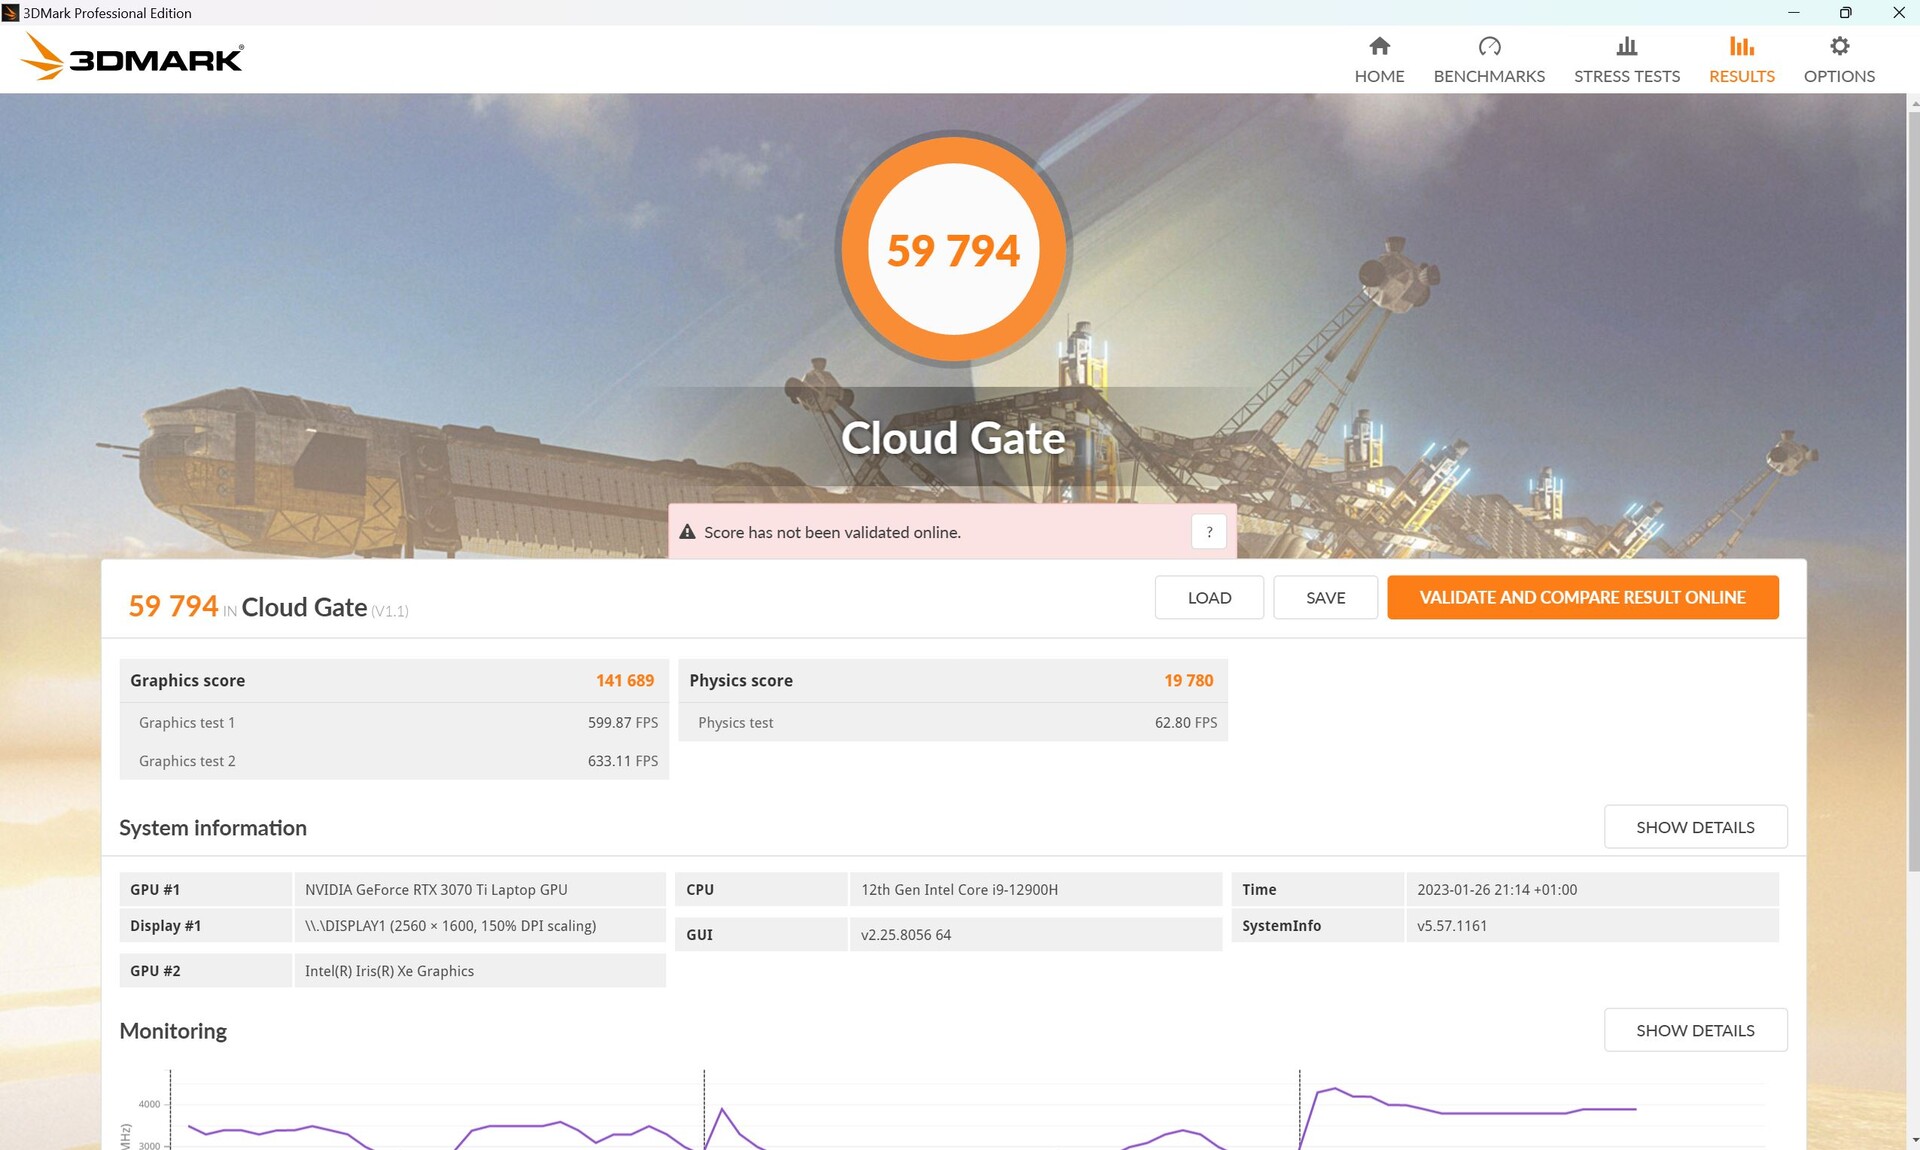
| 3DMark 11 Performance | 29169 points | |
| 3DMark Cloud Gate Standard Score | 59794 points | |
| 3DMark Fire Strike Score | 21717 points | |
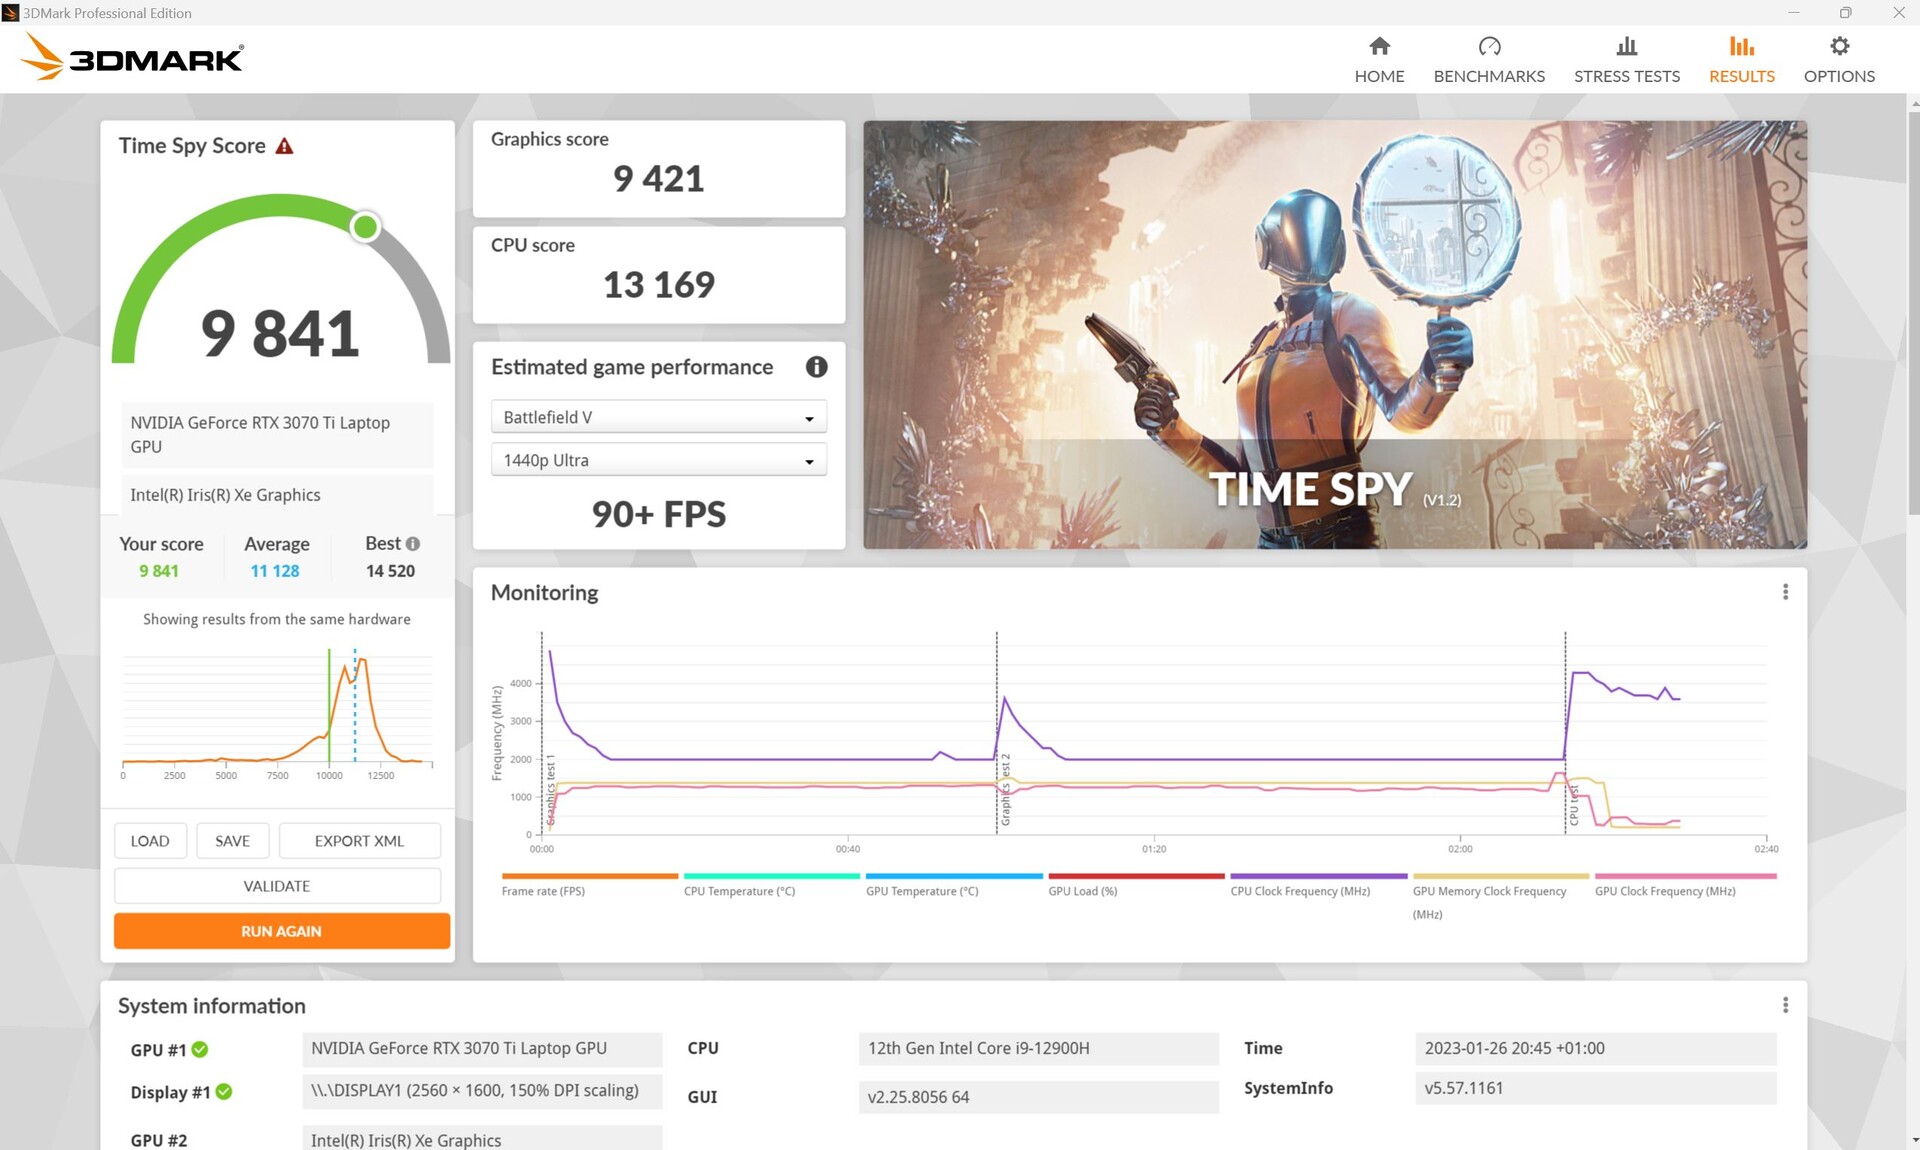
| 3DMark Time Spy Score | 9841 points | |
Help | ||
* ... smaller is better
Gaming Performance
When gaming, the difference overall isn't quite as large, also because the powerful CPU is able to catch up in the corresponding CPU-heavy games. In GPU-heavy games such as The Witcher 3 or Strange Brigade, the Legion 5 Pro with its 150-W RTX 3070-Ti is clearly ahead. In DOTA 2 Reborn or X-Plane 11.11, the M16 is able to place on top.
| The Witcher 3 - 1920x1080 Ultra Graphics & Postprocessing (HBAO+) | |
| Average of class Gaming (8.61 - 216, n=226, last 2 years) | |
| Lenovo Legion 5 Pro 16ARH7H RTX 3070 Ti | |
| Corsair Voyager a1600 | |
| Asus ROG Zephyrus M16 GU603Z | |
| Asus ROG Zephyrus M16 GU603H | |
| SCHENKER Vision 16 Pro RTX 3070 Ti | |
| SCHENKER XMG Focus 16 (i7-12700H, RTX 3060) | |
| GTA V - 1920x1080 Highest Settings possible AA:4xMSAA + FX AF:16x | |
| SCHENKER Vision 16 Pro RTX 3070 Ti | |
| Asus ROG Zephyrus M16 GU603Z | |
| Average of class Gaming (6.38 - 167.7, n=218, last 2 years) | |
| Lenovo Legion 5 Pro 16ARH7H RTX 3070 Ti | |
| SCHENKER XMG Focus 16 (i7-12700H, RTX 3060) | |
| Corsair Voyager a1600 | |
| Asus ROG Zephyrus M16 GU603H | |
The laptop doesn't support Advanced Optimus but the regular Optimus instead, and it also offers an MUX switch, allowing you to actively switch between the integrated (or Hybrid mode) and the dedicated GPU.
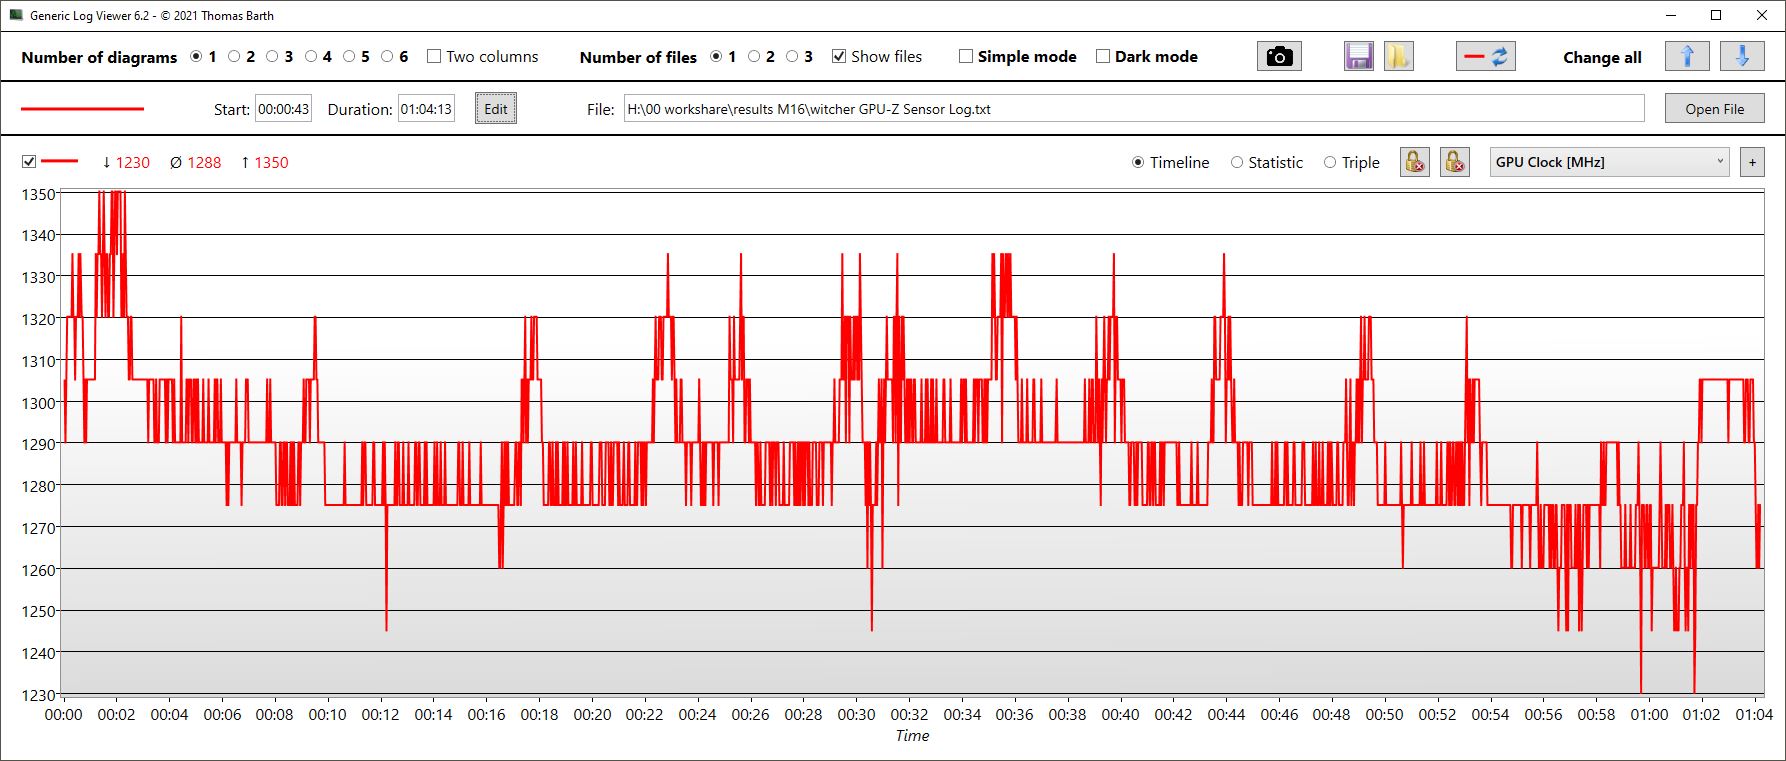
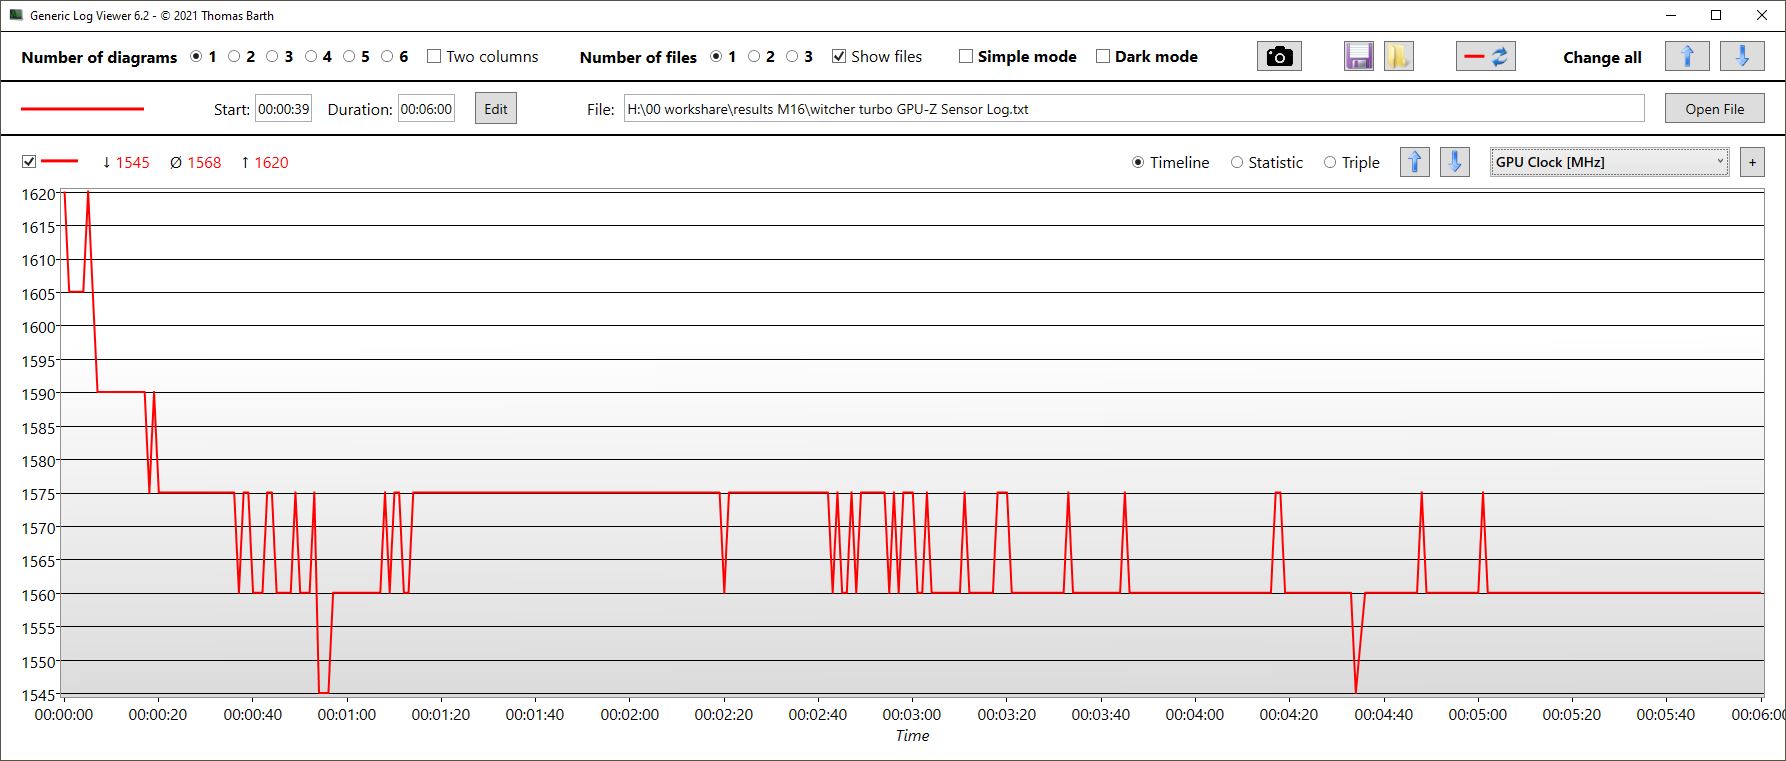
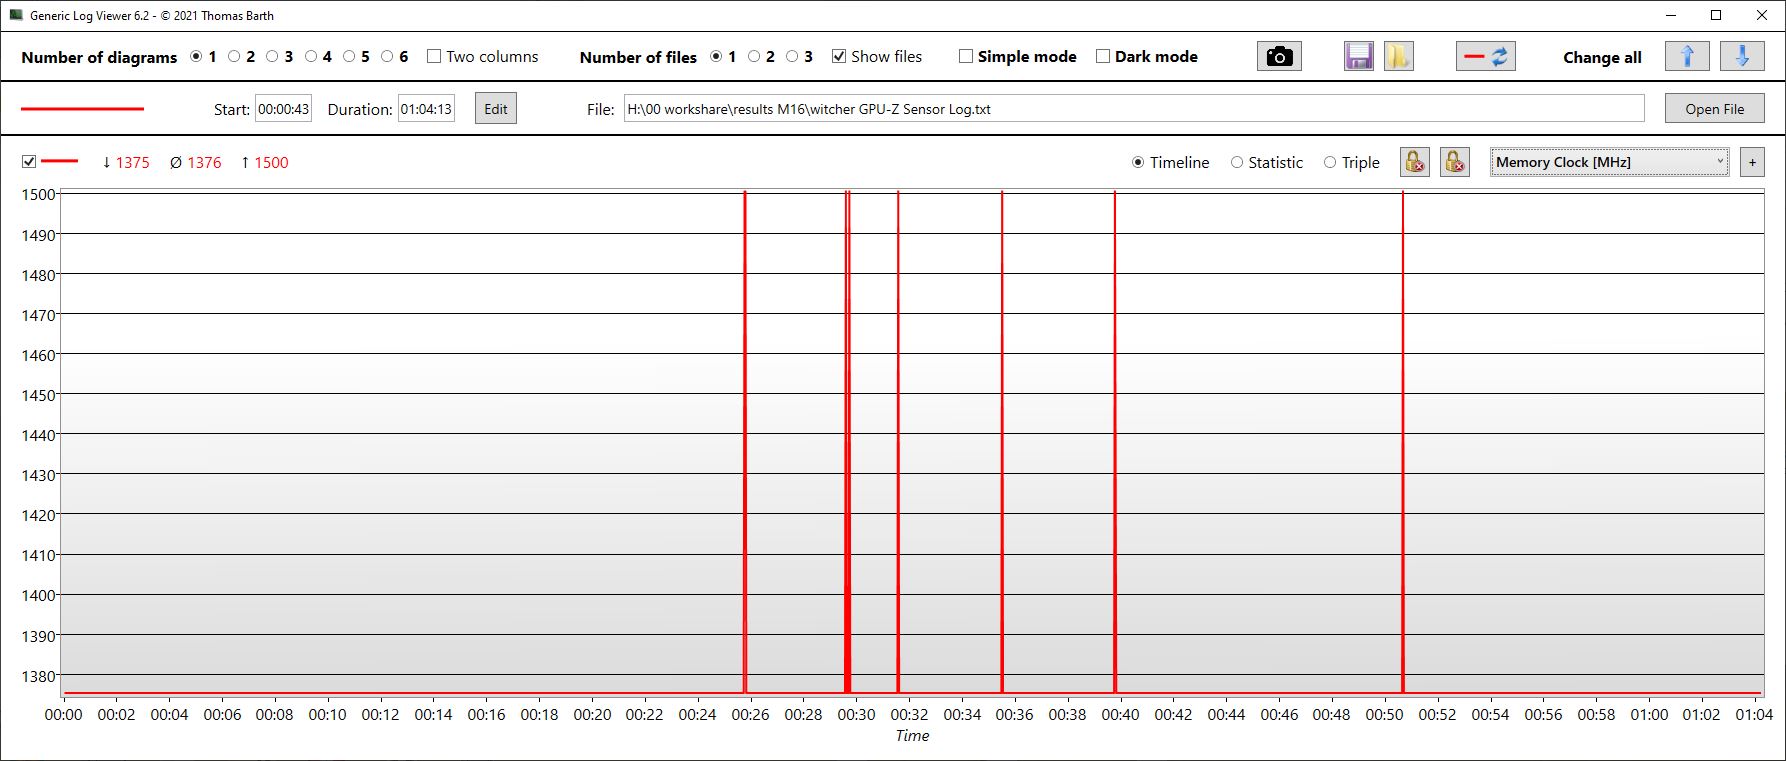
Our The Witcher 3 loop results in relatively constant frame rates. The performance differences between the competitors become easily apparent here: While Legion 5 Pro is significantly faster, the Schenker Vision 16 Pro is barely surpassed.
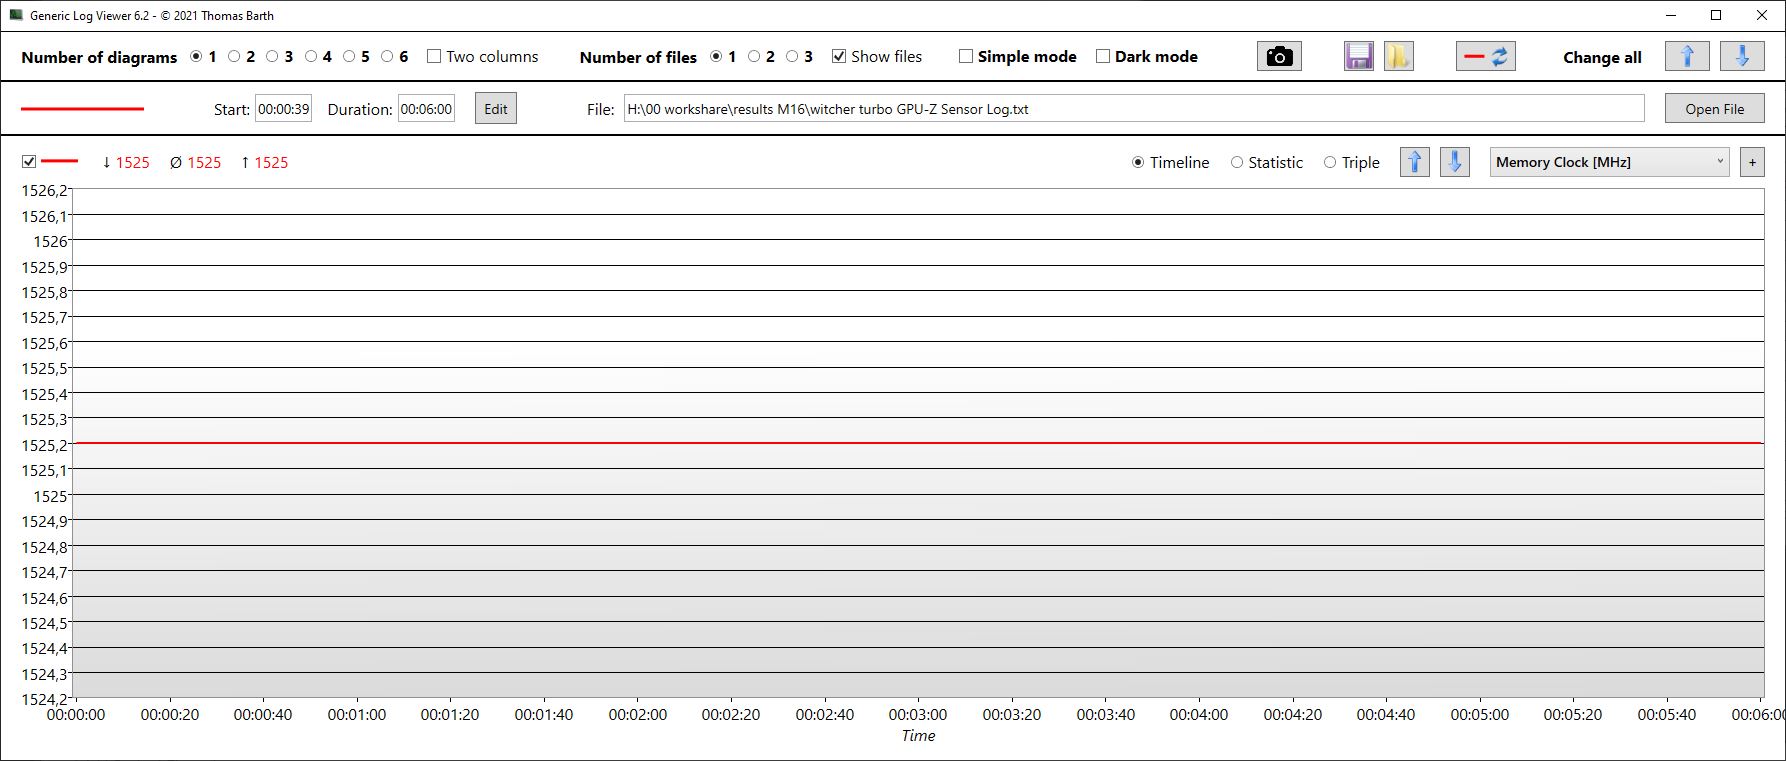
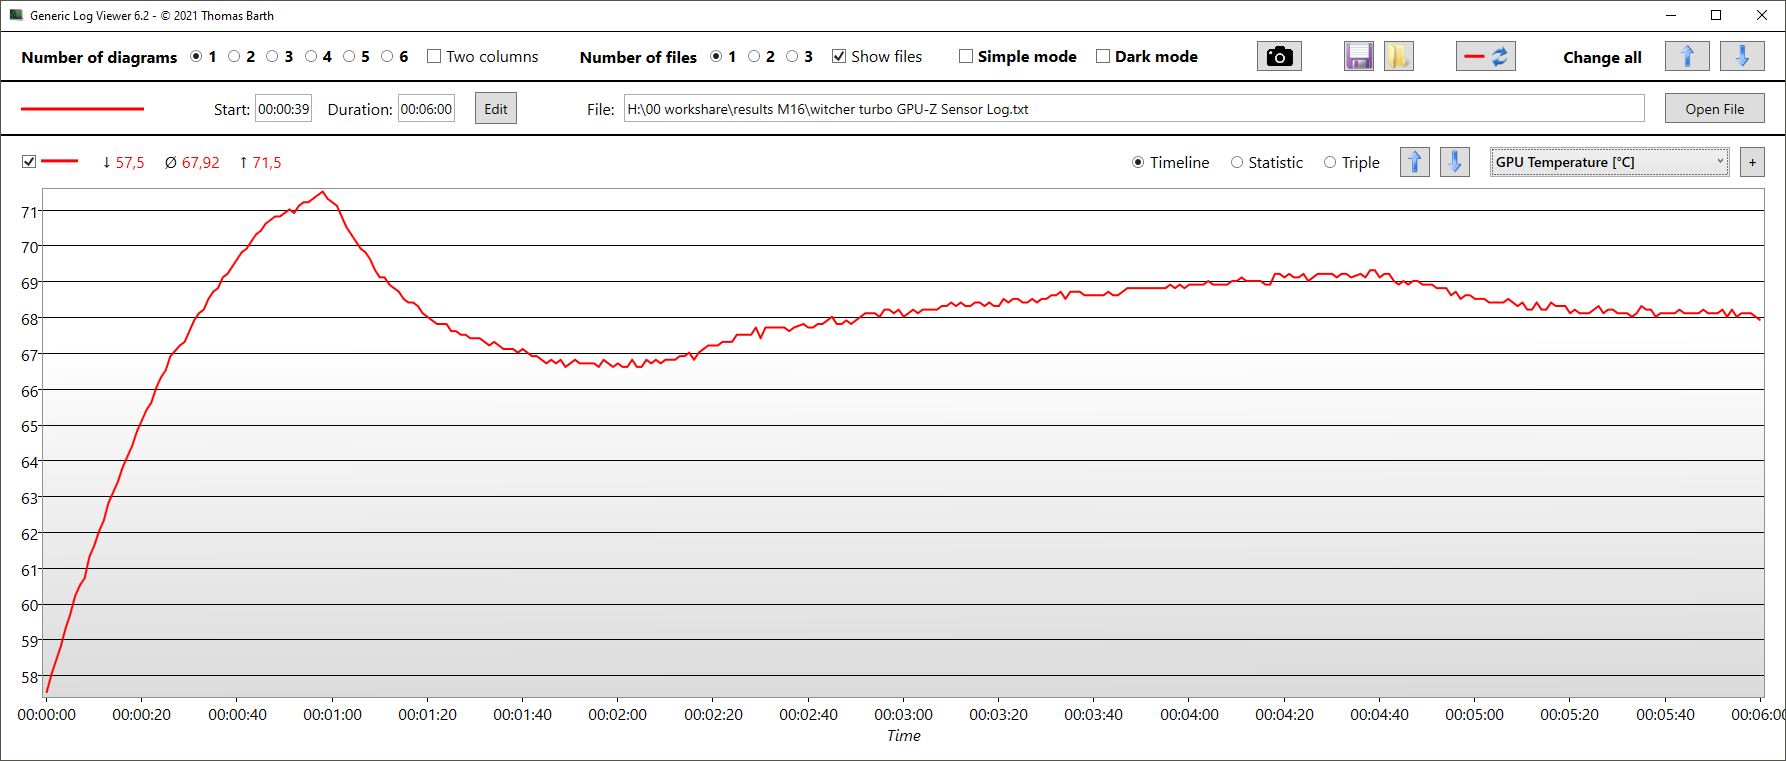
In Turbo mode (blue graph, measured for 6 minutes), the performance increases considerably, approaching that of the Legion 5 Pro in some parts. The noise produced by the laptop is then similarly loud, as you can also see in the Emissions section below. The GPU and storage speed increase, and the power consumption increases to almost 120 W.
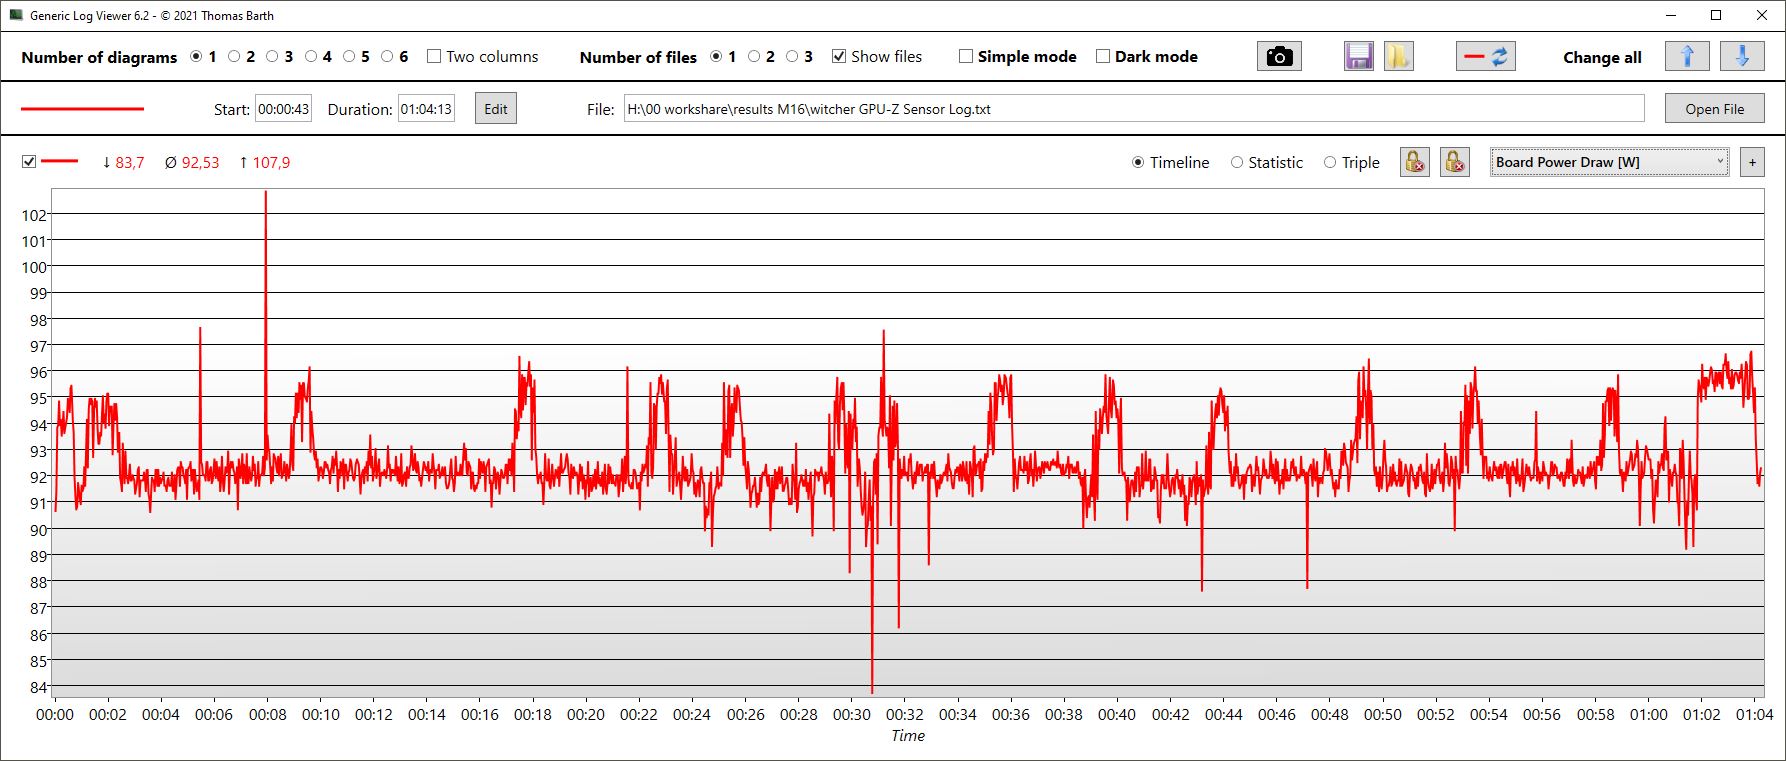
Over time, the GPU clock speed still decreases slightly, ending up at 1,288 MHz on average. The card heats up to around 72 °C (162 °F), while the card only consumes 93 W on average, which is still far from its TGP target value.
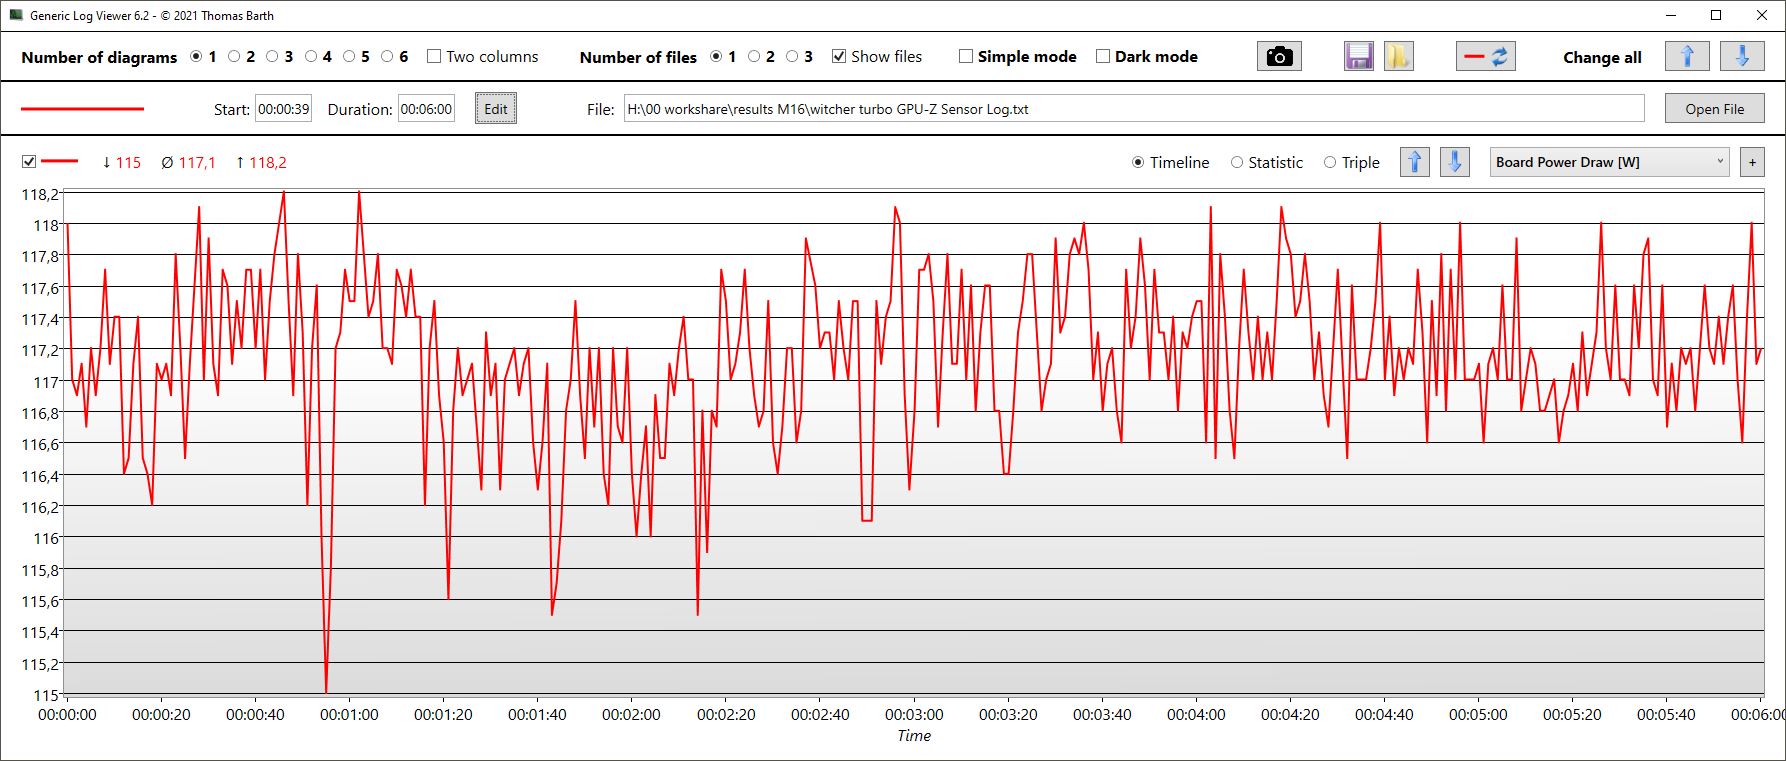
The Witcher 3 FPS Chart
| low | med. | high | ultra | QHD | 4K | |
| GTA V (2015) | 184.6 | 171.4 | 108.1 | |||
| The Witcher 3 (2015) | 370.2 | 273.2 | 171 | 99.5 | ||
| Dota 2 Reborn (2015) | 195.2 | 174.7 | 170.2 | 160.5 | ||
| Final Fantasy XV Benchmark (2018) | 123.8 | 94.8 | 72.1 | 43 | ||
| X-Plane 11.11 (2018) | 166.8 | 145.7 | 115 | |||
| Far Cry 5 (2018) | 174 | 128 | 128 | 124 | 90 | |
| Strange Brigade (2018) | 376 | 227 | 187.9 | 163.8 | ||
| Dying Light 2 (2022) | 98.5 | 79 | 66 | 46.7 |
Emissions - A moderate Asus M16
Noise Levels
During idle operation, the fans are often turned off - but not consistently. From time to time, they can easily rev up to 47 dB, for example right after rebooting, when Windows is starting.
During the first scene of the 3DMark 06 benchmark, the fans remain mostly quiet at 34 dB, and the fan noise only increases to 47 dB right before the end. The Schenker Vision 16 Pro and the Legion 5 Pro are able to remain quiet even longer.
When gaming, the M16 operation remains rather quiet compared to its competitors, some of which produce a noise level significantly above 50 dB, while that of the M16 remains below that. However, this only goes for the Performance mode. If you use Turbo mode, the fans rev up to almost 55 dB, which is at the same level as the Legion 5 Pro and significantly louder than the Vision 16 Pro.
Noise Level
| Idle |
| 23 / 24 / 47 dB(A) |
| Load |
| 47.91 / 50.25 dB(A) |
 | ||
30 dB silent 40 dB(A) audible 50 dB(A) loud |
||
min: | ||
| Asus ROG Zephyrus M16 GU603Z GeForce RTX 3070 Ti Laptop GPU, i9-12900H, Micron 3400 1TB MTFDKBA1T0TFH | Asus ROG Zephyrus M16 GU603H GeForce RTX 3070 Laptop GPU, i9-11900H, Samsung PM9A1 MZVL22T0HBLB | SCHENKER Vision 16 Pro RTX 3070 Ti GeForce RTX 3070 Ti Laptop GPU, i7-12700H, Samsung SSD 980 Pro 1TB MZ-V8P1T0BW | Lenovo Legion 5 Pro 16ARH7H RTX 3070 Ti GeForce RTX 3070 Ti Laptop GPU, R7 6800H, Samsung PM9A1 MZVL21T0HCLR | SCHENKER XMG Focus 16 (i7-12700H, RTX 3060) GeForce RTX 3060 Laptop GPU, i7-12700H, Samsung SSD 980 Pro 1TB MZ-V8P1T0BW | Corsair Voyager a1600 Radeon RX 6800M, R9 6900HS, Samsung PM9A1 MZVL22T0HBLB | |
|---|---|---|---|---|---|---|
| Noise | -8% | 8% | -1% | 0% | -9% | |
| off / environment * | 23 | 25 -9% | 22.9 -0% | 23.5 -2% | 23 -0% | 29.9 -30% |
| Idle Minimum * | 23 | 25 -9% | 24.3 -6% | 23.7 -3% | 23 -0% | 30.5 -33% |
| Idle Average * | 24 | 31 -29% | 24.3 -1% | 31.1 -30% | 23 4% | 30.6 -28% |
| Idle Maximum * | 47 | 42 11% | 24.3 48% | 32.2 31% | 32.07 32% | 30.7 35% |
| Load Average * | 47.91 | 48 -0% | 38.5 20% | 38.4 20% | 53.7 -12% | 44.5 7% |
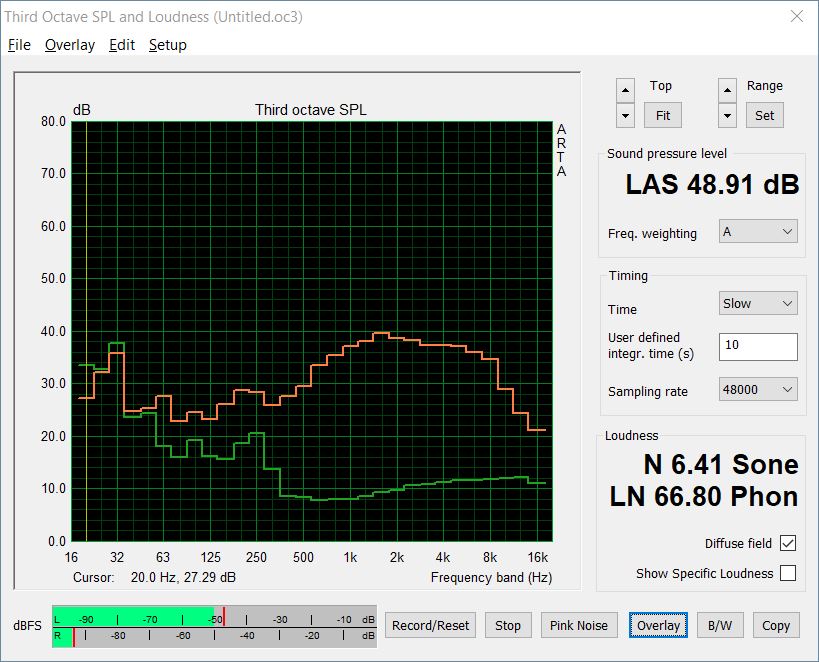
| Witcher 3 ultra * | 48.91 | 52 -6% | 51 -4% | 54.8 -12% | 54.58 -12% | |
| Load Maximum * | 50.25 | 56 -11% | 51 -1% | 54.8 -9% | 54.58 -9% | 51.1 -2% |
* ... smaller is better
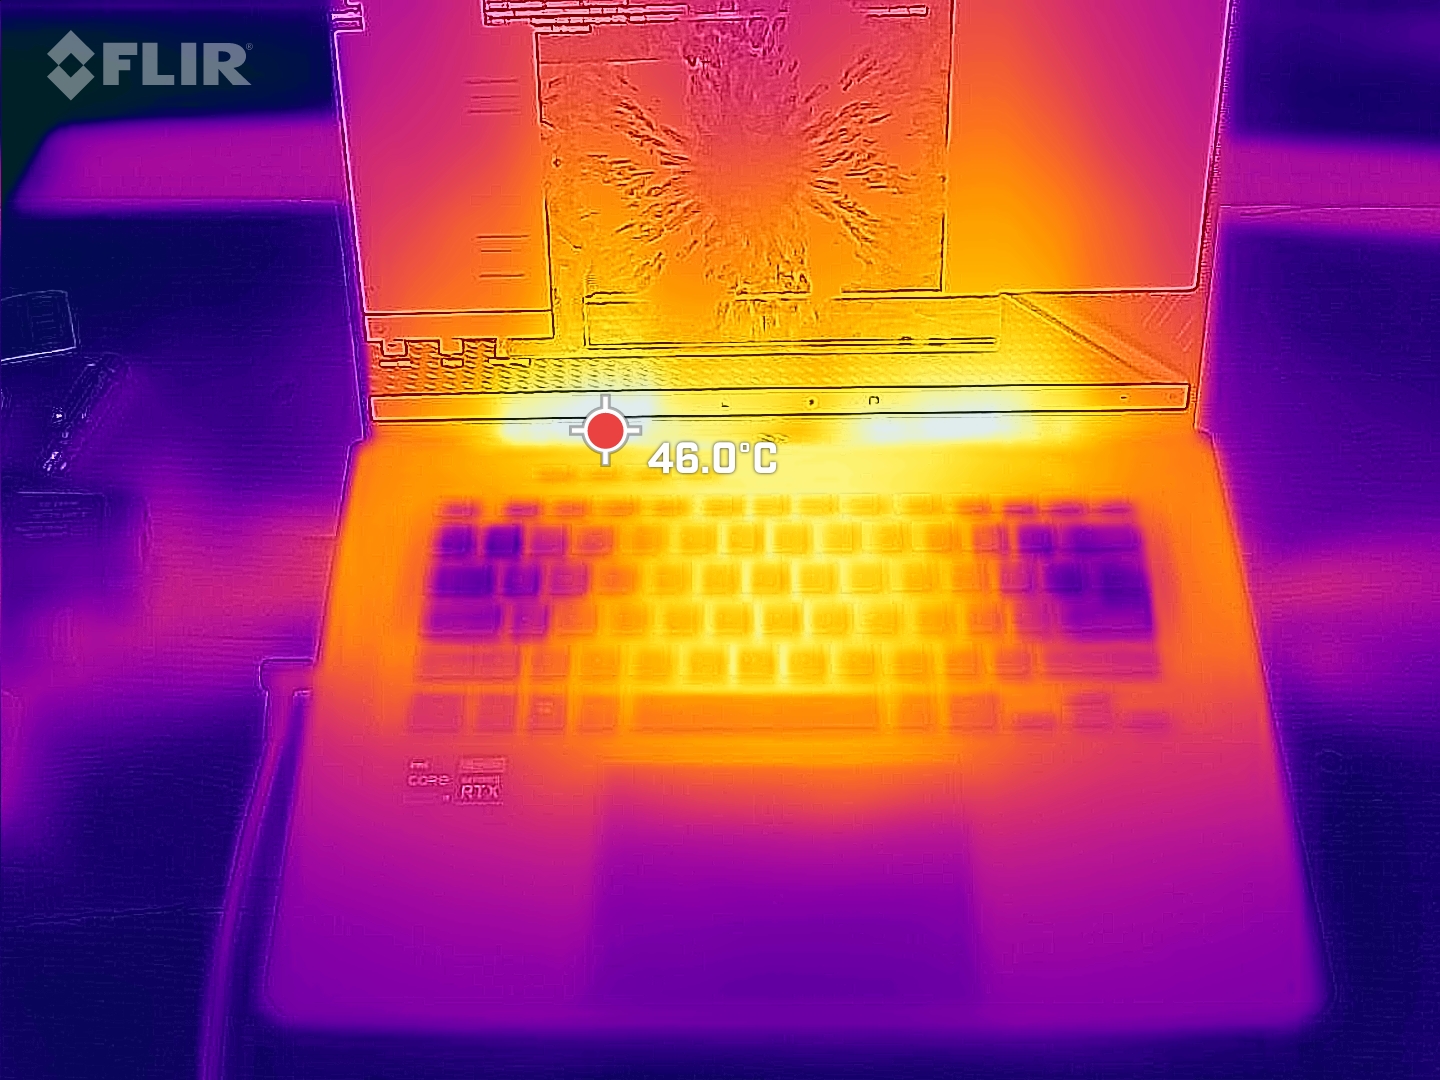
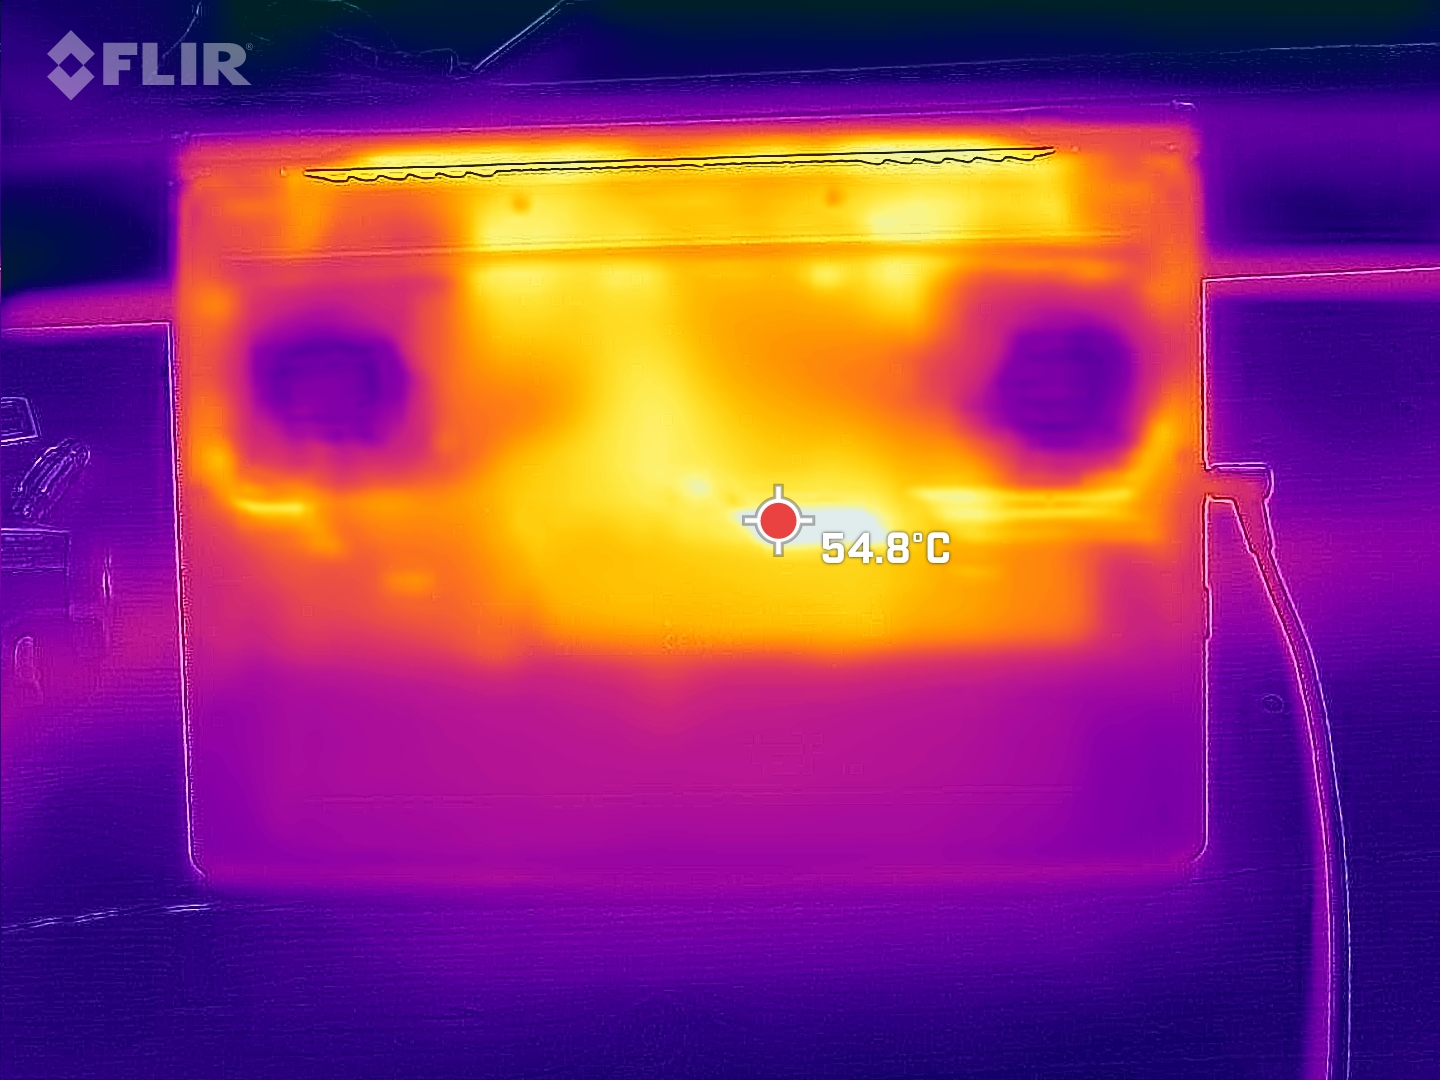
Temperatures
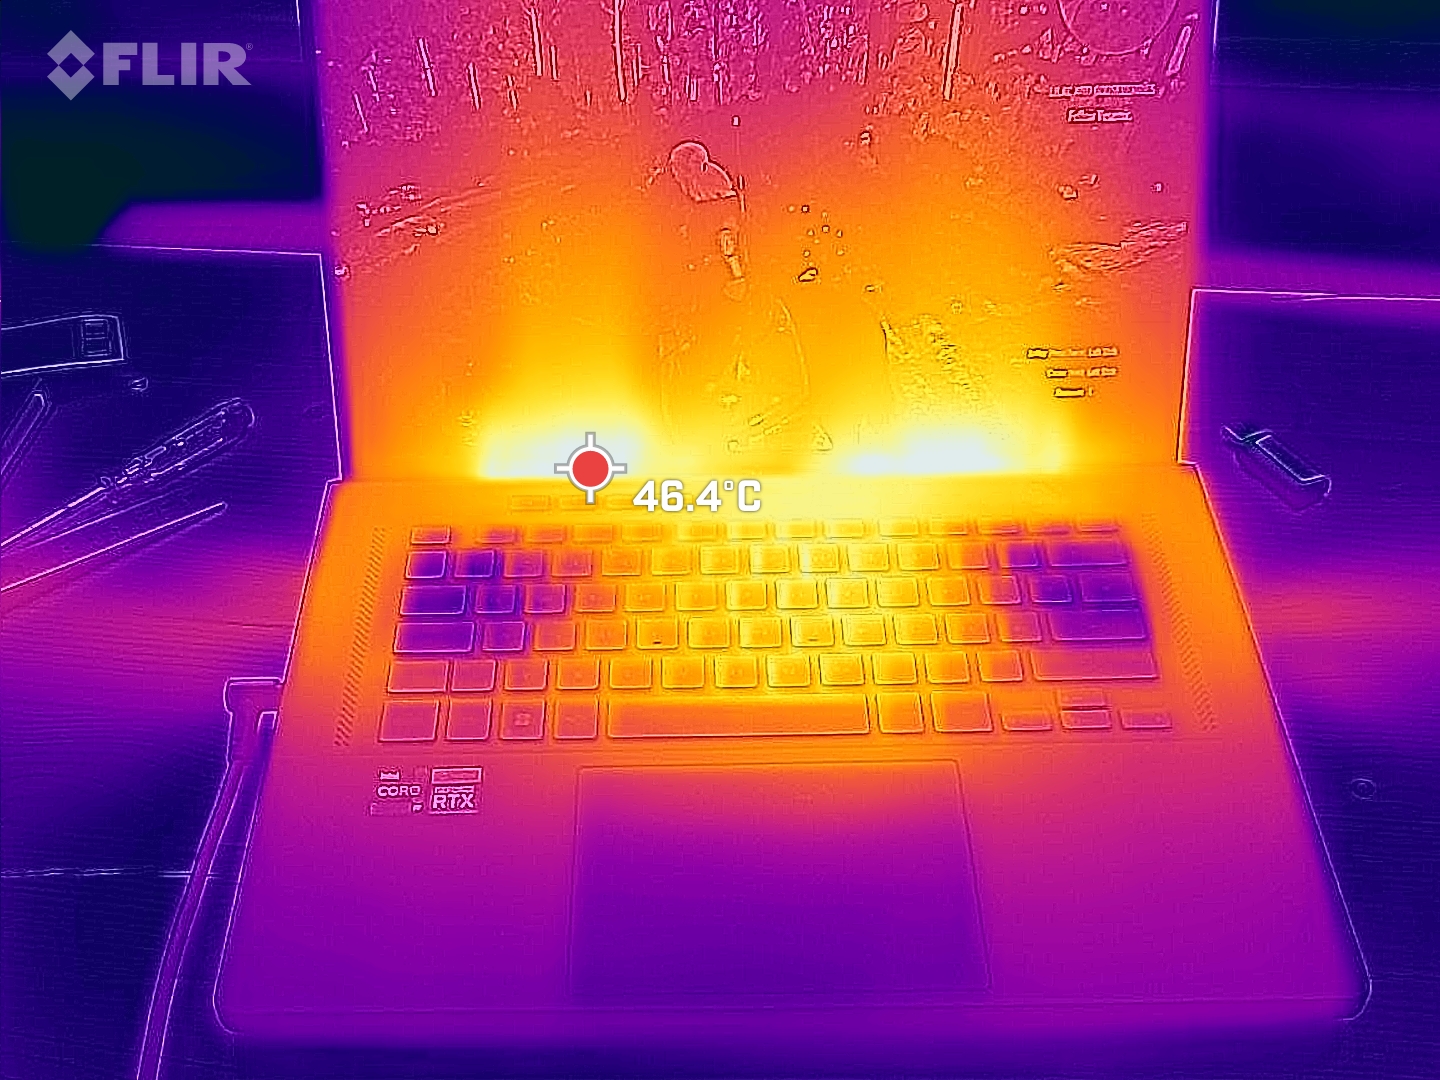
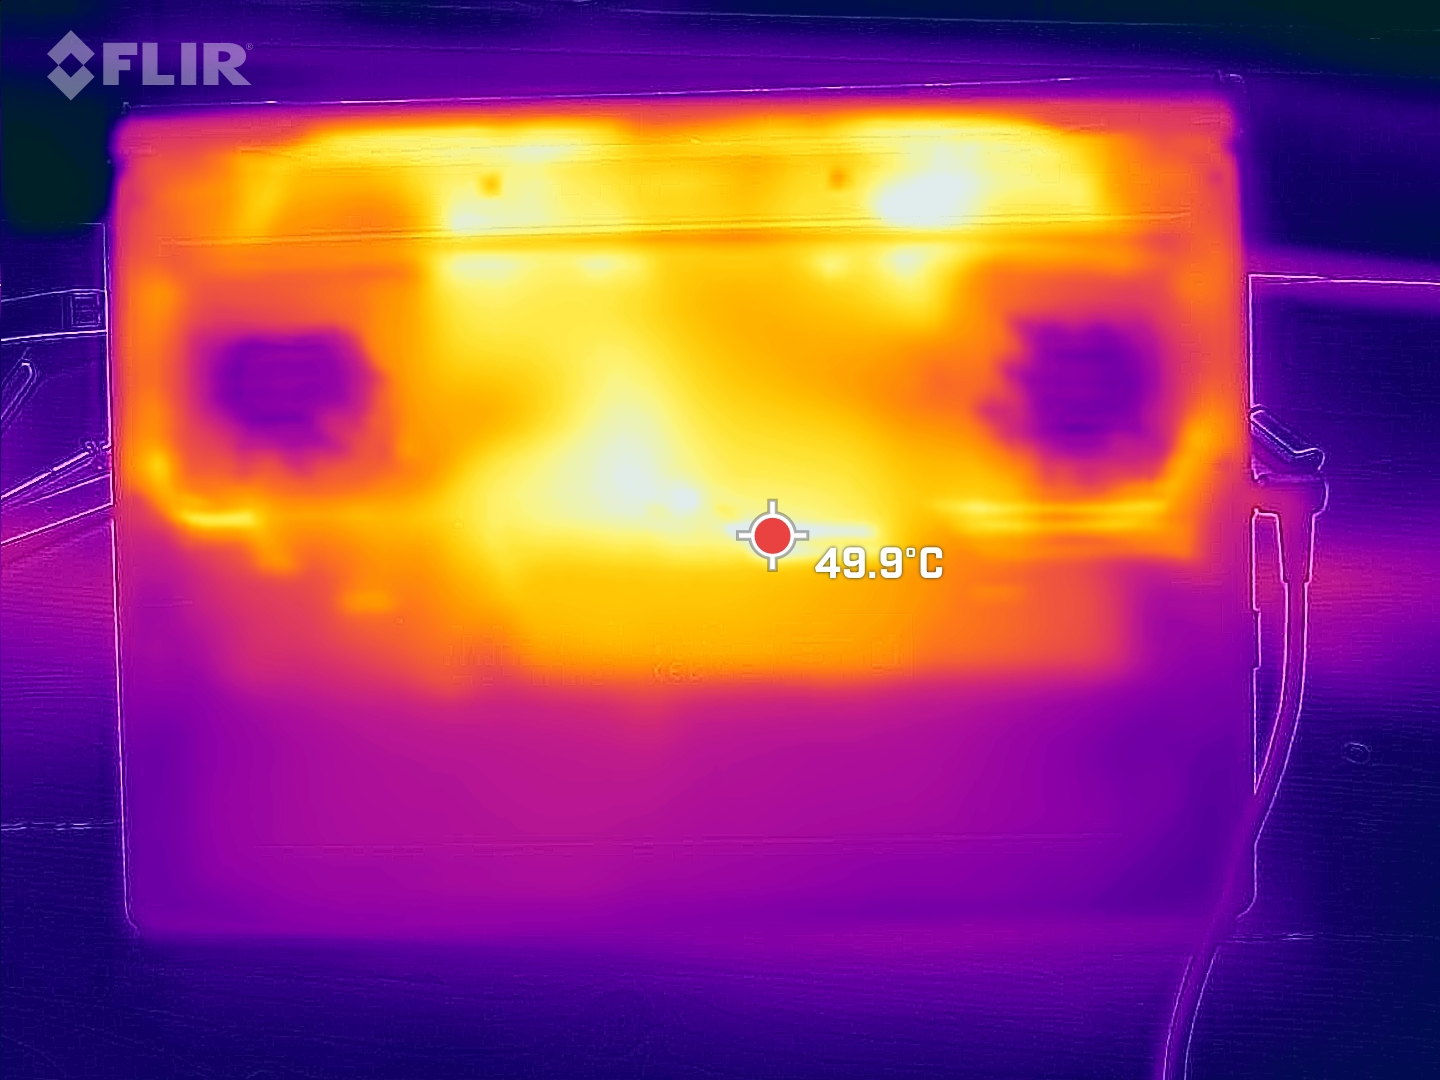
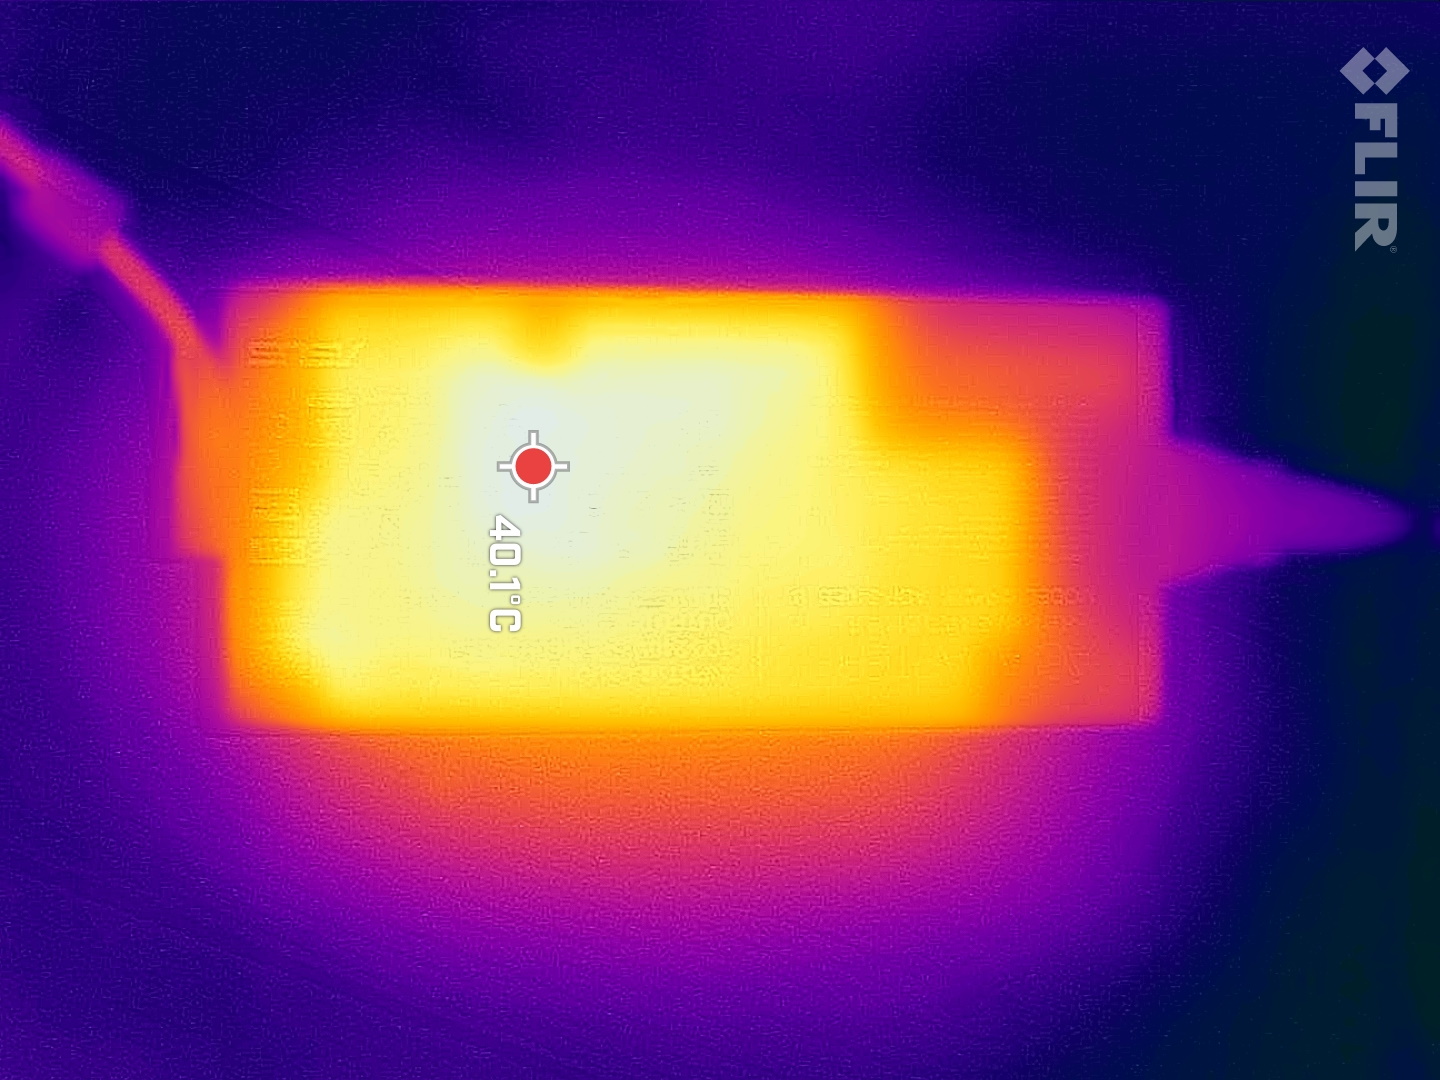
Under heavy load, the top and bottom of the case heat up to slightly above 50 °C (122 °F). This remains within the usual limits and is even slightly better than the predecessor. The Legion 5 Pro remains slightly cooler on top, and the Vision 16 Pro is slightly cooler at the bottom.
(-) The maximum temperature on the upper side is 52 °C / 126 F, compared to the average of 40.4 °C / 105 F, ranging from 21.2 to 68.8 °C for the class Gaming.
(-) The bottom heats up to a maximum of 51 °C / 124 F, compared to the average of 43.2 °C / 110 F
(+) In idle usage, the average temperature for the upper side is 26.4 °C / 80 F, compared to the device average of 33.8 °C / 93 F.
(-) Playing The Witcher 3, the average temperature for the upper side is 40.2 °C / 104 F, compared to the device average of 33.8 °C / 93 F.
(+) The palmrests and touchpad are reaching skin temperature as a maximum (32 °C / 89.6 F) and are therefore not hot.
(-) The average temperature of the palmrest area of similar devices was 28.9 °C / 84 F (-3.1 °C / -5.6 F).
| Asus ROG Zephyrus M16 GU603Z Intel Core i9-12900H, NVIDIA GeForce RTX 3070 Ti Laptop GPU | Asus ROG Zephyrus M16 GU603H Intel Core i9-11900H, NVIDIA GeForce RTX 3070 Laptop GPU | SCHENKER Vision 16 Pro RTX 3070 Ti Intel Core i7-12700H, NVIDIA GeForce RTX 3070 Ti Laptop GPU | Lenovo Legion 5 Pro 16ARH7H RTX 3070 Ti AMD Ryzen 7 6800H, NVIDIA GeForce RTX 3070 Ti Laptop GPU | SCHENKER XMG Focus 16 (i7-12700H, RTX 3060) Intel Core i7-12700H, NVIDIA GeForce RTX 3060 Laptop GPU | Corsair Voyager a1600 AMD Ryzen 9 6900HS, AMD Radeon RX 6800M | |
|---|---|---|---|---|---|---|
| Heat | -15% | 9% | 3% | 4% | -7% | |
| Maximum Upper Side * | 52 | 52 -0% | 50.8 2% | 43.8 16% | 50 4% | 50.7 2% |
| Maximum Bottom * | 51 | 53 -4% | 46.3 9% | 53 -4% | 48 6% | 54.2 -6% |
| Idle Upper Side * | 29 | 38 -31% | 27.2 6% | 30 -3% | 28 3% | 35.8 -23% |
| Idle Bottom * | 33 | 41 -24% | 26.6 19% | 31.8 4% | 32 3% | 33 -0% |
* ... smaller is better
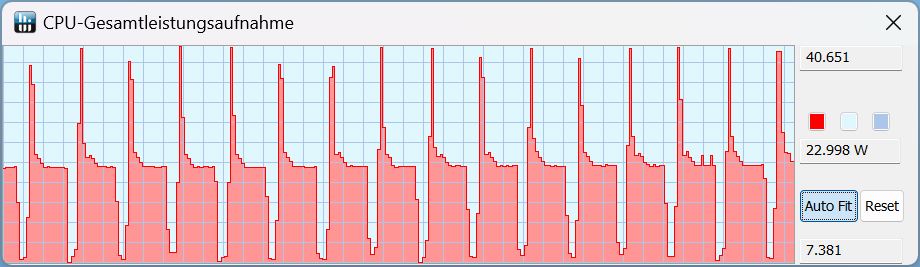
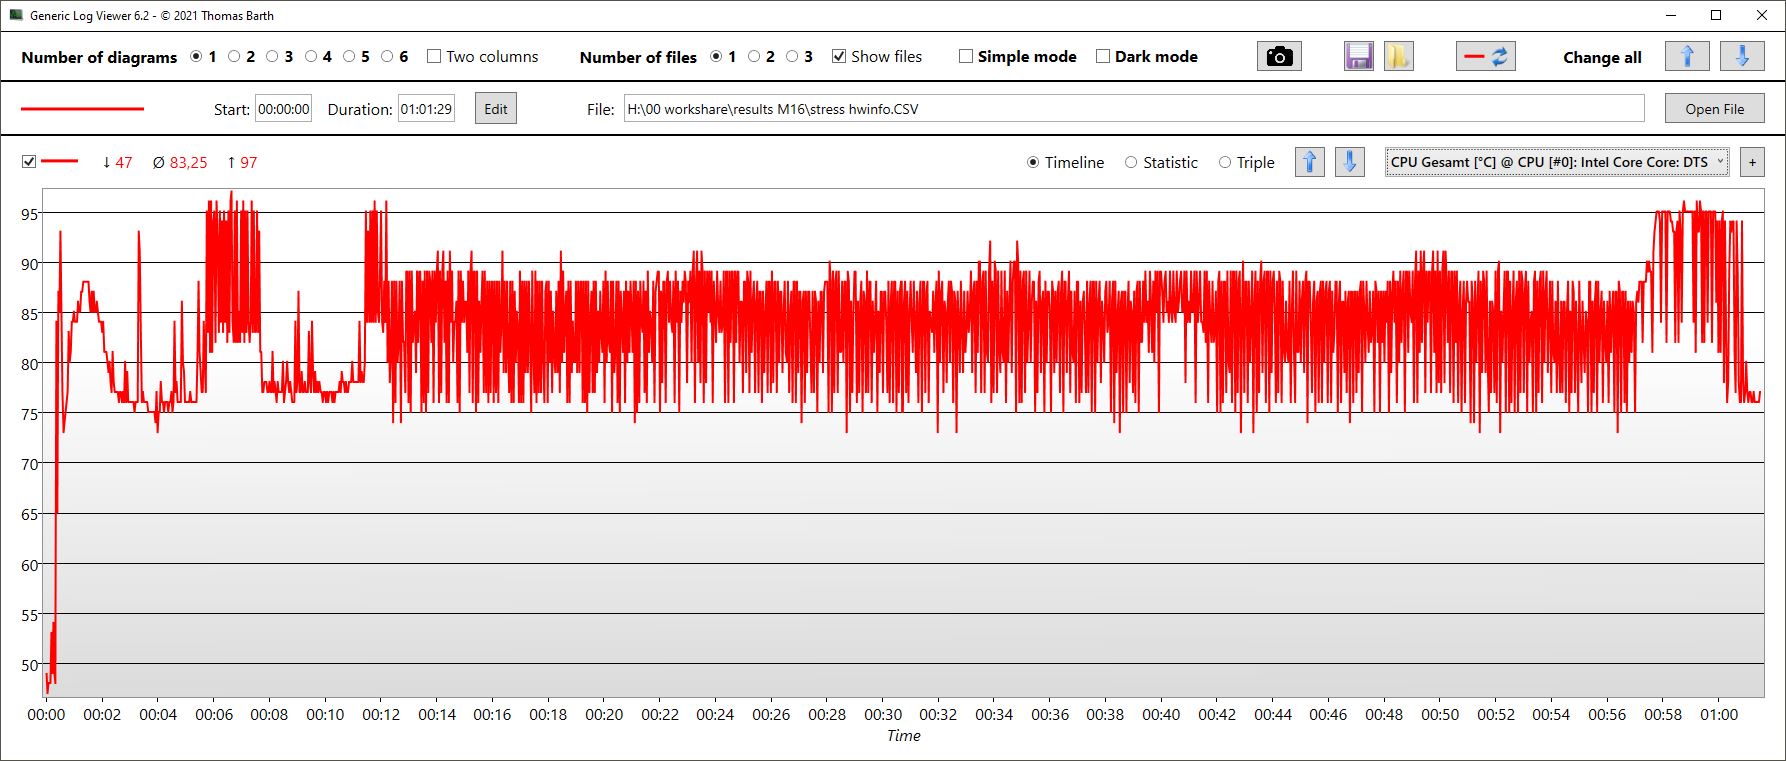
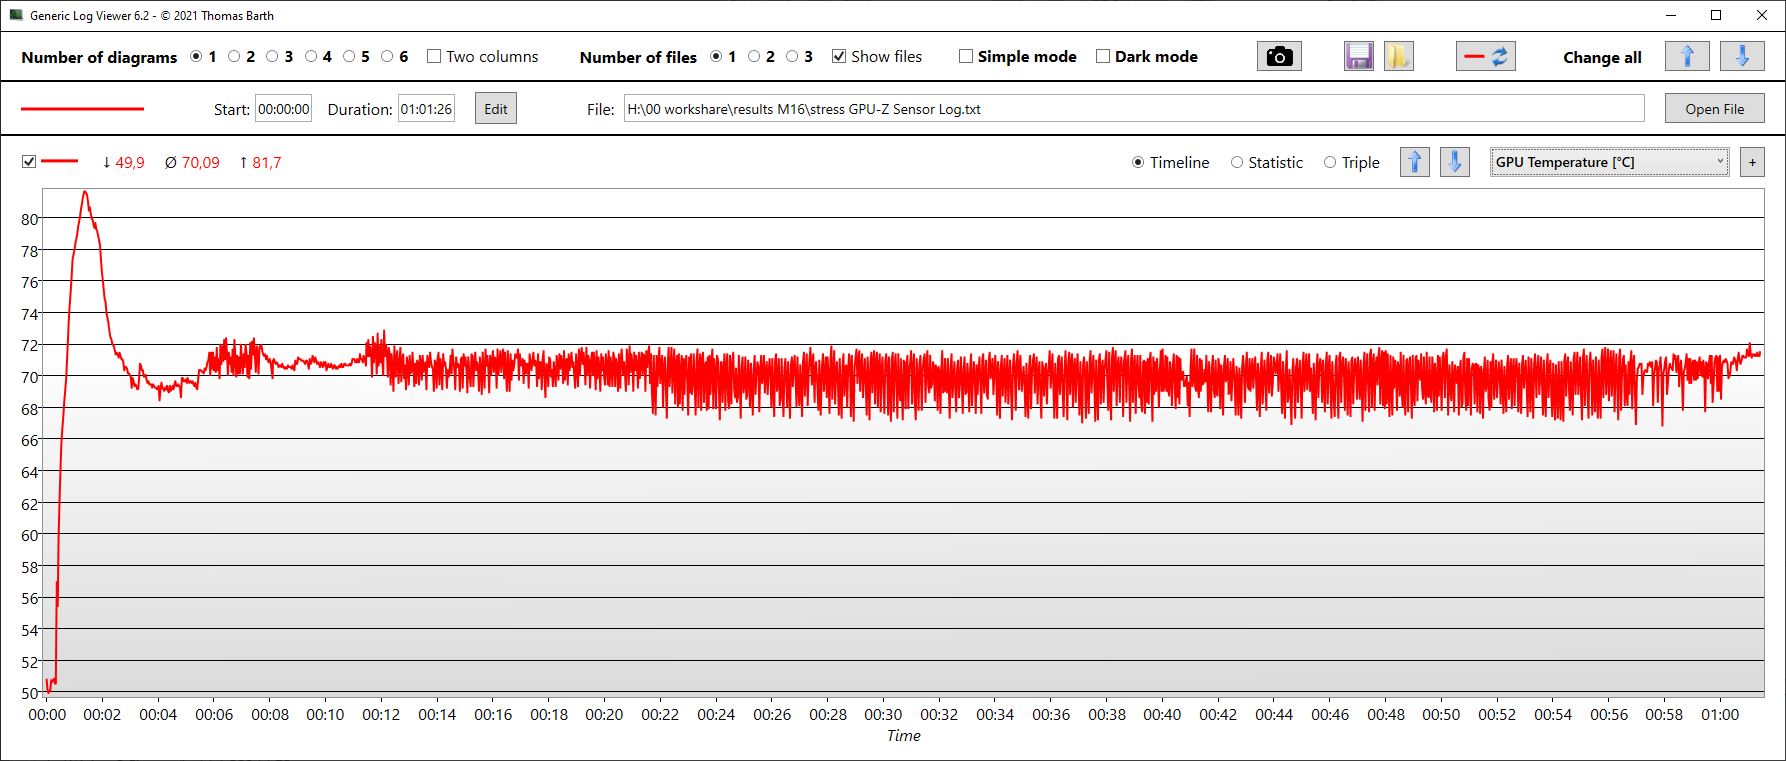
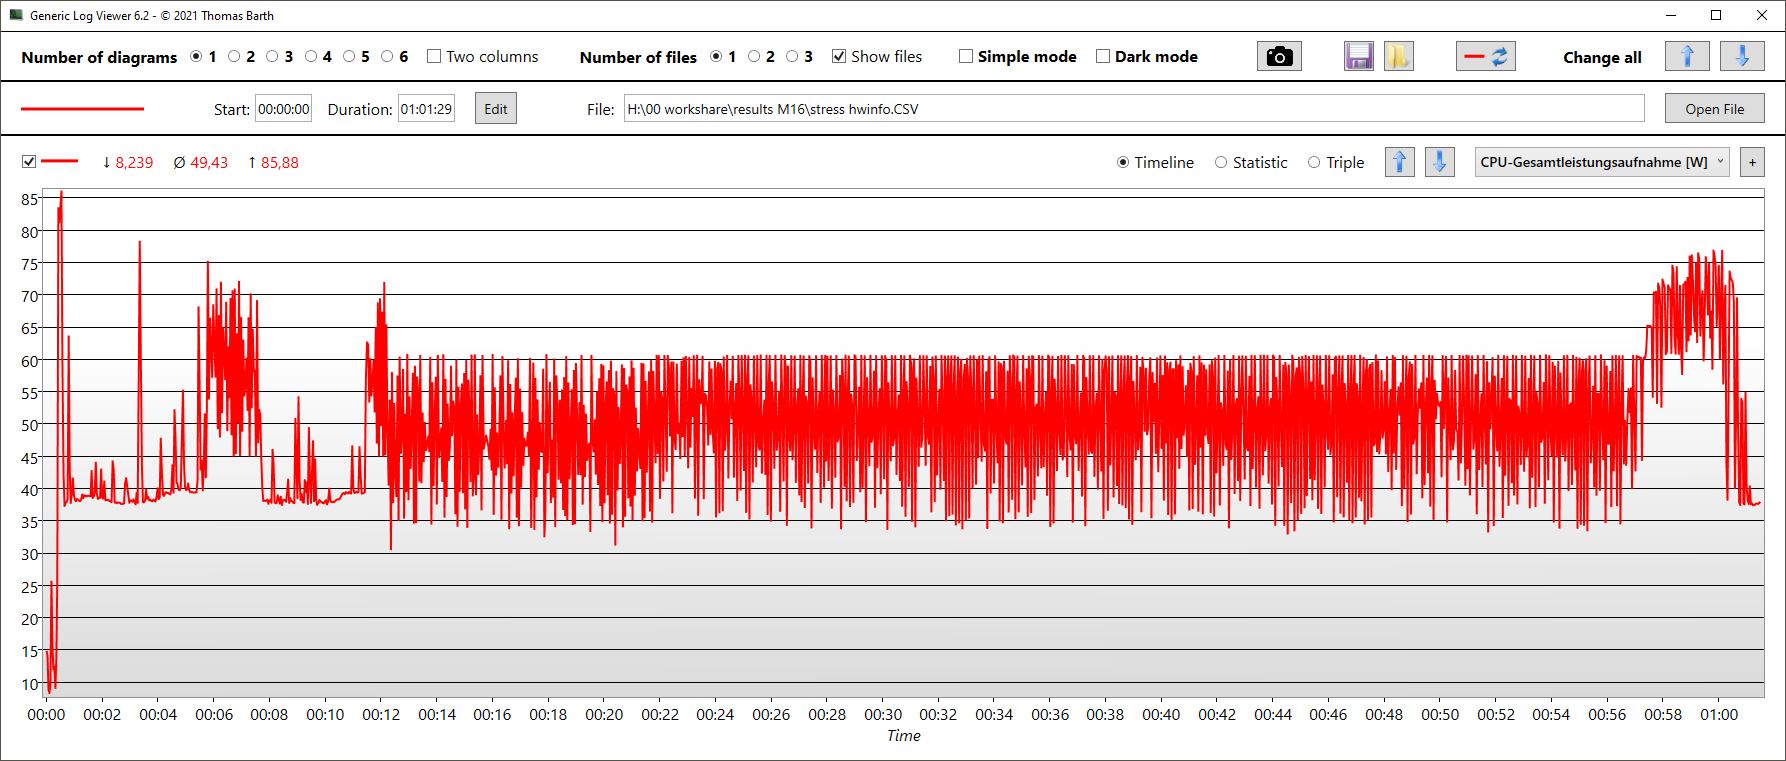
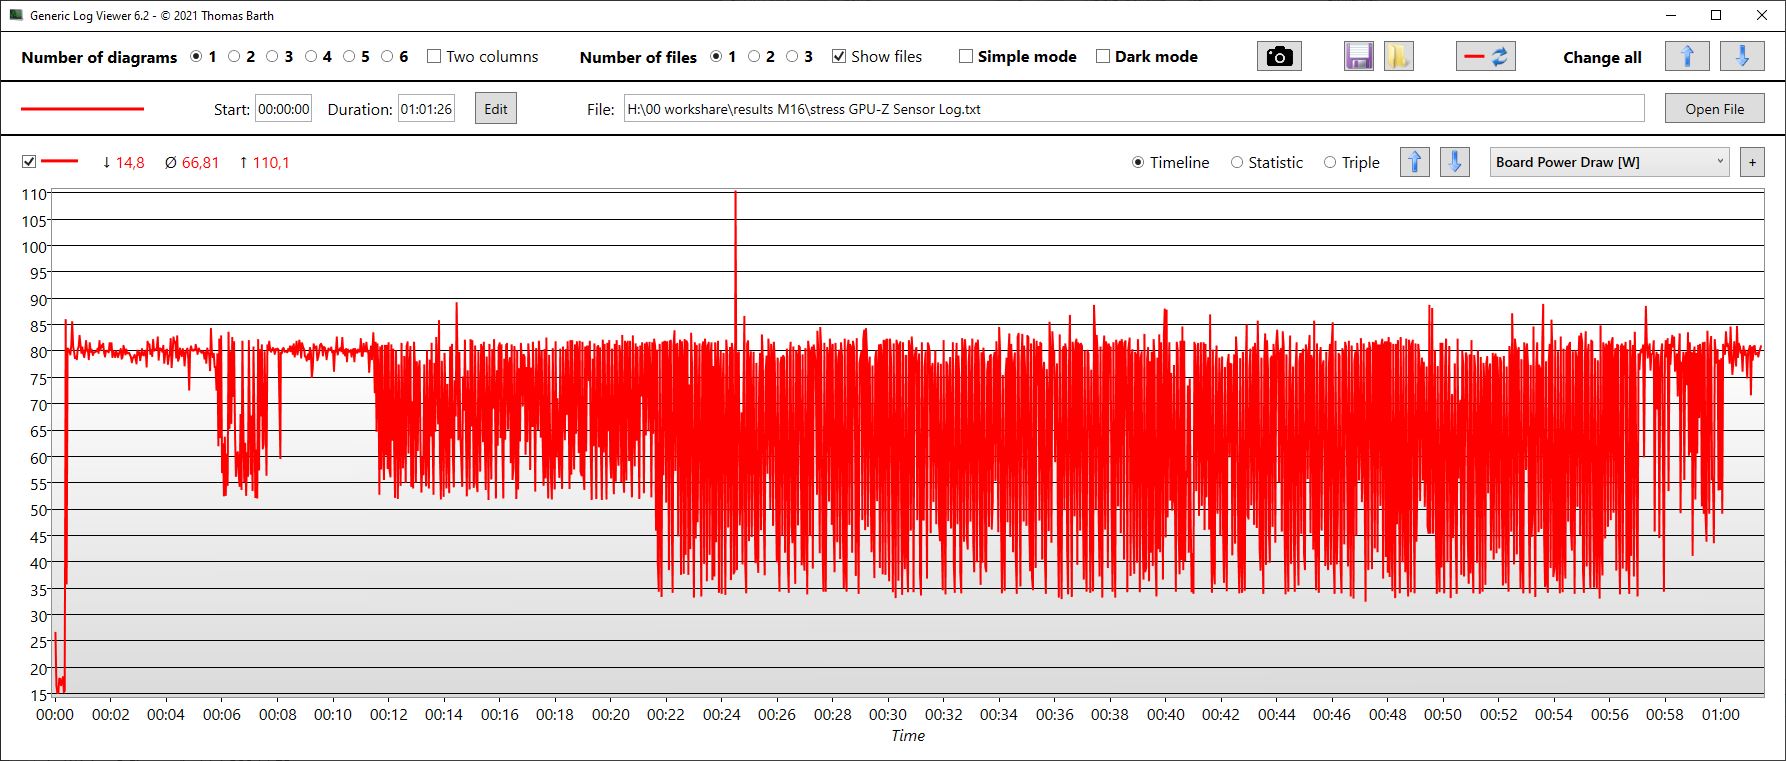
Stress Test
The CPU cores start our stress test briefly at 3.5 GHz. After a few seconds, the clock speed starts dropping, leveling out at around 2.4 GHz. The temperature varies with a maximum of 97 °C (207 °F) and 83 °C (181 °F) on average. The TDP of the CPU is 44 W on average.
The graphics speed varies significantly between 500 and 1,600 MHz, with an average of 838 MHz. The storage speed ranges around 1.4 GHz, with the GPU heating up to about 70 °C (158 °F). We measure a power consumption of about 66 W.
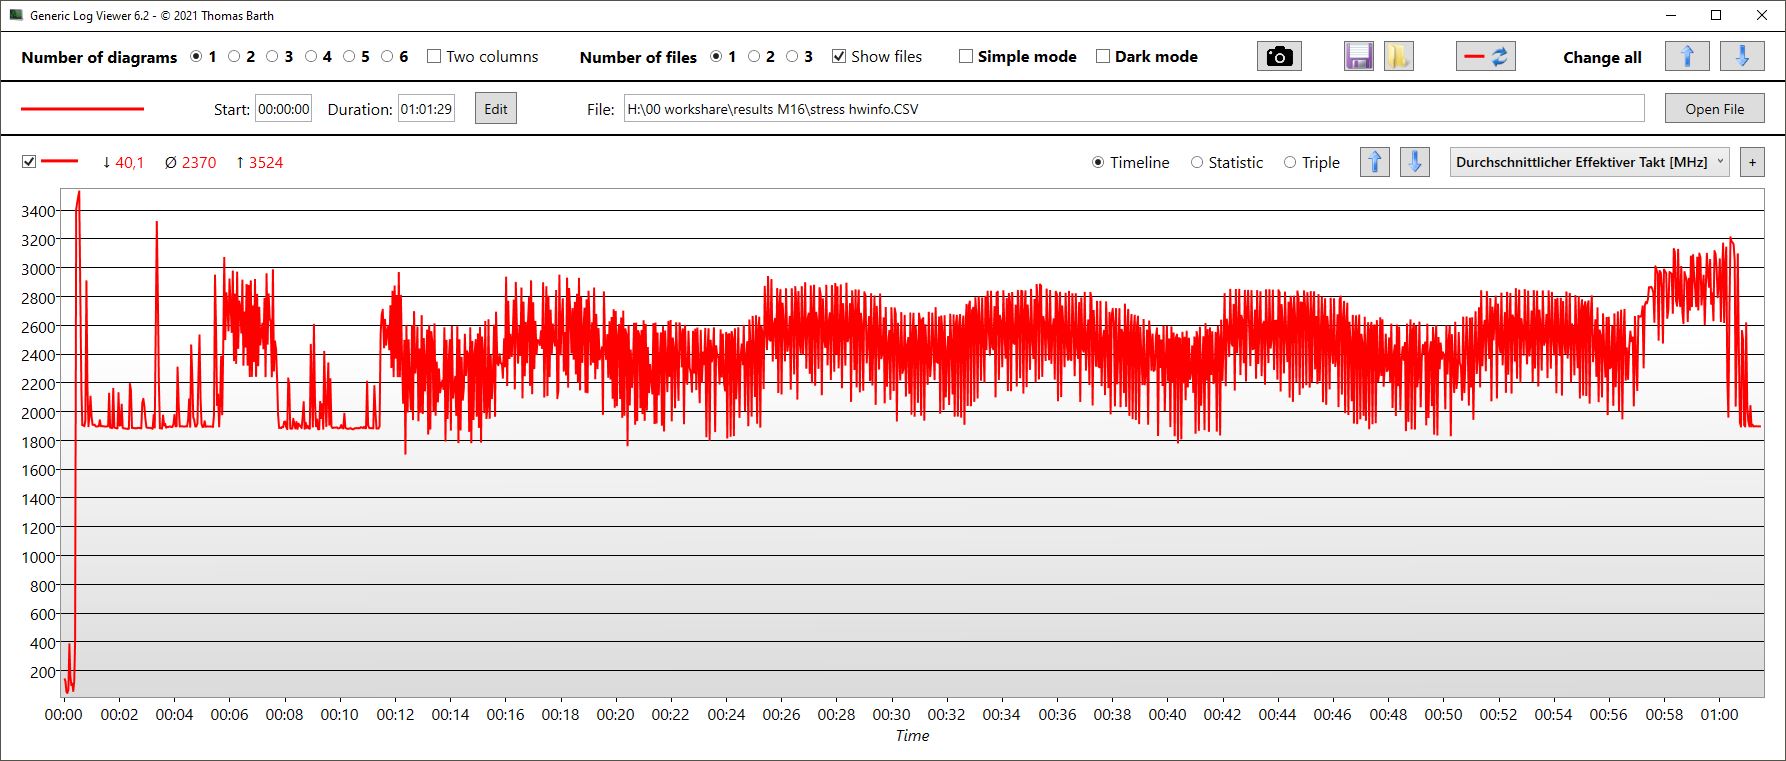
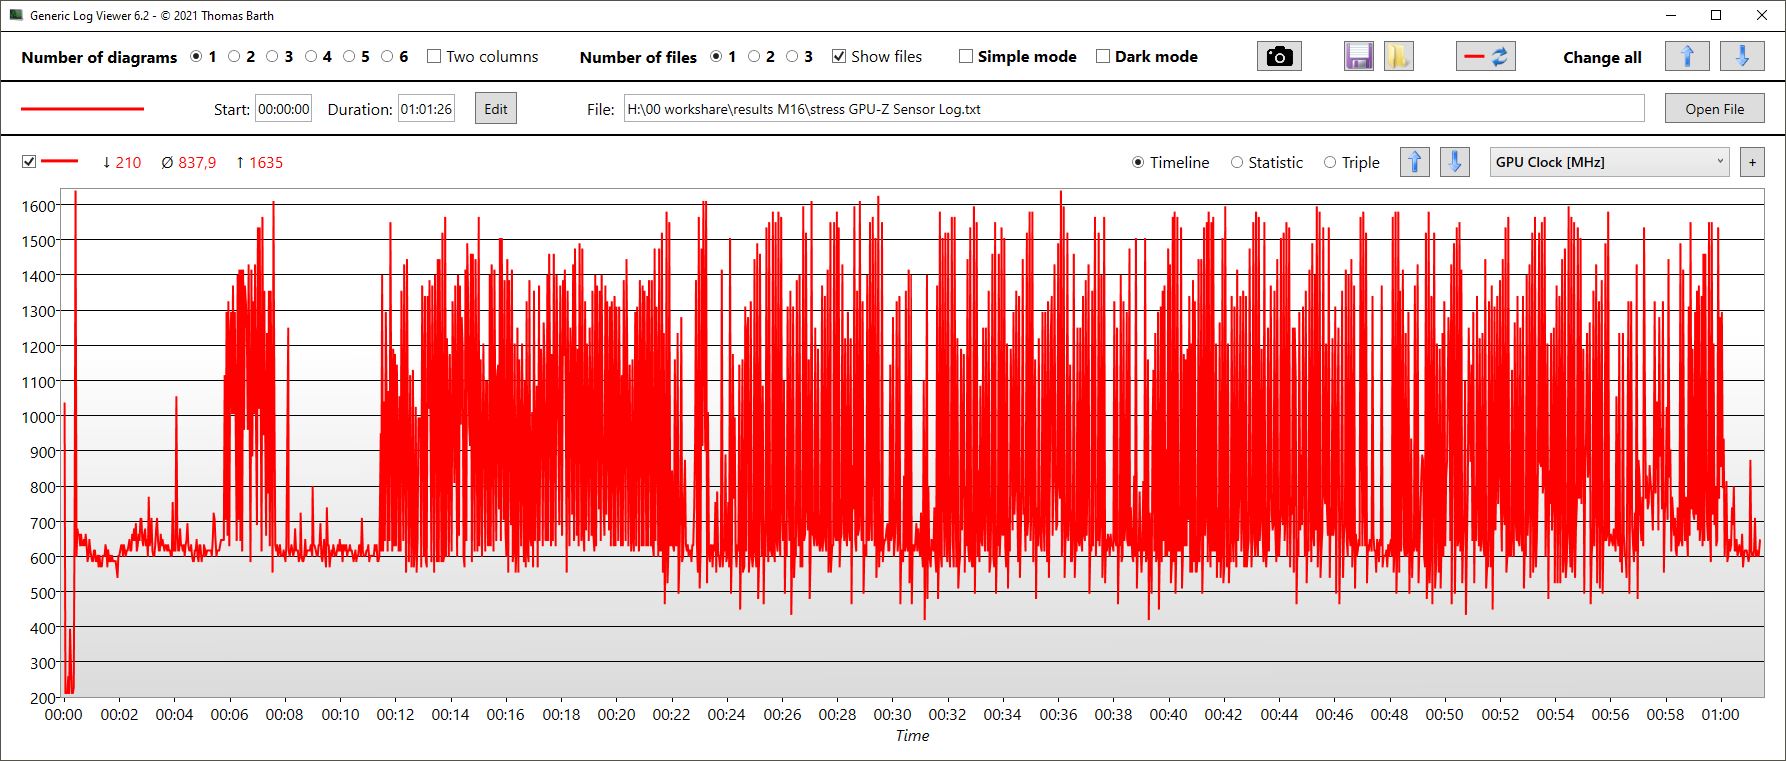
| CPU Clock (GHz) | GPU Clock (MHz) | Average CPU Temperature (°C) | Average GPU Temperature (°C) | |
| Prime95 + FurMark Stress | 2,4 | 838 | 83 | 70 |
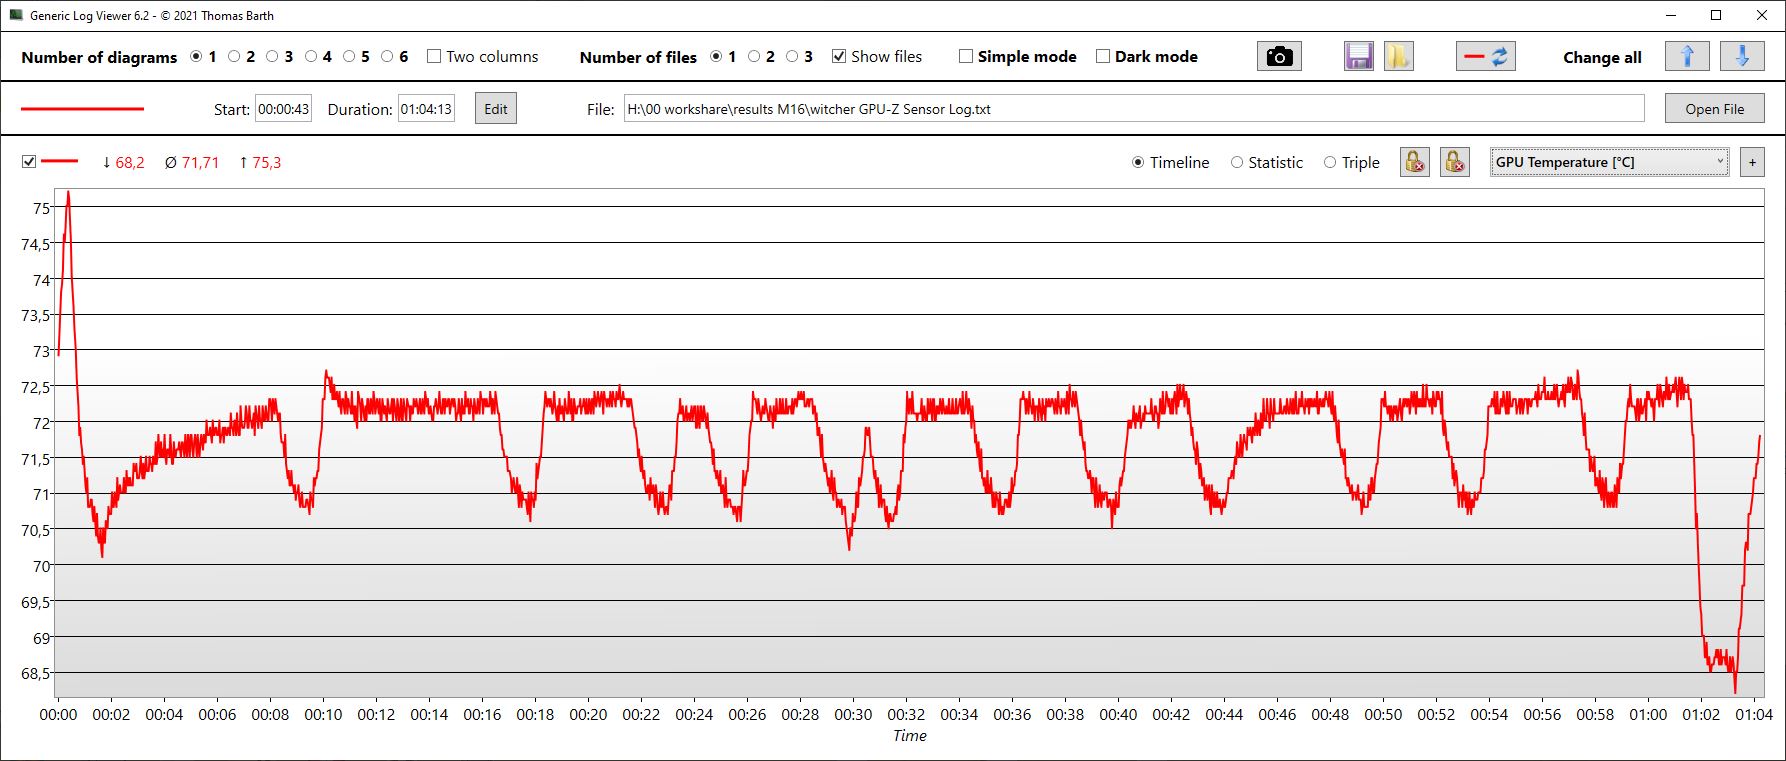
| The Witcher 3 Stress | 1.1 | 1,288 | 68 | 72 |
Speakers
Asus takes a special path with the speakers in the M16: Instead of the usual stereo speakers, the manufacturer uses four speakers with 2 W each, two for the high frequencies and two for the lower tones. This becomes quite noticeable, and the speakers are not only relatively loud, but they also offer balanced mids and highs, and even the bass is not as underrepresented as in many competitors.
However, they still cannot replace half-way decent external speakers. For the connection of analog audio devices, you can use a combined audio port.
Asus ROG Zephyrus M16 GU603Z audio analysis
(+) | speakers can play relatively loud (82.96 dB)
Bass 100 - 315 Hz
(±) | reduced bass - on average 11.6% lower than median
(±) | linearity of bass is average (9.2% delta to prev. frequency)
Mids 400 - 2000 Hz
(+) | balanced mids - only 4.3% away from median
(+) | mids are linear (5.7% delta to prev. frequency)
Highs 2 - 16 kHz
(+) | balanced highs - only 1.6% away from median
(+) | highs are linear (3.9% delta to prev. frequency)
Overall 100 - 16.000 Hz
(+) | overall sound is linear (10.1% difference to median)
Compared to same class
» 4% of all tested devices in this class were better, 3% similar, 94% worse
» The best had a delta of 6%, average was 18%, worst was 132%
Compared to all devices tested
» 3% of all tested devices were better, 1% similar, 96% worse
» The best had a delta of 4%, average was 25%, worst was 134%
Lenovo Legion 5 Pro 16ARH7H RTX 3070 Ti audio analysis
(±) | speaker loudness is average but good (72.5 dB)
Bass 100 - 315 Hz
(-) | nearly no bass - on average 22.3% lower than median
(-) | bass is not linear (15.4% delta to prev. frequency)
Mids 400 - 2000 Hz
(±) | higher mids - on average 7.1% higher than median
(±) | linearity of mids is average (9.5% delta to prev. frequency)
Highs 2 - 16 kHz
(+) | balanced highs - only 1.9% away from median
(+) | highs are linear (3.6% delta to prev. frequency)
Overall 100 - 16.000 Hz
(-) | overall sound is not linear (30.3% difference to median)
Compared to same class
» 95% of all tested devices in this class were better, 2% similar, 3% worse
» The best had a delta of 6%, average was 18%, worst was 132%
Compared to all devices tested
» 86% of all tested devices were better, 3% similar, 10% worse
» The best had a delta of 4%, average was 25%, worst was 134%
Power Management - Efficient when gaming but inconsistent idle
Power Consumption
Unfortunately, the idle consumption varies strongly and gets quite high, even though the task manager doesn't show any hindering processes. This is also the case even after longer operation. We would welcome some driver updates from Asus here.
While gaming, the consumption of the M16 is surprisingly low (144 W). The Vision 16 Pro consumes about 8% more, and the more powerful Legion 5 Pro even 45%! Considering the additional performance of the Legion 5, this isn't very surprising, but the extent of the difference is, since even the significantly weaker predecessor consumed more power when gaming.
If we select the Turbo mode for the M16, it consumes 175 W while gaming (The Witcher 3) instead of 144 W (blue graph). This is then slightly more than the Vision 16 Pro, but still less than the 209 W of the Legion 5 Pro.
We measure temporary load peaks of up to 220 W from the 240-W power supply, so this should be sufficiently equipped for all the usage scenarios.
| Off / Standby | |
| Idle | |
| Load |
|
| Asus ROG Zephyrus M16 GU603Z i9-12900H, GeForce RTX 3070 Ti Laptop GPU, Micron 3400 1TB MTFDKBA1T0TFH, IPS, 2560x1600, 16.00 | Asus ROG Zephyrus M16 GU603H i9-11900H, GeForce RTX 3070 Laptop GPU, Samsung PM9A1 MZVL22T0HBLB, IPS, 2560x1600, 16.00 | SCHENKER Vision 16 Pro RTX 3070 Ti i7-12700H, GeForce RTX 3070 Ti Laptop GPU, Samsung SSD 980 Pro 1TB MZ-V8P1T0BW, IPS, 2560x1600, 16.00 | Lenovo Legion 5 Pro 16ARH7H RTX 3070 Ti R7 6800H, GeForce RTX 3070 Ti Laptop GPU, Samsung PM9A1 MZVL21T0HCLR, IPS, 2560x1600, 16.00 | SCHENKER XMG Focus 16 (i7-12700H, RTX 3060) i7-12700H, GeForce RTX 3060 Laptop GPU, Samsung SSD 980 Pro 1TB MZ-V8P1T0BW, IPS, 2560x1600, 16.00 | Corsair Voyager a1600 R9 6900HS, Radeon RX 6800M, Samsung PM9A1 MZVL22T0HBLB, IPS, 2560x1600, 16.00 | Average NVIDIA GeForce RTX 3070 Ti Laptop GPU | Average of class Gaming | |
|---|---|---|---|---|---|---|---|---|
| Power Consumption | -14% | 14% | -30% | -16% | -32% | -23% | -21% | |
| Idle Minimum * | 10.8 | 11 -2% | 9 17% | 9.7 10% | 14.7 -36% | 16.9 -56% | 14.2 ? -31% | 13.8 ? -28% |
| Idle Average * | 17 | 20 -18% | 13.3 22% | 14.8 13% | 18.6 -9% | 20.3 -19% | 19.9 ? -17% | 19.2 ? -13% |
| Idle Maximum * | 17.8 | 30 -69% | 14.3 20% | 45.8 -157% | 21.2 -19% | 22.2 -25% | 26.2 ? -47% | 27 ? -52% |
| Load Average * | 116 | 111 4% | 107 8% | 87.2 25% | 121 -4% | 133.4 -15% | 125.8 ? -8% | 111.3 ? 4% |
| Witcher 3 ultra * | 144 | 156 -8% | 155.2 -8% | 209 -45% | 174 -21% | 206 -43% | ||
| Load Maximum * | 220 | 197 10% | 172 22% | 275.3 -25% | 235 -7% | 248 ? -13% | 251 ? -14% |
* ... smaller is better
Power Consumption The Witcher 3 / Stress Test
Power Consumption with External Monitor
Battery Life
Asus doesn't list any real power saving mode in the performance options. If you pull the plug, the M16 automatically switches to Quiet mode.
The battery capacity is 90 Wh, which is decent in comparison. The Vision 16 Pro and the Legion 5 only offer a capacity of 80 Wh. This results in the M16 lasting correspondingly longer.
Depending on the display brightness, the runtimes vary significantly. In our WiFi test, the M16 lasts between 5 hours (at full brightness) and around 7.5 hours (at 150 nits).
You can expect about the same when watching movies.
| Asus ROG Zephyrus M16 GU603Z i9-12900H, GeForce RTX 3070 Ti Laptop GPU, 90 Wh | Asus ROG Zephyrus M16 GU603H i9-11900H, GeForce RTX 3070 Laptop GPU, 90 Wh | SCHENKER Vision 16 Pro RTX 3070 Ti i7-12700H, GeForce RTX 3070 Ti Laptop GPU, 80 Wh | Lenovo Legion 5 Pro 16ARH7H RTX 3070 Ti R7 6800H, GeForce RTX 3070 Ti Laptop GPU, 80 Wh | SCHENKER XMG Focus 16 (i7-12700H, RTX 3060) i7-12700H, GeForce RTX 3060 Laptop GPU, 54 Wh | Corsair Voyager a1600 R9 6900HS, Radeon RX 6800M, 99 Wh | Average of class Gaming | |
|---|---|---|---|---|---|---|---|
| Battery Runtime | 9% | -15% | -41% | -21% | 3% | -9% | |
| H.264 | 436 | 367 -16% | 358 -18% | 399 ? -8% | |||
| WiFi v1.3 | 445 | 463 4% | 361 -19% | 264 -41% | 286 -36% | 350 -21% | 368 ? -17% |
| Load | 86 | 97 13% | 77 -10% | 81 -6% | 126 47% | 84.2 ? -2% | |
| Reader / Idle | 799 | 418 | 544 ? |
Pros
Cons
Verdict - A well-rounded gaming laptop with a 16:10 display

The Asus ROG Zephyrus M16 is a well-optimized gaming laptop overall without any significant problem areas. In addition to the very good CPU performance and decent battery life, the large, 16-inch QHD+ display in the 16:10 format also knows how to please with its powerful contrasts and quite high color space coverage.
Considering the fact that many competitors completely lack any SD card reader at all, we can forgive that Asus only uses a microSD card reader, particularly since the device used here is fairly fast. The RTX 3070 Ti only has a TGP of 120 W, but this also means that the laptop doesn't get too hot and the noise levels also remain within limits. On the other hand, Asus could optimize the fan control, since from time to time, the fans can suddenly rev up to 47 dB even during idle operation.
The M16 mostly presents itself as a well-rounded gaming package. Even though it doesn't offer the maximum performance, the package is consistent with moderate temperatures and noise levels.
Those who need a higher performance can take a look at the Lenovo Legion 5 Pro, which is faster while gaming, but also significantly louder. Or you can just turn on the similarly loud Turbo mode in the M16, leading to a noticeable and measurable performance increase here as well.
Price and Availability
Amazon lists various configurations of the 2022 Asus ROG Zephyrus M16 starting from $2249.
Asus ROG Zephyrus M16 GU603Z
-
02/14/2023 v7
Christian Hintze
More articles related to this device
Asus ROG Zephyrus M16 GU603Z (ROG Zephyrus M16 Series)Related Articles


Transparency
The present review sample was made available to the author as a loan by the manufacturer or a shop for the purposes of review. The lender had no influence on this review, nor did the manufacturer receive a copy of this review before publication. There was no obligation to publish this review.
Pricecompare

