 Deutsch
 English
 Español
 Français
 Italiano
 Nederlands
 Polski
 Português
 Русский
 Türkçe
 Svenska
 Chinese
 Magyar
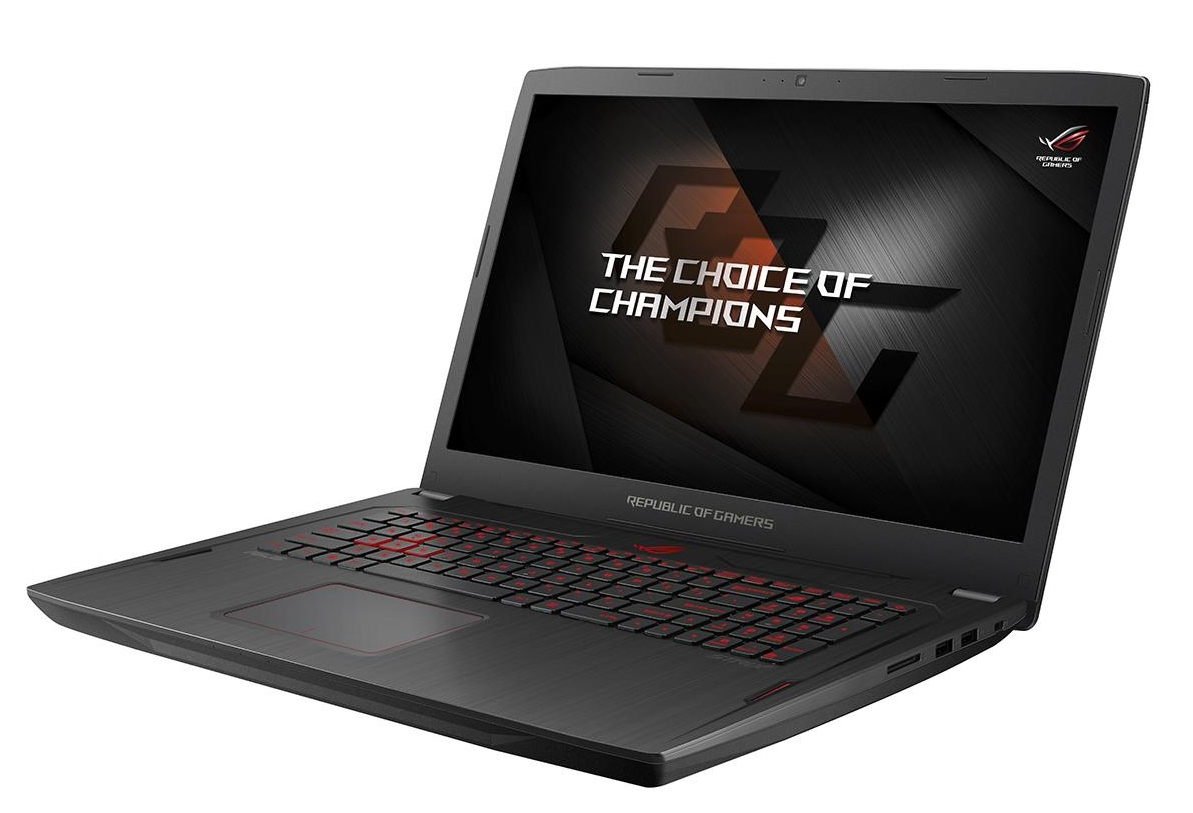
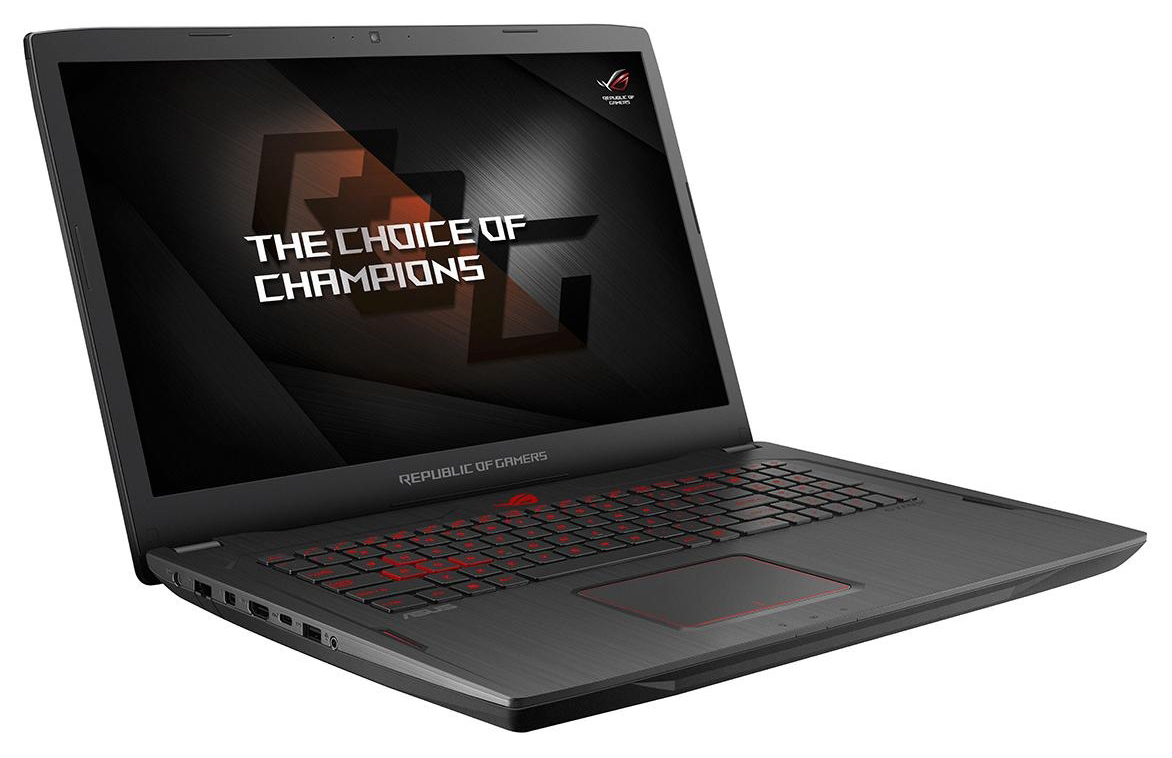
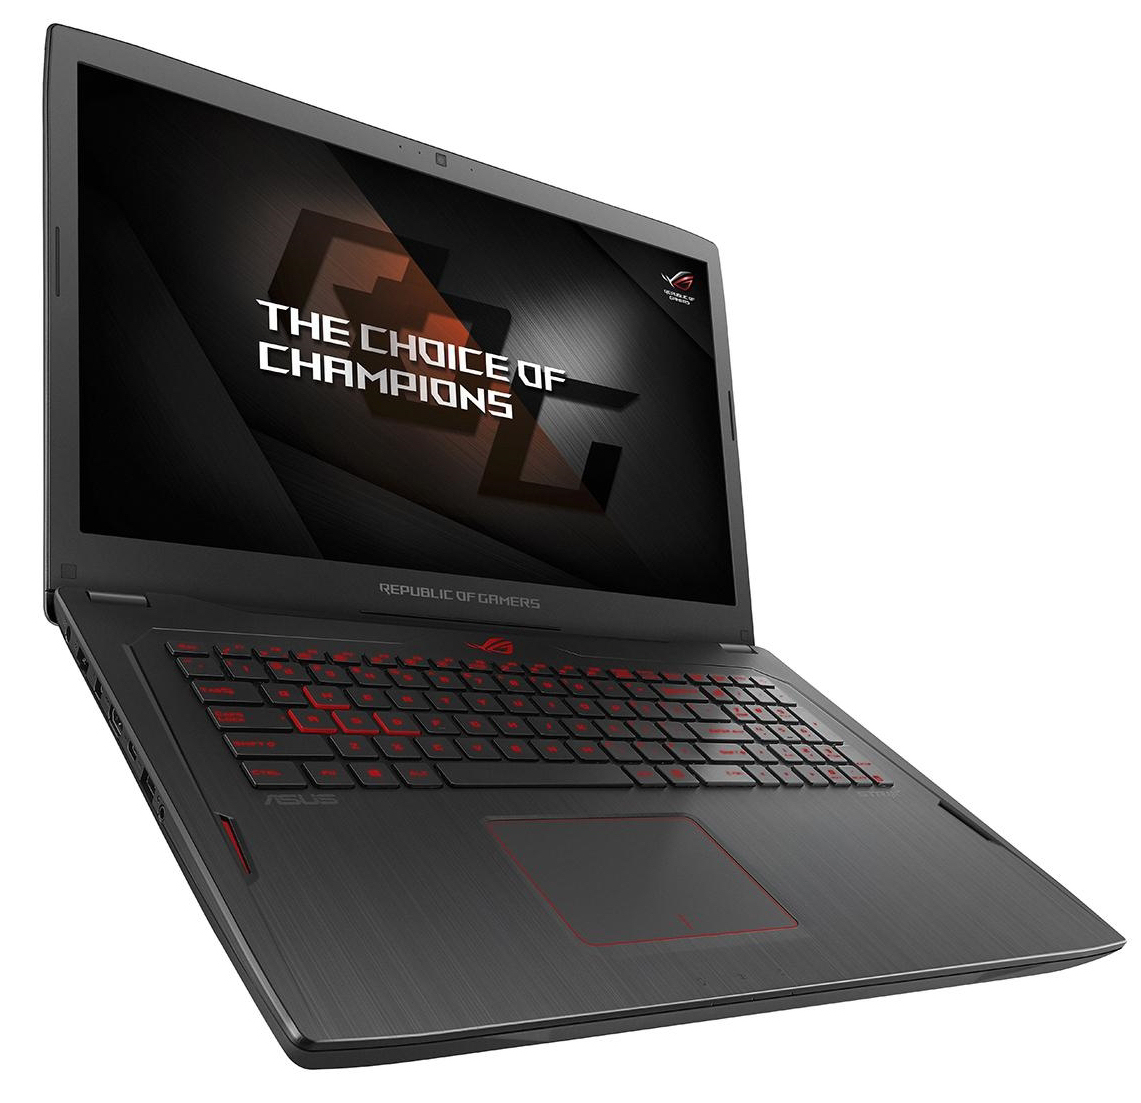
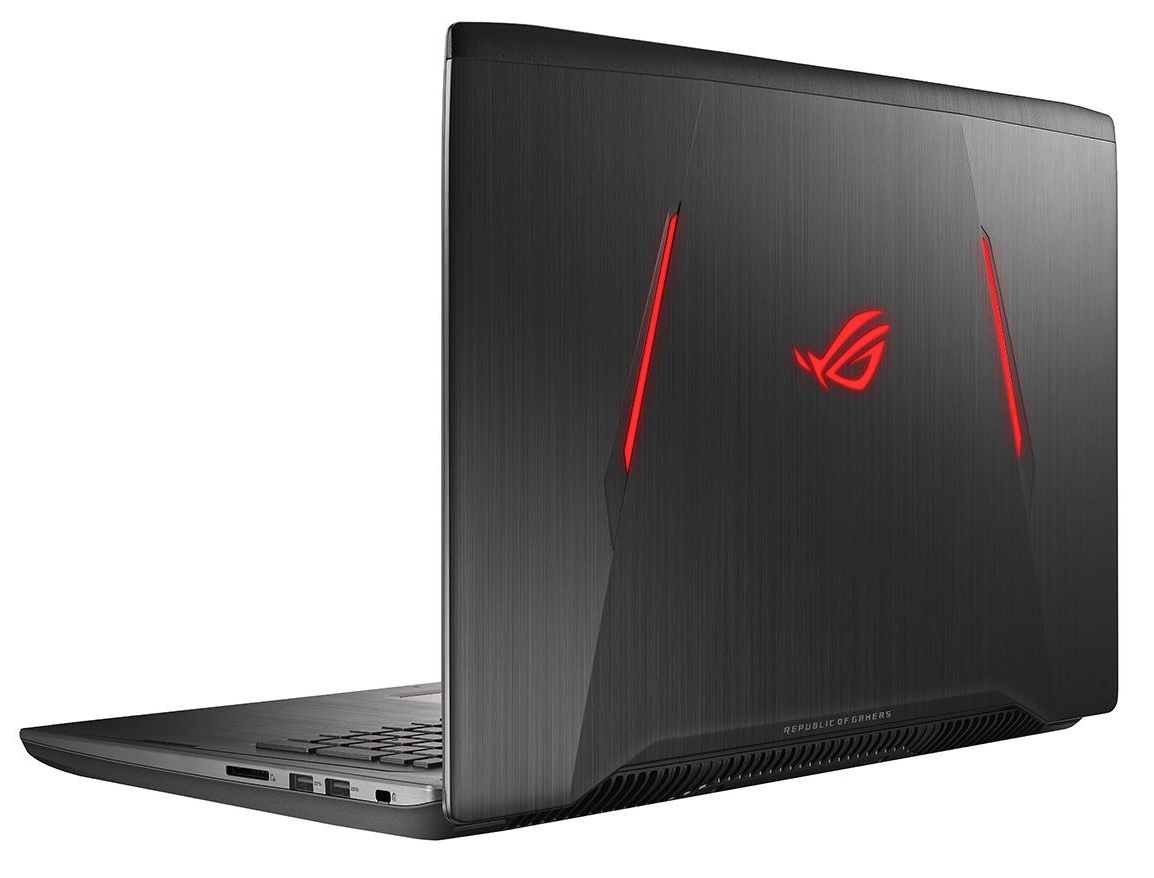
Asus ROG Strix GL702ZC (Ryzen 5 1600, Radeon RX 580, FHD) Laptop Review
With the GL702ZC, Asus delivers a 17.3-inch gaming laptop, which is powered by a removable desktop CPU. AMD’s Ryzen 5 1600 hexa-core processor is used in the laptop. The device we have on hand represents an entry-level model in the series. The notebook is no stranger to us: We have already reviewed a sibling model (Asus GL702ZC-GC104T). The competitors of the device include: the Acer Predator Helios 300, the HP Omen 17, the MSI GL72 7RDX-602 and the Acer Aspire V17 Nitro BE VN7-793G.
Because both GL702ZC models are identically built, we shall skip the sections that deal with the case, connectivity, input devices and the speakers. You can find all the relevant information in the review of the Asus GL702ZC-GC104T.

| SD Card Reader | |
| average JPG Copy Test (av. of 3 runs) | |
| Acer Predator Helios 300 (Toshiba Exceria Pro SDXC 64 GB UHS-II) | |
| Nexoc G739 (Toshiba Exceria Pro SDXC 64 GB UHS-II) | |
| HP Omen 17-w206ng (Toshiba Exceria Pro SDXC 64 GB UHS-II) | |
| Asus GL702ZC-GC104T (Toshiba Exceria Pro SDXC 64 GB UHS-II) | |
| Asus ROG Strix GL702ZC-GC204T (Toshiba Exceria Pro SDXC 64 GB UHS-II) | |
| MSI GF72VR 7RF (Toshiba Exceria Pro SDXC 64 GB UHS-II) | |
| MSI GL72 7RDX-602 (Toshiba Exceria Pro SDXC 64 GB UHS-II) | |
| maximum AS SSD Seq Read Test (1GB) | |
| Asus ROG Strix GL702ZC-GC204T (Toshiba Exceria Pro SDXC 64 GB UHS-II) | |
| Asus GL702ZC-GC104T (Toshiba Exceria Pro SDXC 64 GB UHS-II) | |
| Nexoc G739 (Toshiba Exceria Pro SDXC 64 GB UHS-II) | |
| HP Omen 17-w206ng (Toshiba Exceria Pro SDXC 64 GB UHS-II) | |
| Acer Predator Helios 300 (Toshiba Exceria Pro SDXC 64 GB UHS-II) | |
| MSI GF72VR 7RF (Toshiba Exceria Pro SDXC 64 GB UHS-II) | |
| MSI GL72 7RDX-602 (Toshiba Exceria Pro SDXC 64 GB UHS-II) | |
Display

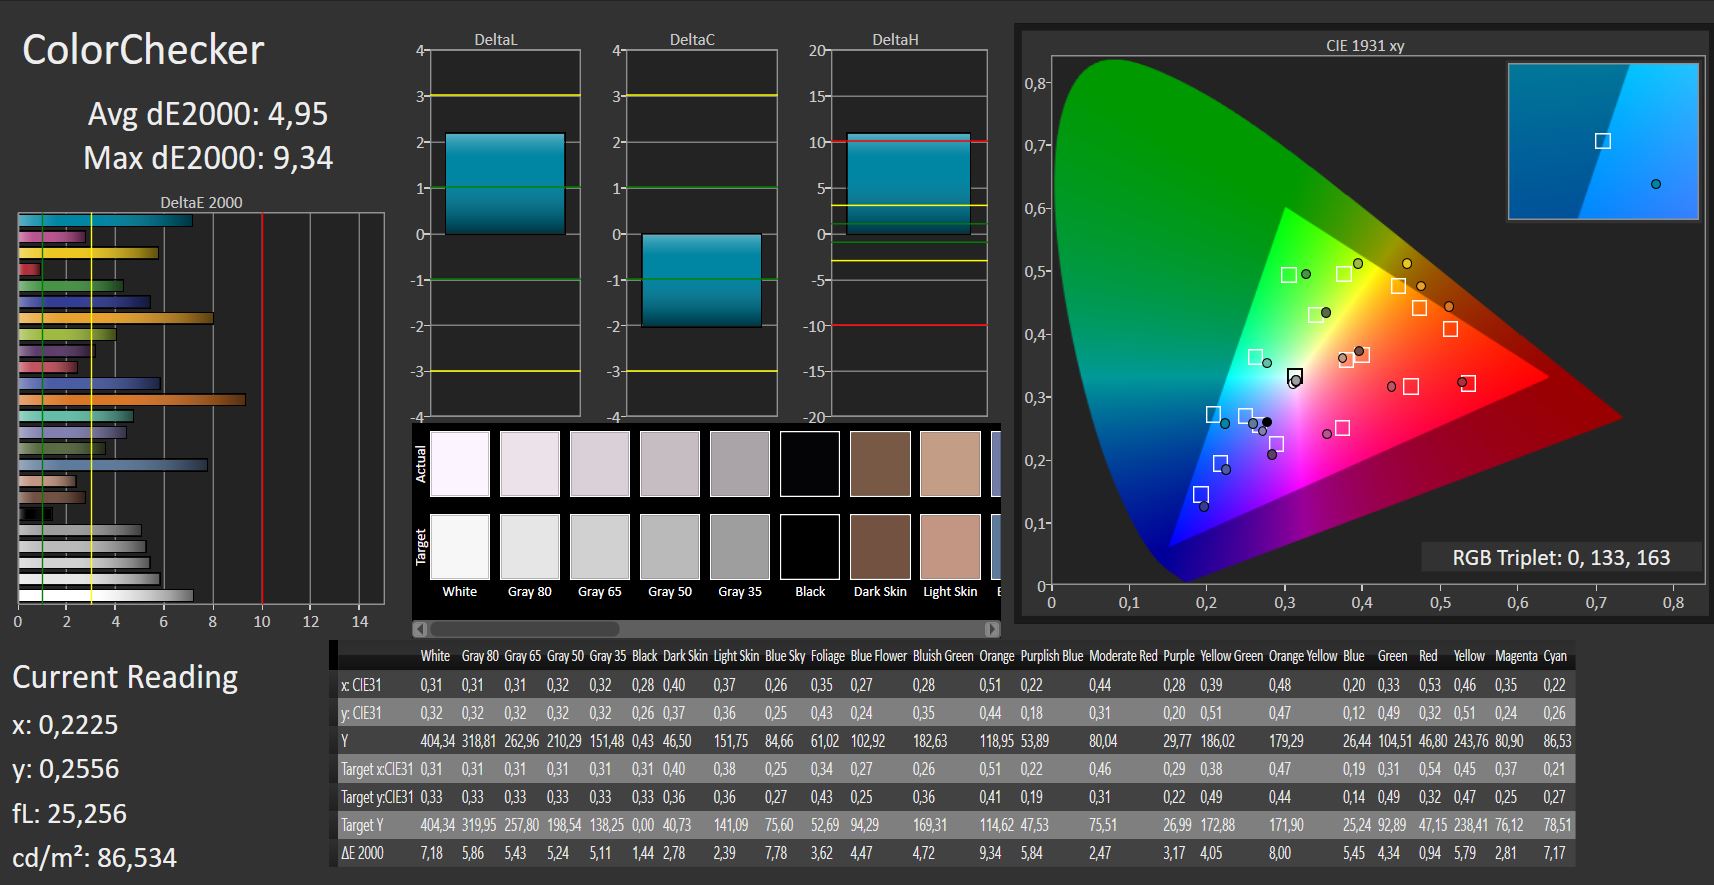
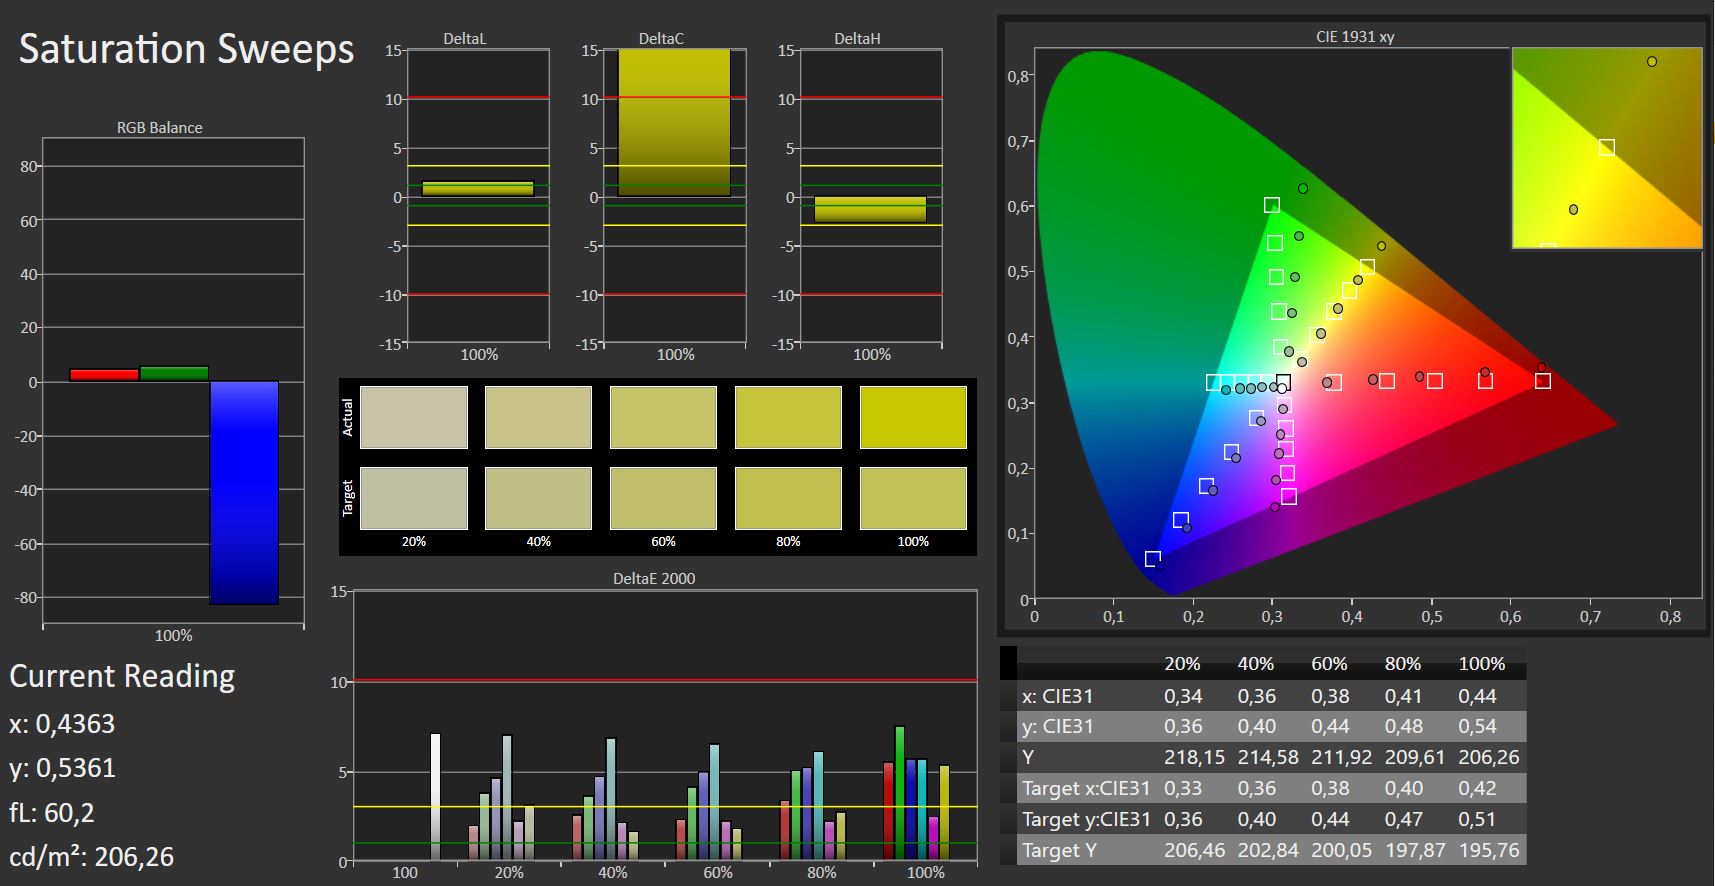
The GL702ZC comes with the same Full HD screen as the previously-reviewed sibling model. What we have here is a bright, contrasty IPS display with great viewing angles. The values we have measured are somewhat different, but this is quite normal. Two identically-built panels never match 100%.
A positive: The display does not exhibit PWM-flickering. Here, Asus forgoes controlling the brightness level via PWM. Things looked differently with the sibling model.
The screen supports AMD’s FreeSync Technology. This technology allows the frame rate of the display and the GPU to be synced up. As a result - especially when gaming - you will get the smoothest image possible without any rendering errors. FreeSync-enabled external monitors can also be connected via HDMI or Mini DisplayPort.
| |||||||||||||||||||||||||
Brightness Distribution: 82 %
Center on Battery: 415 cd/m²
Contrast: 988:1 (Black: 0.42 cd/m²)
ΔE Color 4.95 | 0.5-29.43 Ø5
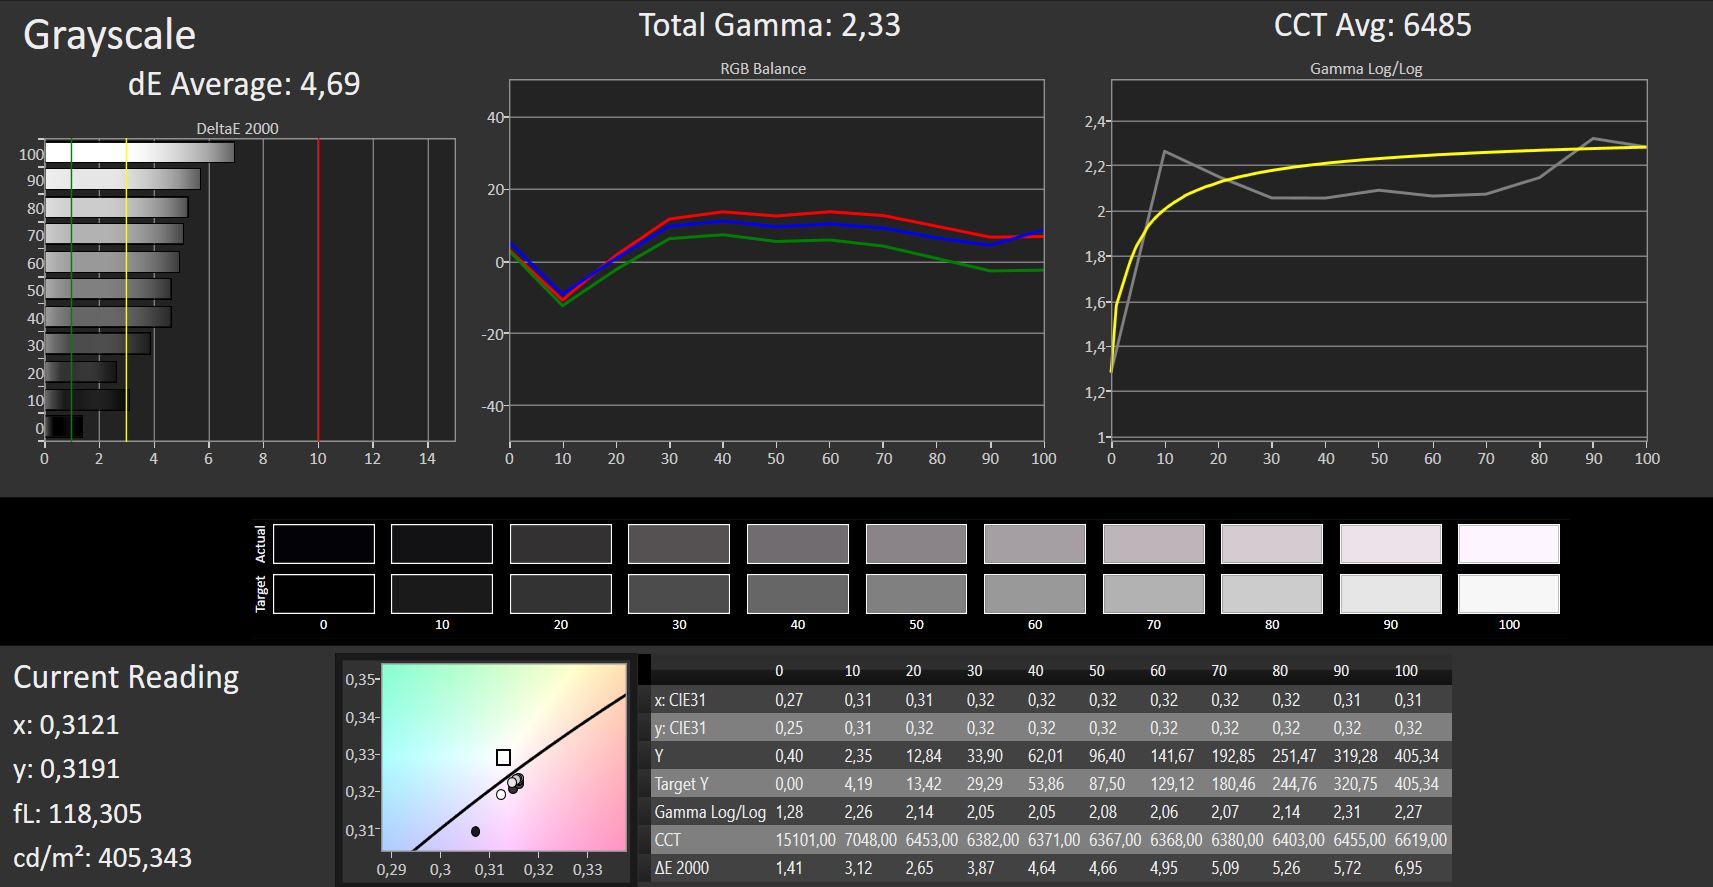
ΔE Greyscale 4.69 | 0.57-98 Ø5.3
82% sRGB (Argyll 1.6.3 3D)
54% AdobeRGB 1998 (Argyll 1.6.3 3D)
60.4% AdobeRGB 1998 (Argyll 2.2.0 3D)
82.6% sRGB (Argyll 2.2.0 3D)
65.4% Display P3 (Argyll 2.2.0 3D)
Gamma: 2.33
| Asus ROG Strix GL702ZC-GC204T IPS, 1920x1080, 17.30 | Asus GL702ZC-GC104T IPS, 1920x1080, 17.30 | MSI GF72VR 7RF TN LED, 1920x1080, 17.30 | Acer Predator Helios 300 AH-IPS, WLED, 1920x1080, 17.30 | MSI GL72 7RDX-602 TN LED, 1920x1080, 17.30 | Nexoc G739 IPS, 1920x1080, 17.30 | HP Omen 17-w206ng IPS, 1920x1080, 17.30 | |
|---|---|---|---|---|---|---|---|
| Display | 3% | 34% | 3% | 8% | 7% | 9% | |
| Display P3 Coverage | 65.4 | 67.1 3% | 90.8 39% | 66.8 2% | 65.2 0% | 66.7 2% | 67.2 3% |
| sRGB Coverage | 82.6 | 85.4 3% | 99.8 21% | 85.8 4% | 94.3 14% | 91 10% | 93.1 13% |
| AdobeRGB 1998 Coverage | 60.4 | 62.5 3% | 85.6 42% | 62.8 4% | 65.6 9% | 66.4 10% | 67.4 12% |
| Response Times | -4% | 39% | 7% | 3% | -24% | -10% | |
| Response Time Grey 50% / Grey 80% * | 36 ? | 39.2 ? -9% | 24.4 ? 32% | 36 ? -0% | 29 ? 19% | 45 ? -25% | 38 ? -6% |
| Response Time Black / White * | 23 ? | 22.8 ? 1% | 12.6 ? 45% | 20 ? 13% | 26 ? -13% | 28 ? -22% | 26 ? -13% |
| PWM Frequency | 122000 ? | 25000 ? | 119000 ? | 961 | 450 ? | 200 ? | |
| Screen | 9% | -13% | 4% | -42% | 11% | 5% | |
| Brightness middle | 415 | 379 -9% | 329.2 -21% | 384 -7% | 299 -28% | 312 -25% | 318 -23% |
| Brightness | 365 | 354 -3% | 318 -13% | 373 2% | 274 -25% | 304 -17% | 295 -19% |
| Brightness Distribution | 82 | 89 9% | 92 12% | 93 13% | 80 -2% | 85 4% | 79 -4% |
| Black Level * | 0.42 | 0.31 26% | 0.4 5% | 0.35 17% | 0.25 40% | 0.23 45% | 0.25 40% |
| Contrast | 988 | 1223 24% | 823 -17% | 1097 11% | 1196 21% | 1357 37% | 1272 29% |
| Colorchecker dE 2000 * | 4.95 | 4.32 13% | 6.4 -29% | 4.81 3% | 12.92 -161% | 4.19 15% | 4.7 5% |
| Colorchecker dE 2000 max. * | 9.34 | 8.56 8% | 11.7 -25% | 8.69 7% | 19.91 -113% | 8.7 7% | 8.8 6% |
| Greyscale dE 2000 * | 4.69 | 4 15% | 9.2 -96% | 5.33 -14% | 13.16 -181% | 3.72 21% | 5 -7% |
| Gamma | 2.33 94% | 2.47 89% | 2.18 101% | 2.45 90% | 2.36 93% | 2.29 96% | 2.28 96% |
| CCT | 6485 100% | 6984 93% | 10484 62% | 7137 91% | 15046 43% | 7104 91% | 7374 88% |
| Color Space (Percent of AdobeRGB 1998) | 54 | 56 4% | 76 41% | 56 4% | 60 11% | 59 9% | 61 13% |
| Color Space (Percent of sRGB) | 82 | 85 4% | 92 12% | 86 5% | 94 15% | 91 11% | 93 13% |
| Total Average (Program / Settings) | 3% /
6% | 20% /
3% | 5% /
4% | -10% /
-26% | -2% /
5% | 1% /
4% |
* ... smaller is better
Screen Flickering / PWM (Pulse-Width Modulation)
| Screen flickering / PWM not detected | ||
In comparison: 53 % of all tested devices do not use PWM to dim the display. If PWM was detected, an average of 17900 (minimum: 5 - maximum: 3846000) Hz was measured. | ||
Display Response Times
| ↔ Response Time Black to White | ||
|---|---|---|
| 23 ms ... rise ↗ and fall ↘ combined | ↗ 14 ms rise | 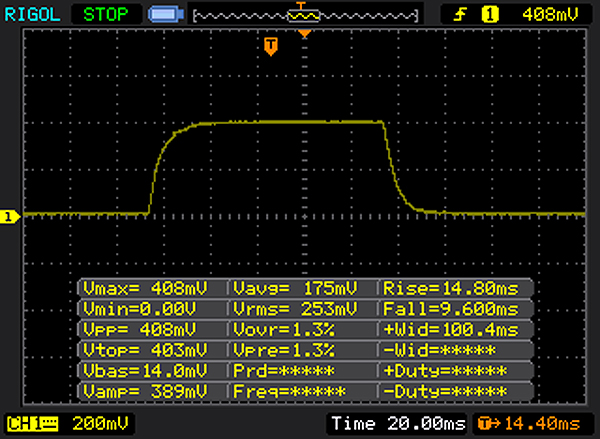 |
| ↘ 9 ms fall | ||
| The screen shows good response rates in our tests, but may be too slow for competitive gamers. In comparison, all tested devices range from 0.1 (minimum) to 240 (maximum) ms. » 45 % of all devices are better. This means that the measured response time is similar to the average of all tested devices (21.5 ms). | ||
| ↔ Response Time 50% Grey to 80% Grey | ||
| 36 ms ... rise ↗ and fall ↘ combined | ↗ 18 ms rise | 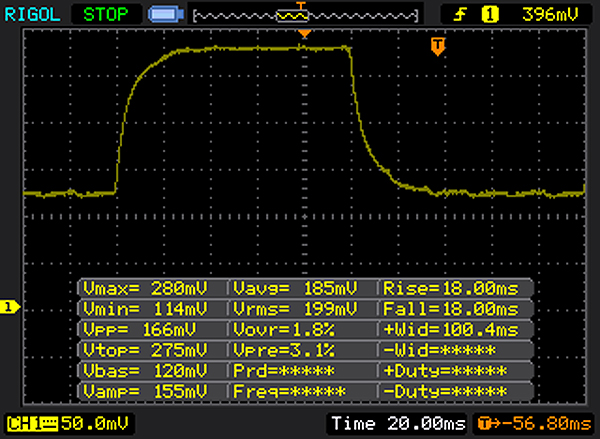 |
| ↘ 18 ms fall | ||
| The screen shows slow response rates in our tests and will be unsatisfactory for gamers. In comparison, all tested devices range from 0.2 (minimum) to 636 (maximum) ms. » 44 % of all devices are better. This means that the measured response time is similar to the average of all tested devices (33.7 ms). | ||
Performance
With the GL702ZC, Asus has a 17.3-inch gaming notebook in its product range. It can run all the latest games smoothly. Our review device represents an entry-level model in the series and can be had for 1200 Euros (~$1485). Other hardware configurations are also available.
Processor
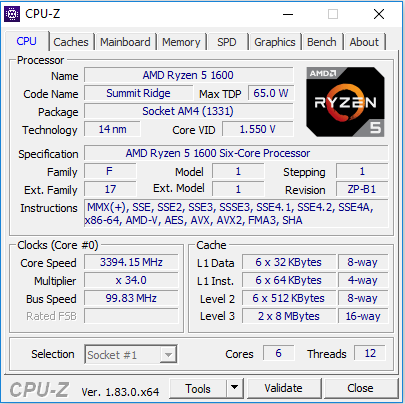
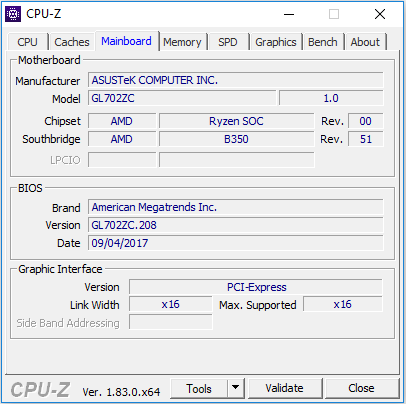
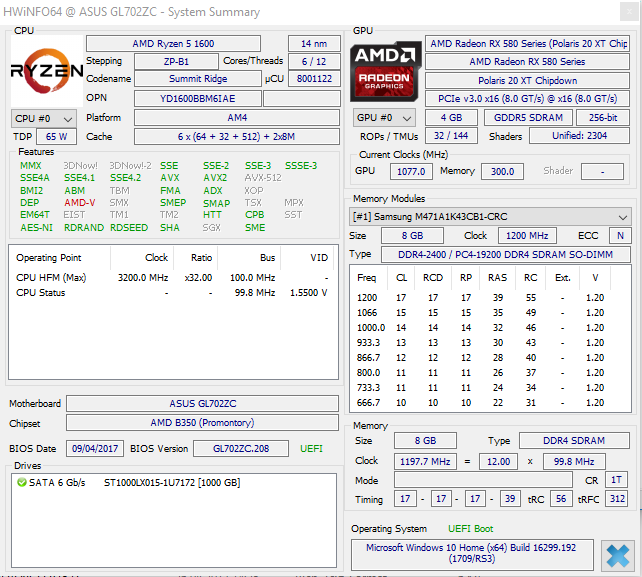
The GL702ZC is powered by a Ryzen 5 1600 processor from AMD. The CPU plugs into a socket and can be replaced, if need be. What we are dealing with here is a desktop CPU with a TDP of 65 watts. The processor has six cores, which support simultaneous multithreading (one core can process two threads at the same time). The processor has a base clock of 3.2 GHz. By means of the Turbo, the clock rate can be increased up to 3.4 GHz for six cores and 3.7 GHz for two cores.
When plugged in, the processor runs at 3.4 GHz in the multi-core benchmarks and 3.4 to 3.7 GHz in the single-core benchmarks. When running on battery power, the CPU is throttled down to a clock rate of 548 MHz.
We check whether or not the Turbo boost technology can be used continually by running the multi-core section of the Cinebench R15 benchmark for 30 minutes in a continuous loop. The results stay consistently on the same level. The Turbo boost operates at full speed.
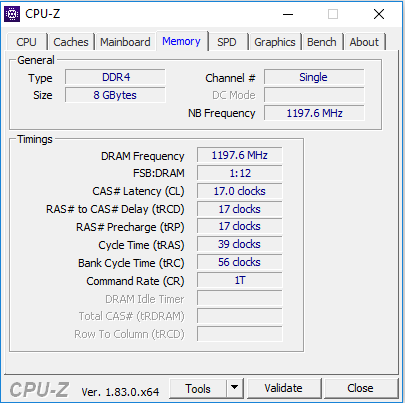
The single-core performance of the CPU is on the same level as that of the Intel Core i5-7300HQ processor. However, in multi-core applications, the AMD processor offers more power than most of Intel’s CPUs. So the Kaby Lake CPUs cannot keep up with the Ryzen 5 1600. Only the Coffee Lake models can give it a run for its money. Moreover, the performance of the Ryzen CPU can be further increased, because the Geekbench benchmark benefits from the RAM running in dual-channel mode. In other words: If the GL702ZC were to get another RAM module, the results in the Geekbench benchmarks would improve.
| Mozilla Kraken 1.1 - Total | |
| Asus GL702ZC-GC104T (Edge 15) | |
| MSI GF72VR 7RF (Microsoft Edge 40.15063.674.0) | |
| Asus ROG Strix GL702ZC-GC204T (Edge 41) | |
| Acer Predator Helios 300 (Edge 40.15063.0.0) | |
| MSI GL72 7RDX-602 (EDGE 38.14393.1066.0) | |
| Gigabyte Aero 15X (Edge 41) | |
| Nexoc G739 (Edge 38.14393.0.0) | |
| Eurocom Sky X9C (Edge 41.16299.15.0) | |
| Octane V2 - Total Score | |
| Eurocom Sky X9C (Edge 41.16299.15.0) | |
| Nexoc G739 (Edge 38.14393.0.0) | |
| MSI GL72 7RDX-602 (EDGE 38.14393.1066.0) | |
| Gigabyte Aero 15X (Edge 41) | |
| Acer Predator Helios 300 (Edge 40.15063.0.0) | |
| Asus GL702ZC-GC104T (Edge 15) | |
| Asus ROG Strix GL702ZC-GC204T (Edge 41) | |
| JetStream 1.1 - Total Score | |
| Eurocom Sky X9C (Edge 41.16299.15.0) | |
| Gigabyte Aero 15X (Edge 41) | |
| Nexoc G739 (Edge 38.14393.0.0) | |
| MSI GF72VR 7RF (Microsoft Edge 40.15063.674.0) | |
| MSI GL72 7RDX-602 (EDGE 38.14393.1066.0) | |
| HP Omen 17-w206ng | |
| Acer Predator Helios 300 (Edge 40.15063.0.0) | |
| Acer Aspire Nitro BE VN7-793G-5811 (Edge 40) | |
| Acer Aspire VX15 VX5-591G-589S (Edge 38) | |
| Asus GL702ZC-GC104T (Edge 15) | |
| Asus ROG Strix GL702ZC-GC204T (Edge 41) | |
* ... smaller is better
System Performance
With the GL702ZC, Asus forgoes a solid state drive and instead relies on a hybrid drive. The lack of an SSD makes itself apparent during boot-up and loading. In other words: The system does not operate as responsively as you would have expected from such a powerful device. The extremely capable hexa-core processor and the dedicated Radeon graphics chip offer enough computing power for such demanding usage scenarios as gaming, video and image-editing. This is confirmed by the outstanding results in the PCMark benchmarks.
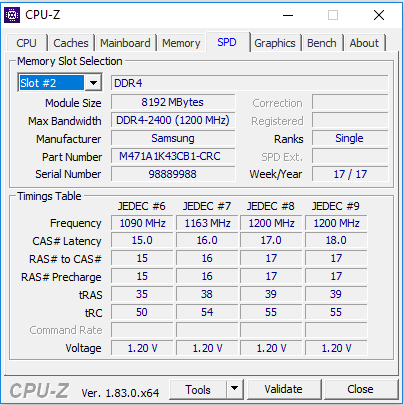
However, the end of the line has not been reached. The performance of the laptop can be further increased. Installing a second RAM module would boost the performance of the laptop in that it would enable the RAM to run in dual-channel mode. But this will require some elbow grease; because the installation of a RAM module will necessitate the removal of the heat-sink. Those who would like to avoid this should get a GL702ZC model that comes equipped with two RAM sticks. Furthermore, installing an SSD and using it as a system drive would create a significantly more responsive system.
| PCMark 7 Score | 5444 points | |
| PCMark 8 Home Score Accelerated v2 | 4186 points | |
| PCMark 8 Creative Score Accelerated v2 | 5608 points | |
| PCMark 8 Work Score Accelerated v2 | 4988 points | |
| PCMark 10 Score | 4440 points | |
Help | ||
| PCMark 8 - Home Score Accelerated v2 | |
| Acer Predator Helios 300 | |
| Nexoc G739 | |
| HP Omen 17-w206ng | |
| Asus ROG Strix GL702ZC-GC204T | |
| Asus GL702ZC-GC104T | |
| MSI GF72VR 7RF | |
| MSI GL72 7RDX-602 | |
Storage Devices
A hybrid drive from Seagate serves as the system drive. It operates at 5400 RPM and offers a storage capacity of 1 TB. The drive has an 8 GB SSD cache, which enables often-used applications to start faster. The transfer rates are on the normal level for this kind of HDD.
There is an empty M.2-2280 slot inside the device. It supports both SATA-III and NVMe SSDs.

| Asus ROG Strix GL702ZC-GC204T Seagate Mobile HDD 1TB ST1000LX015-1U7172 | Acer Predator Helios 300 Intel SSD 600p SSDPEKKW512G7 | MSI GL72 7RDX-602 HGST Travelstar 7K1000 HTS721010A9E630 | Nexoc G739 Samsung PM961 MZVLW256HEHP | HP Omen 17-w206ng Samsung PM961 MZVLW256HEHP | |
|---|---|---|---|---|---|
| CrystalDiskMark 3.0 | 37802% | 119% | 50561% | 47936% | |
| Read Seq | 92.5 | 899 872% | 135.3 46% | 1666 1701% | 1606 1636% |
| Write Seq | 105.1 | 569 441% | 127 21% | 1192 1034% | 1176 1019% |
| Read 512 | 37.67 | 580 1440% | 45.57 21% | 857 2175% | 846 2146% |
| Write 512 | 101.8 | 425.9 318% | 58.3 -43% | 827 712% | 805 691% |
| Read 4k | 0.484 | 34.29 6985% | 0.582 20% | 60.7 12441% | 59.9 12276% |
| Write 4k | 0.169 | 125.5 74160% | 1.022 505% | 154.5 91320% | 155.6 91971% |
| Read 4k QD32 | 1.294 | 457.7 35271% | 1.068 -17% | 636 49050% | 588 45340% |
| Write 4k QD32 | 0.221 | 404.5 182932% | 1.102 399% | 544 246054% | 505 228407% |
Graphics Card
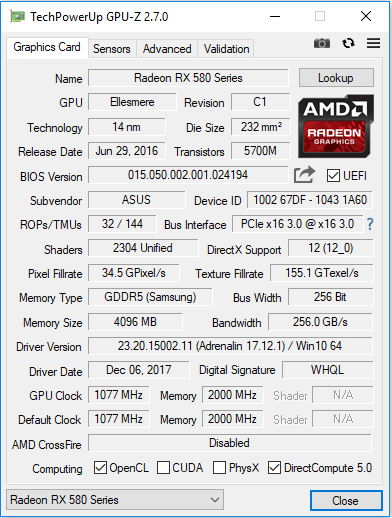
The GL702ZC comes equipped with a dedicated Radeon RX 580 graphics card. It is an entry-level model among the high-end GPUs. It is based on AMD’s Polaris architecture. The GPU supports DirectX 12 and has a maximum core clock of 1077 MHz. The graphics chip has 4096 MB of GDDR5 video memory at its disposal. The results in the 3DMark benchmarks are comparable to those of the Nvidia GeForce GTX 1060.
The Asus laptop does not support automatic switching between a discrete and an integrated graphics adapter. The dedicated Radeon GPU is engaged all the time.
| 3DMark 06 Standard Score | 28909 points | |
| 3DMark 11 Performance | 12626 points | |
| 3DMark Cloud Gate Standard Score | 28295 points | |
| 3DMark Fire Strike Score | 9866 points | |
| 3DMark Time Spy Score | 3718 points | |
Help | ||
| 3DMark 11 - 1280x720 Performance GPU | |
| Eurocom Sky X9C | |
| Guru Mars K | |
| Smart7 Karme GX17E G2 | |
| MSI GS63VR 7RG-005 | |
| Acer Predator Helios 300 | |
| Asus GL702ZC-GC104T | |
| Asus ROG Strix GL702ZC-GC204T | |
| MSI GF72VR 7RF | |
| HP Omen 15t-ce000 | |
| Acer Aspire Nitro BE VN7-793G-5811 | |
| HP Omen 17-w206ng | |
| MSI GL72 7RDX-602 | |
Gaming Performance
The GPU-CPU combination of the Asus laptop can run all the latest games smoothly. Most of these games can be run at Full HD resolution and with the high, or maximum, graphical settings. A few titles can only achieve playable frame rates at lower resolutions and/or lower detail settings. This graphics card is not fit for resolutions above 1080p.
We use the video game The Witcher 3 to check if the frame rates can be maintained consistently over an extended period of time. For this, we run the game with the maximum graphics settings at Full HD resolution (1920x1080) for one hour. Over the entire run of gameplay, the player-controlled character just stands still. There are no drops in performance to report.
| low | med. | high | ultra | |
| X-Plane 10.25 (2013) | 72 | 42.2 | 21.8 | 20.6 |
| Dragon Age: Inquisition (2014) | 163.5 | 102.6 | 81.3 | 54.1 |
| GTA V (2015) | 120.4 | 115.5 | 83.4 | 39.6 |
| The Witcher 3 (2015) | 173 | 121 | 68.9 | 36 |
| Dota 2 Reborn (2015) | 86 | 77 | 76.3 | 69 |
| World of Warships (2015) | 135.1 | 115 | 101 | 95.9 |
| Anno 2205 (2015) | 98.6 | 95.4 | 65.5 | 25.7 |
| XCOM 2 (2016) | 82 | 66 | 51.1 | 24.5 |
| Hitman 2016 (2016) | 56.2 | 54.4 | 49.8 | 47.7 |
| Ashes of the Singularity (2016) | 35.3 | 30 | 29.2 | |
| Overwatch (2016) | 276.3 | 276 | 191.1 | 96.2 |
| Mafia 3 (2016) | 55.9 | 45.9 | 35 | |
| Civilization VI (2016) | 105.6 | 84.8 | 69.8 | 63.5 |
| Mass Effect Andromeda (2017) | 38.2 | 33.6 | 27.1 | 25.1 |
| Warhammer 40.000: Dawn of War III (2017) | 106.7 | 72.3 | 69.4 | 53.4 |
| Team Fortress 2 (2017) | 108 | 105 | 102 | 101 |
| FIFA 18 (2017) | 242.9 | 242.2 | 218.1 | 215.4 |
| Middle-earth: Shadow of War (2017) | 117 | 85 | 66 | 49 |
| The Evil Within 2 (2017) | 56.4 | 47.1 | 45.4 | 44.3 |
| ELEX (2017) | 117.1 | 80 | 63.5 | 48.6 |
| Destiny 2 (2017) | 97.6 | 91.4 | 83.3 | 69.7 |
| Assassin´s Creed Origins (2017) | 50 | 44 | 43 | 37 |
| Call of Duty WWII (2017) | 132.3 | 128.8 | 68 | 39.1 |
| Need for Speed Payback (2017) | 92.8 | 86 | 78.5 | 75.6 |
| Star Wars Battlefront 2 (2017) | 62 | 53.9 | 45.6 | 45.7 |
| Fortnite (2018) | 238.5 | 183.1 | 80.6 | 59.5 |
| Middle-earth: Shadow of War - 1920x1080 Ultra Preset AA:T | |
| Eurocom Sky X9C | |
| Gigabyte Aero 15X | |
| MSI GS63VR 7RG-005 | |
| PC Zentrum Defiance IV | |
| Asus ROG Strix GL702ZC-GC204T | |
| HP Omen 15t-ce000 | |
| The Witcher 3 - 1920x1080 High Graphics & Postprocessing (Nvidia HairWorks Off) | |
| Eurocom Sky X9C | |
| Guru Mars K | |
| Gigabyte Aero 15X | |
| MSI GS63VR 7RG-005 | |
| Saelic Vidi G771D | |
| Acer Aspire V17 Nitro BE VN7-793G-706L | |
| PC Zentrum Defiance IV | |
| Acer Predator Helios 300 | |
| Asus ROG Strix GL702ZC-GC204T | |
| HP Omen 15t-ce000 | |
| MSI GF62VR 7RF-877 | |
| Asus GL702ZC-GC104T | |
| SCHENKER XMG P507 | |
| Nexoc G739 | |
| HP Omen 17-w206ng | |
| Acer Nitro 5 AN515-51-788E | |
| Acer Aspire Nitro BE VN7-793G-5811 | |
| MSI GL72 7RDX-602 | |
| World of Warships - 1920x1080 Very High Preset AA:High FX AF:16x | |
| Asus ROG Strix GL702ZC-GC204T | |
| Acer Aspire V17 Nitro BE VN7-793G-706L | |
| Need for Speed Payback - 1920x1080 Ultra Preset | |
| MSI GS63VR 7RG-005 | |
| Asus ROG Strix GL702ZC-GC204T | |
| PC Zentrum Defiance IV | |
| Call of Duty WWII - 1920x1080 High / On AA:Filmic 1X SM | |
| MSI GS63VR 7RG-005 | |
| PC Zentrum Defiance IV | |
| Asus ROG Strix GL702ZC-GC204T | |
| Civilization VI - 1920x1080 Ultra Preset AA:4xMS | |
| Asus ROG Strix GL702ZC-GC204T | |
| MSI GS73VR 7RF | |
| HP Omen 17-w100ng | |
| GTA V - 1920x1080 Highest Settings possible AA:4xMSAA + FX AF:16x | |
| Asus GL702VM-GC102D | |
| Asus ROG Strix GL702ZC-GC204T | |
| Hitman 2016 - 1920x1080 Ultra / On AA:SM AF:16x | |
| MSI GS73VR 7RF | |
| Asus Strix GL502VM-FY039T | |
| MSI GF62VR 7RF-877 | |
| SCHENKER XMG P507 | |
| Asus ROG Strix GL702ZC-GC204T | |
| MSI GF72VR 7RF | |
| Mafia 3 - 1366x768 Medium Preset | |
| Eurocom Sky X9C | |
| Saelic Vidi G771D | |
| MSI GF62VR 7RF-877 | |
| Asus GL702VM-GC102D | |
| Asus ROG Strix GL702ZC-GC204T | |
| Star Wars Battlefront 2 - 1920x1080 Ultra Preset | |
| PC Zentrum Defiance IV | |
| Asus ROG Strix GL702ZC-GC204T | |
| Overwatch - 1920x1080 Epic (Render Scale 100 %) AA:SM AF:16x | |
| Eurocom Sky X9C | |
| SCHENKER XMG P507 | |
| Asus ROG Strix GL702ZC-GC204T | |
| Destiny 2 - 1920x1080 Highest Preset AA:SM AF:16x | |
| Eurocom Sky X9C | |
| PC Zentrum Defiance IV | |
| Asus ROG Strix GL702ZC-GC204T | |
Emissions & Energy Management
System noise
During idle operation, the fans of the GL702ZC stand absolutely still. Only the rustling noise that the hard drive makes is audible. However, even when idle, the fans start to spin from time to time, which makes them quite audible. While gaming, we measured a sound pressure level of 38.9 dB(A). The fan noise is the loudest under full load. During the stress test, the fan noise reached 50.6 dB(A). All in all, our review device produces significantly less noise than the previously-reviewed sibling model. However, what we have here is not a quiet notebook, by any means.
Noise Level
| Idle |
| 30.6 / 32.7 / 32.7 dB(A) |
| HDD |
| 31.2 dB(A) |
| Load |
| 38.9 / 50.6 dB(A) |
 | ||
30 dB silent 40 dB(A) audible 50 dB(A) loud |
||
min: | ||
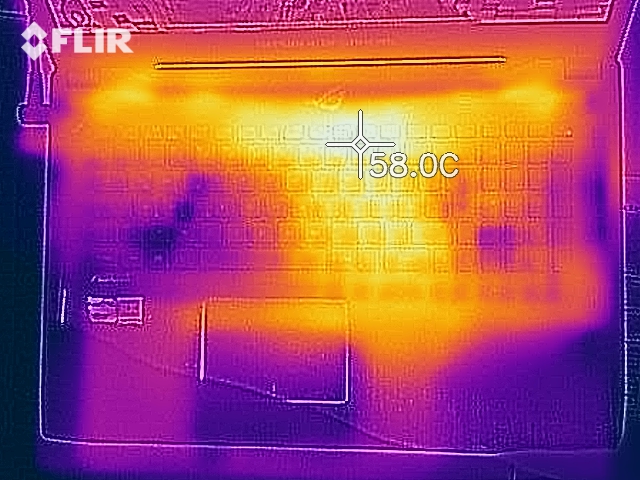
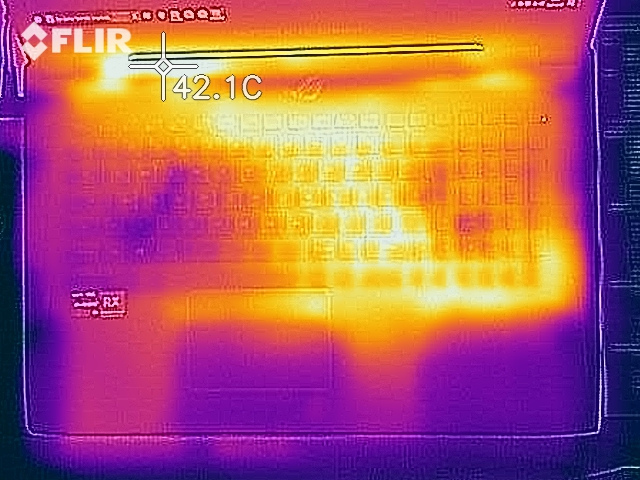
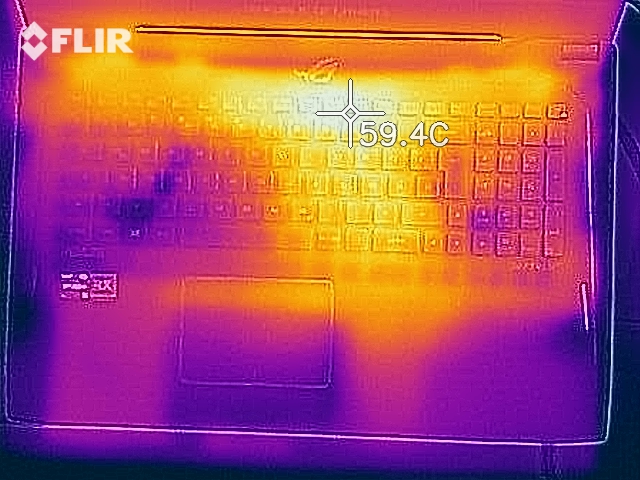
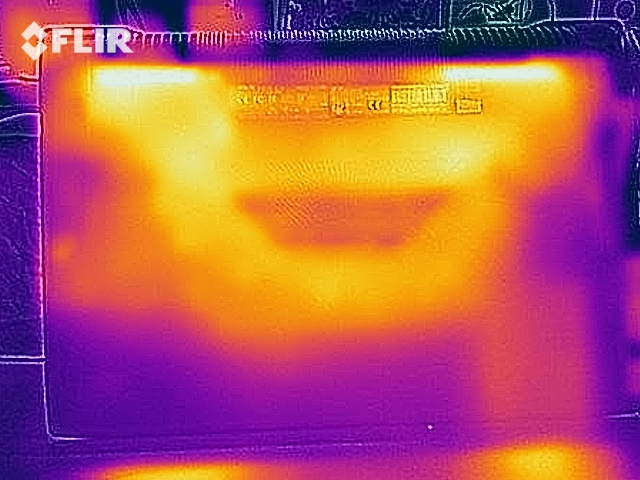
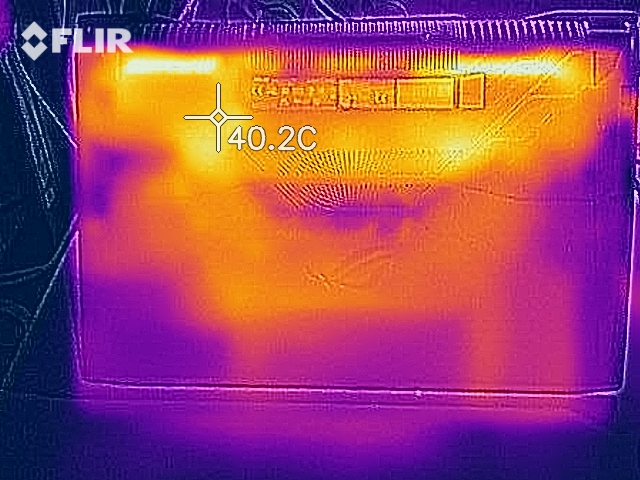
Temperature
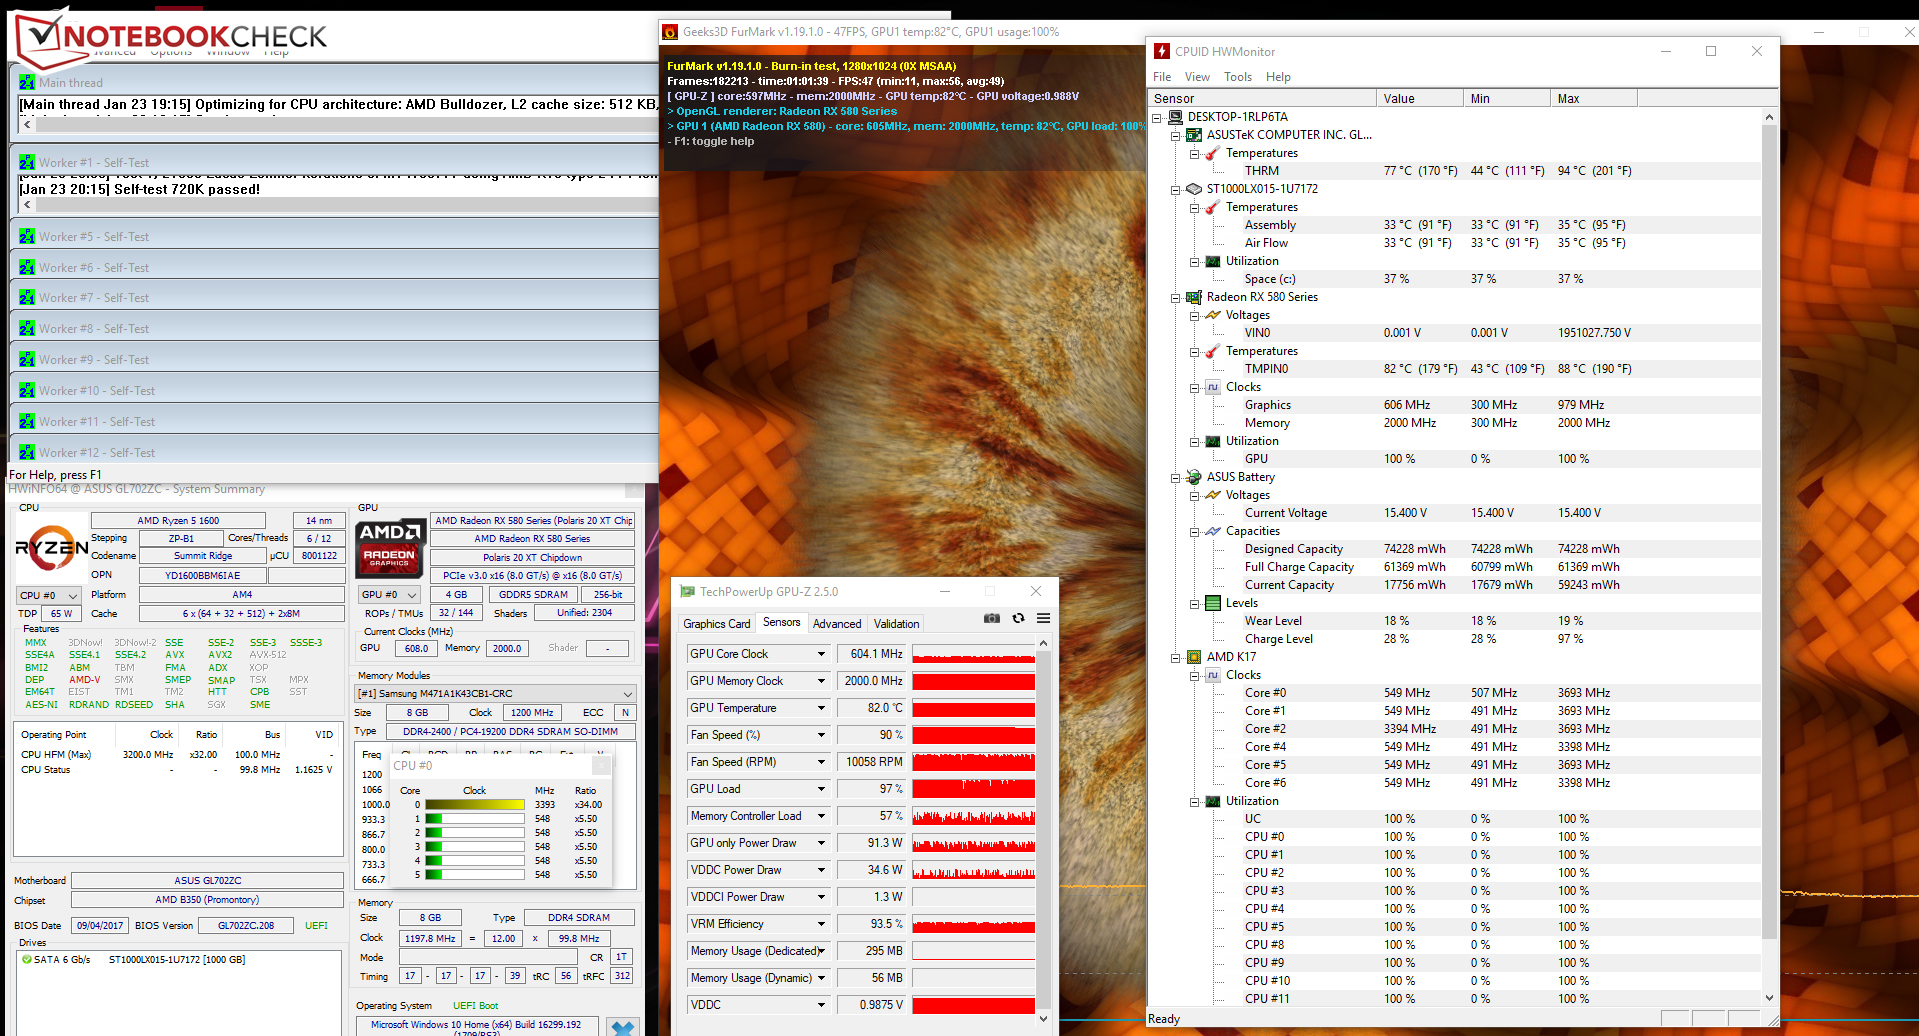
In our stress test (Prime95 and FurMark running for at least one hour), the GL702ZC performs differently when it is plugged in and when it is running off of battery power. When plugged in, the processor runs at 3.4 GHz. In a subsequent benchmark run, the CPU cores are throttled down to 548 MHz from time to time. The core clock of the GPU fluctuates between 600 and 700 MHz. When running on battery power, the CPU (548 MHz) and the GPU (300 MHz) are throttled down to their minimum clock speeds.
The laptop does not get excessively hot. During the stress test, the 50 °C (122 °F) mark is exceeded only at one measurement point. The temperatures are somewhat lower in our The Witcher 3 stress test, during which the game runs for one hour at Full HD resolution and with the maximum graphical settings.
(-) The maximum temperature on the upper side is 54.3 °C / 130 F, compared to the average of 40.4 °C / 105 F, ranging from 21.2 to 68.8 °C for the class Gaming.
(-) The bottom heats up to a maximum of 51 °C / 124 F, compared to the average of 43.2 °C / 110 F
(+) In idle usage, the average temperature for the upper side is 4 °C / 39 F, compared to the device average of 33.8 °C / 93 F.
(+) Playing The Witcher 3, the average temperature for the upper side is 6.2 °C / 43 F, compared to the device average of 33.8 °C / 93 F.
(+) The palmrests and touchpad are reaching skin temperature as a maximum (34 °C / 93.2 F) and are therefore not hot.
(-) The average temperature of the palmrest area of similar devices was 28.9 °C / 84 F (-5.1 °C / -9.2 F).

Speakers
Asus ROG Strix GL702ZC-GC204T audio analysis
(-) | not very loud speakers (70.2 dB)
Bass 100 - 315 Hz
(+) | good bass - only 3.9% away from median
(±) | linearity of bass is average (7.5% delta to prev. frequency)
Mids 400 - 2000 Hz
(+) | balanced mids - only 4.4% away from median
(+) | mids are linear (4.6% delta to prev. frequency)
Highs 2 - 16 kHz
(+) | balanced highs - only 3.2% away from median
(±) | linearity of highs is average (7.7% delta to prev. frequency)
Overall 100 - 16.000 Hz
(+) | overall sound is linear (13.5% difference to median)
Compared to same class
» 18% of all tested devices in this class were better, 7% similar, 75% worse
» The best had a delta of 6%, average was 18%, worst was 132%
Compared to all devices tested
» 11% of all tested devices were better, 3% similar, 86% worse
» The best had a delta of 4%, average was 25%, worst was 134%
Apple MacBook 12 (Early 2016) 1.1 GHz audio analysis
(+) | speakers can play relatively loud (83.6 dB)
Bass 100 - 315 Hz
(±) | reduced bass - on average 11.3% lower than median
(±) | linearity of bass is average (14.2% delta to prev. frequency)
Mids 400 - 2000 Hz
(+) | balanced mids - only 2.4% away from median
(+) | mids are linear (5.5% delta to prev. frequency)
Highs 2 - 16 kHz
(+) | balanced highs - only 2% away from median
(+) | highs are linear (4.5% delta to prev. frequency)
Overall 100 - 16.000 Hz
(+) | overall sound is linear (10.2% difference to median)
Compared to same class
» 5% of all tested devices in this class were better, 2% similar, 93% worse
» The best had a delta of 5%, average was 19%, worst was 53%
Compared to all devices tested
» 3% of all tested devices were better, 1% similar, 96% worse
» The best had a delta of 4%, average was 25%, worst was 134%
Frequency diagram in comparison (checkboxes can be checked and unchecked!)
Energy Consumption
Here, Asus uses a desktop CPU with a TDP of 65 watts. On top of that, the notebook comes with a powerful dedicated GPU, which is engaged at all times. There is no energy-efficient GPU in this laptop (the kind of GPU which can be used in less-demanding applications and when the laptop runs on battery power). As a result, even when idle, the notebook proves to be very power-hungry. Here, the power draw fluctuates between 49 and 68 watts. During our stress test, the power draw peaked at 262 watts. When gaming, the power consumption turns out to be lower (it fluctuates between 100 and 200 watts). The nominal power draw of the included AC adapter amounts to 330 watts.
| Off / Standby | |
| Idle | |
| Load |
|
Battery Life
Our practically-oriented Wi-Fi test simulates loads that are consistent with surfing the web. The “balanced” power plan is selected, the energy-saving functions turned off and the display brightness set to 150 cd/m². The GL702ZC achieves a battery runtime of 1 hour and 20 minutes.
| Battery Runtime - WiFi Websurfing | |
| HP Omen 17-w206ng | |
| Nexoc G739 | |
| Acer Predator Helios 300 | |
| MSI GL72 7RDX-602 | |
| MSI GF72VR 7RF | |
| Asus GL702ZC-GC104T | |
| Asus ROG Strix GL702ZC-GC204T | |
Pros
Cons
Verdict
The gaming notebook from Asus can run most games smoothly at Full HD resolution and with high graphics settings. Only a few titles require lowering the resolution and/or graphics settings. AMD’s FreeSync Technology creates a smooth gaming experience on the 60Hz screen. The matte IPS display delights with a high contrast ratio, good brightness and stable viewing angles.
The built-in hexa-core processor has made a good impression.
It offers more than enough computing power for all modern applications. In terms of multi-core performance, the CPU does better than the competition from Intel - actually it was only beaten by the Core i7-8700K. However, the Core i7-8700K is a 95-watt chip, which does not compete directly with the Ryzen processor. Furthermore, the Core i7-8700K costs significantly more than the Ryzen CPU.
The laptop offers plenty of storage space. Asus has equipped the device with a 1 TB hybrid drive. In order to achieve the lowest possible price, Asus has decided to forgo an SSD. However, an SSD can be added after purchase, because the notebook comes with an empty M.2-2280 slot.
Because the laptop comes only with a powerful dedicated GPU, it needs a lot of power, even during idle operation. Therefore, users who would like to use the notebook for day-to-day office work should stay away from it. Here, the Asus laptop lacks an energy-efficient, integrated GPU. Furthermore, the laptop produces too much noise for office use.
Asus asks 1200 Euros (~$1485) for the entry-level model in the GL702ZC line. Therefore, price-wise, it is comparable to the notebooks that come equipped with an Intel Core processor and an Nvidia GeForce GTX 1060 graphics card. However, such devices are often useable in everyday scenarios, because, as a rule, they come with both a dedicated GPU and an integrated GPU. As a result, these devices have a significantly lower power draw during idle and produce considerably less noise - here, for example, we have in mind the Acer Aspire V17 Nitro BE VN7-793G. Therefore, the GL702ZC is for those who want as much multi-core performance as possible for a relatively low price and who put a premium on the ability to replace the CPU.
Asus ROG Strix GL702ZC-GC204T
-
02/02/2018 v6(old)
Sascha Mölck


Pricecompare
