 Deutsch
 English
 Español
 Français
 Italiano
 Nederlands
 Polski
 Português
 Русский
 Türkçe
 Svenska
 Chinese
 Magyar
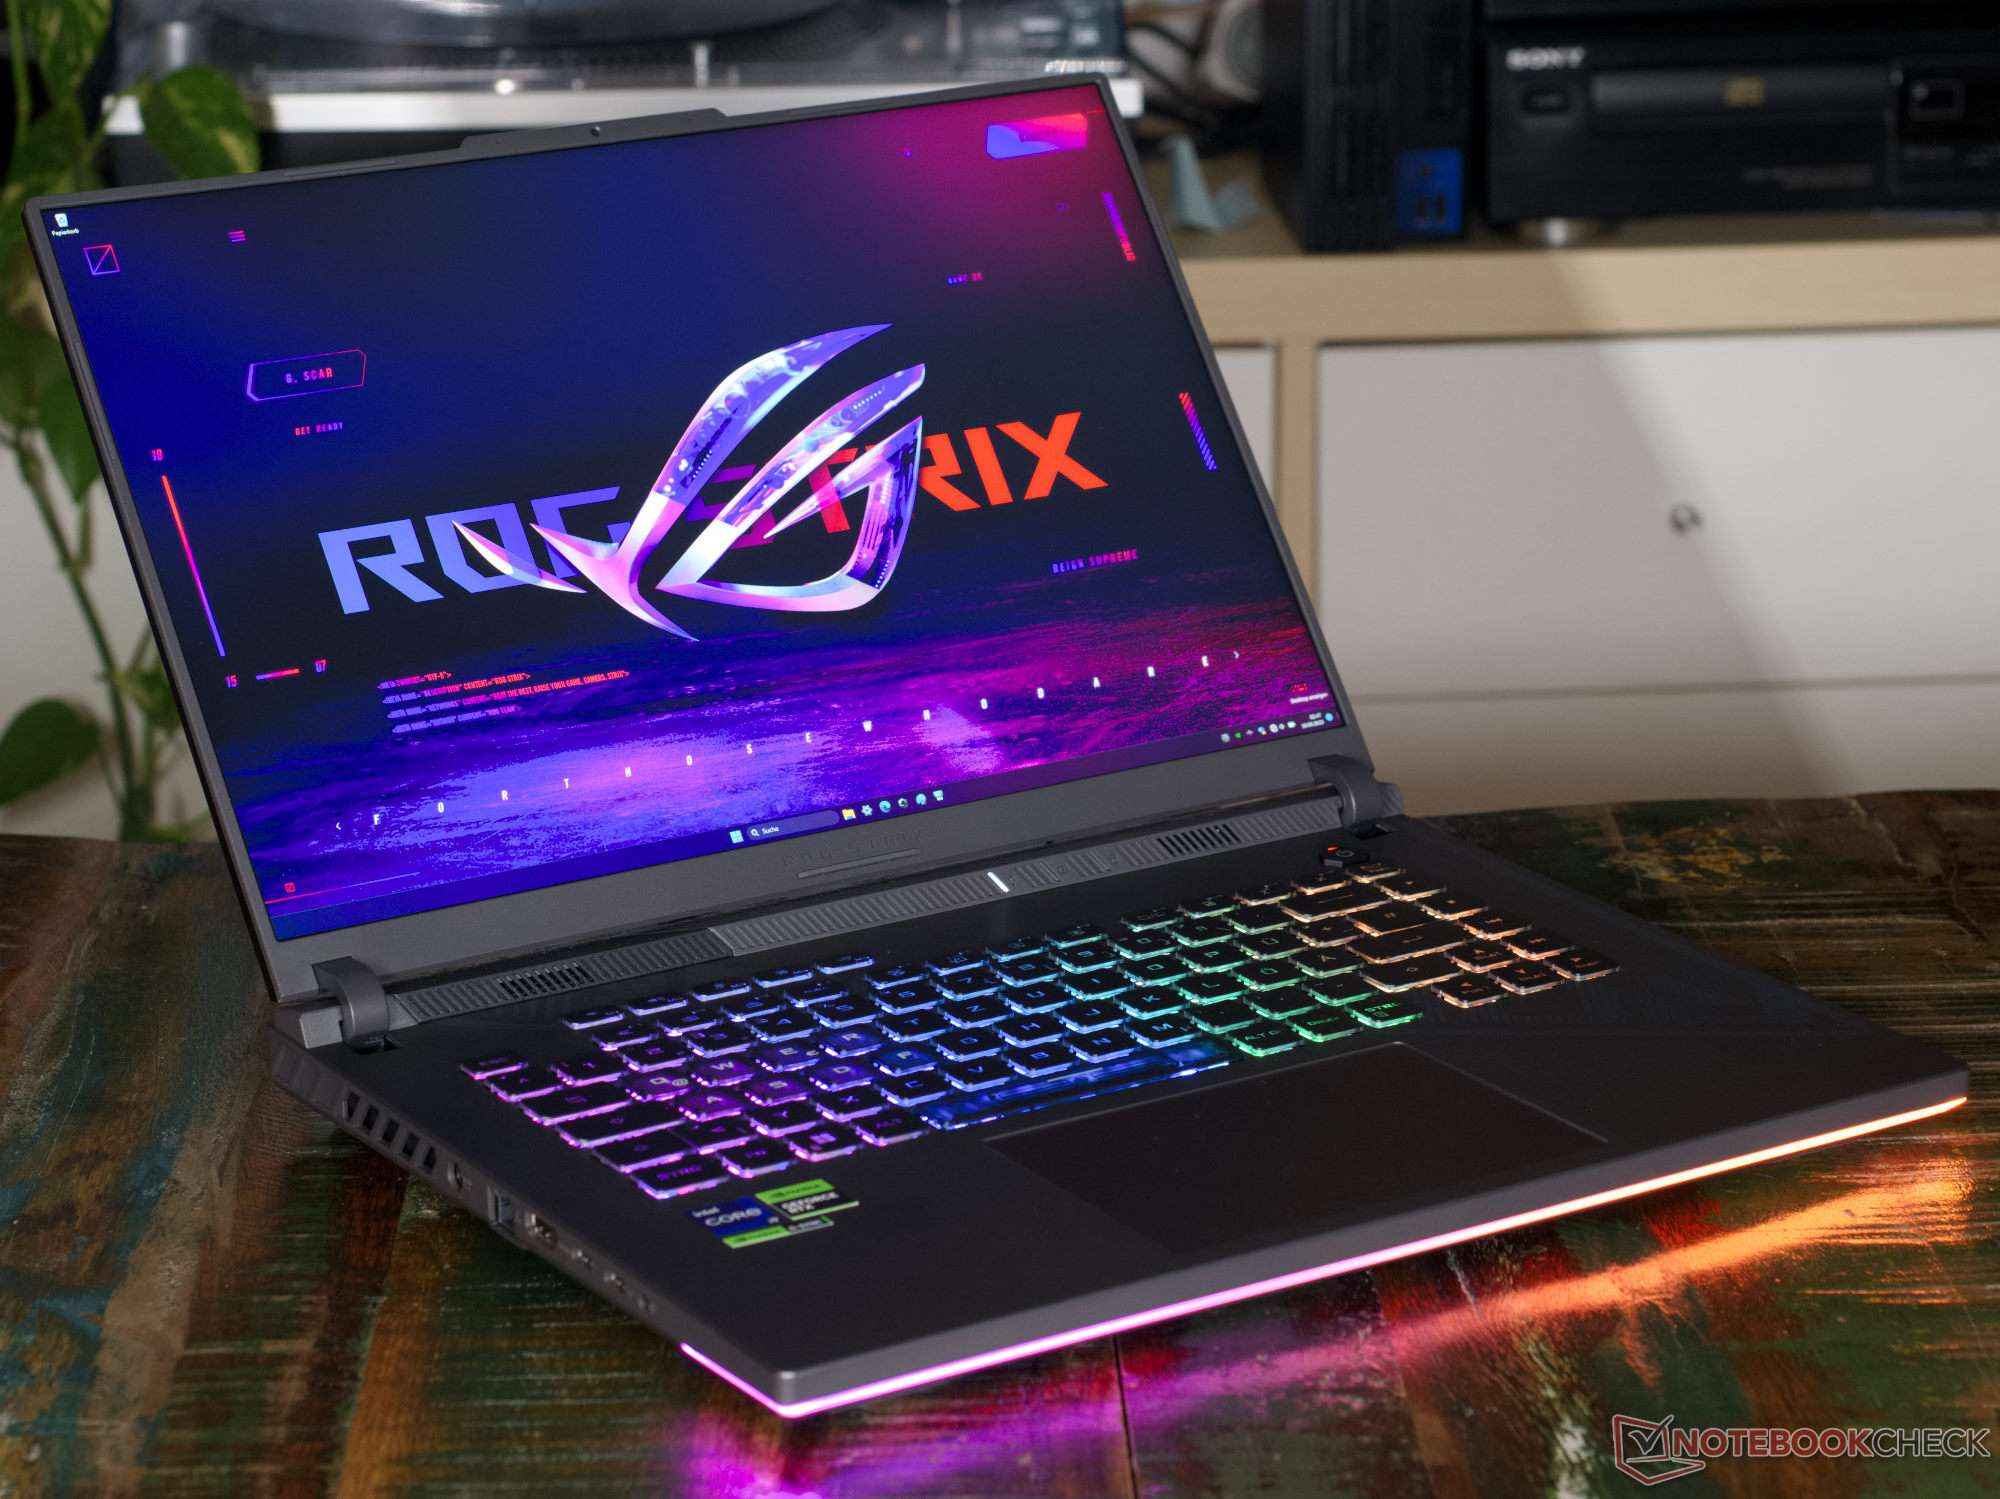
Asus ROG Strix G16 G614JZ laptop review: Clear the stage for the RTX 4080

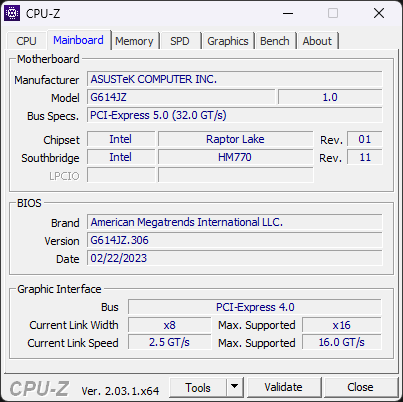
ROG, the Republic of Gamers, is Asus' high-end gaming brand. Among them are three product lines: Flow, Zephyrus and Strix, of which only the Strix laptops are classic gaming laptops. Asus further subdivides the Strix line into the ROG Strix and ROG Strix Scar categories. In principle, all ROG Strix laptops are available with similar hardware as the ROG Strix Scar models, but have a somewhat simpler design. Then again, this is also a matter of perspective, since all gaming laptops from the Taiwanese manufacturer are rather flashy. In the meantime, the devices of the ROG Strix G and the Scar series have come a little closer. While the 2022 Scar models were cooled with a vapor chamber, the cooling systems of both series are now almost identical.
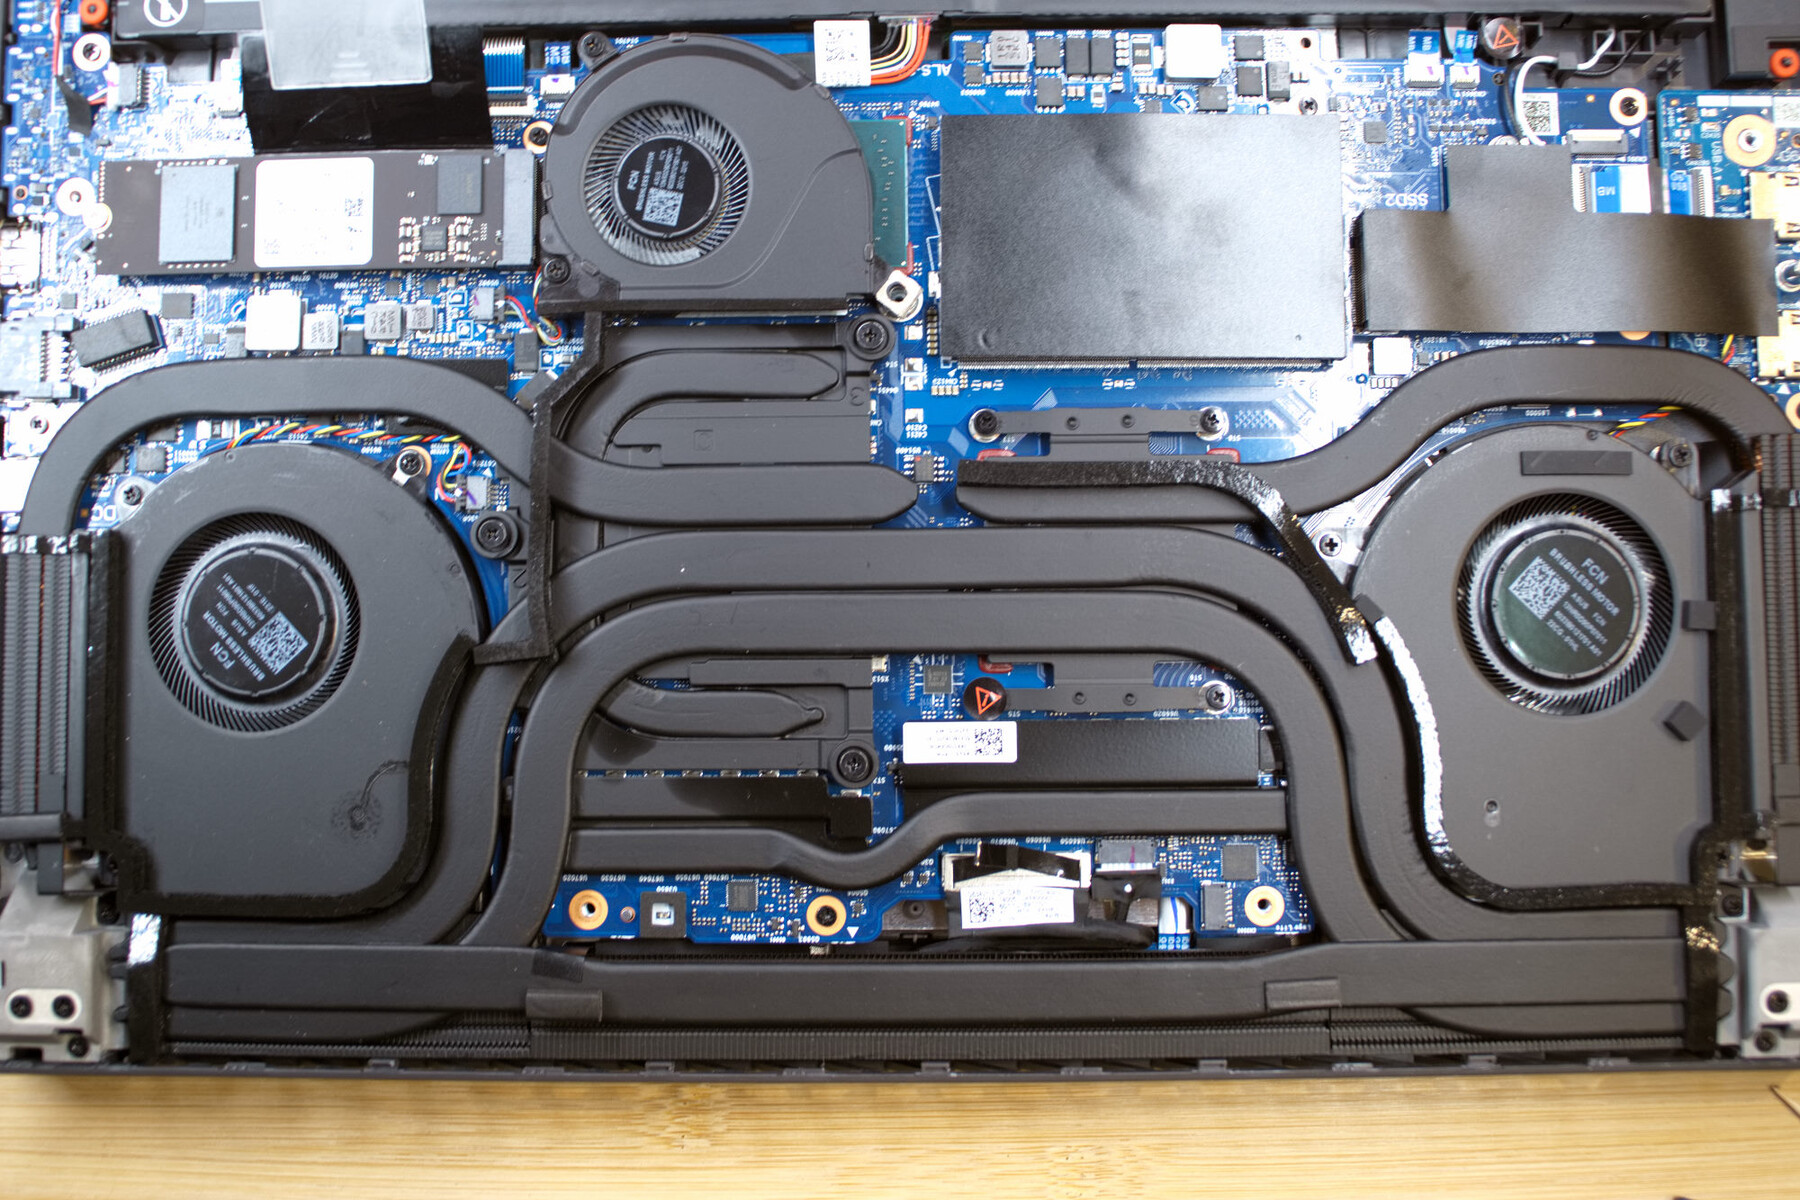
Our test device with its Intel Core i9-13980HX and Nvidia GeForce RTX 4080 is one of the best-equipped devices. In order to keep the powerful hardware at tolerable operating temperatures, Asus has installed a massive cooling system with three fans. Liquid metal also ensures good heat dissipation and long boosts.
16-inch gaming laptops are currently all the rage, so our database has a large number of current-gen gamers with similar specs. We have already reviewed a few laptops from the latest generation of the ROG Strix series. These include the Asus ROG Strix G18 and the Asus ROG Strix Scar 18. Both laptops have different graphics chips, namely the RTX 4070 and RTX 4090, but have similar cooling systems, almost identical motherboards and thus similar power limit values. This results in interesting comparison possibilities between the different Nvidia graphics units.
The Lenovo Legion Pro 7 and the Razer Blade 16 are 16-inch laptops in the same performance class as the ROG Strix G16, although both laptops are likely to be more expensive.
Possible Competitors in Comparison
Rating | Date | Model | Weight | Height | Size | Resolution | Best Price |
|---|---|---|---|---|---|---|---|
| 88.4 % | 03/2023 | Asus ROG Strix G16 G614JZ i9-13980HX, NVIDIA GeForce RTX 4080 Laptop GPU | 2.4 kg | 30.4 mm | 16.00" | 2560x1600 | |
| 88 % | 04/2023 | Asus Zephyrus Duo 16 GX650PY-NM006W R9 7945HX, NVIDIA GeForce RTX 4090 Laptop GPU | 2.7 kg | 29.7 mm | 16.00" | 2560x1600 | |
| 89.4 % | 02/2023 | Lenovo Legion Pro 7 16IRX8H i9-13900HX, NVIDIA GeForce RTX 4080 Laptop GPU | 2.7 kg | 26 mm | 16.00" | 2560x1600 | |
| 86.2 % | 03/2023 | Gigabyte AERO 16 OLED BSF i9-13900H, NVIDIA GeForce RTX 4070 Laptop GPU | 2.1 kg | 18 mm | 16.00" | 3840x2400 | |
| 86.2 % | 02/2023 | Asus TUF Gaming A16 FA617 R7 7735HS, Radeon RX 7600S | 2.2 kg | 27 mm | 16.00" | 1920x1200 | |
| 91.2 % | 02/2023 | Razer Blade 16 Early 2023 i9-13950HX, NVIDIA GeForce RTX 4080 Laptop GPU | 2.4 kg | 21.99 mm | 16.00" | 2560x1600 | |
| 88.4 % | 04/2023 | Asus ROG Strix G17 G713PI R9 7945HX, NVIDIA GeForce RTX 4070 Laptop GPU | 2.8 kg | 30.7 mm | 17.30" | 2560x1440 | |
| 87.4 % | 03/2023 | Asus ROG Strix G18 G814JI i7-13650HX, NVIDIA GeForce RTX 4070 Laptop GPU | 3 kg | 31 mm | 18.00" | 2560x1600 | |
| 86.6 % | 02/2023 | Asus ROG Strix Scar 18 2023 G834JY-N6005W i9-13980HX, NVIDIA GeForce RTX 4090 Laptop GPU | 3.1 kg | 30.8 mm | 18.00" | 2560x1600 | |
| 86.9 % | 11/2022 | Asus ROG Strix Scar 17 SE G733CX-LL014W i9-12950HX, GeForce RTX 3080 Ti Laptop GPU | 2.9 kg | 28.3 mm | 17.30" | 2560x1440 | |
| 85 % | 02/2021 | Asus ROG Strix G15 G513QR R9 5900HX, GeForce RTX 3070 Laptop GPU | 2.3 kg | 27.2 mm | 15.60" | 1920x1080 |
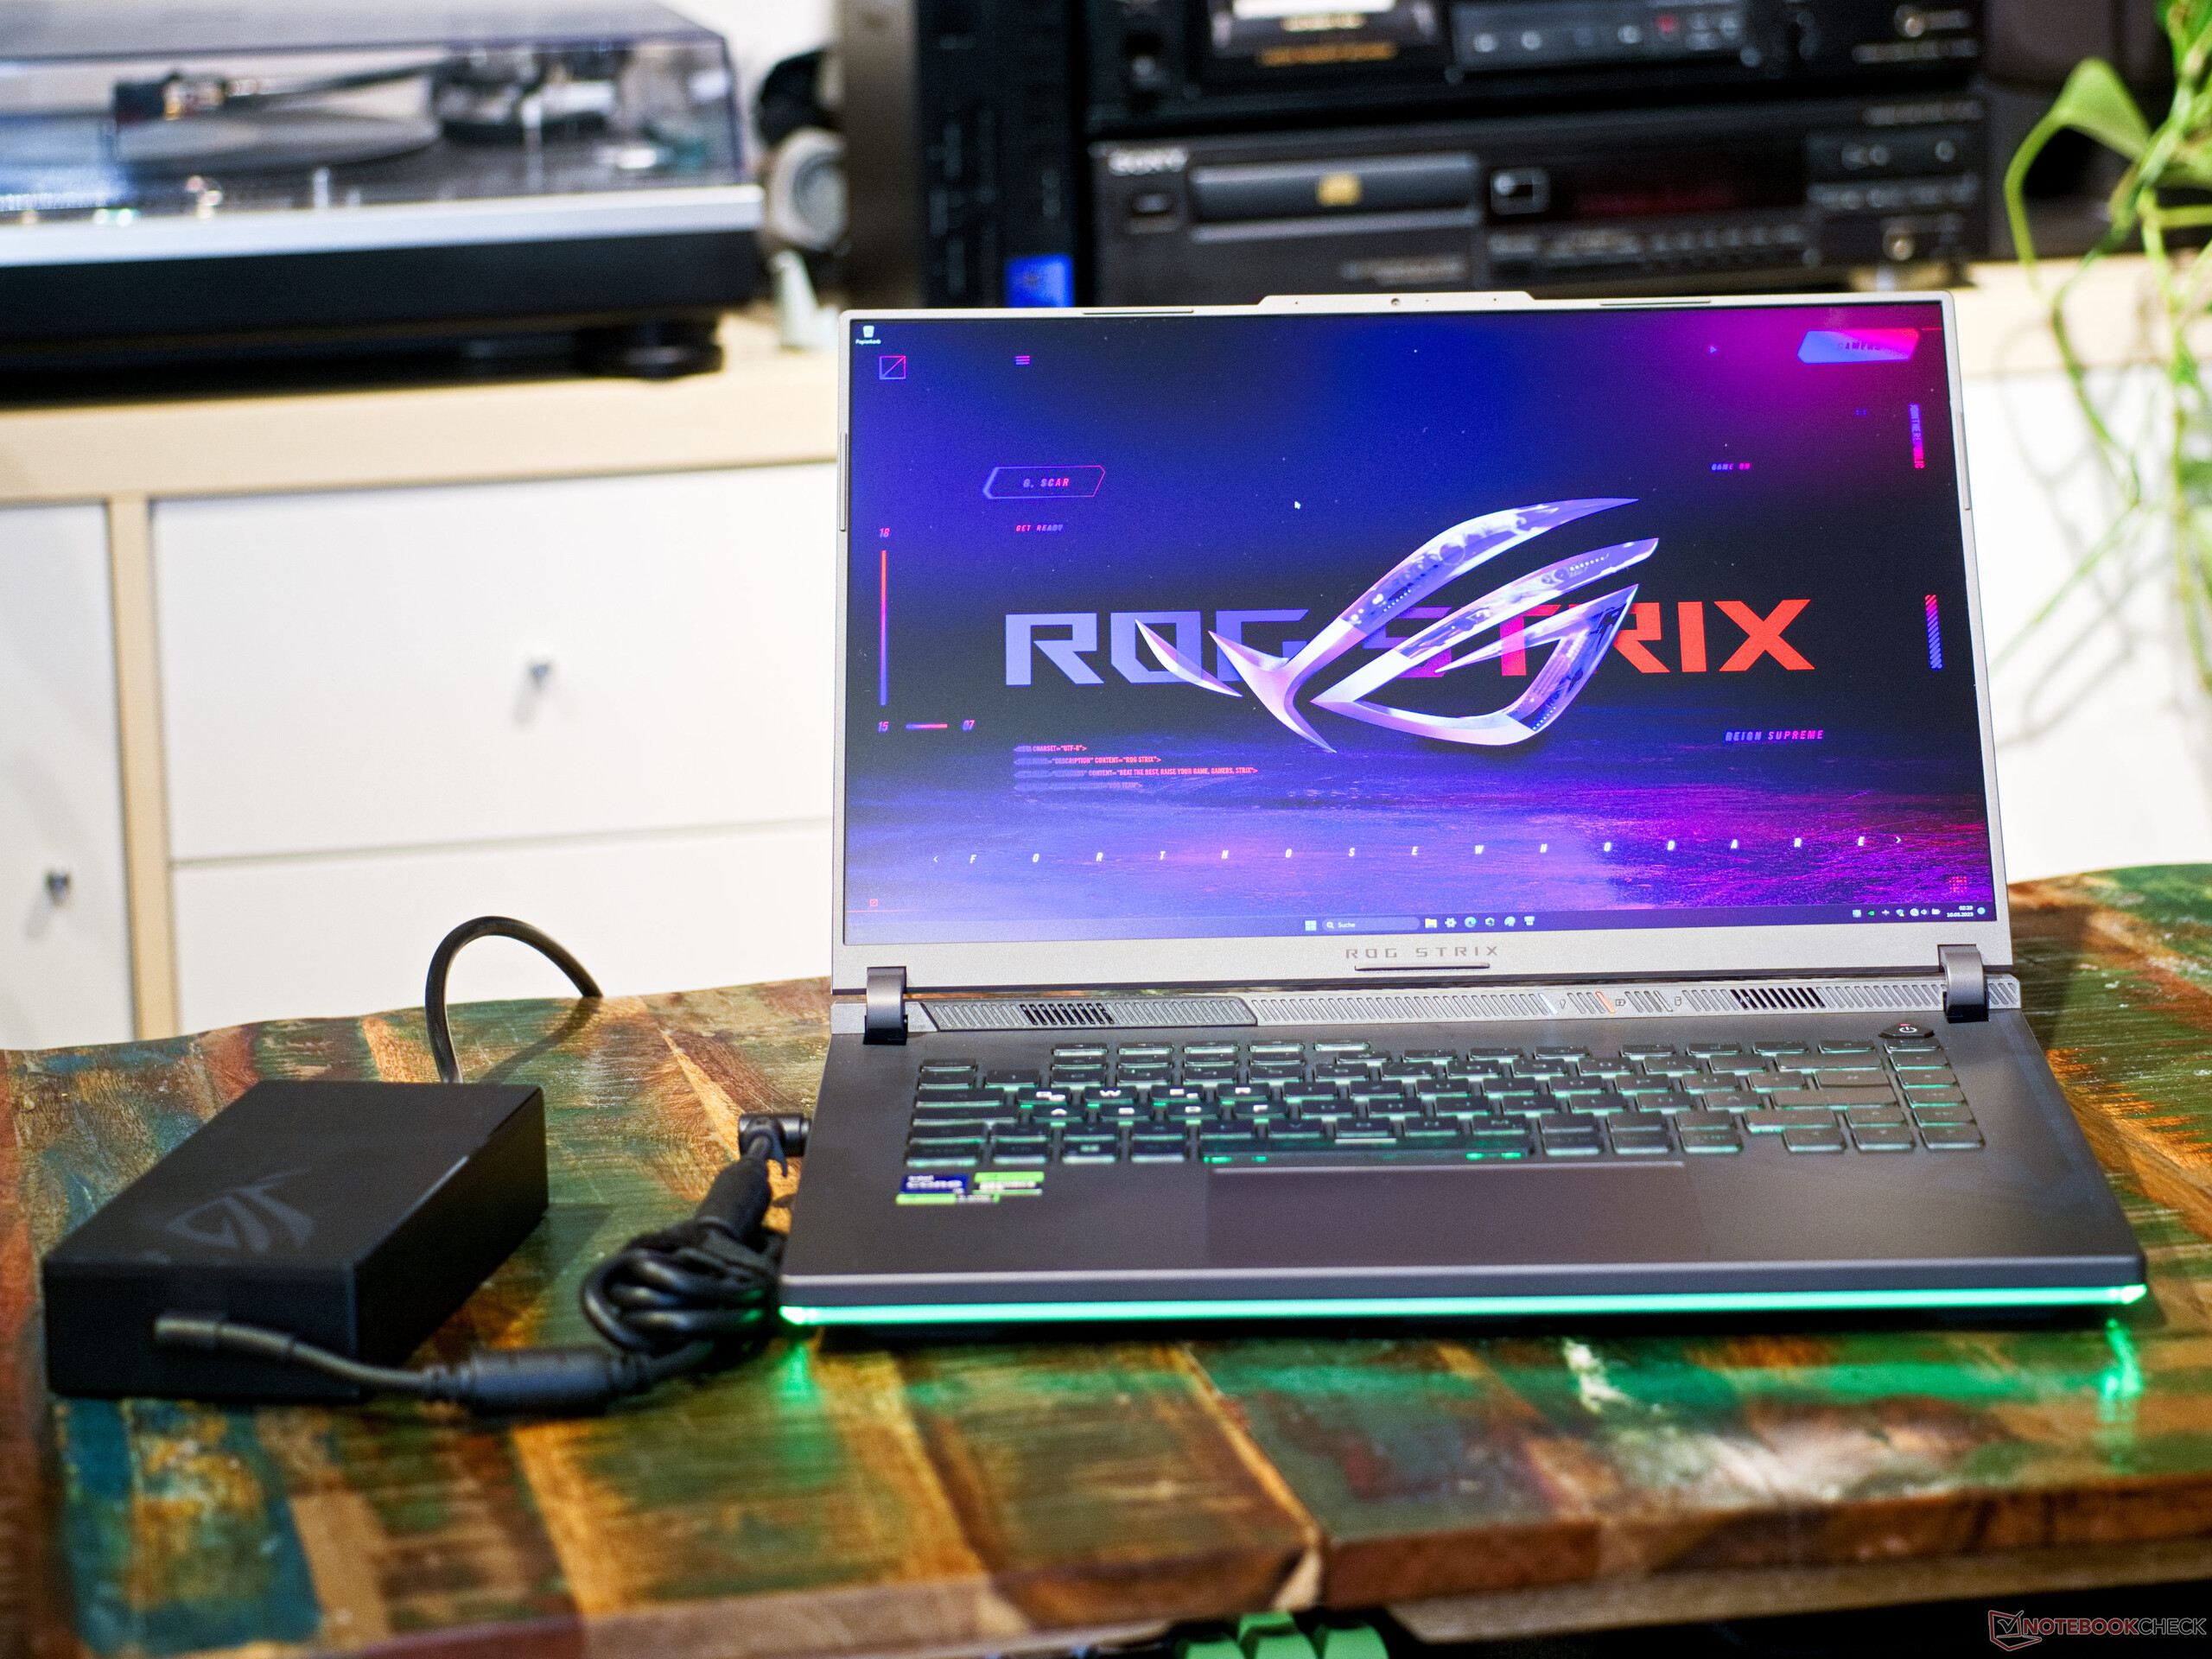
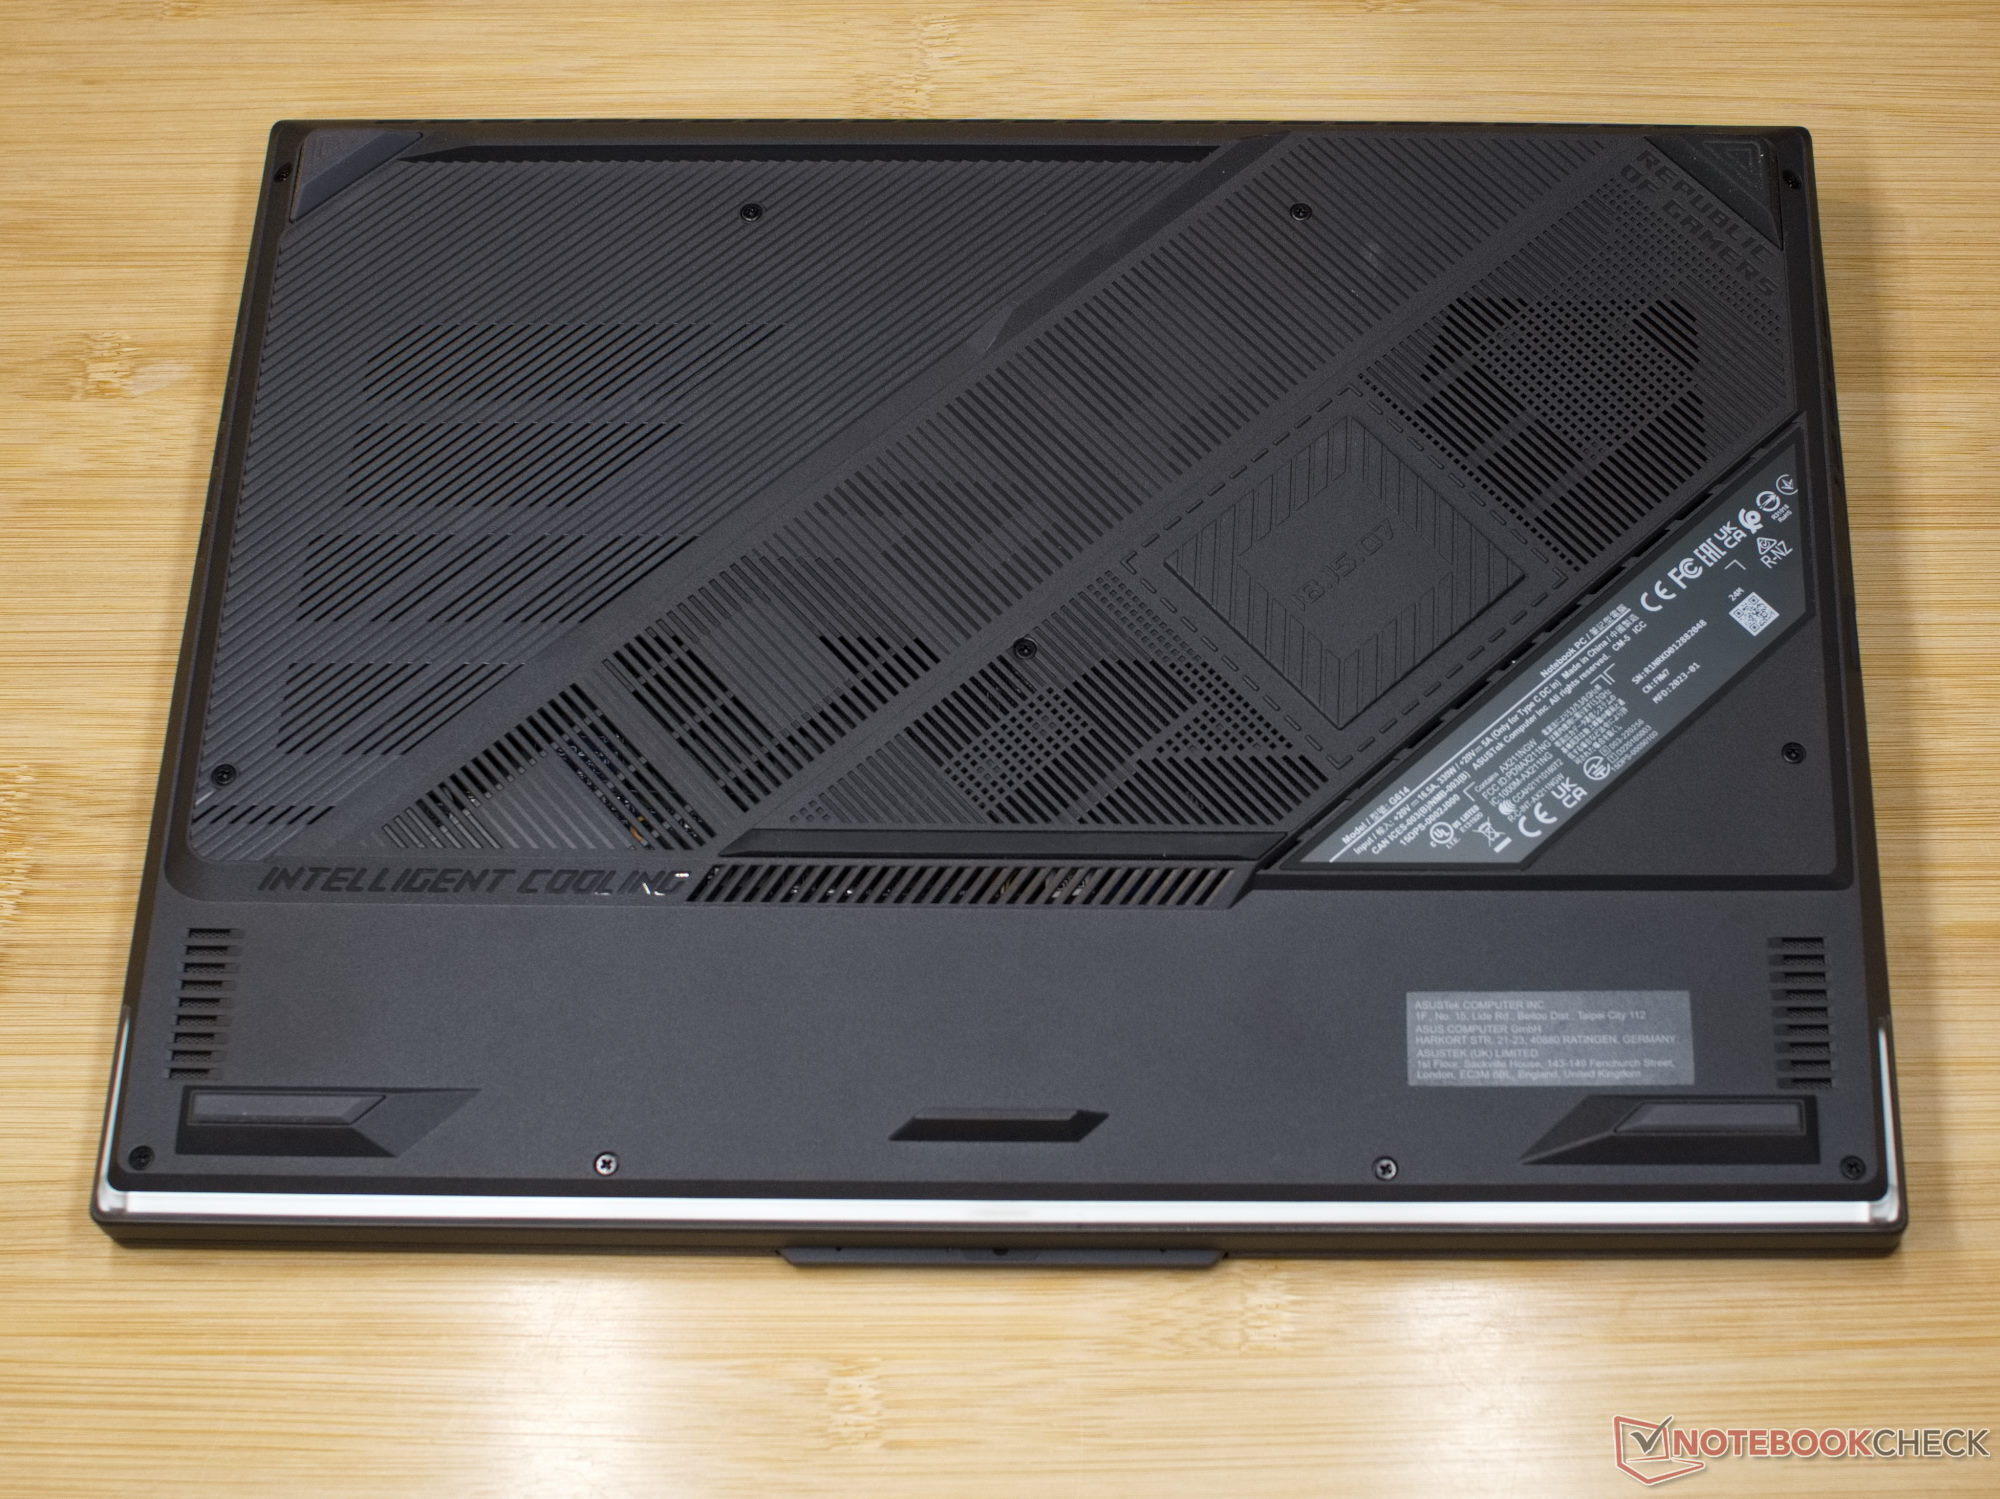
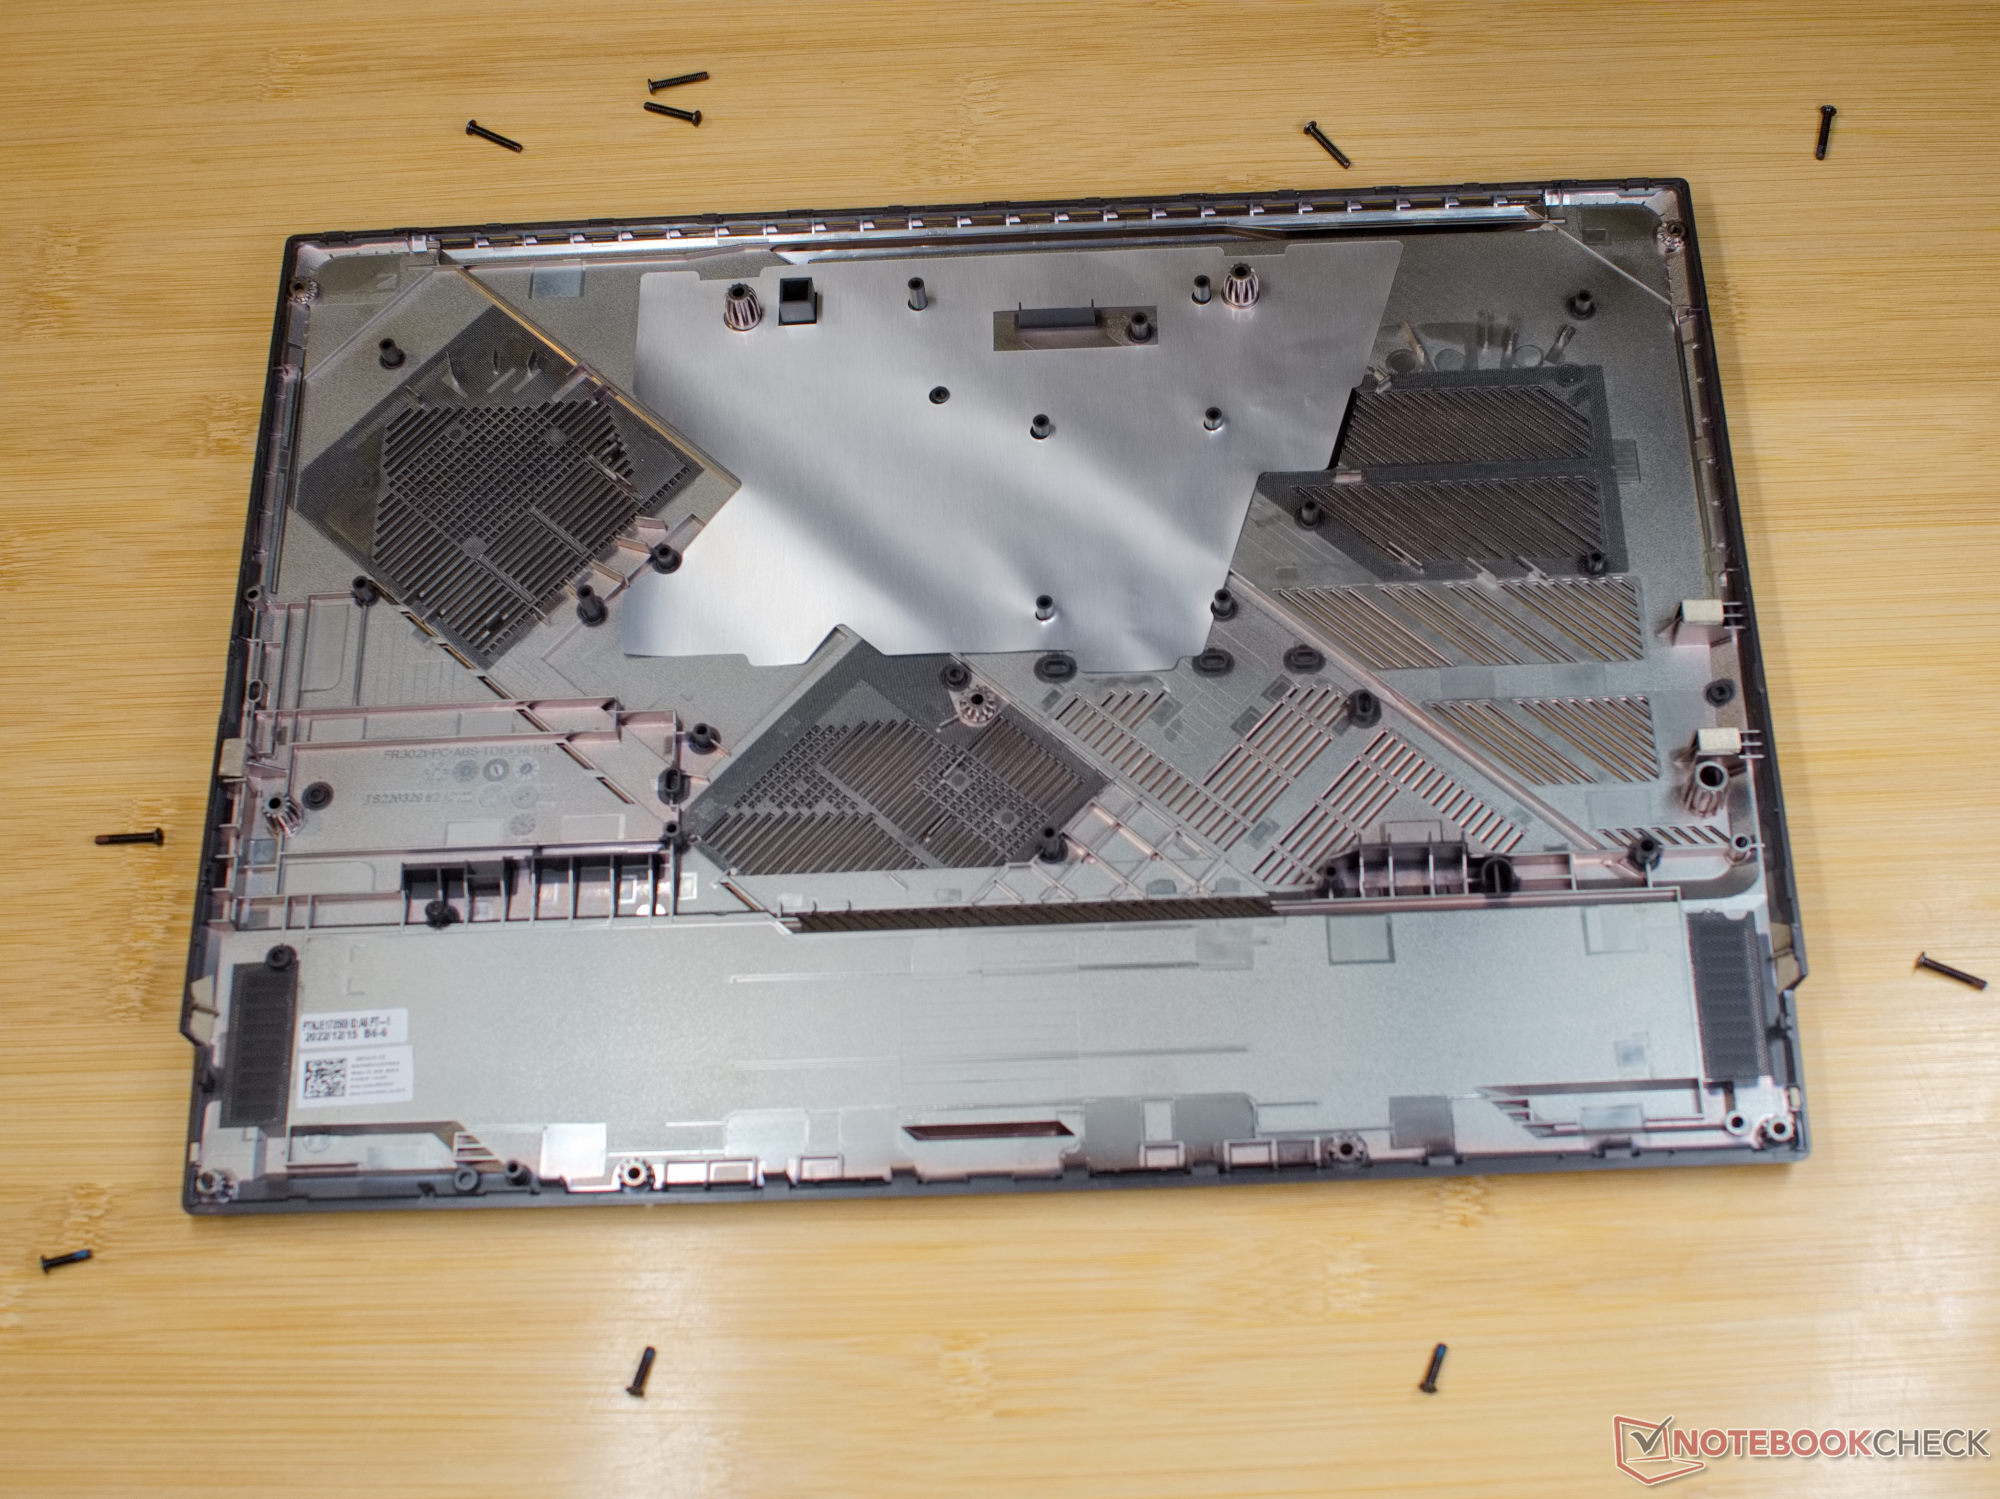
Case - Top design, but the implementation could be improved
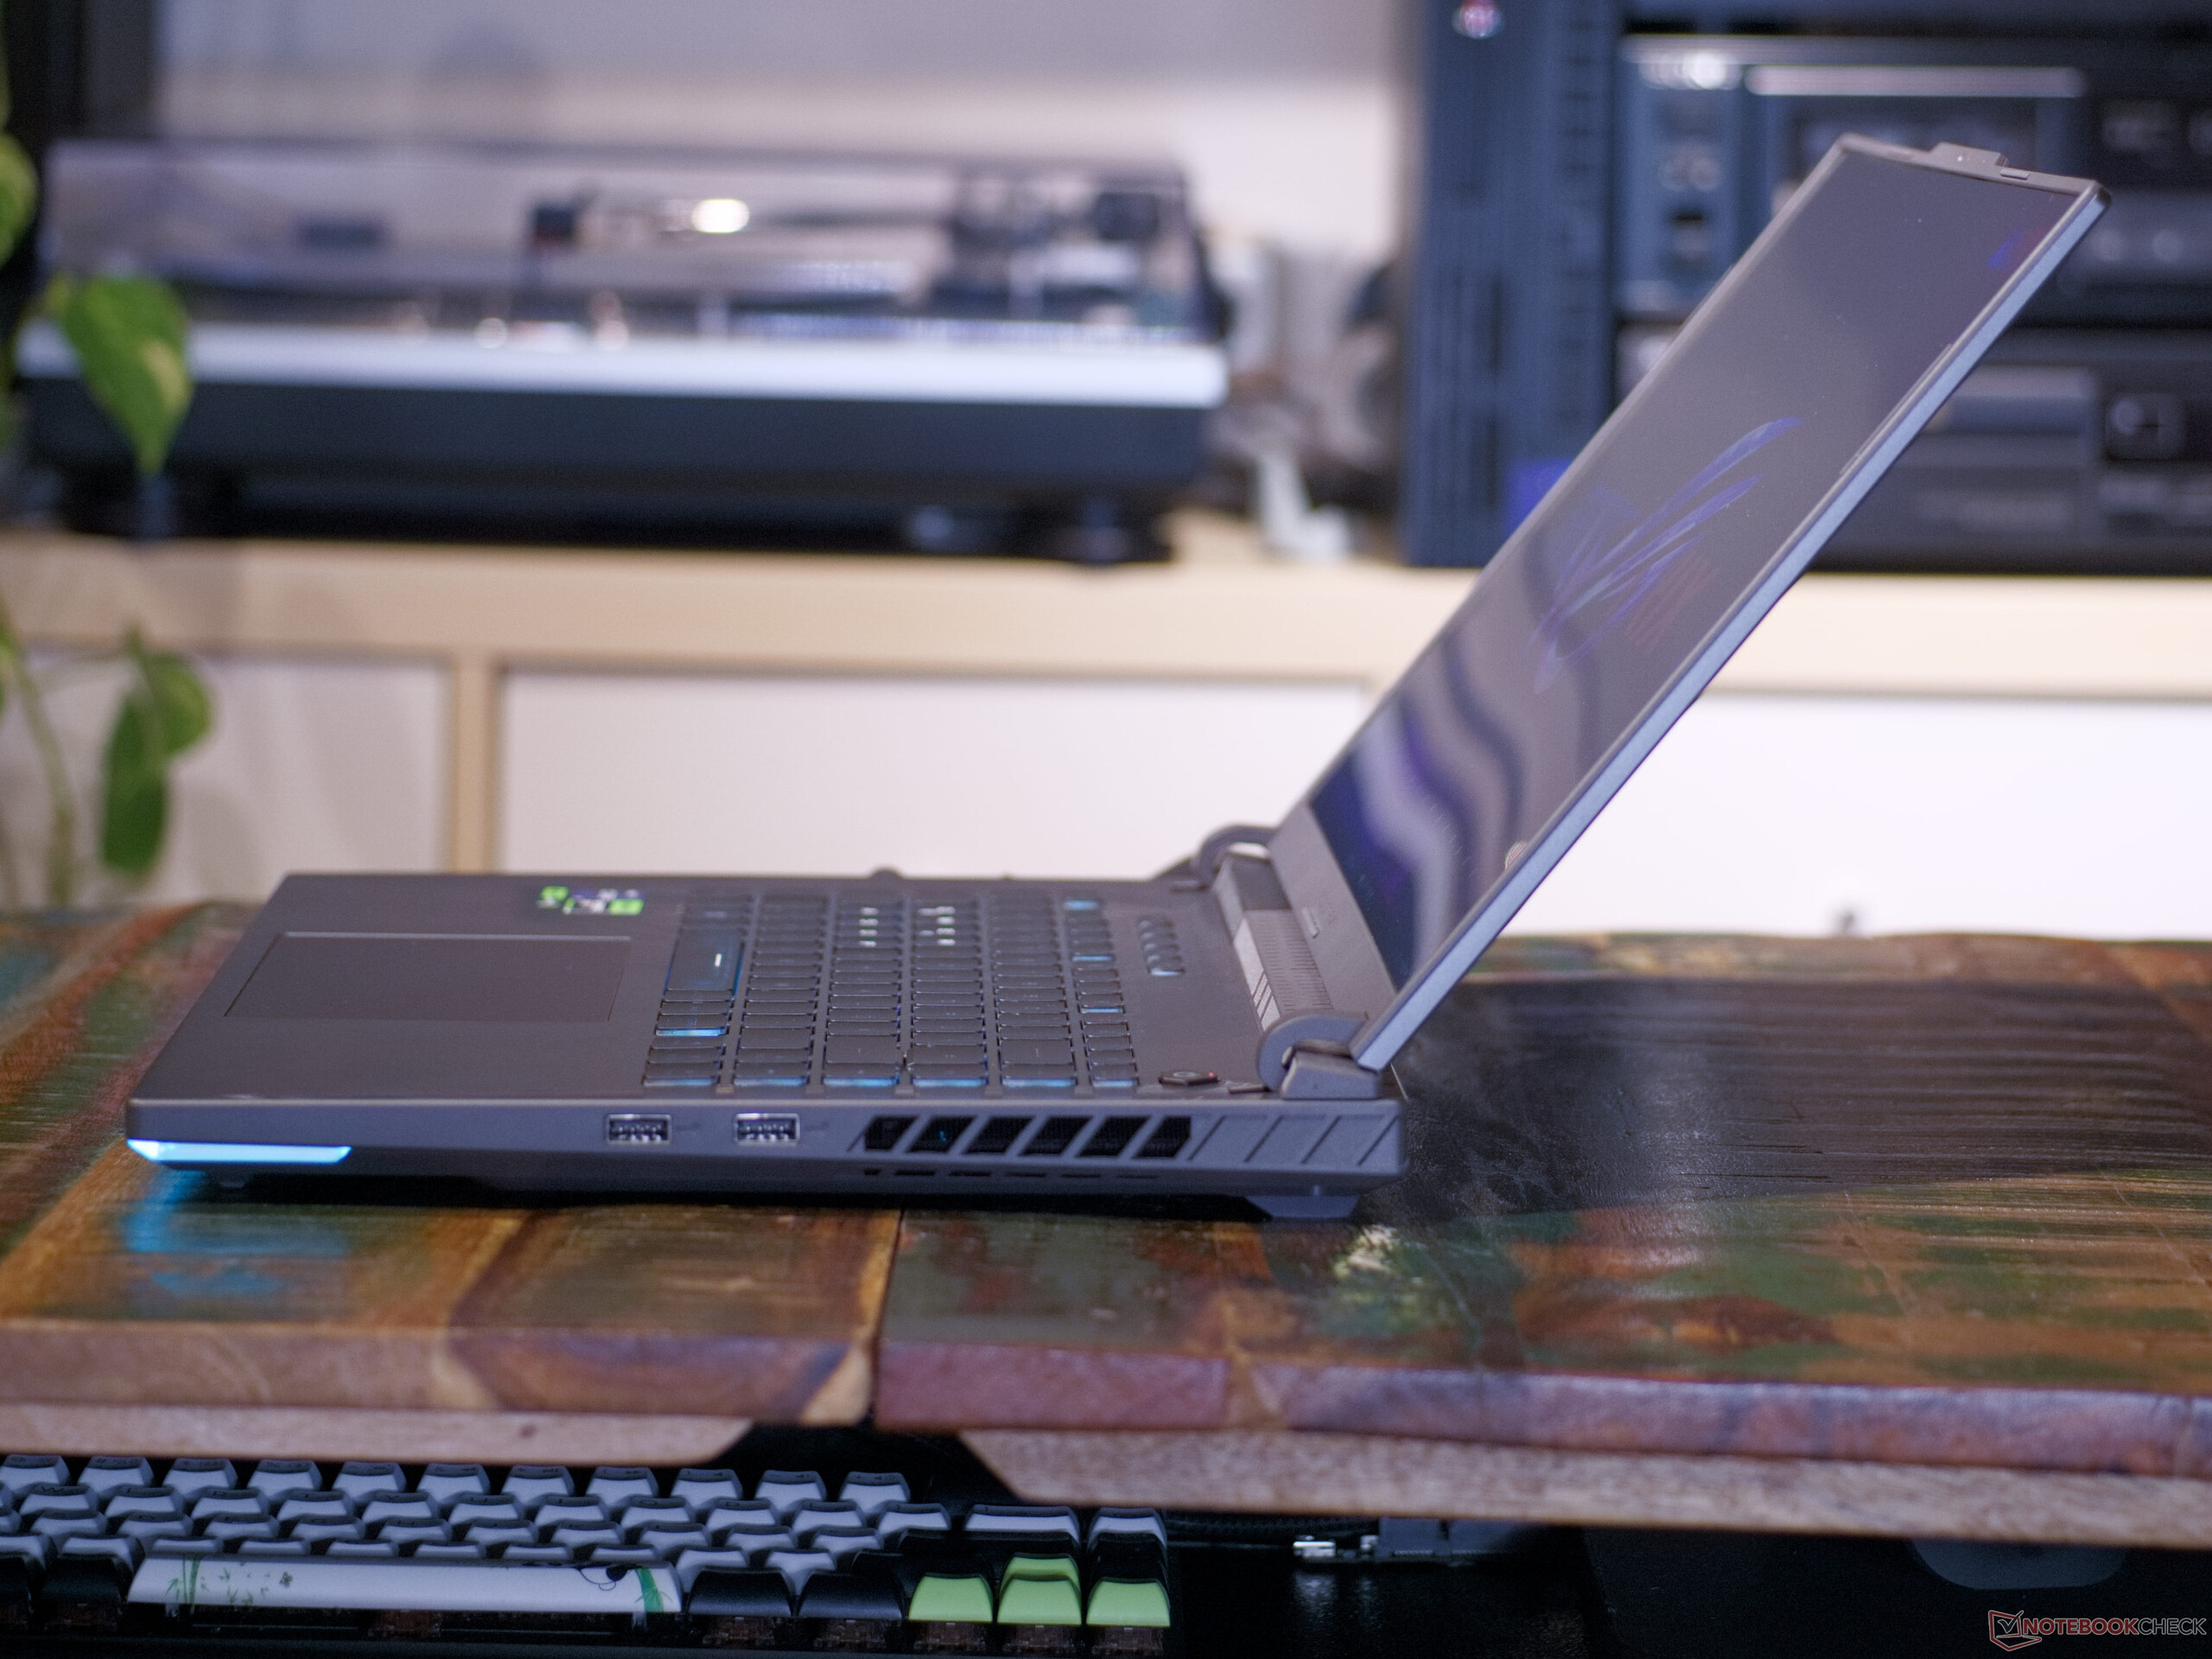
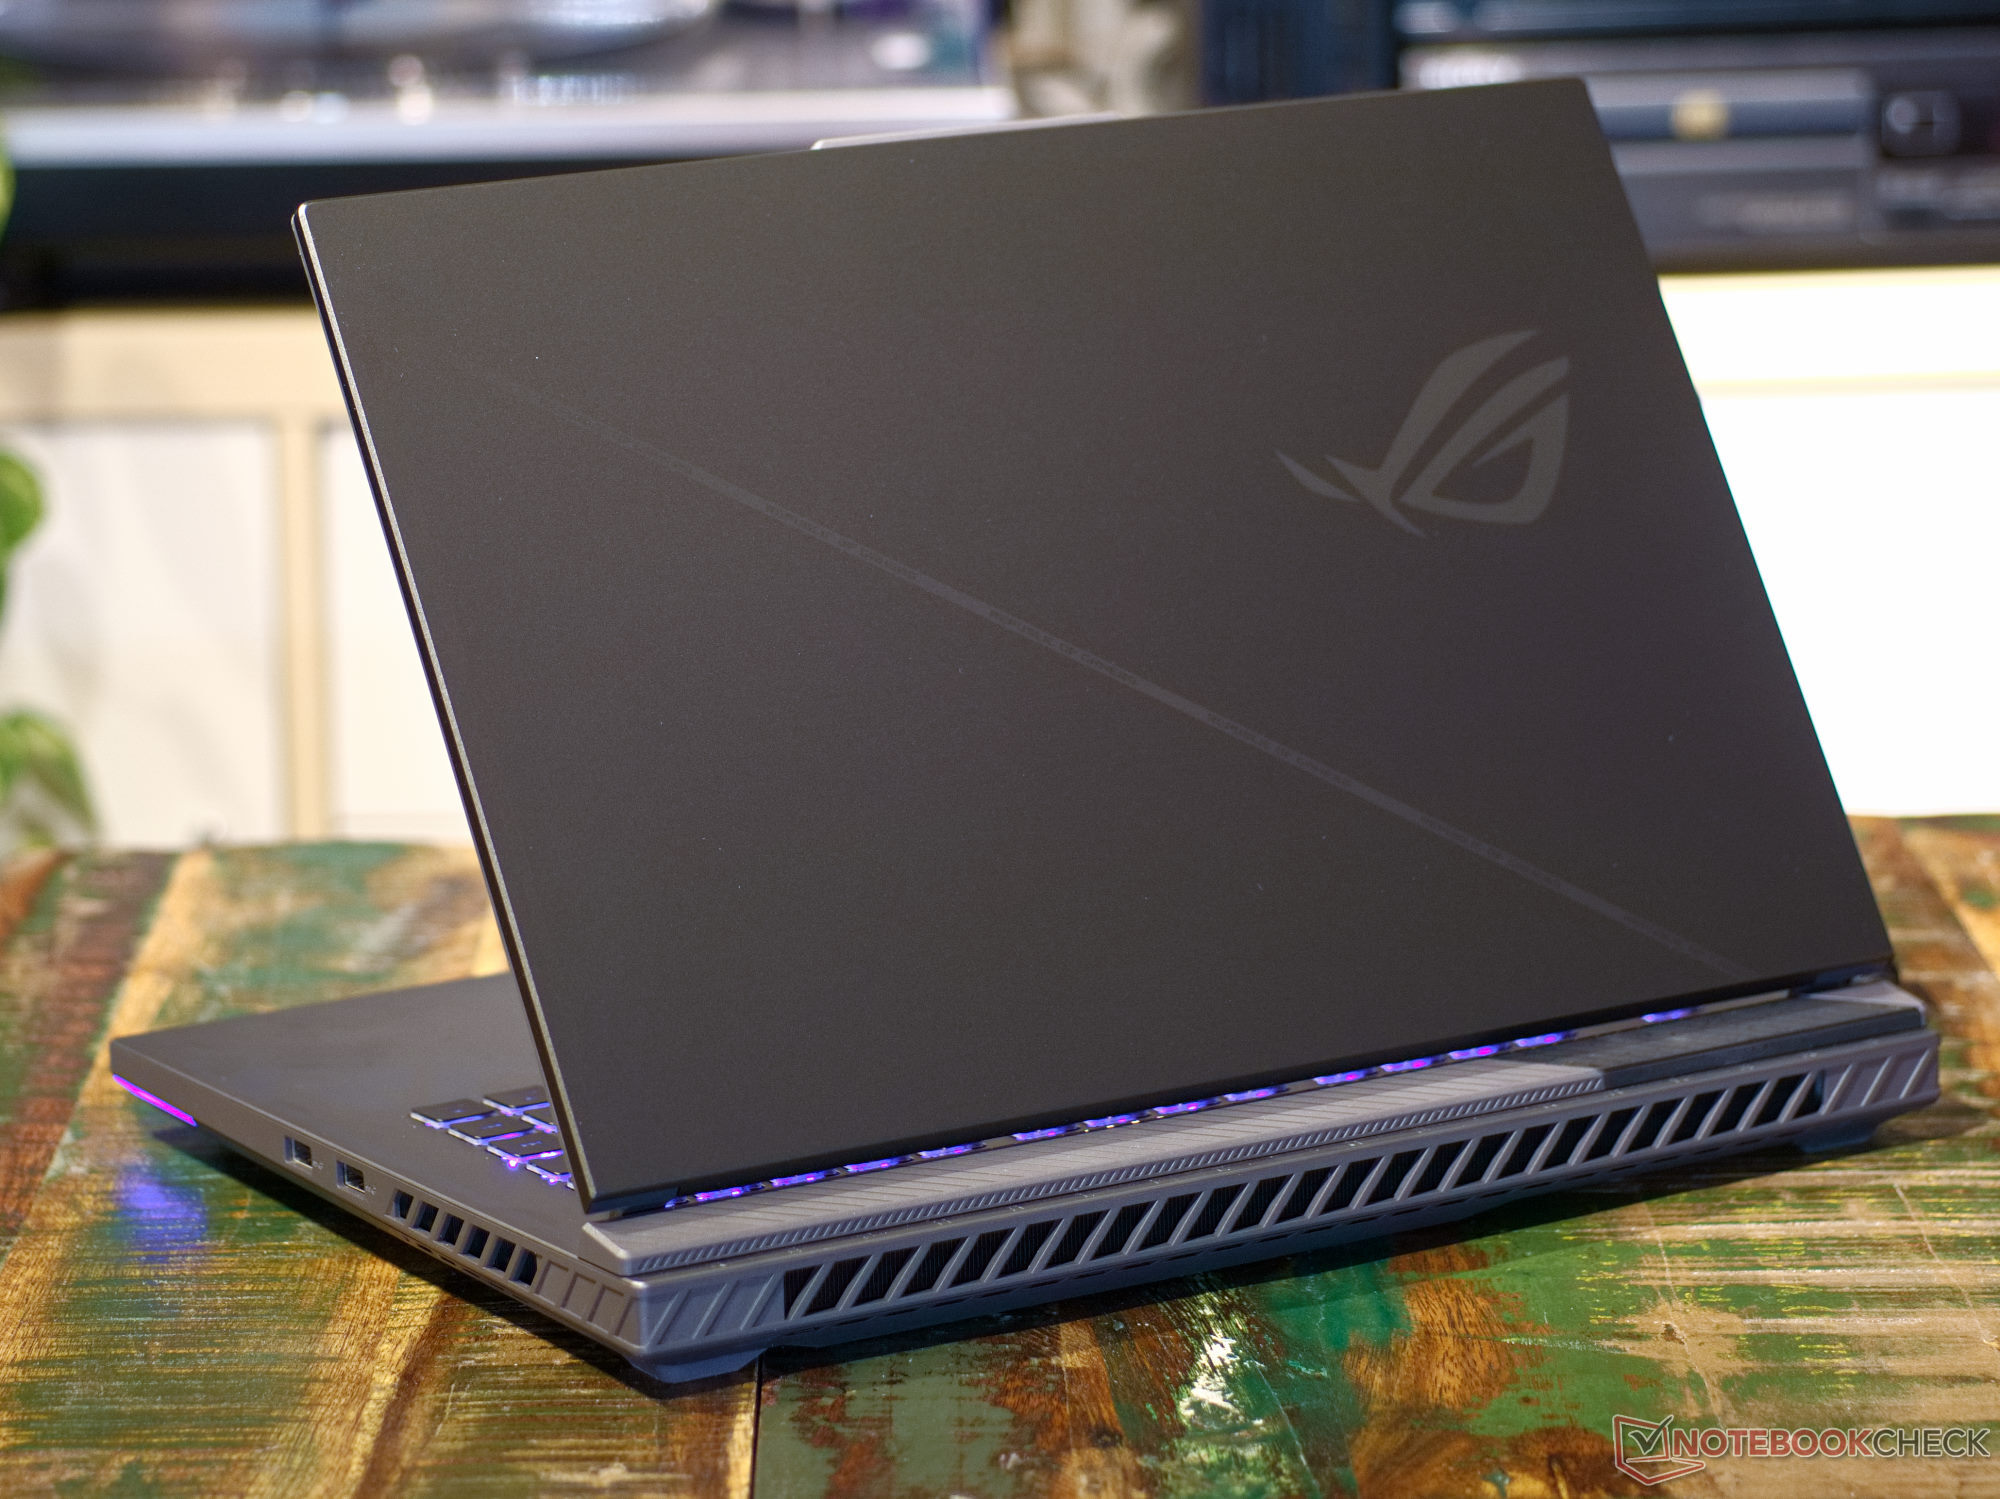
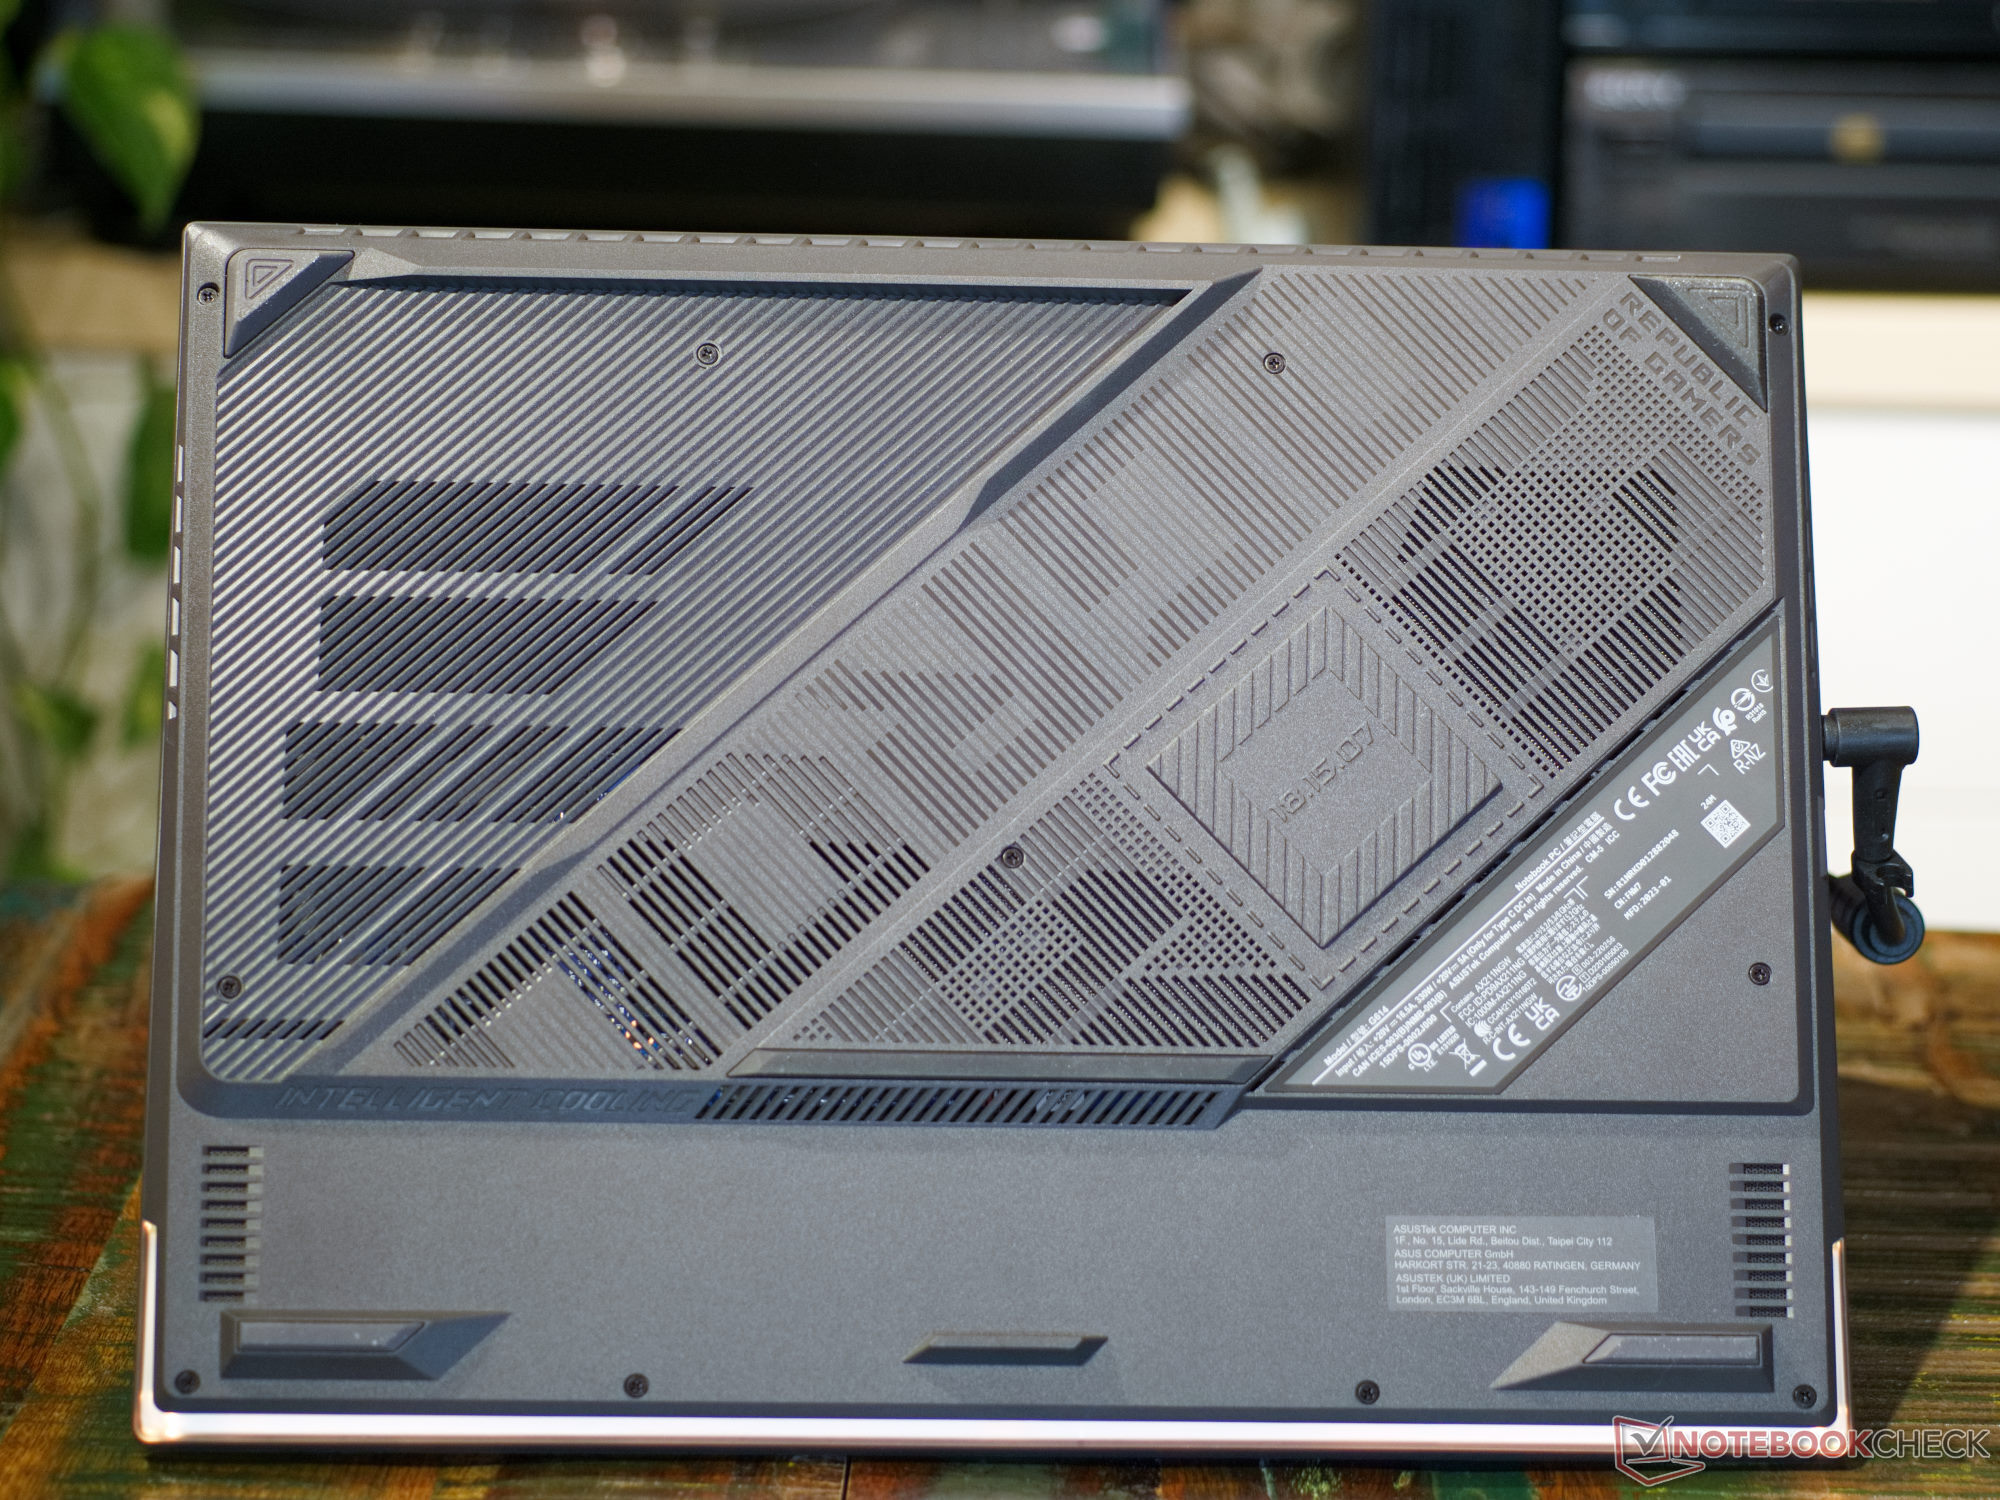
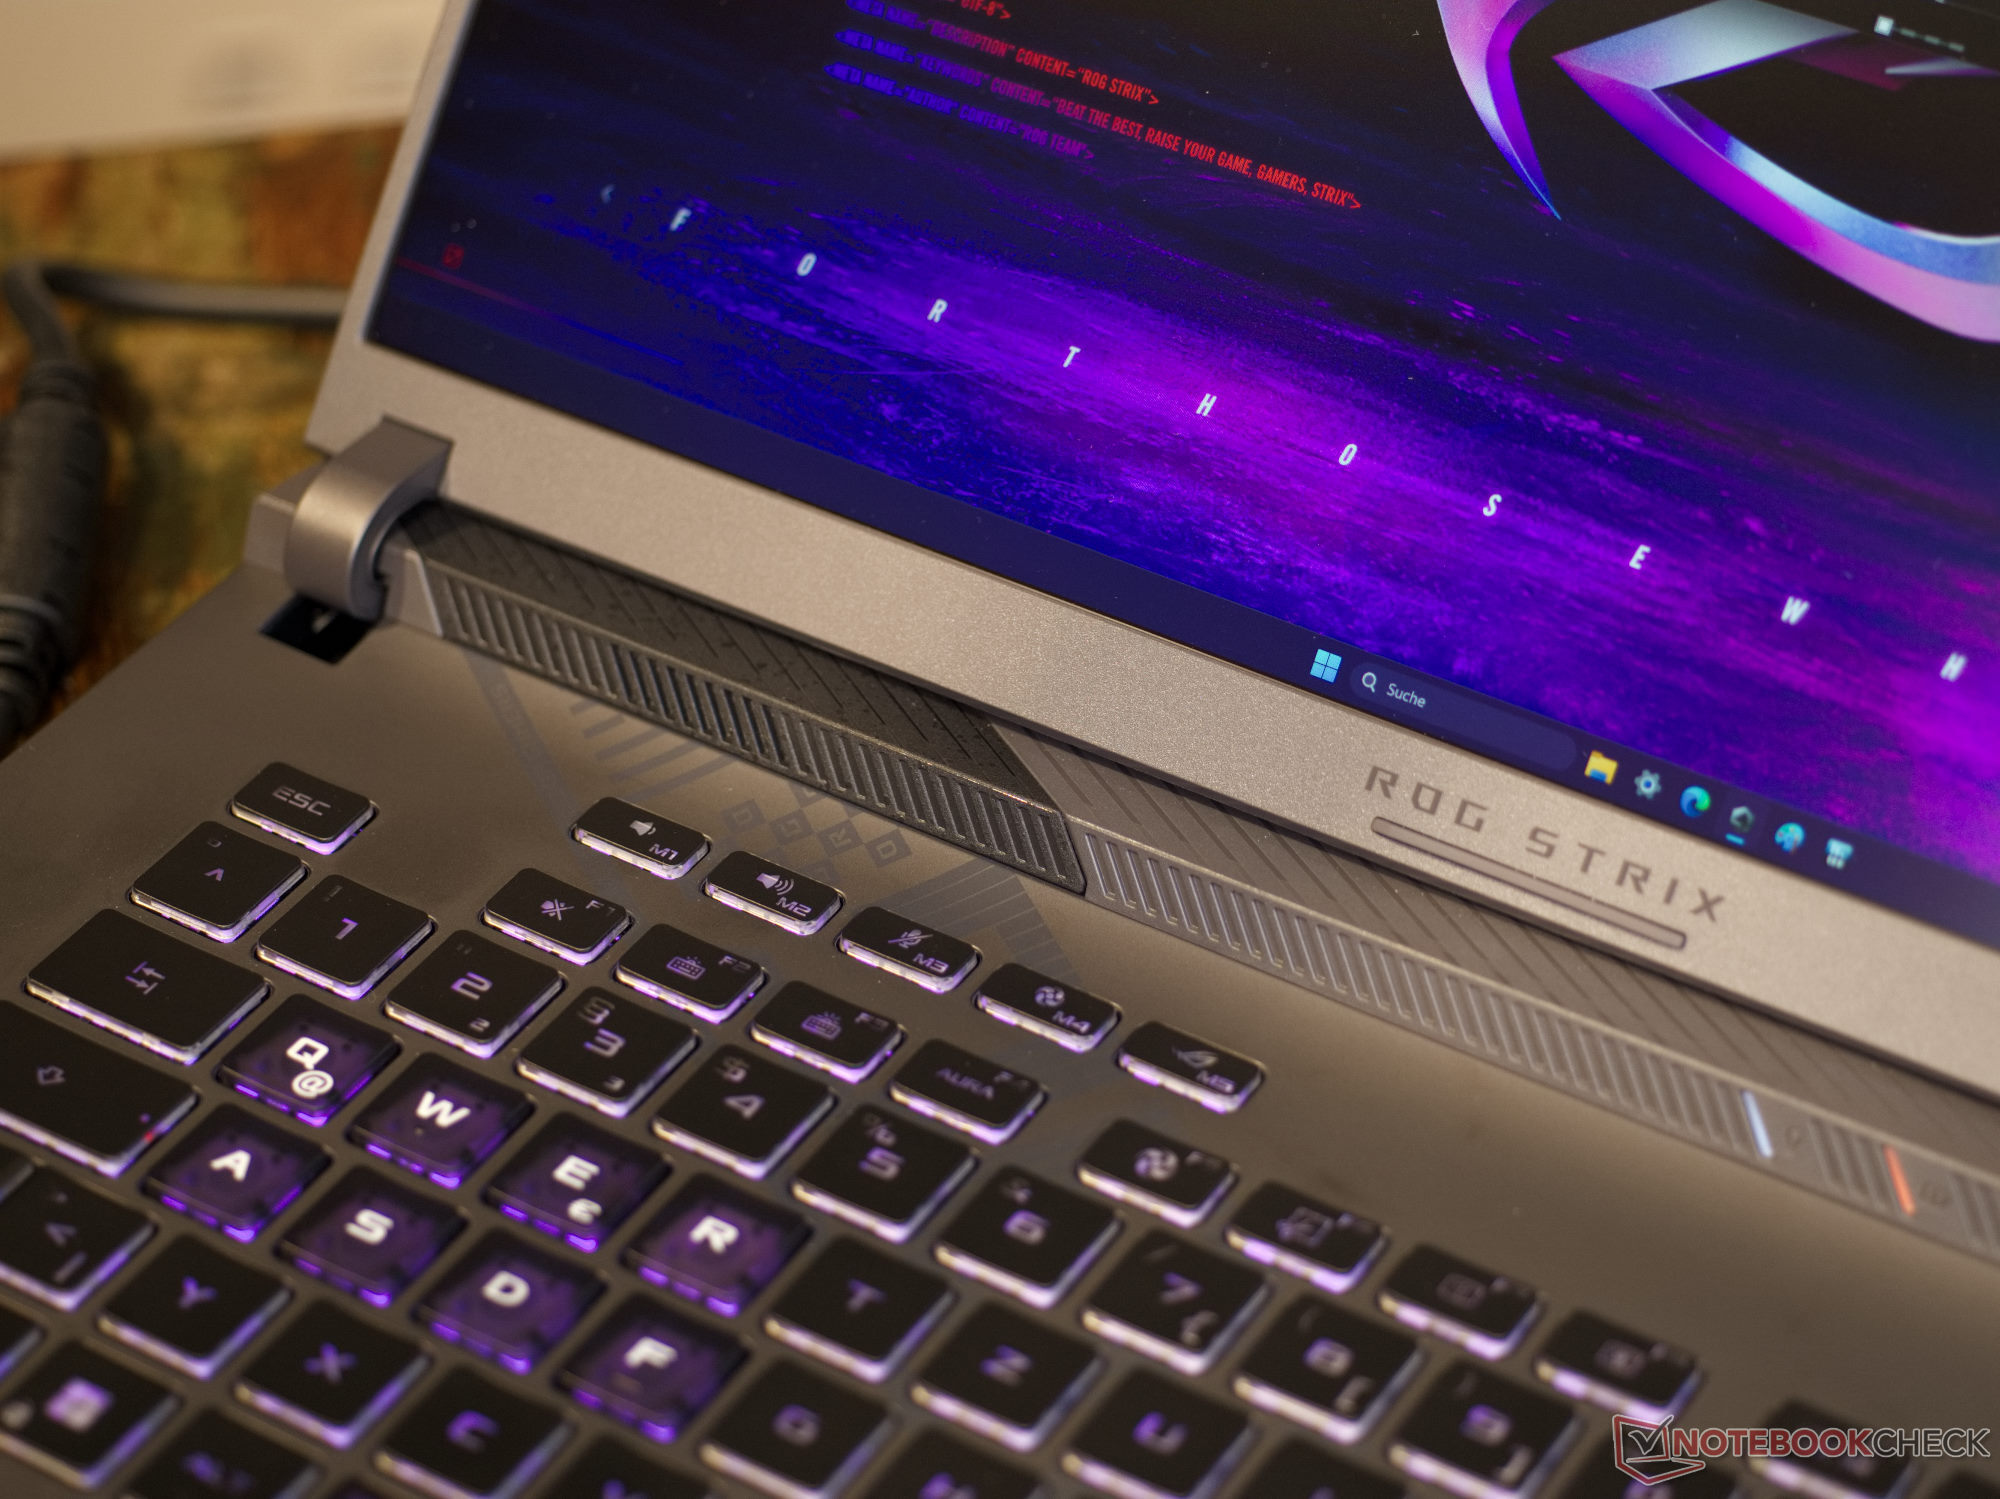
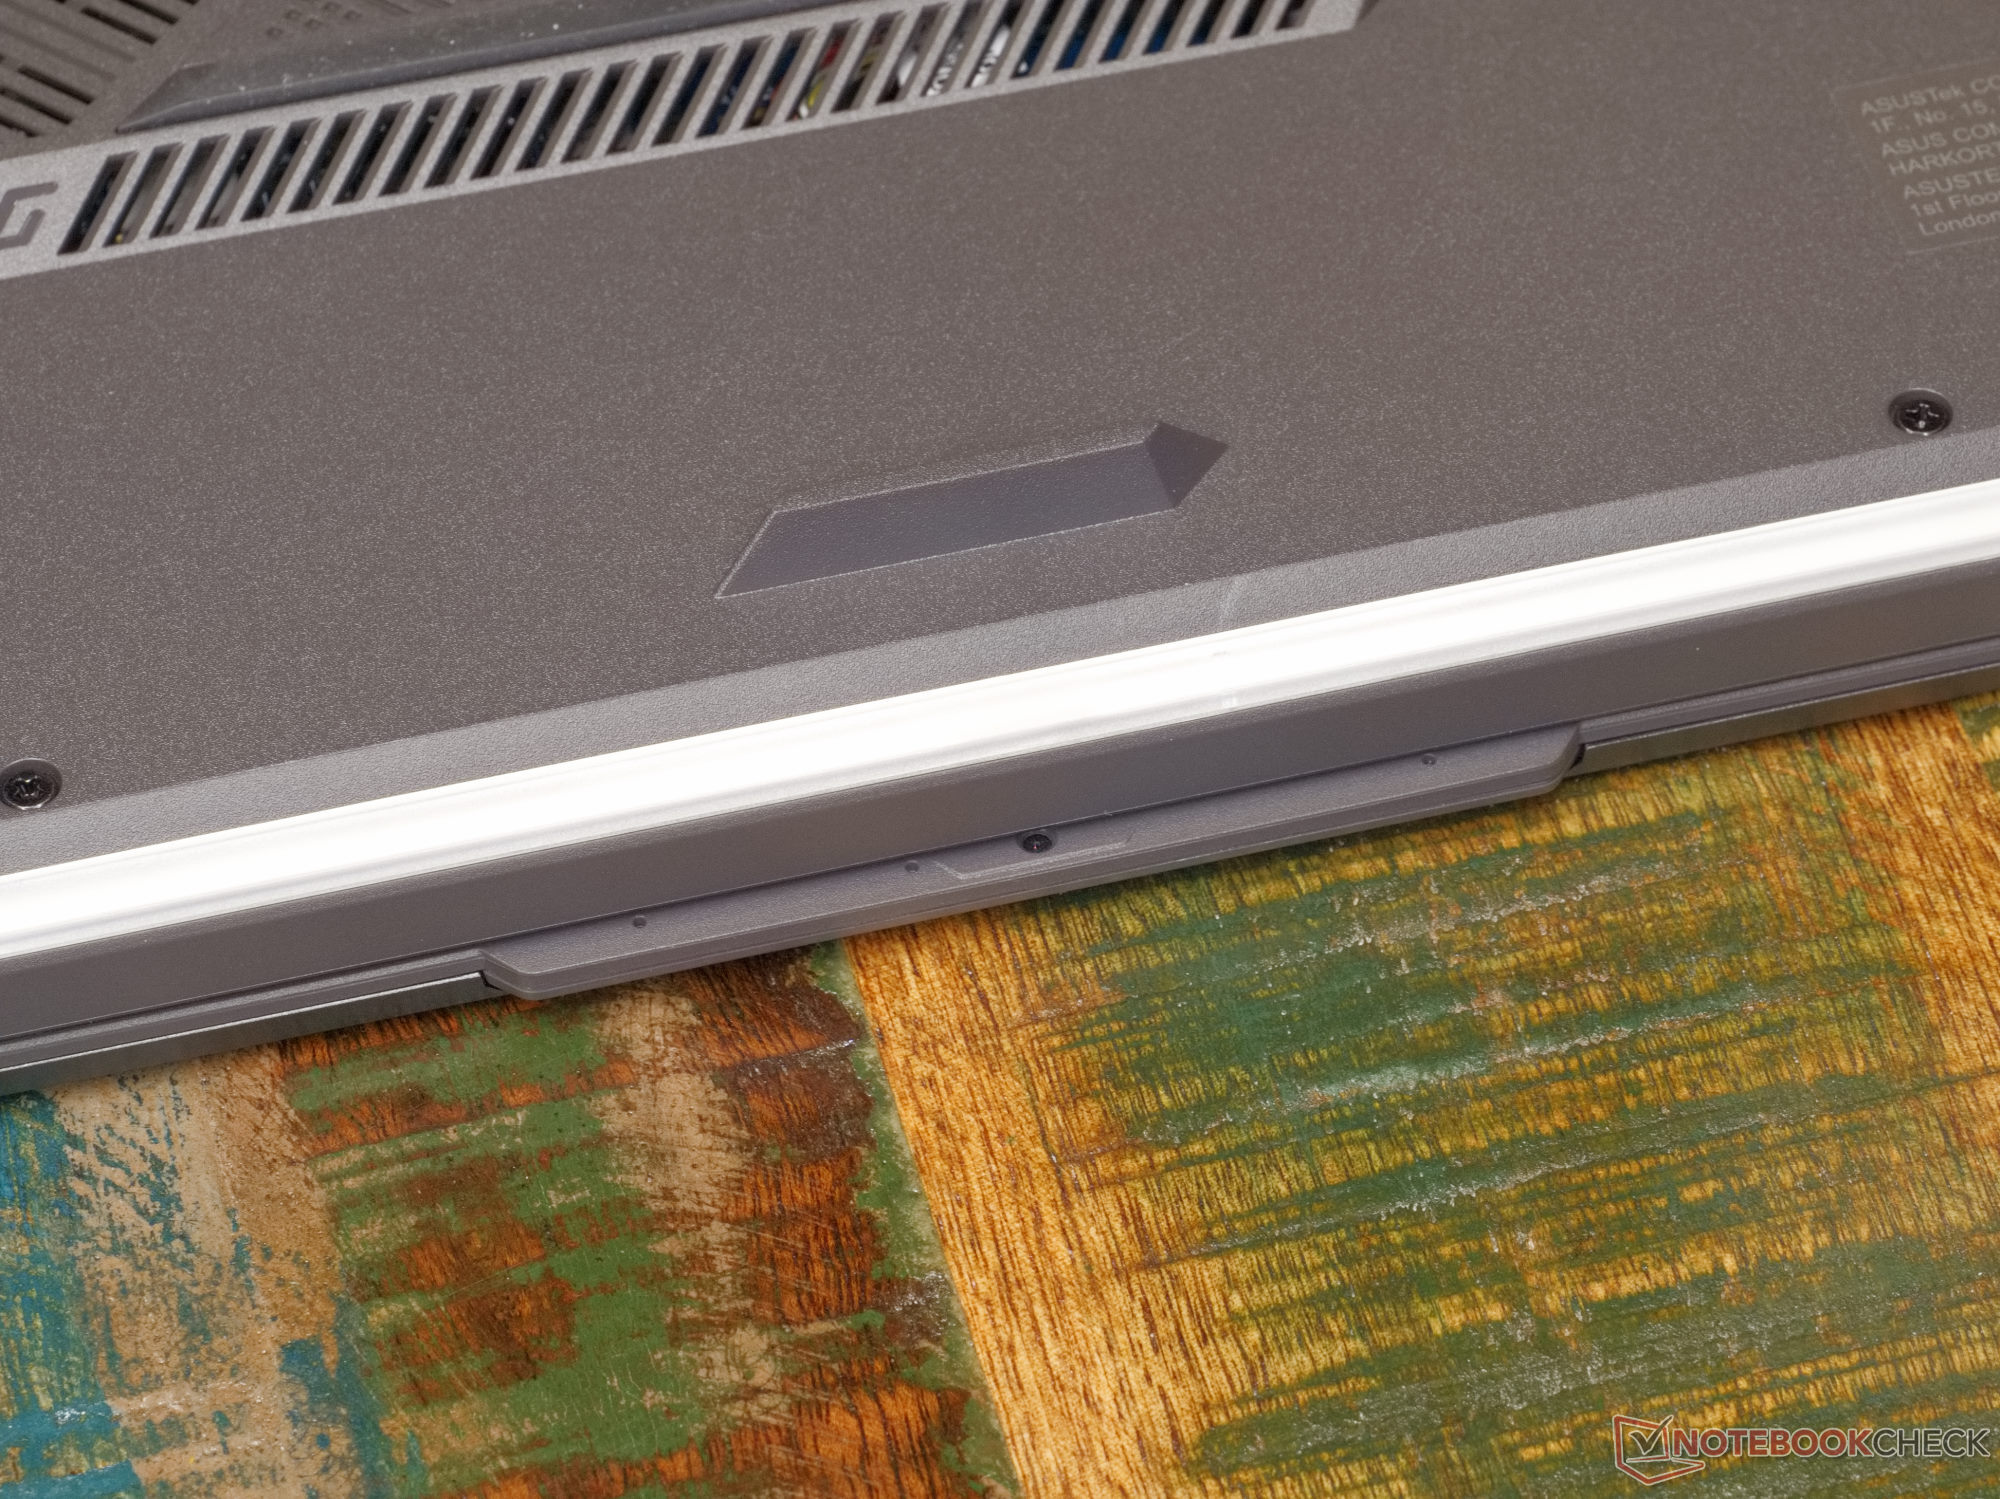
The designers of the Asus ROG Strix G16 have left no stone unturned. No component of the laptop is without design- or lettering elements. Each component is also 3D shaped in one way or another. For example, the top of the base is slightly concave towards the edge. The front and parts of the sides are furnished with RGB light strips. The keyboard is also RGB-illuminated and openly highlights the areas most important for gaming with translucent keys. Various shades of gray define the chic case. Asus has even furnished the underside, which is uninteresting in most notebooks, with various design elements, some of which are also intended to help with cooling. Compared to previous models, some ports had to be shifted away from the back of the laptop to make way for cooling, since the heat sink now runs along the entire back of the laptop. This gives the heat sink a total surface area of over 174 mm², giving the gaming notebook a very aggressive look. The 16:10 format screen can be opened up to 130° with one hand. The hinges are quite stiff, but stably hold the 16-inch (approx. 41 cm) display in every conceivable position.
Instead of unbridled design, we would have wished for better quality and workmanship of the case. Excluding the display lid, all parts are made of plastic. Many elements appear excessive and have unsightly gaps, such as the bar above the hinges. The webcam module is the worst affected, which, in addition to larger gaps, protrudes far out when closed. This makes the webcam look as if though it was slapped on as an addition after the case was manufactured. From a distance, the gaming notebook looks high quality, but shows weaknesses upon closer inspection. At the very least, the 16-incher is more stable than its 18-inch counterpart; we found the stability of the base unit of the ROG Strix G18 to be deserving of much criticism.


All current 16-inch gaming laptops are very similar in terms of size and weight. Almost all models weigh between two and three kilograms without the power supply unit. In the case of our test device, the power supply unit adds almost one kilogram to the scales, so you have to lug around a laptop weighing around 3.3 kilograms. Only the Gigabyte AERO 16 is significantly slimmer than the other 16-inchers in our database.
Equipment - Thunderbolt 4 and fast Wi-Fi 6E
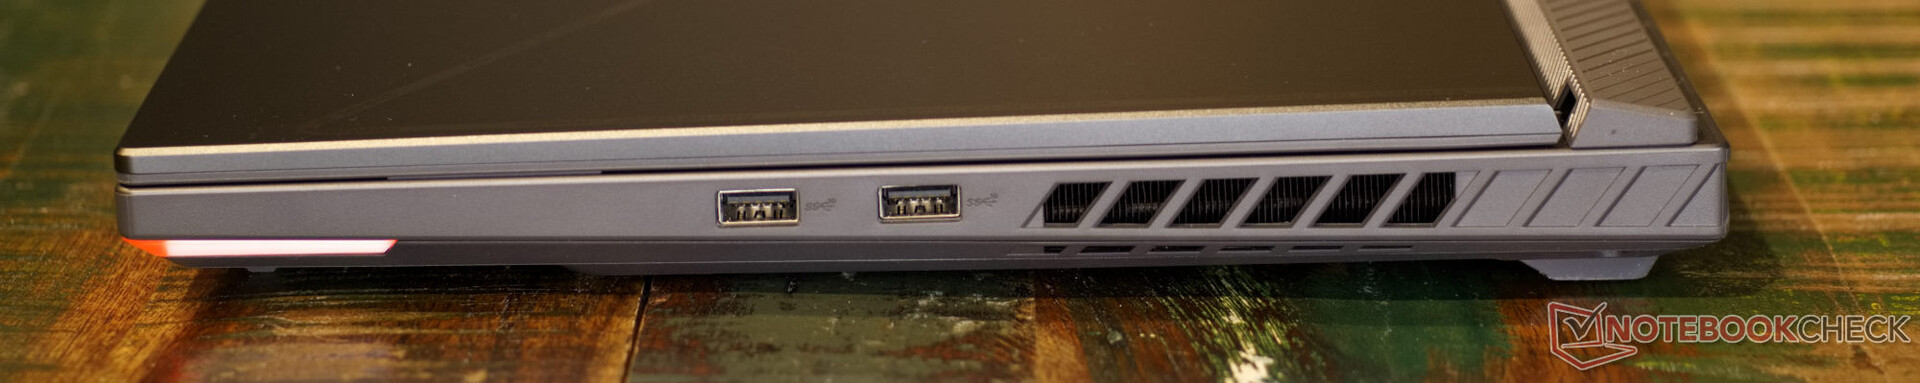
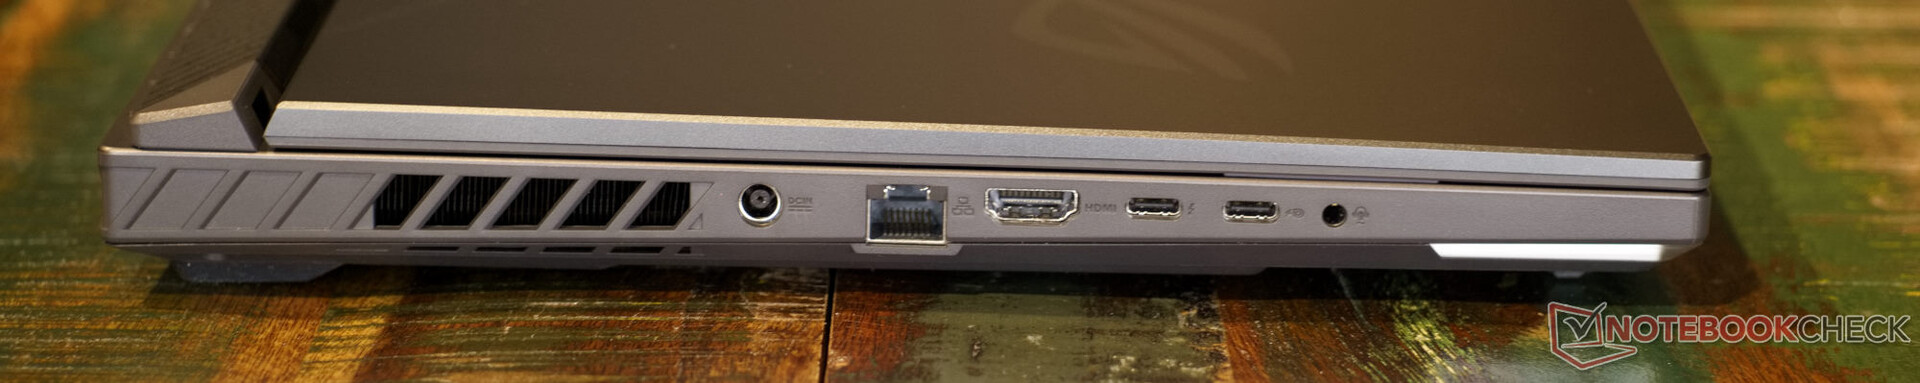
The majority of the ROG Strix G16's ports are concentrated on the left side of the notebook. On the right, there are only two USB ports. The two USB Type-C sockets on the left share their tasks: the rear supports Thunderbolt 4 and the front Power Delivery, while both support DisplayPort. The power supply via USB-C is quite limited. The laptop requires 20 volts of power output and draws a maximum of 100 watts. Hence the full performance of the laptop cannot be accessed via USB-C Power Delivery.
Communication
Intel's Wi-Fi 6E AX211 module ensures fast connections between the local network and the Asus gaming laptop and is thus state of the art. Upload and download connection speeds are slightly above average, but we've seen even stronger results with Intel's WLAN-ax module.
Webcam
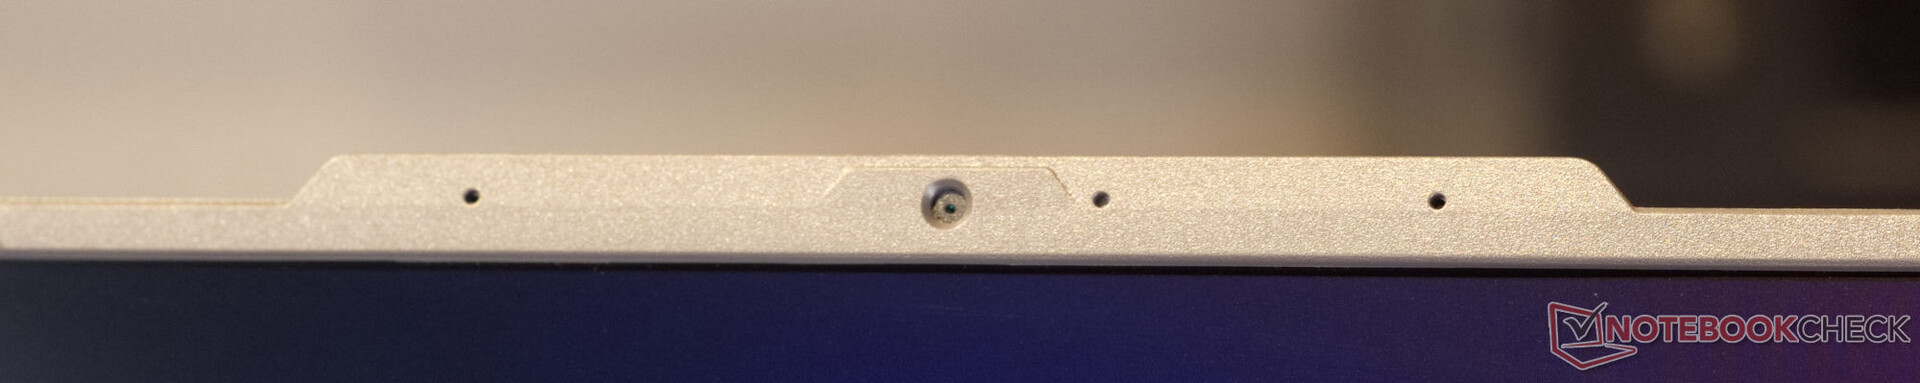
Possessing the image quality of a pinhole camera, the 720p webcam of this laptop does not perform well. Only in good lighting are the pictures somewhat usable. Otherwise the noise suppression swallows up all details. Details are also very blurry towards the edges. At least the three microphones next to the webcam deliver fairly good sound.


Security
No fingerprint scanner or other security features are to be found here. Only the security measures of the Intel Core i9, such as TPM 2.0, are available.
Accessories
The gaming laptop does not come with much more than a 330-watt power supply and some paperwork. Asus largely dispenses with plastic for the packaging, only wrapping the laptop in a protective film.
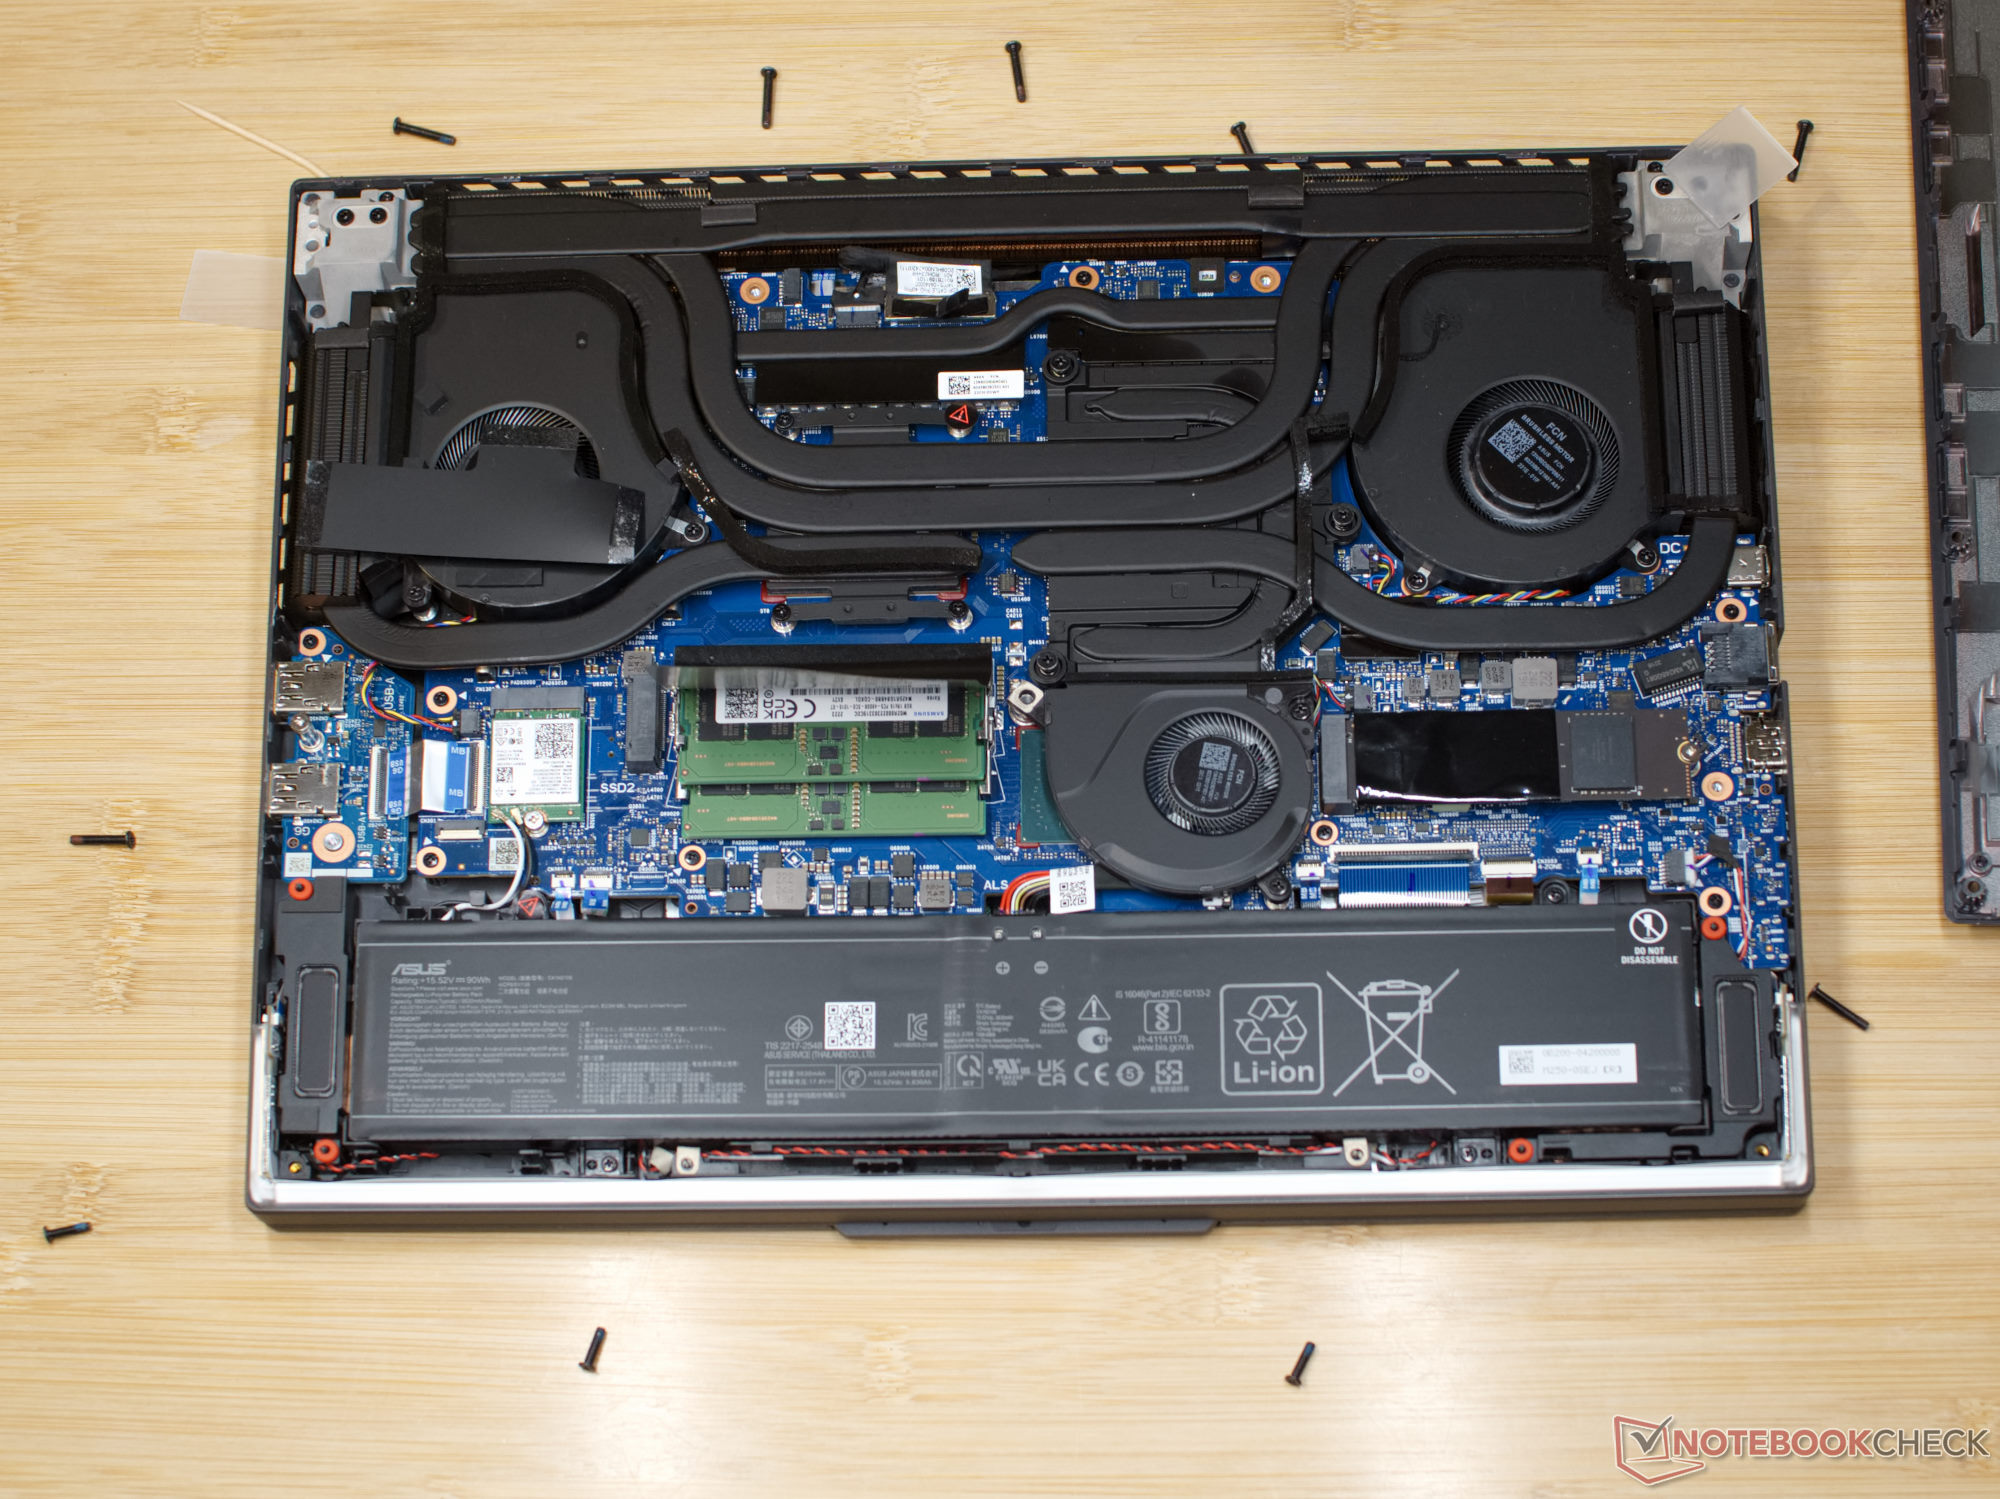
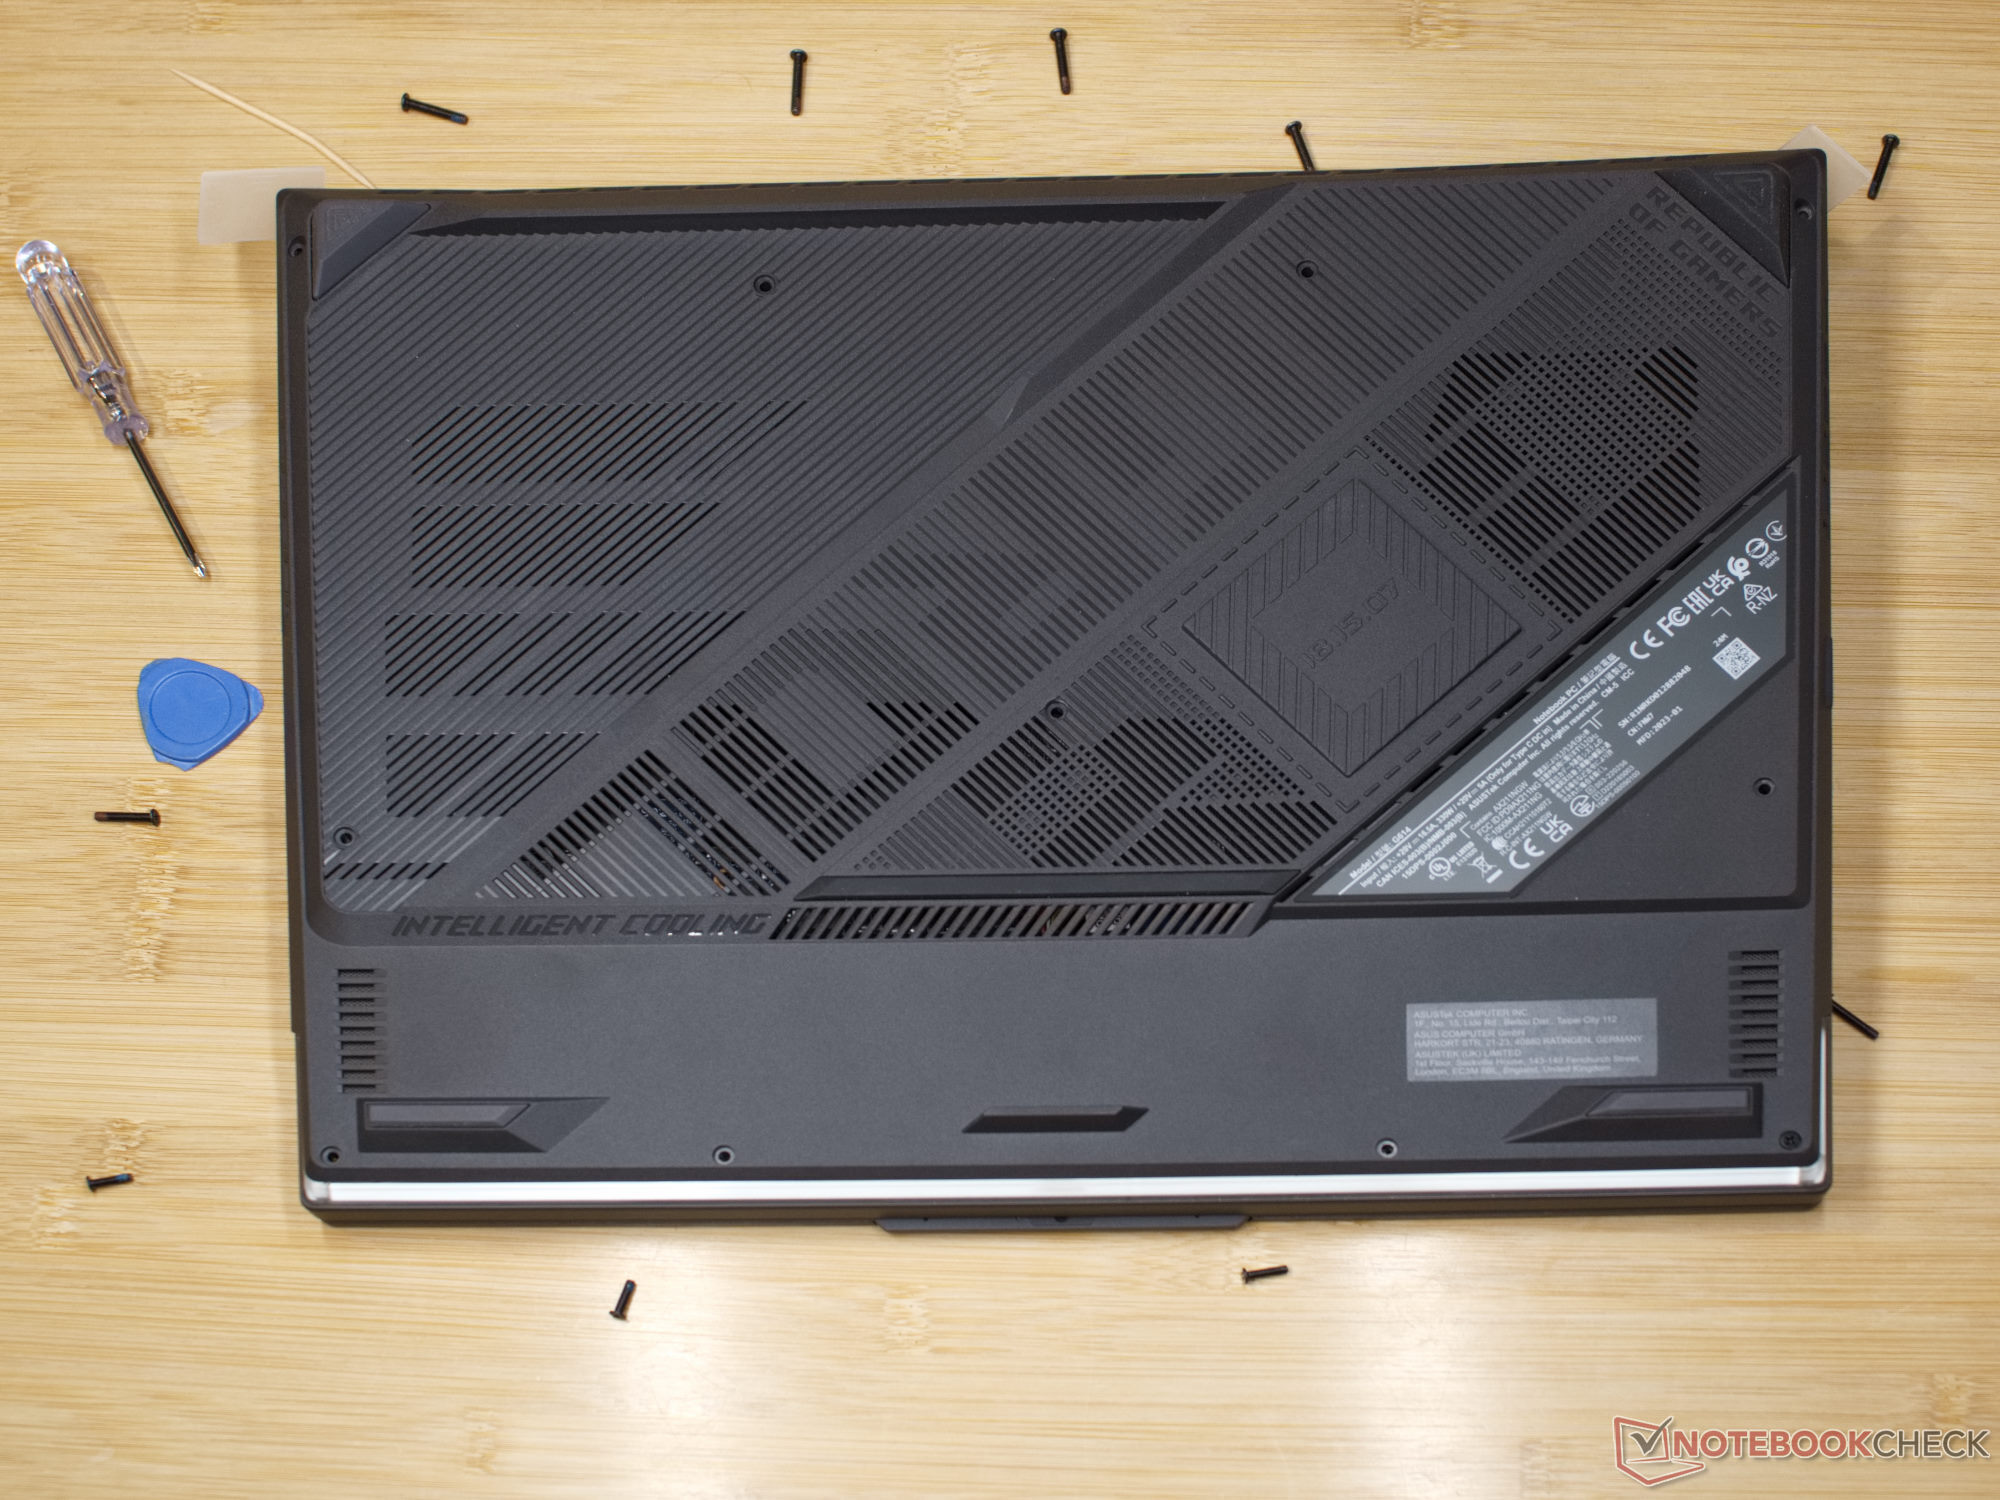
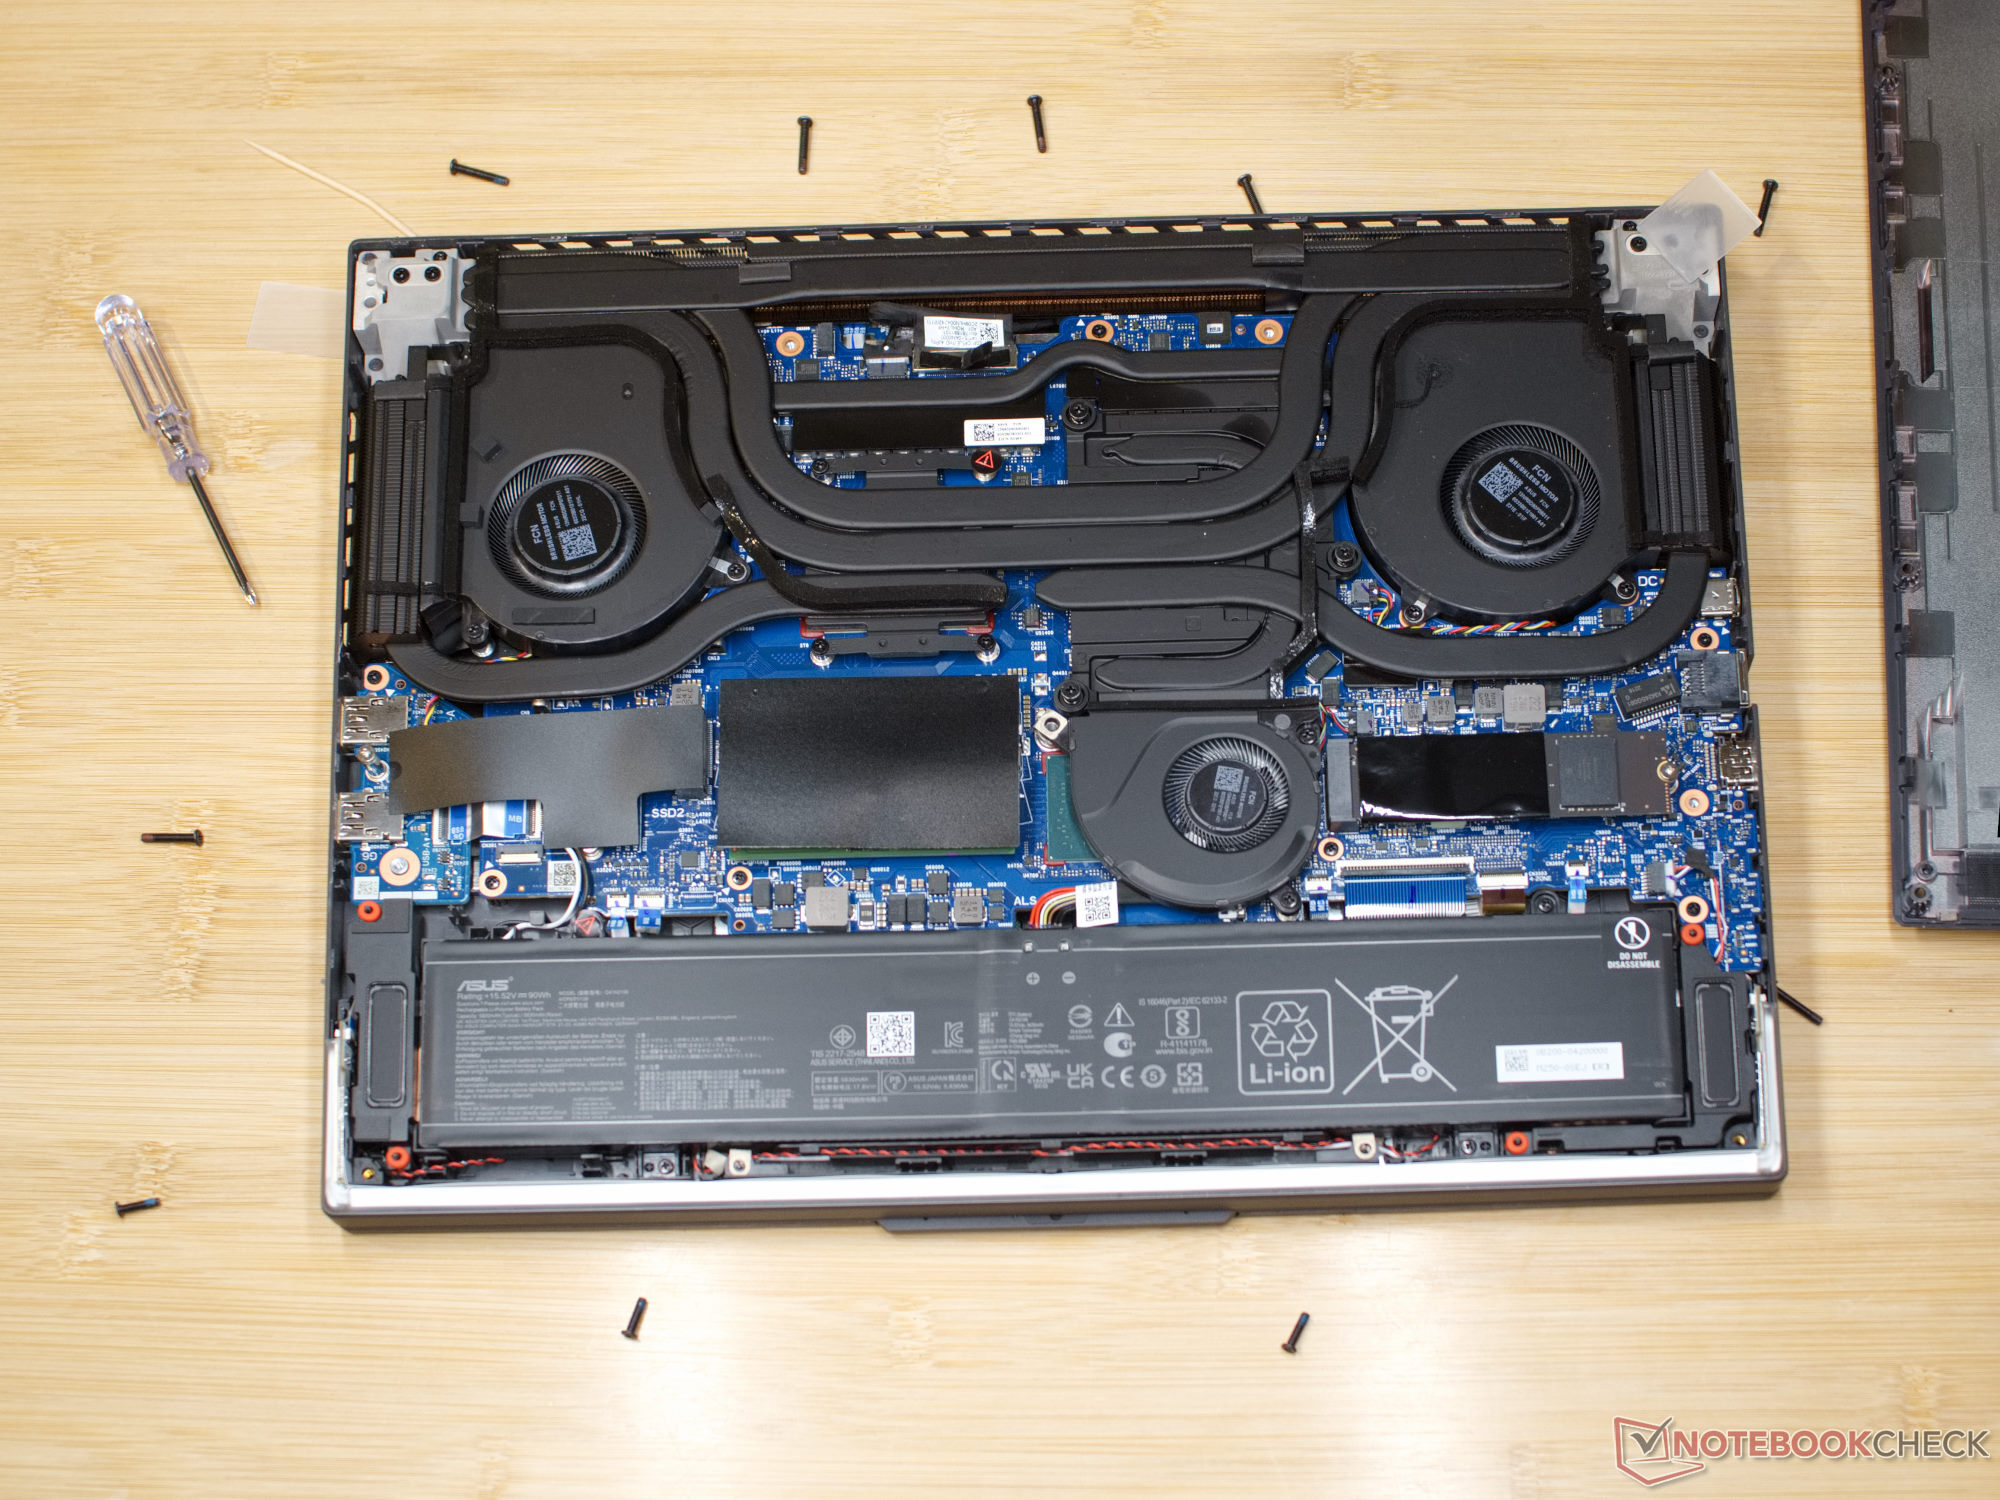
Maintenance
Eleven PH1 screws hold the baseplate of the gaming notebook in place. We recommend working your way from the back of the notebook to the front and loosening the screw on the front right last. This is because it has a locking ring that ensures that part of the cover is lifted and so provides easy access for a plastic opening tool. Several clips hold the lid in place. The tool is used to open the bottom all around. More detailed information on how to open the laptop and which components can be replaced is provided in Asus' maintenance manual.
Inside the laptop we encounter a fairly maintenance-friendly device. We find two RAM slots (both occupied), two M.2 slots (one occupied) and the replaceable WLAN module. The 90Wh battery is also easy to replace, as it is not glued.
Warranty
Asus offers a two-year warranty on the ROG Strix G16 in Europe. This may differ in other regions, so interested buyers should double check before purchase.
Input Devices - Good keyboard, but not mechanical
Keyboard
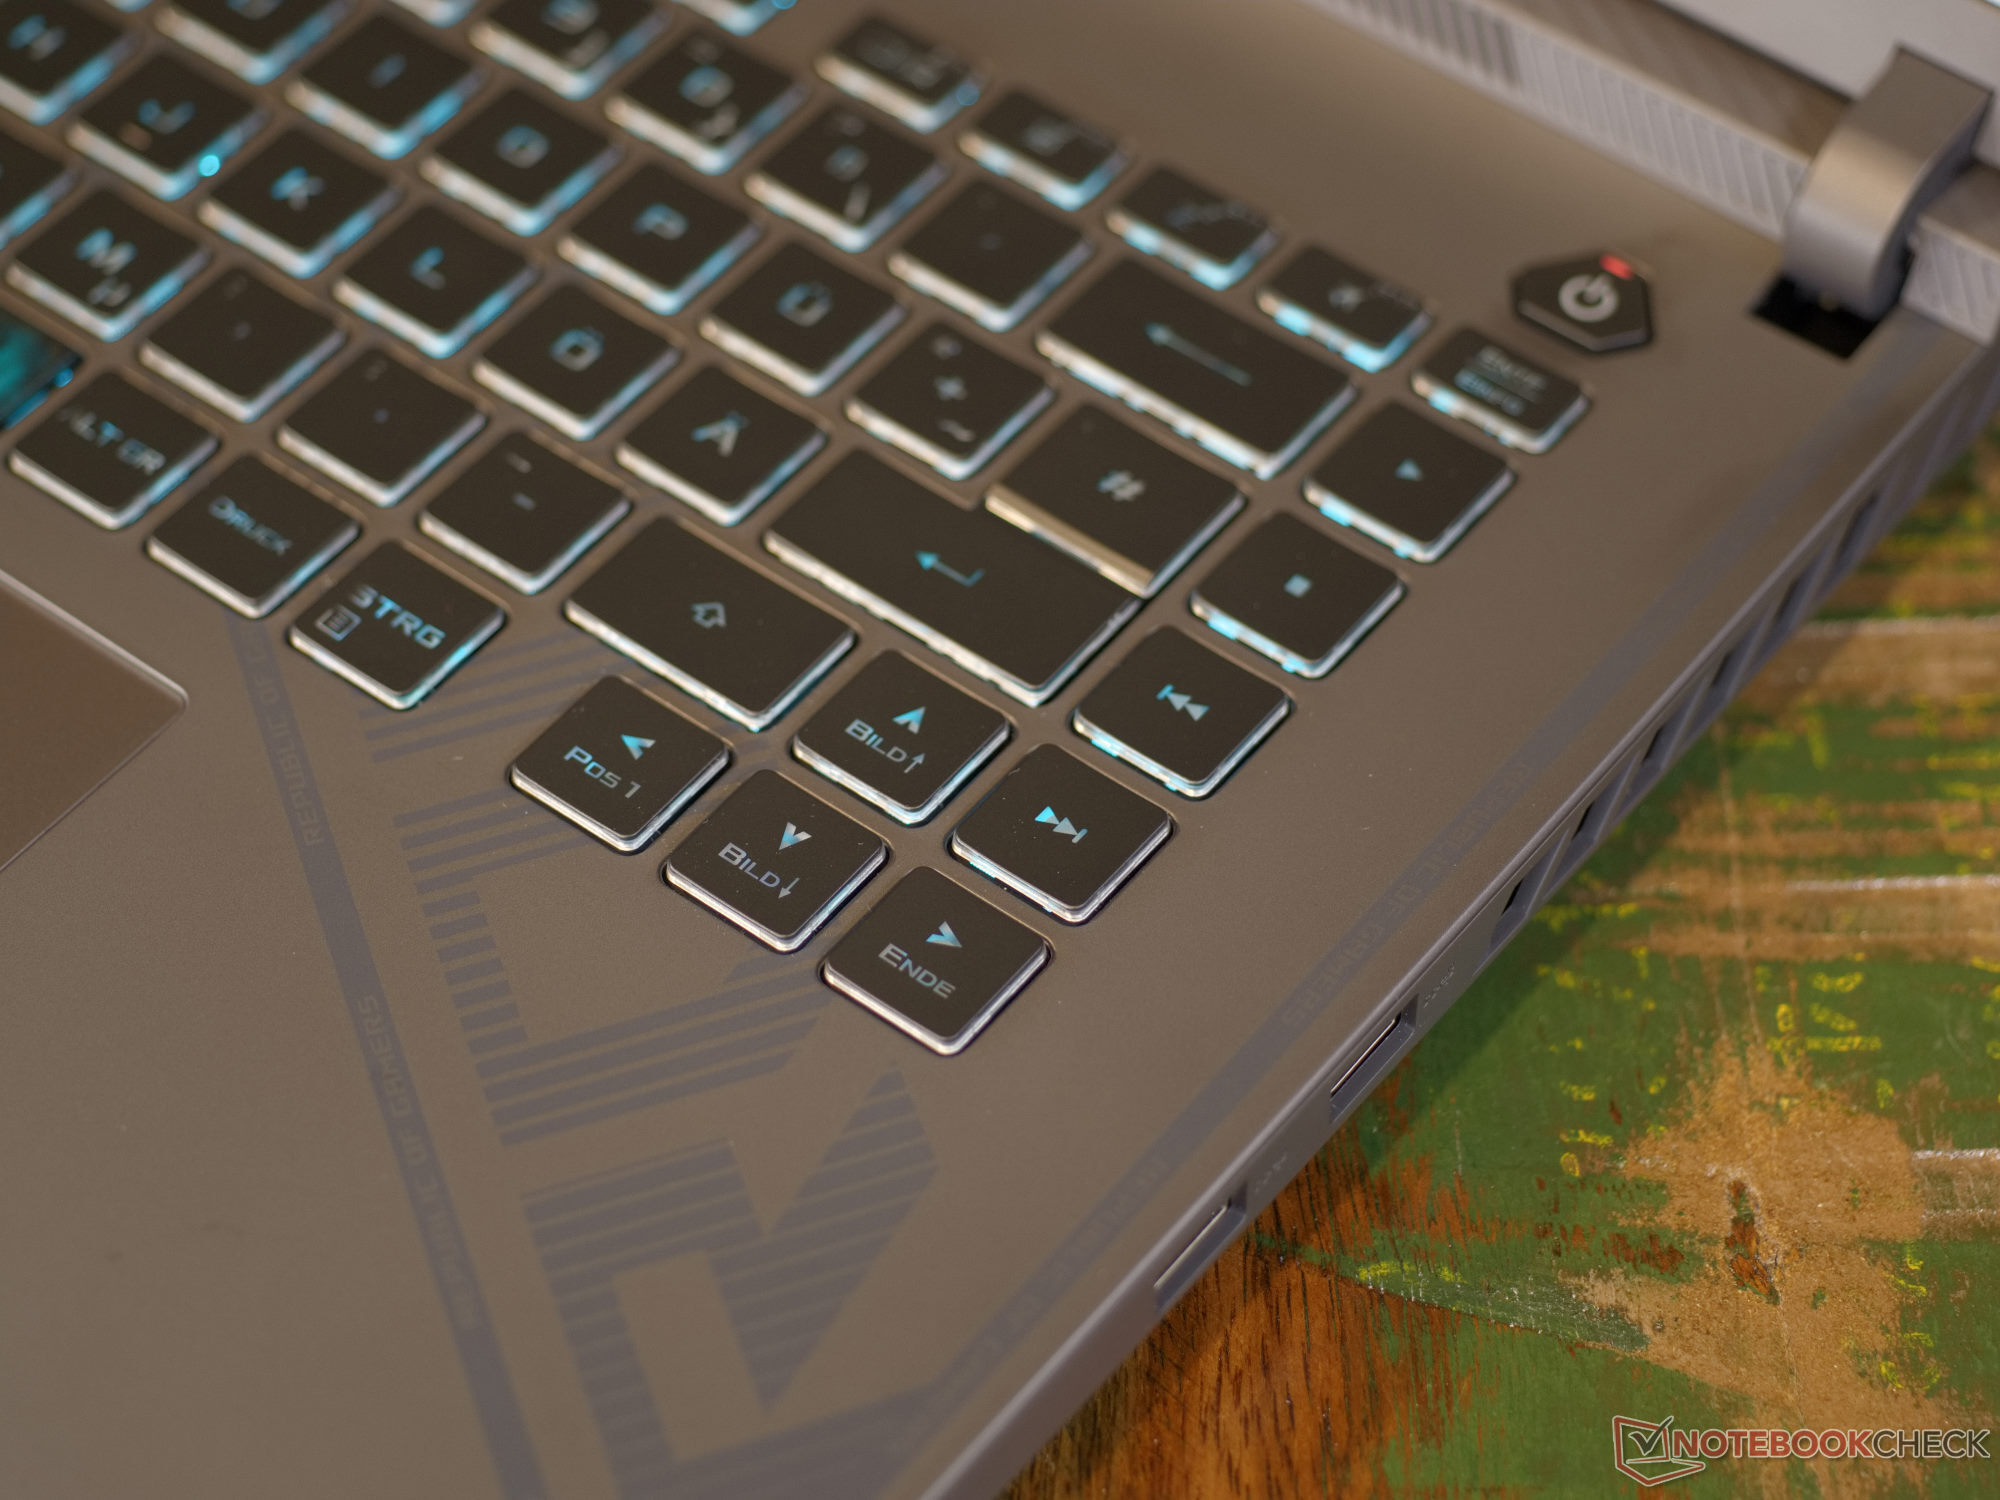
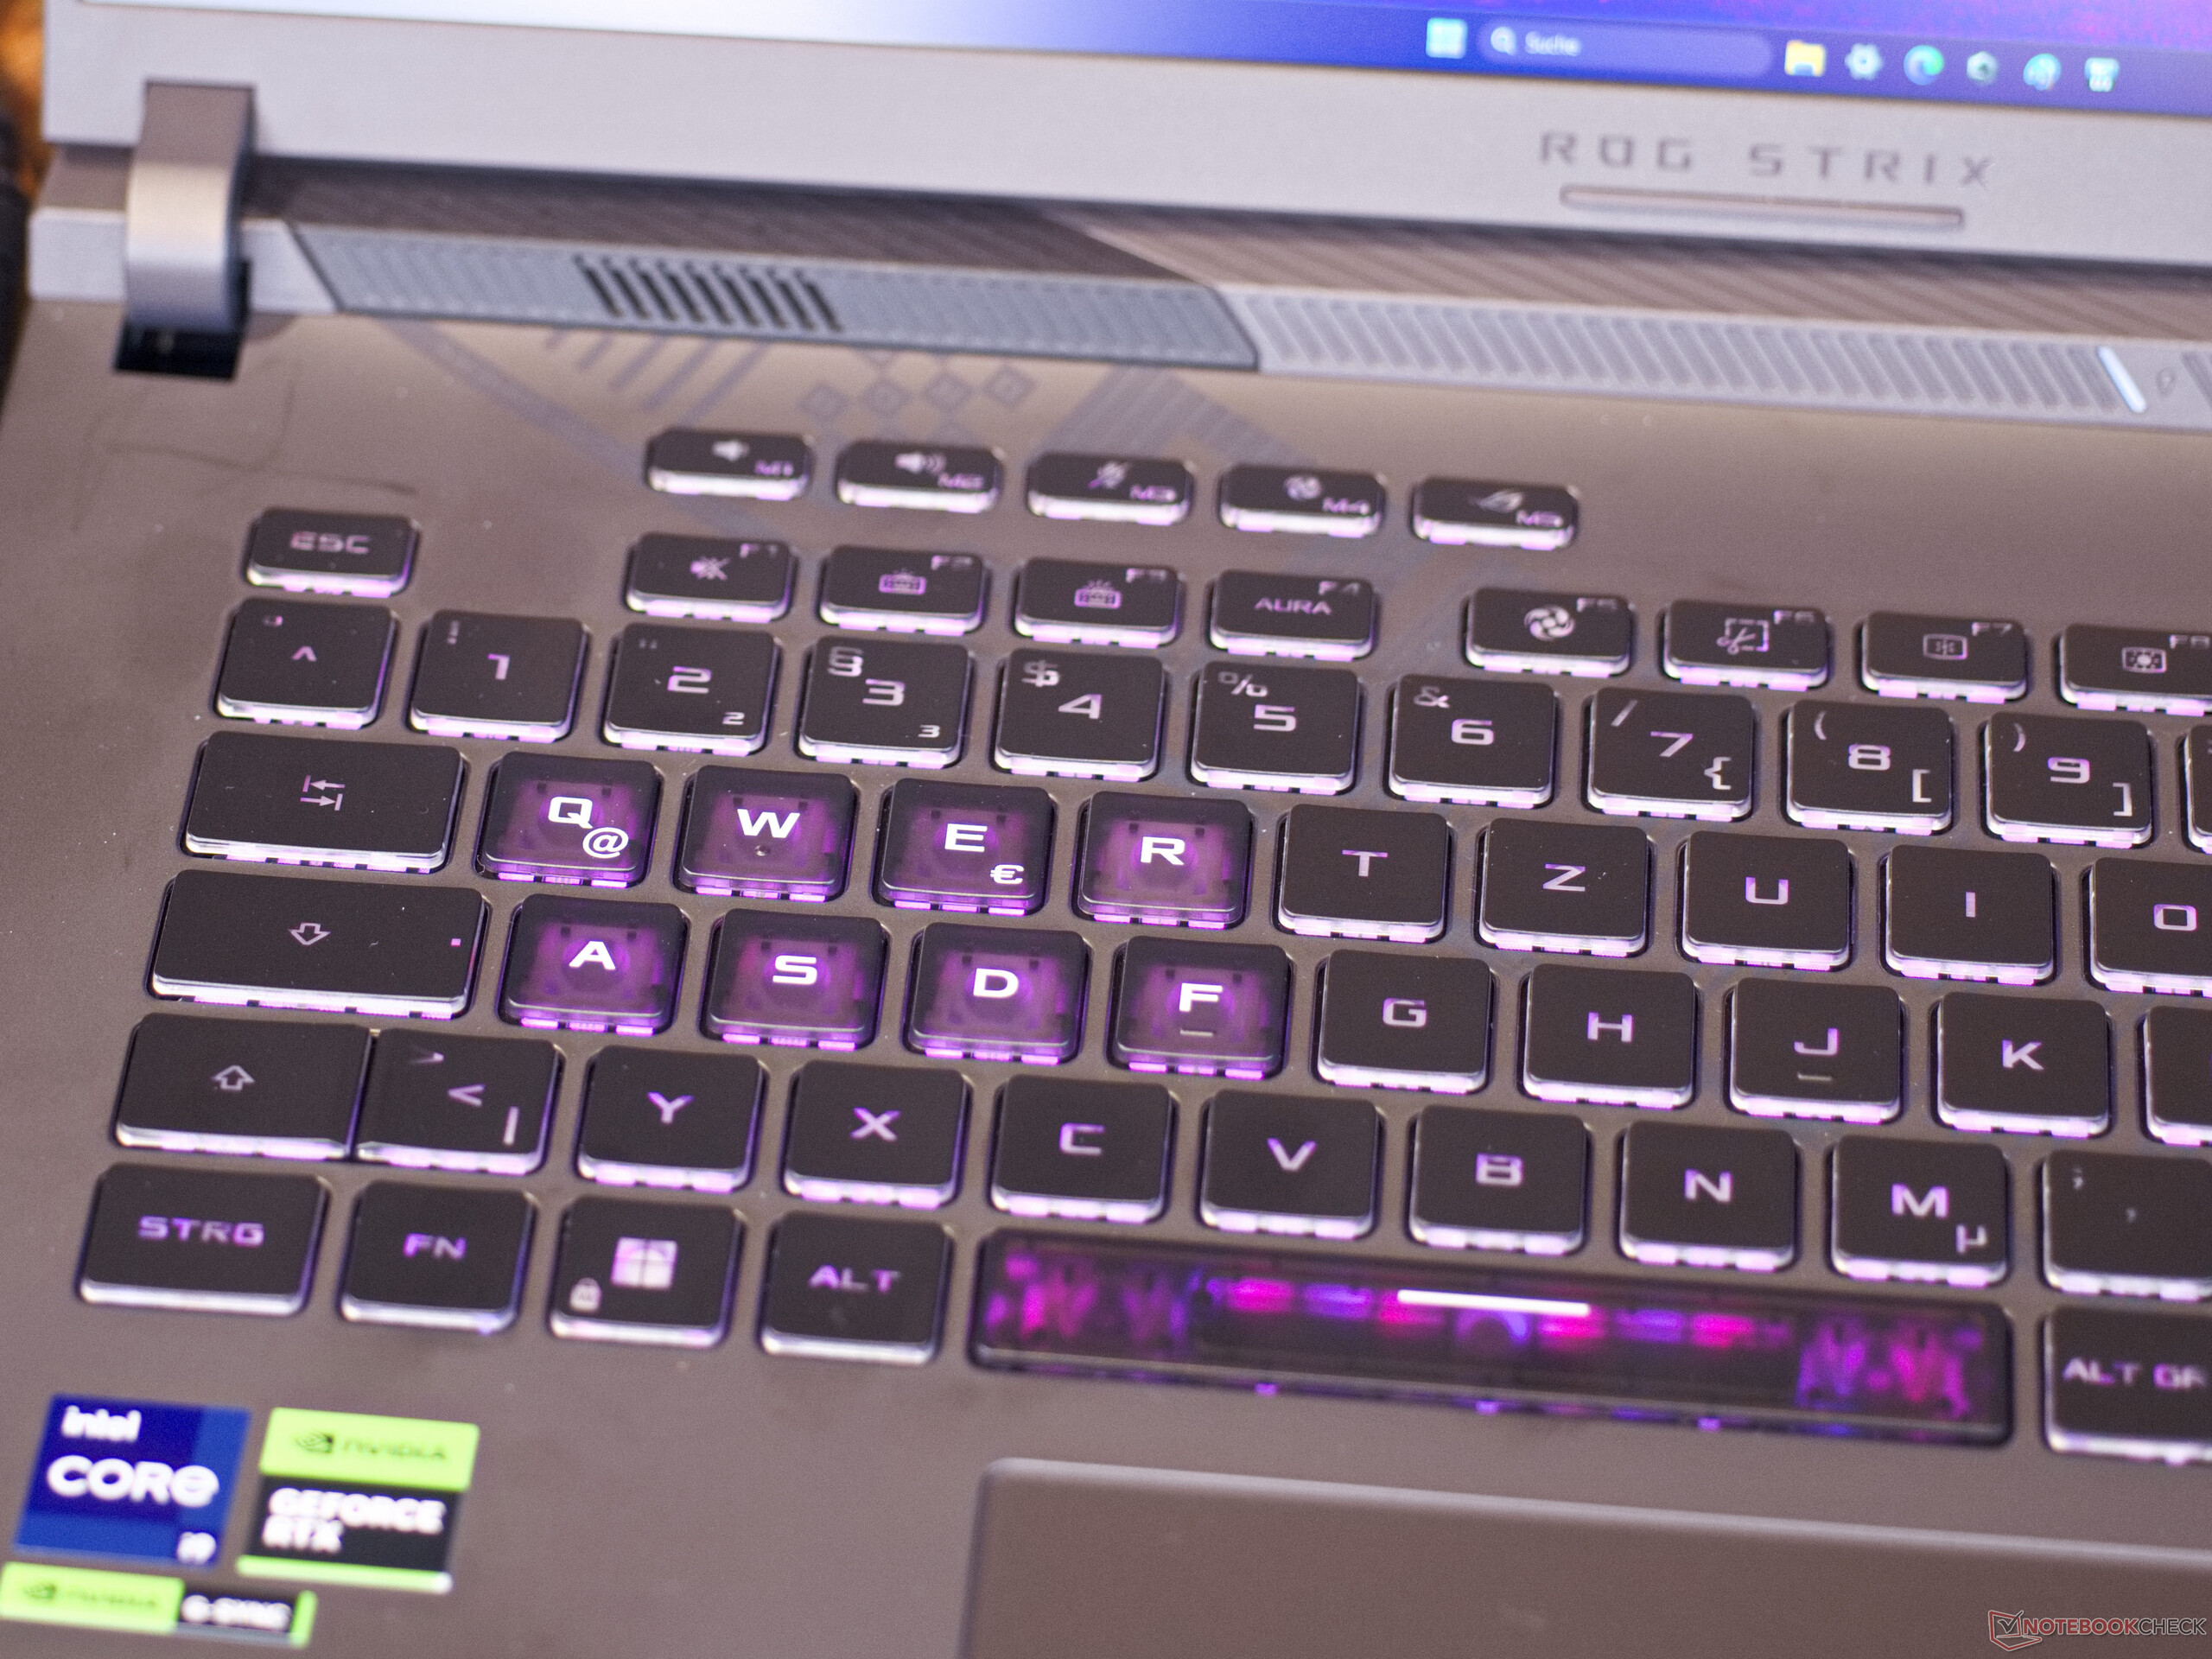
The ROG Strix G16 is equipped with a chiclet keyboard, which nevertheless provides a pleasant typing feel due to its 1.9 mm key travel and decent haptic feedback. The keyboard design is typical for gaming laptops, with RBG lighting installed. In addition, the keys most important for gaming are highlighted. All buttons have been designed as full-size keys, which means that the arrow keys on the right side are rather cramped. In the heat of the moment, you could easily hit the wrong key here. The laptop itself would have had enough space for shifting the arrow keys down a little. When typing texts, however, you have to get used to the shortened shift key
Above the function keys are five more keys that can be assigned various macros. However, the macro keys are very far from the palm rest. Depending on the size of your hand, they are difficult to reach without changing the position of your hand.
Touchpad
At 13 × 8.5 cm, the gaming notebook's clickpad is pleasantly large and positioned in such a way that it shouldn't interfere with keyboard operation. Thanks to its glass surface, it should retain its silky matte texture for a long time. This has a pleasant feel and good gliding properties. The clickpad itself responds quickly and precisely to all inputs, right up to the corners.

Display - Responsive QHD+ in 16:10 format
The IPS display offers QHD+ resolution in 16:10 format and a refresh rate of 240 Hz. However, the panel does not achieve the advertised response time of 3 ms; in some cases, the value even doubles. The brightness is also not quite as high as the 500 cd/m² that Asus promises in the data sheet. Overall, we still have a solid display with a matte surface and high DisplayP3 color space coverage. No visible illumination errors were detected here.
But there is one thing that may prove a nuisance when gamng. The Asus ROG Strix G16's status LEDs are located directly below the screen, of which the storage device LED blinks quite frequently during gaming and is distracting, especially during action-packed games. For an immersive gaming experience, the only thing that can help is a strip of black tape.
| |||||||||||||||||||||||||
Brightness Distribution: 93 %
Center on Battery: 470 cd/m²
Contrast: 1119:1 (Black: 0.42 cd/m²)
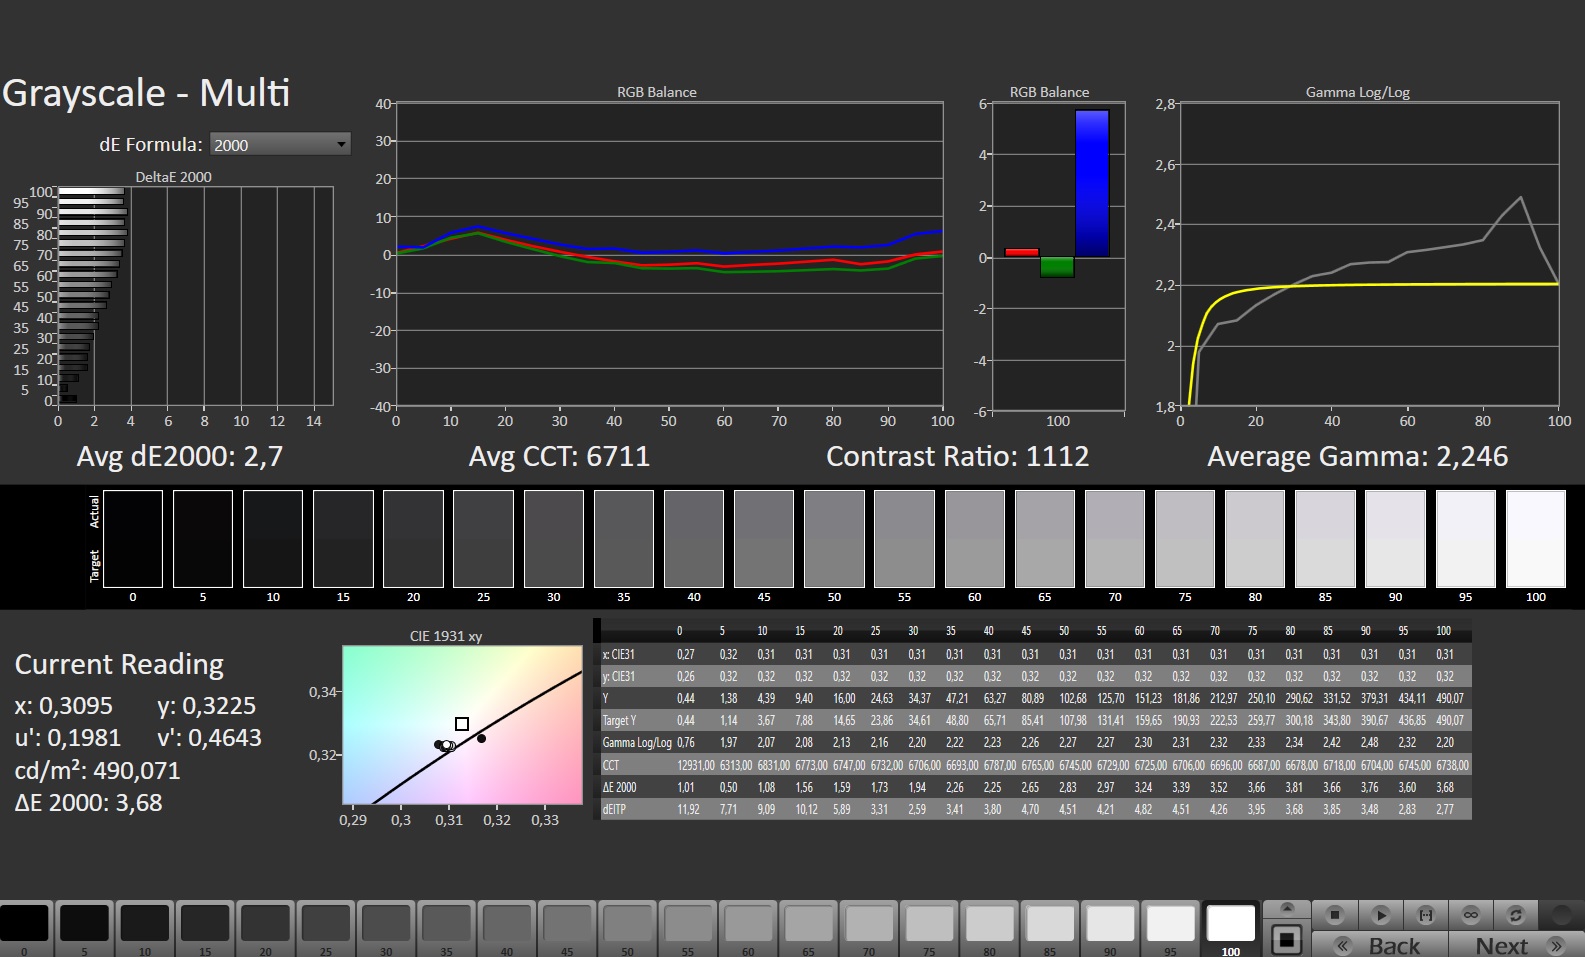
ΔE Color 1.86 | 0.5-29.43 Ø5, calibrated: 0.93
ΔE Greyscale 2.7 | 0.57-98 Ø5.3
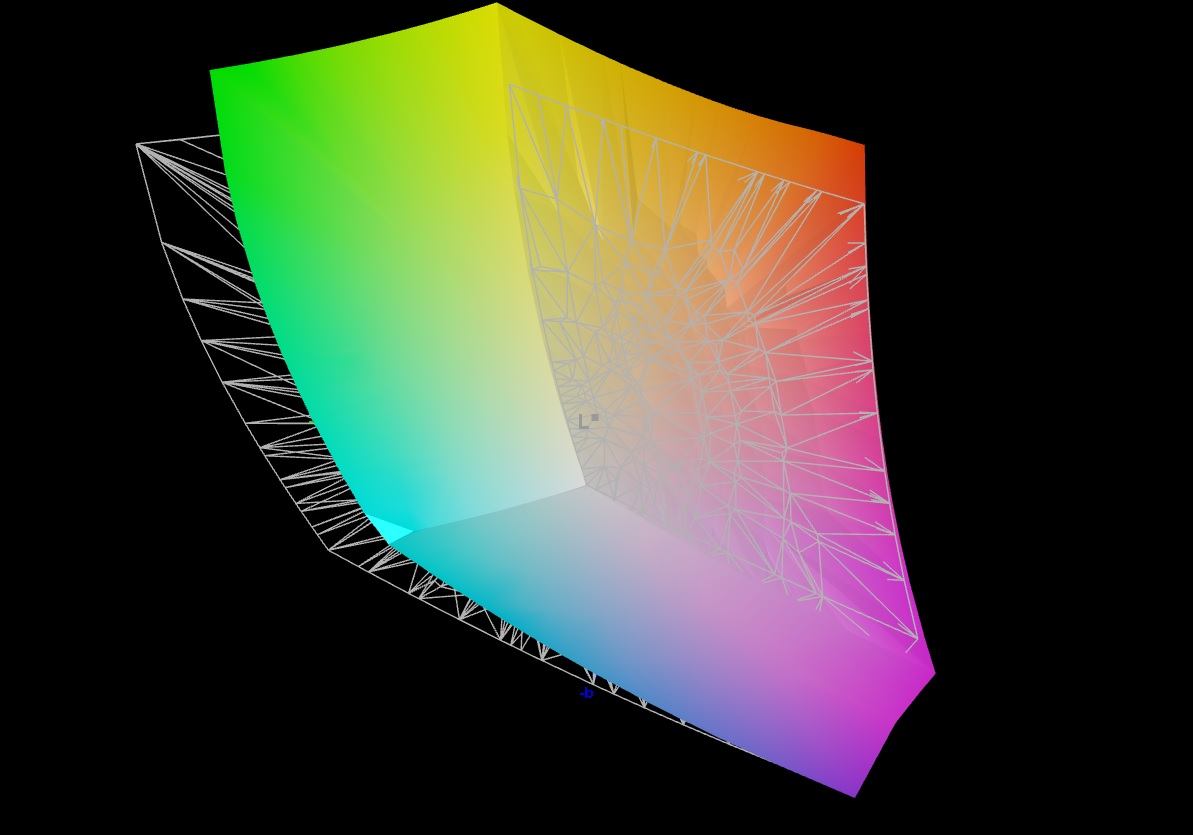
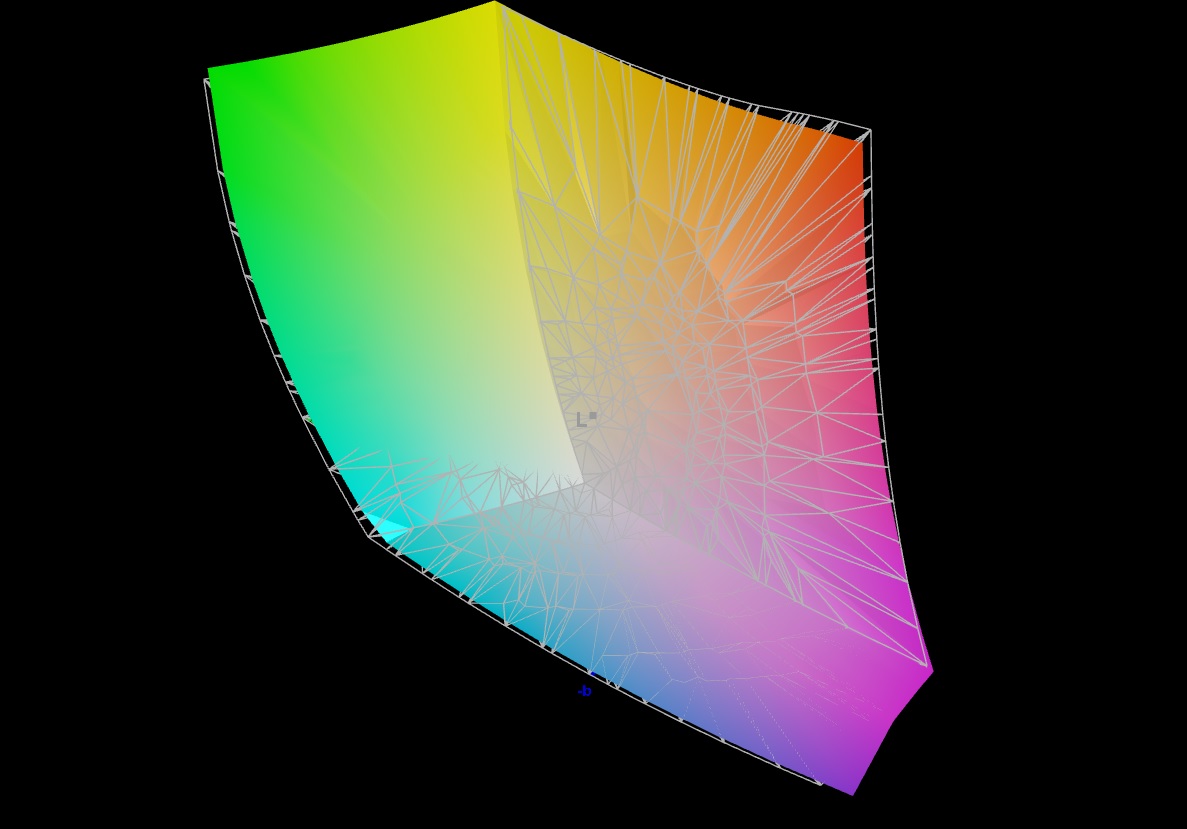
84.9% AdobeRGB 1998 (Argyll 2.2.0 3D)
99.9% sRGB (Argyll 2.2.0 3D)
97% Display P3 (Argyll 2.2.0 3D)
Gamma: 2.246
| Asus ROG Strix G16 G614JZ TL160ADMP03-0, IPS, 2560x1600, 16.00 | Asus Zephyrus Duo 16 GX650PY-NM006W NE160QDM-NM4, MiniLED, 2560x1600, 16.00 | Lenovo Legion Pro 7 16IRX8H MNG007DA2-3 (CSO1628), IPS, 2560x1600, 16.00 | Gigabyte AERO 16 OLED BSF Samsung SDC4191 (ATNA60YV09-0, OLED, 3840x2400, 16.00 | Asus TUF Gaming A16 FA617 NE160WUM-NX2 (BOE0B33), IPS-Level, 1920x1200, 16.00 | Razer Blade 16 Early 2023 CSOT T3 MNG007DA4-1, IPS, 2560x1600, 16.00 | |
|---|---|---|---|---|---|---|
| Display | 3% | -15% | 6% | -15% | 3% | |
| Display P3 Coverage | 97 | 99.4 2% | 69.1 -29% | 99.9 3% | 69.4 -28% | 98.5 2% |
| sRGB Coverage | 99.9 | 100 0% | 99.7 0% | 100 0% | 97.8 -2% | 100 0% |
| AdobeRGB 1998 Coverage | 84.9 | 90.8 7% | 71.2 -16% | 96.4 14% | 70.9 -16% | 89.7 6% |
| Response Times | -193% | -65% | 66% | -143% | -56% | |
| Response Time Grey 50% / Grey 80% * | 5.1 ? | 15.2 ? -198% | 12.3 ? -141% | 2 ? 61% | 17 ? -233% | 6.6 ? -29% |
| Response Time Black / White * | 6.6 ? | 19 ? -188% | 5.9 ? 11% | 1.98 ? 70% | 10.1 ? -53% | 12 ? -82% |
| PWM Frequency | 12000 ? | 60 | ||||
| Screen | 108% | 22% | 117% | 5% | -13% | |
| Brightness middle | 470 | 712 51% | 511 9% | 389.97 -17% | 308 -34% | 456.8 -3% |
| Brightness | 459 | 703 53% | 469 2% | 395 -14% | 293 -36% | 437 -5% |
| Brightness Distribution | 93 | 95 2% | 86 -8% | 97 4% | 90 -3% | 83 -11% |
| Black Level * | 0.42 | 0.07 83% | 0.4 5% | 0.03 93% | 0.23 45% | 0.35 17% |
| Contrast | 1119 | 10171 809% | 1278 14% | 12999 1062% | 1339 20% | 1305 17% |
| Colorchecker dE 2000 * | 1.86 | 1.7 9% | 0.95 49% | 2 -8% | 1.47 21% | 3.7 -99% |
| Colorchecker dE 2000 max. * | 3.87 | 4 -3% | 2.07 47% | 4.1 -6% | 2.98 23% | 6.42 -66% |
| Colorchecker dE 2000 calibrated * | 0.93 | 1.2 -29% | 0.91 2% | 1.68 -81% | 1.02 -10% | 0.66 29% |
| Greyscale dE 2000 * | 2.7 | 2.8 -4% | 0.6 78% | 2.23 17% | 2.2 19% | 2.6 4% |
| Gamma | 2.246 98% | 2.21 100% | 2.176 101% | 2.41 91% | 2.228 99% | 2.3 96% |
| CCT | 6711 97% | 6978 93% | 6545 99% | 6323 103% | 6228 104% | 6108 106% |
| Total Average (Program / Settings) | -27% /
42% | -19% /
2% | 63% /
86% | -51% /
-21% | -22% /
-16% |
* ... smaller is better
The Asus ROG Strix G16 comes with a well-calibrated display ex-factory. None of the average color deviations are above an ΔΕ2000 of 2. With our ICC profile from the info box, the color deviations drop well below an ΔΕ2000 of 1, but the maximum values remain almost unchanged just above an ΔΕ2000 of 3.
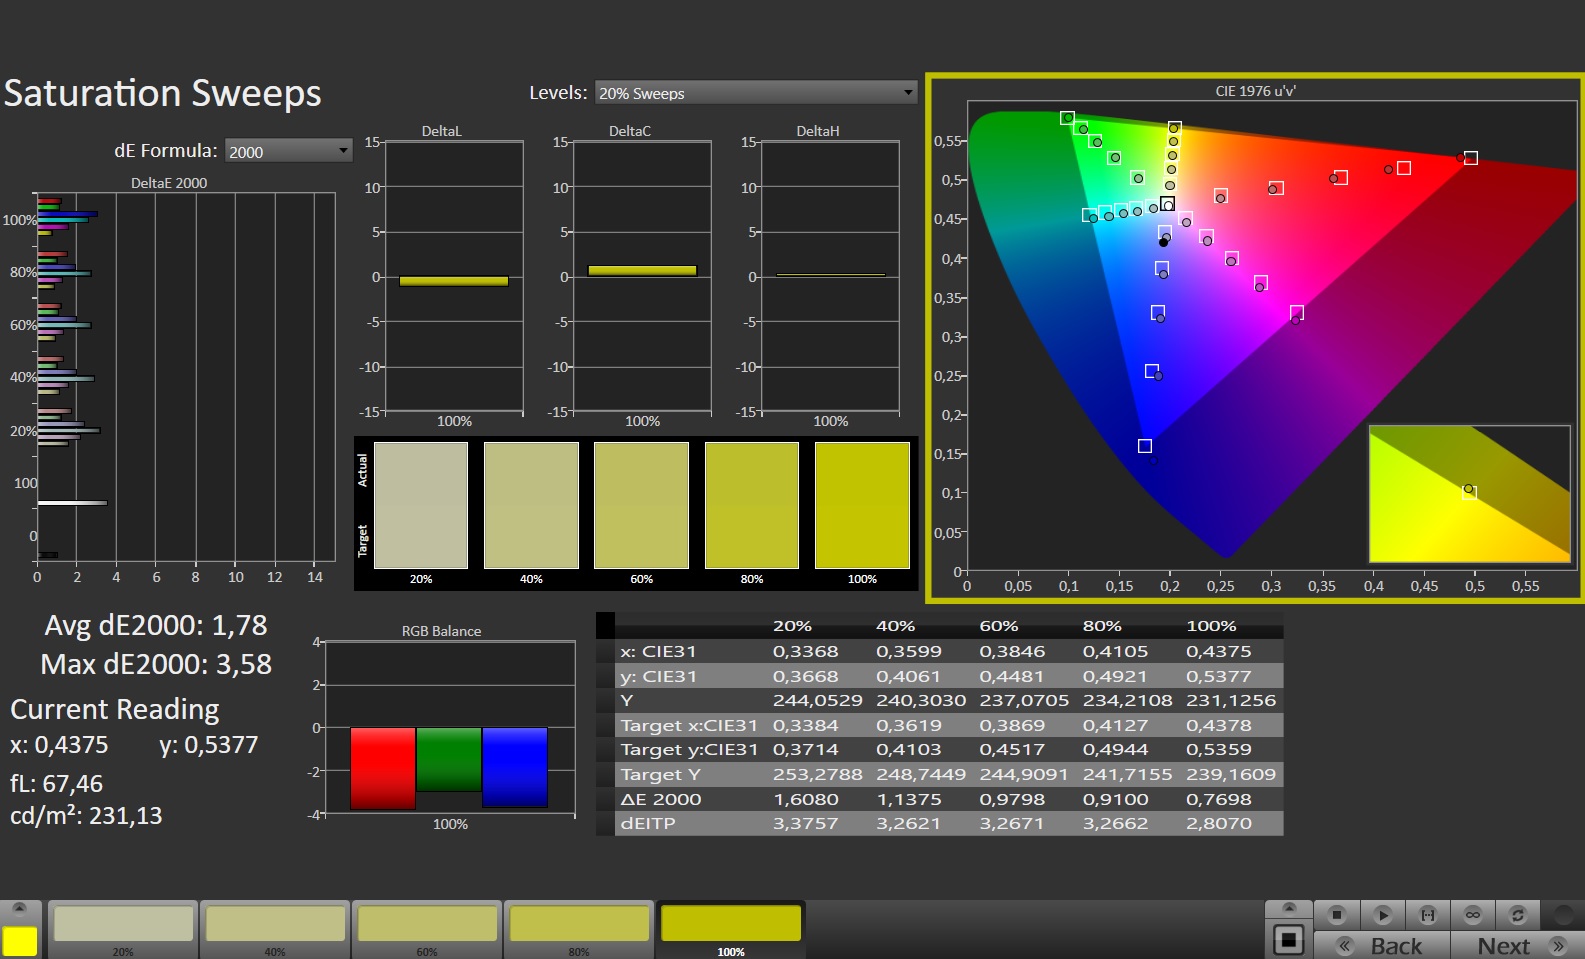

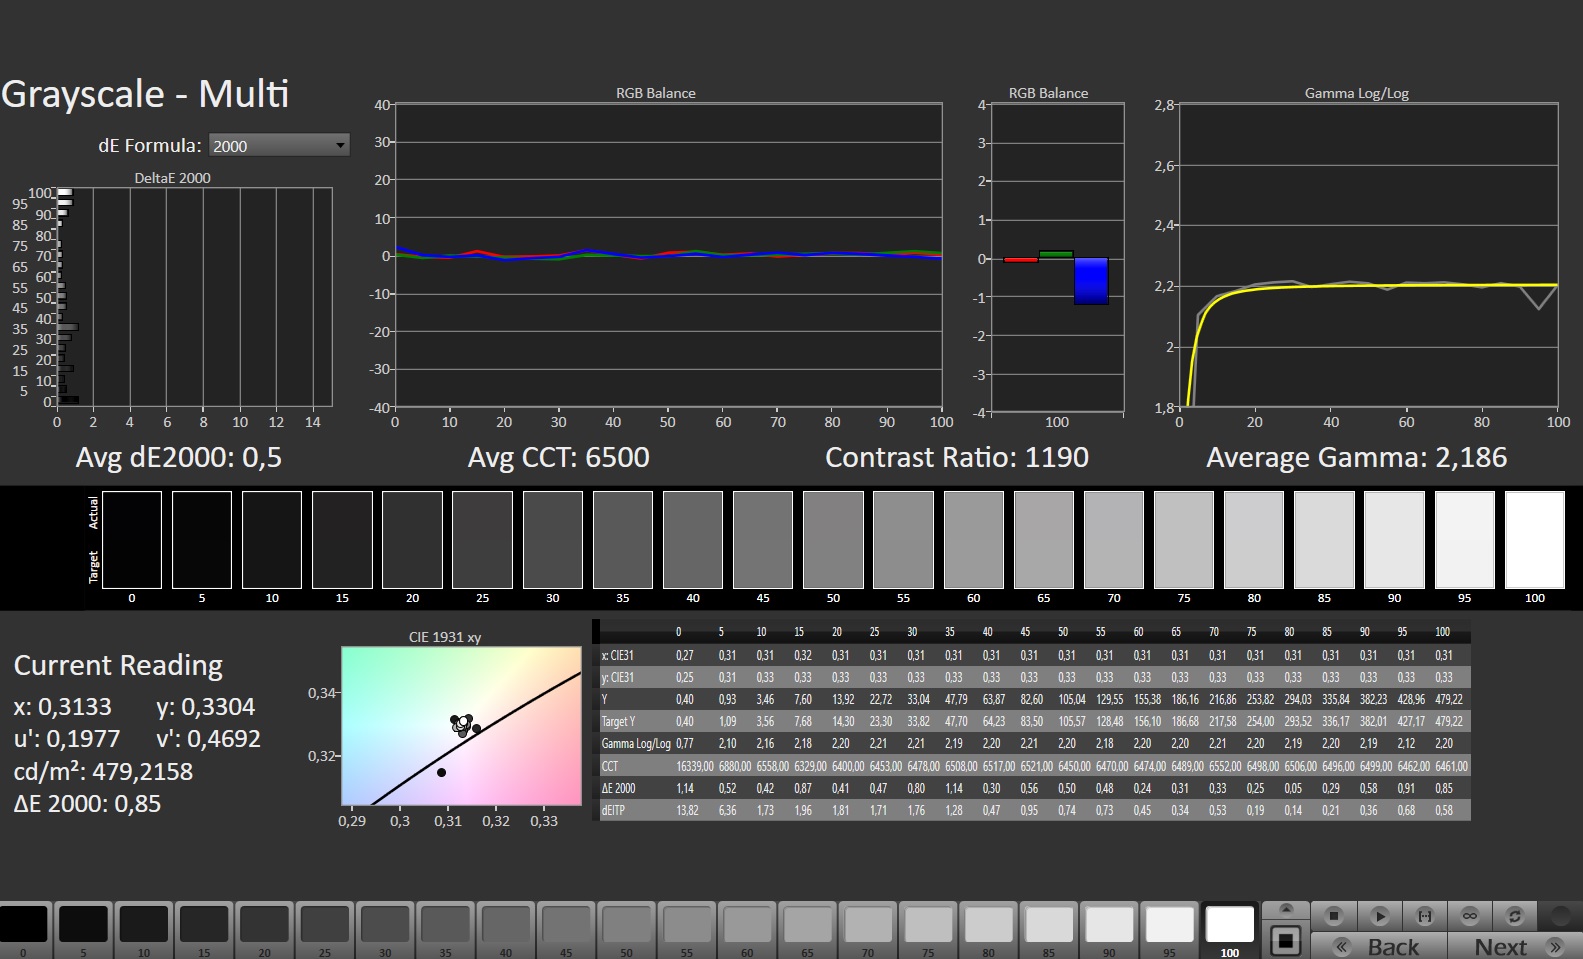

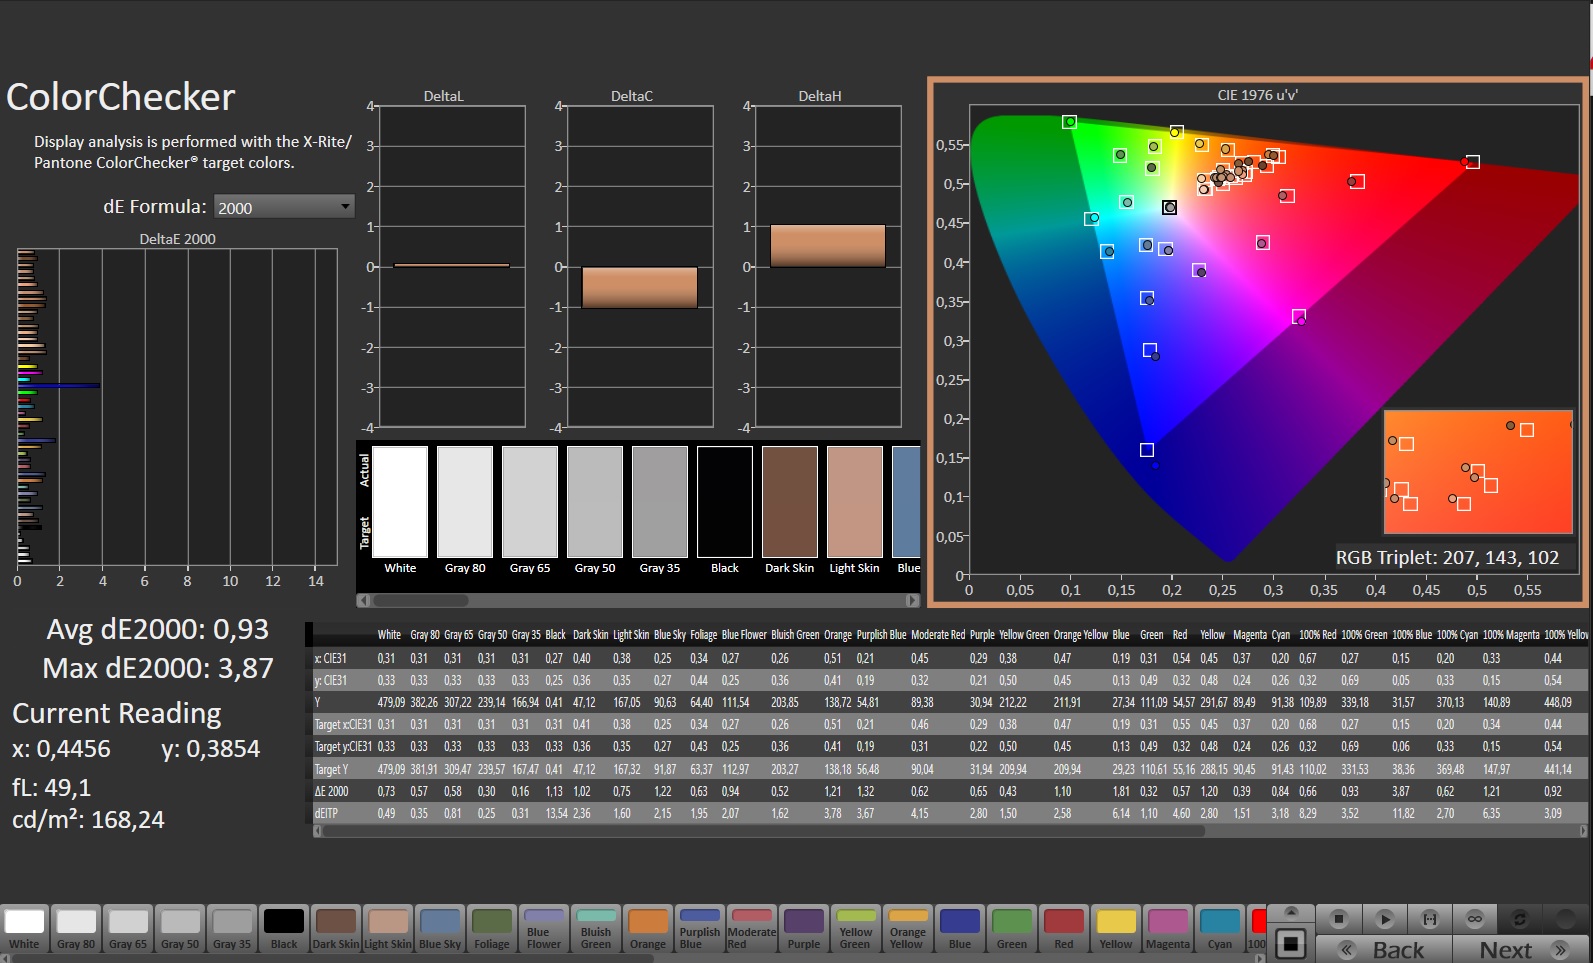
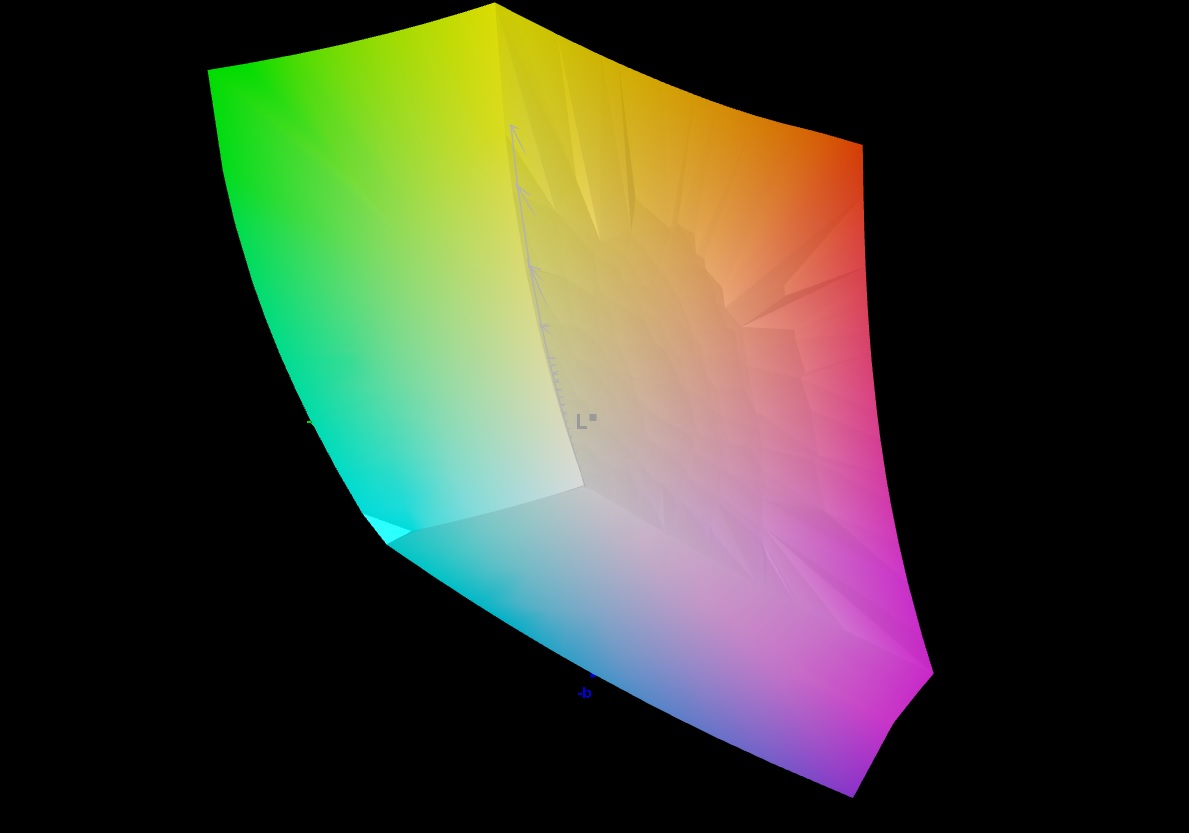
For filmmakers and film lovers, the 97% coverage of the DisplayP3 color space should also be pleasing. The near 100% sRGB color space coverage is usually sufficient for gaming. Only a few games offer the choice of a larger color space. Only in AdobeRGB does the screen weaken somewhat, where the color space, which is important for photographers, only has around 85% coverage.
Display Response Times
| ↔ Response Time Black to White | ||
|---|---|---|
| 6.6 ms ... rise ↗ and fall ↘ combined | ↗ 2.2 ms rise | 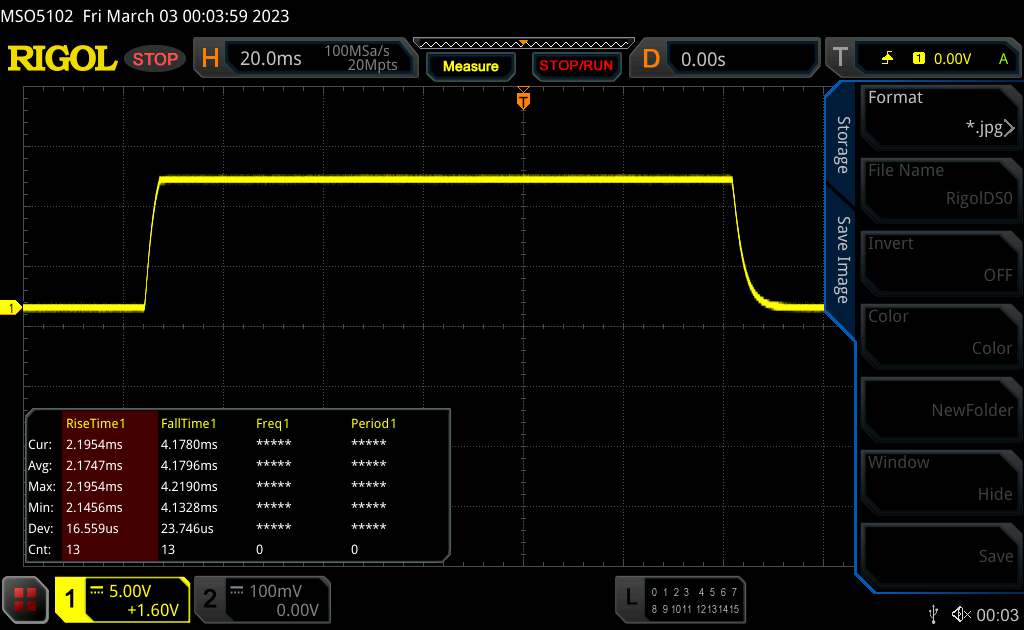 |
| ↘ 4.2 ms fall | ||
| The screen shows very fast response rates in our tests and should be very well suited for fast-paced gaming. In comparison, all tested devices range from 0.1 (minimum) to 240 (maximum) ms. » 15 % of all devices are better. This means that the measured response time is better than the average of all tested devices (21.5 ms). | ||
| ↔ Response Time 50% Grey to 80% Grey | ||
| 5.1 ms ... rise ↗ and fall ↘ combined | ↗ 2.3 ms rise | 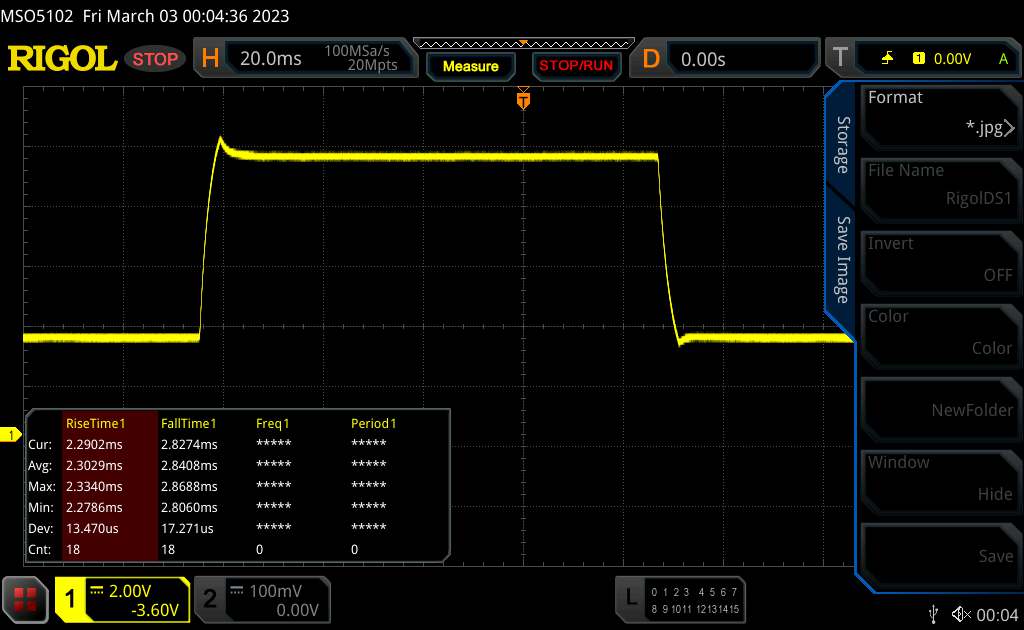 |
| ↘ 2.8 ms fall | ||
| The screen shows very fast response rates in our tests and should be very well suited for fast-paced gaming. In comparison, all tested devices range from 0.2 (minimum) to 636 (maximum) ms. » 12 % of all devices are better. This means that the measured response time is better than the average of all tested devices (33.8 ms). | ||
Screen Flickering / PWM (Pulse-Width Modulation)
| Screen flickering / PWM not detected |  | ||
In comparison: 53 % of all tested devices do not use PWM to dim the display. If PWM was detected, an average of 17933 (minimum: 5 - maximum: 3846000) Hz was measured. | |||
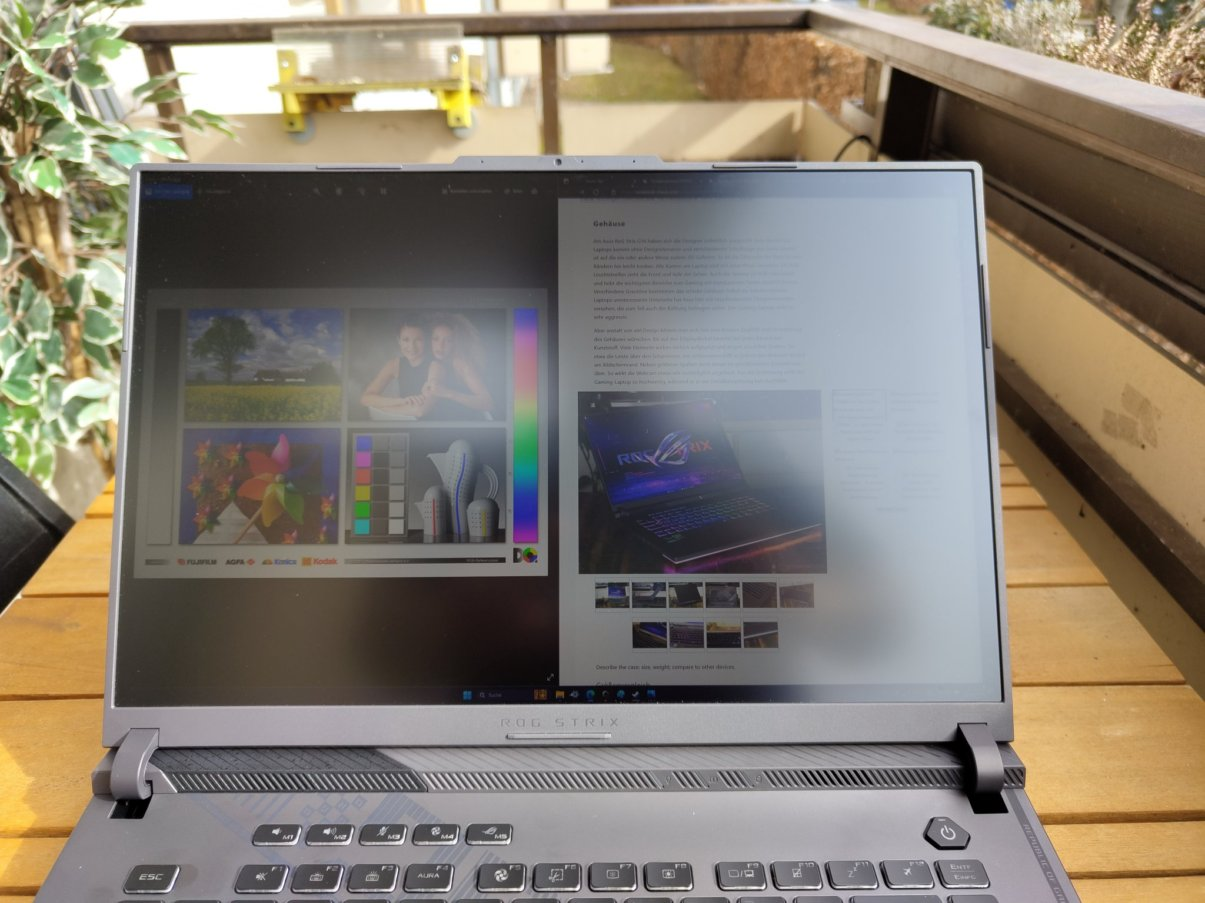
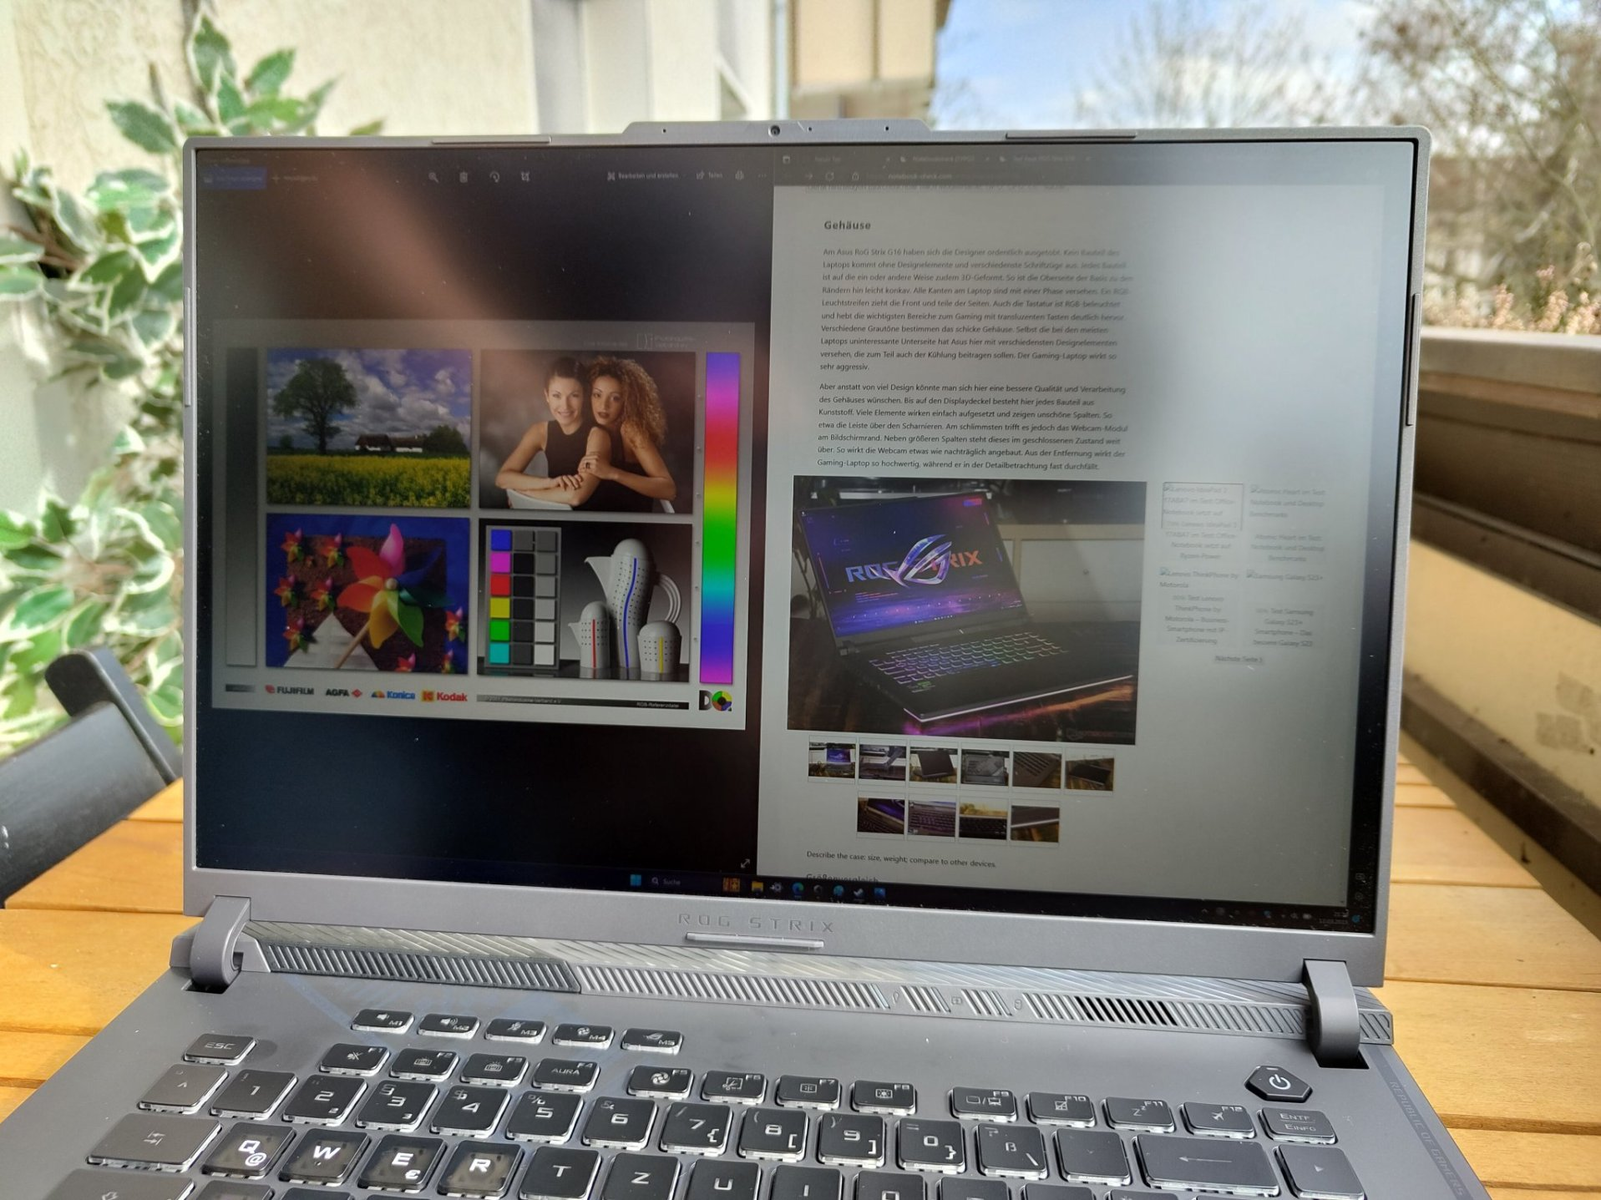
470 cd/m² with a contrast ratio of 1119:1 is not quite enough for unrestricted use of the matte screen outdoors. A blue sky can reflect on the screen and make reading difficult if you're not looking from the right angle. Fortunately, the screen of the Asus ROG Strix G16 is very viewing angle stable. Viewed from all sides, there are barely any noticeable brightness and color deviations.

Performance - Up to 175 watts for the GeForce RTX 4080
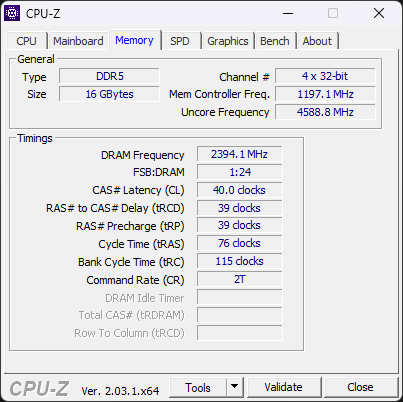
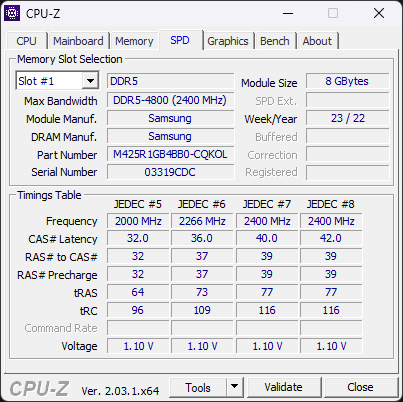
The Asus ROG Strix G16 is available in various configurations. The top configuration consists of an Intel Core i9-13980HX with 32 GB of DDR5 RAM and an Nvidia GeForce RTX 4080. Our test unit is identical, apart from the 16 GB RAM. Thanks to high TDP and TGP values, there are hardly any limits on gaming. At the highest quality settings, many current titles are rendered on the ROG Strix in the display's native QHD+ resolution at well over 60 FPS.
Performance Control and Testing Conditions
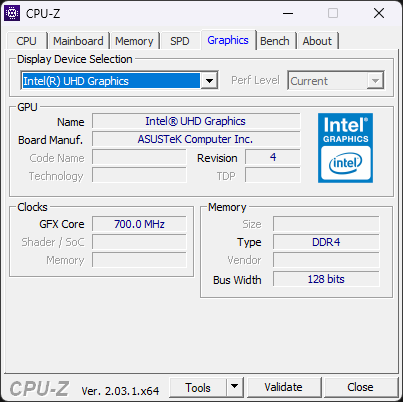
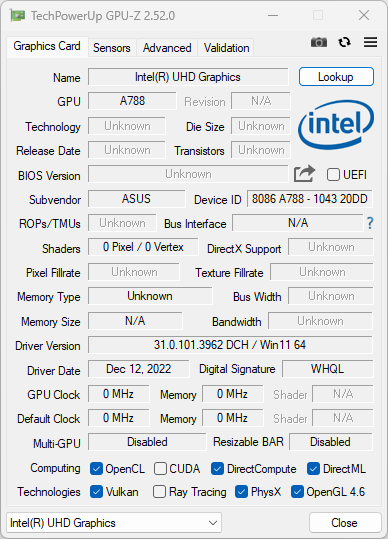
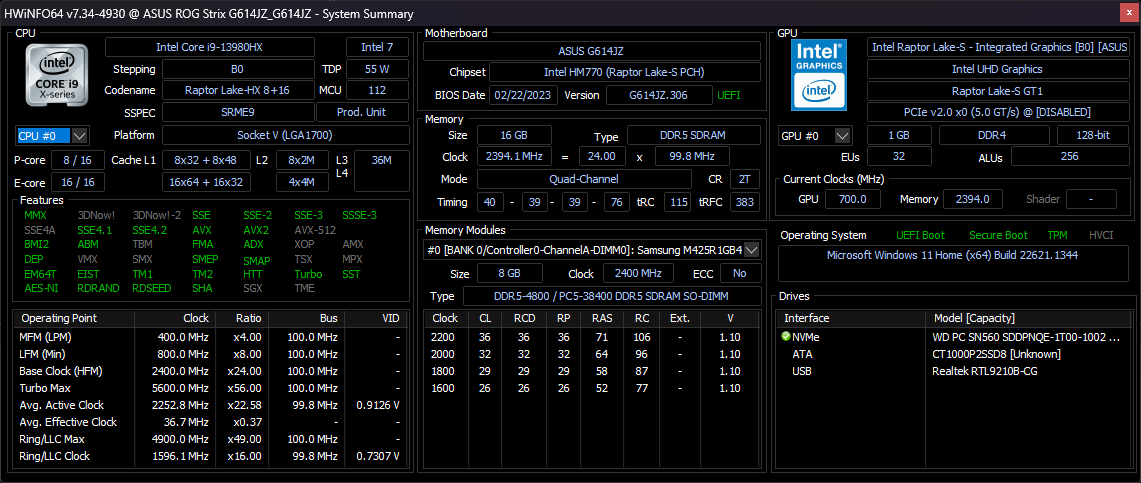
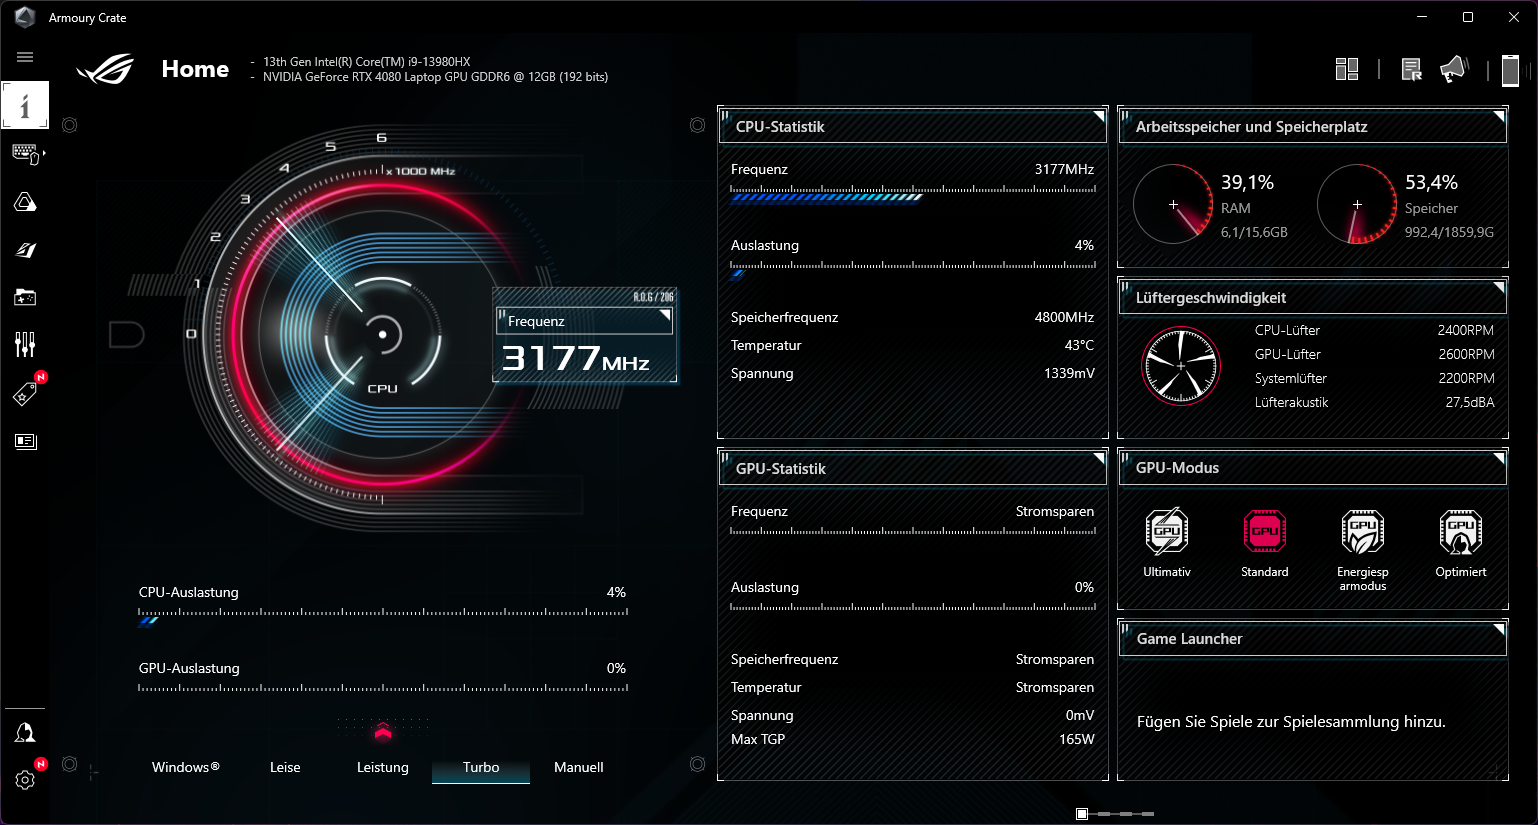
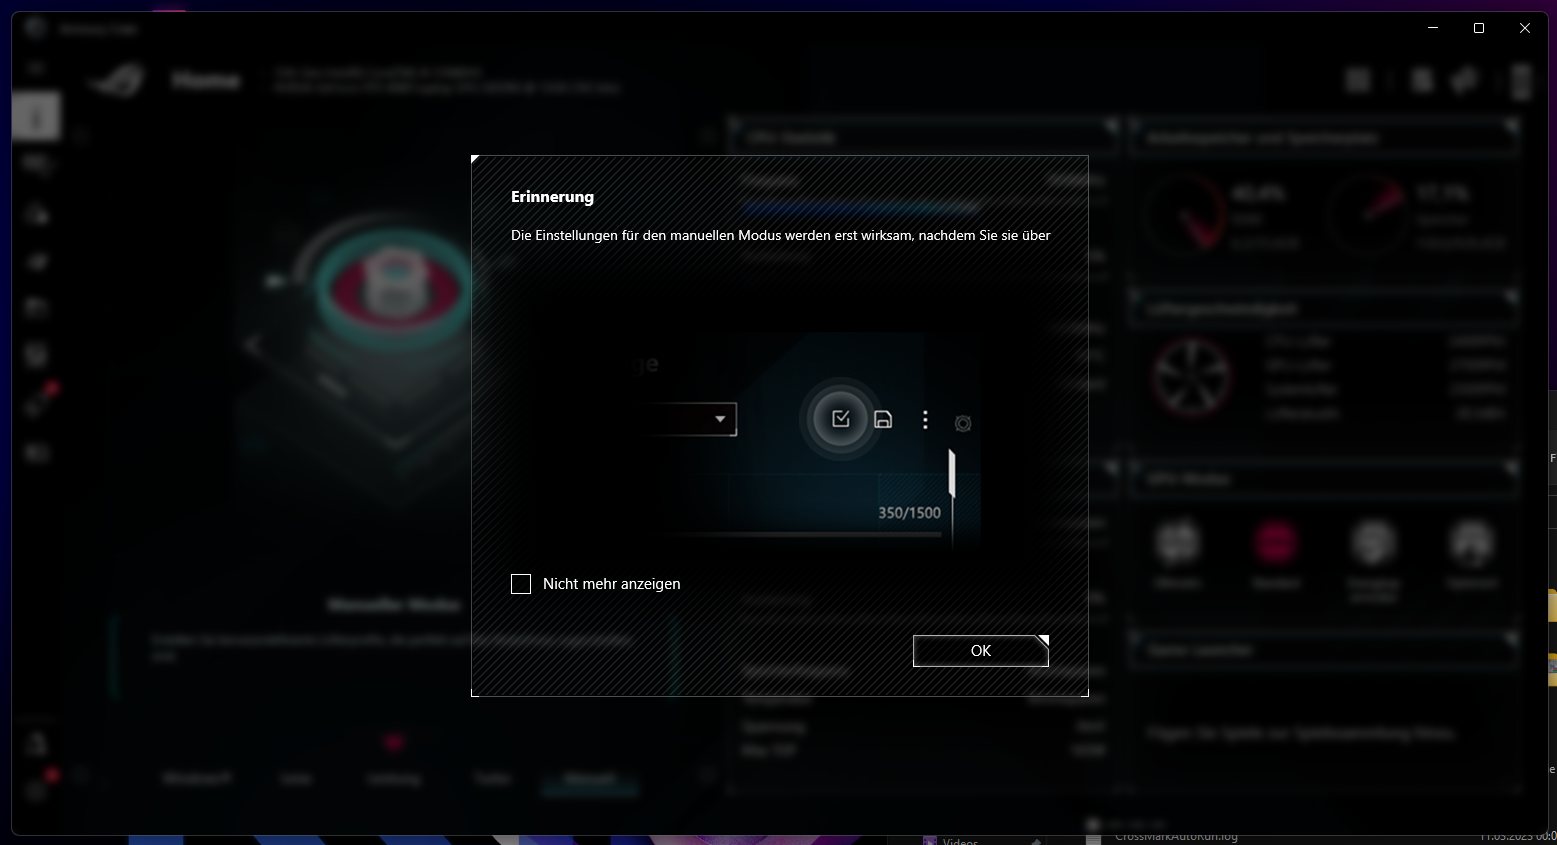
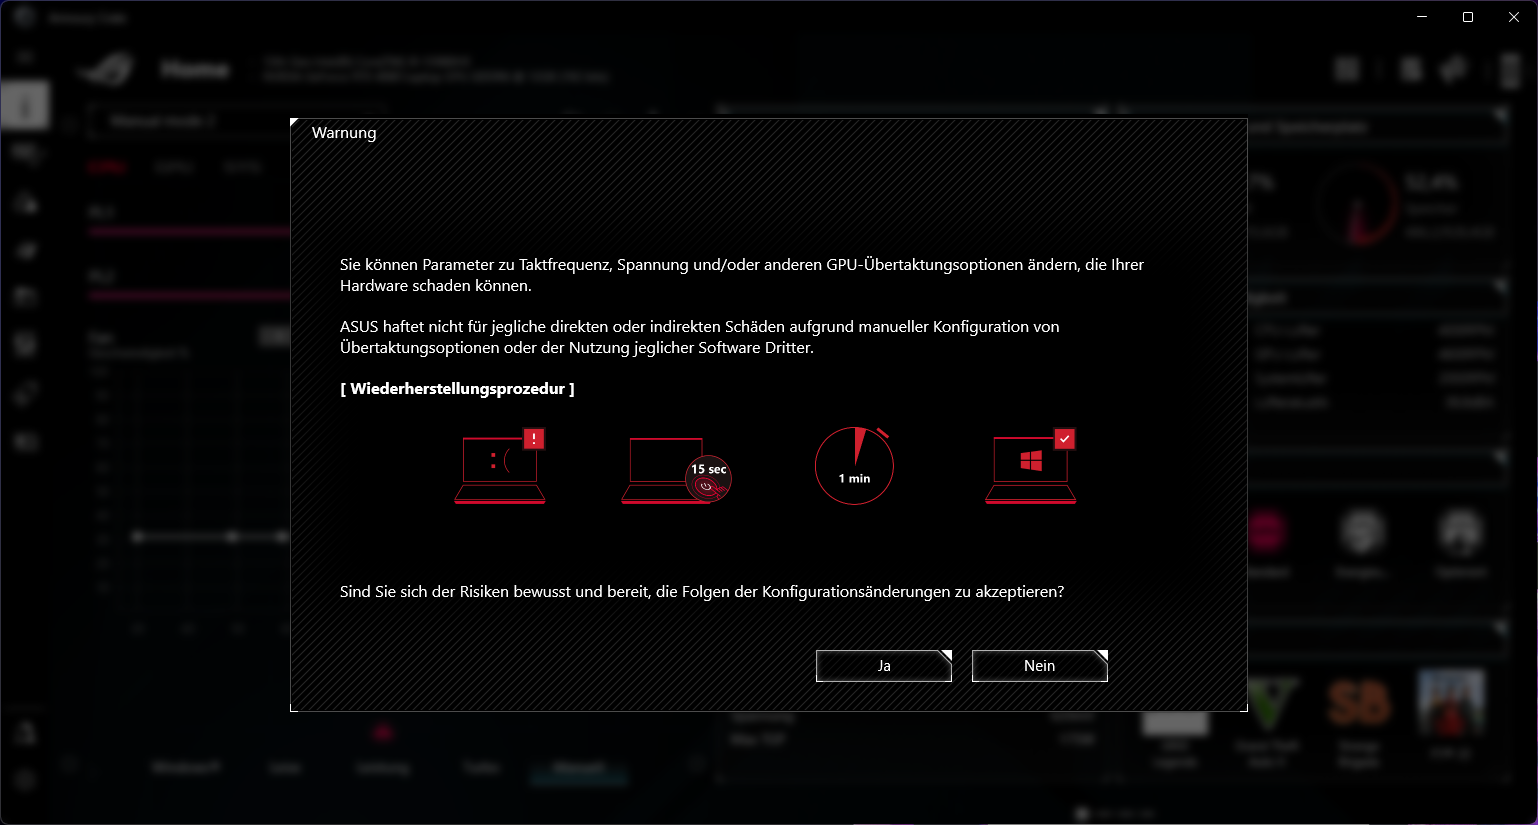
The performance of the ROG Strix G16 can be controlled via the comprehensive Armory Crate app. In addition to performance, the RGB lighting, the display and other functions are also configured here. Three predefined performance profiles are available, namely Silent, Performance and Turbo, along with settings for the RTX 4080. Depending on the GPU mode, there is a mixed mode, or a choice between the iGPU of the i9 or the Nvidia graphics card as the GPU. Switching takes place via MUX, so the display is always directly connected to the active graphics unit. If desired, users can squeeze out all gaming potential from the notebook in manual mode and adjust a wide variety of settings. Fan curves, TGP, Dynamic Boost, PL1 and PL2 as well as temperature limits can be set. Overclockers will get their money's worth here, even if Asus attempts to curb the system with hard limits. At least the laptop's performance can be adapted to the requirements of some games. Neither the GPU nor the CPU pose any performance bottleneck issues.
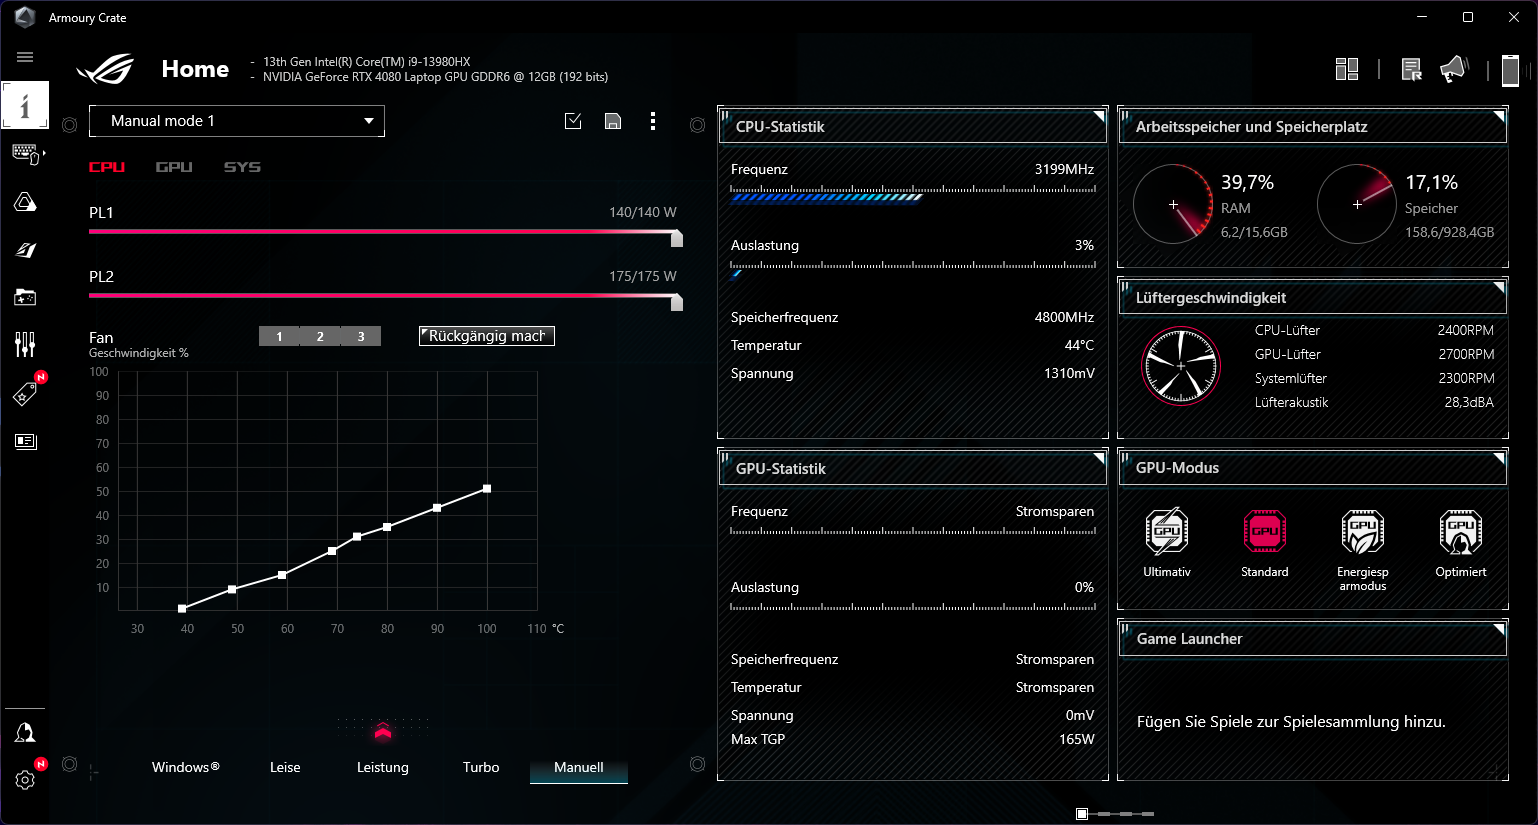
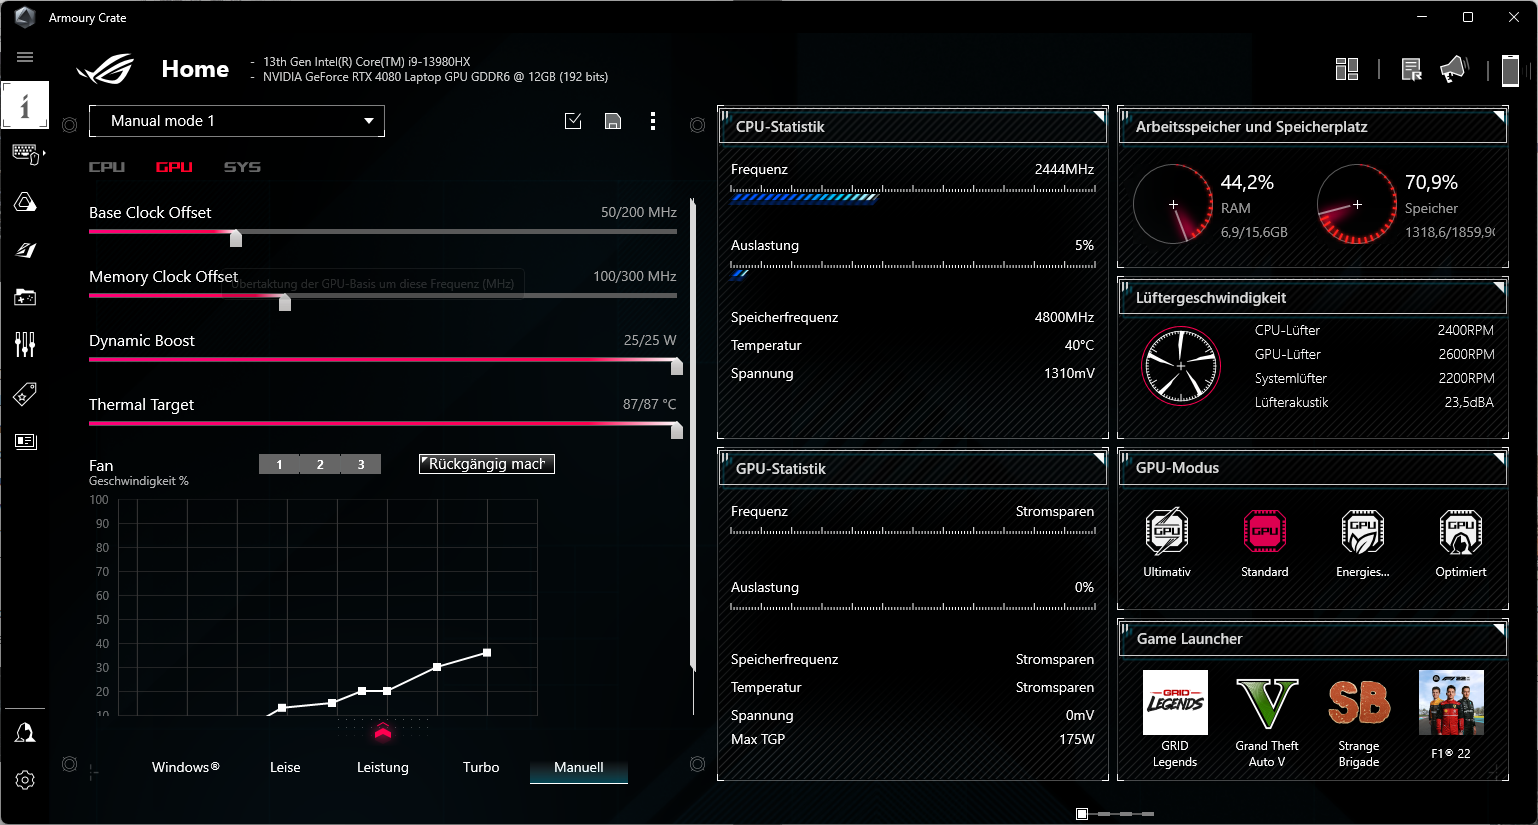
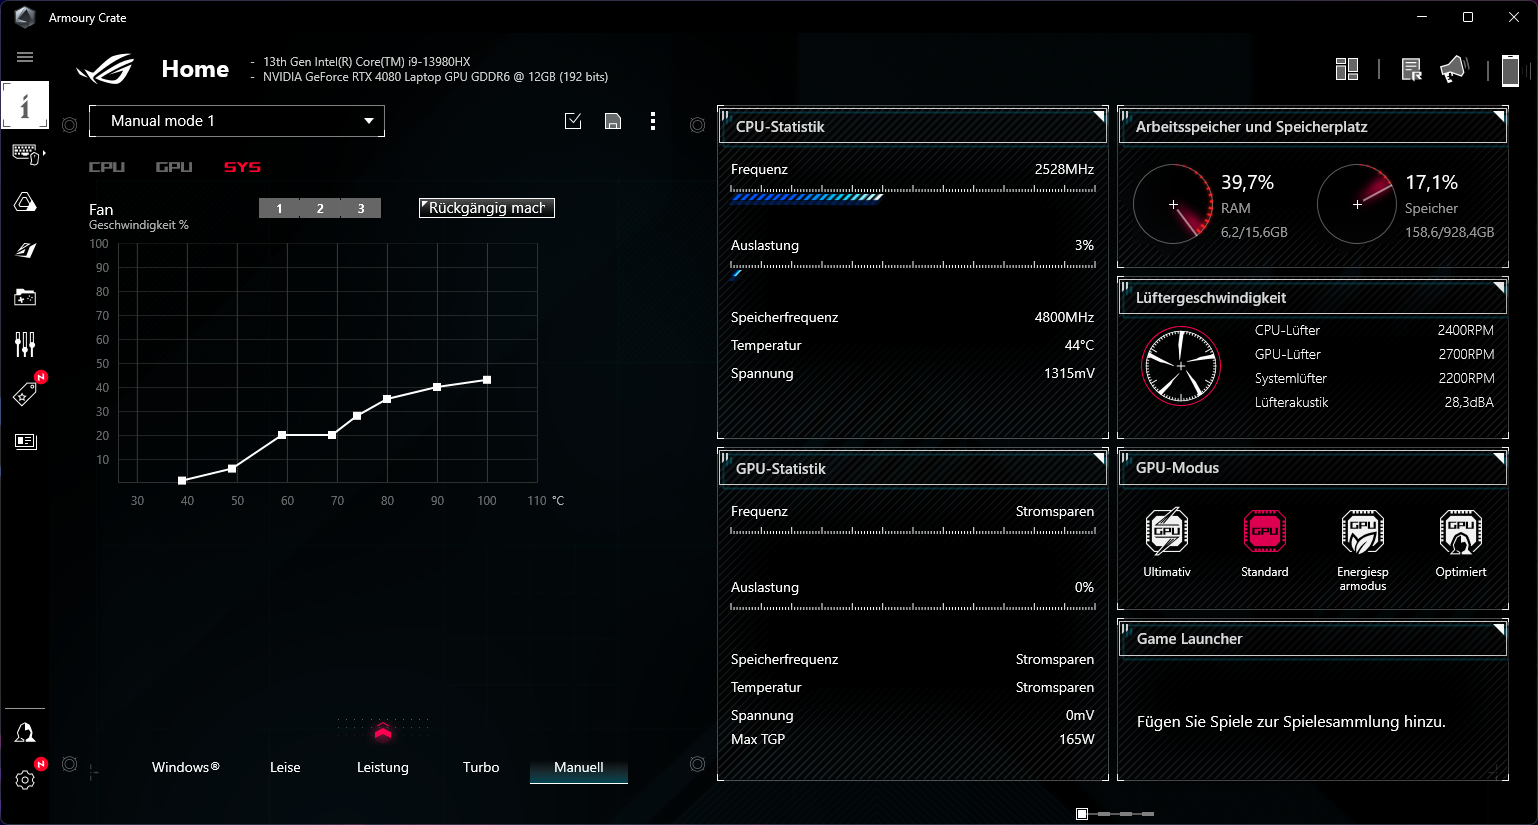
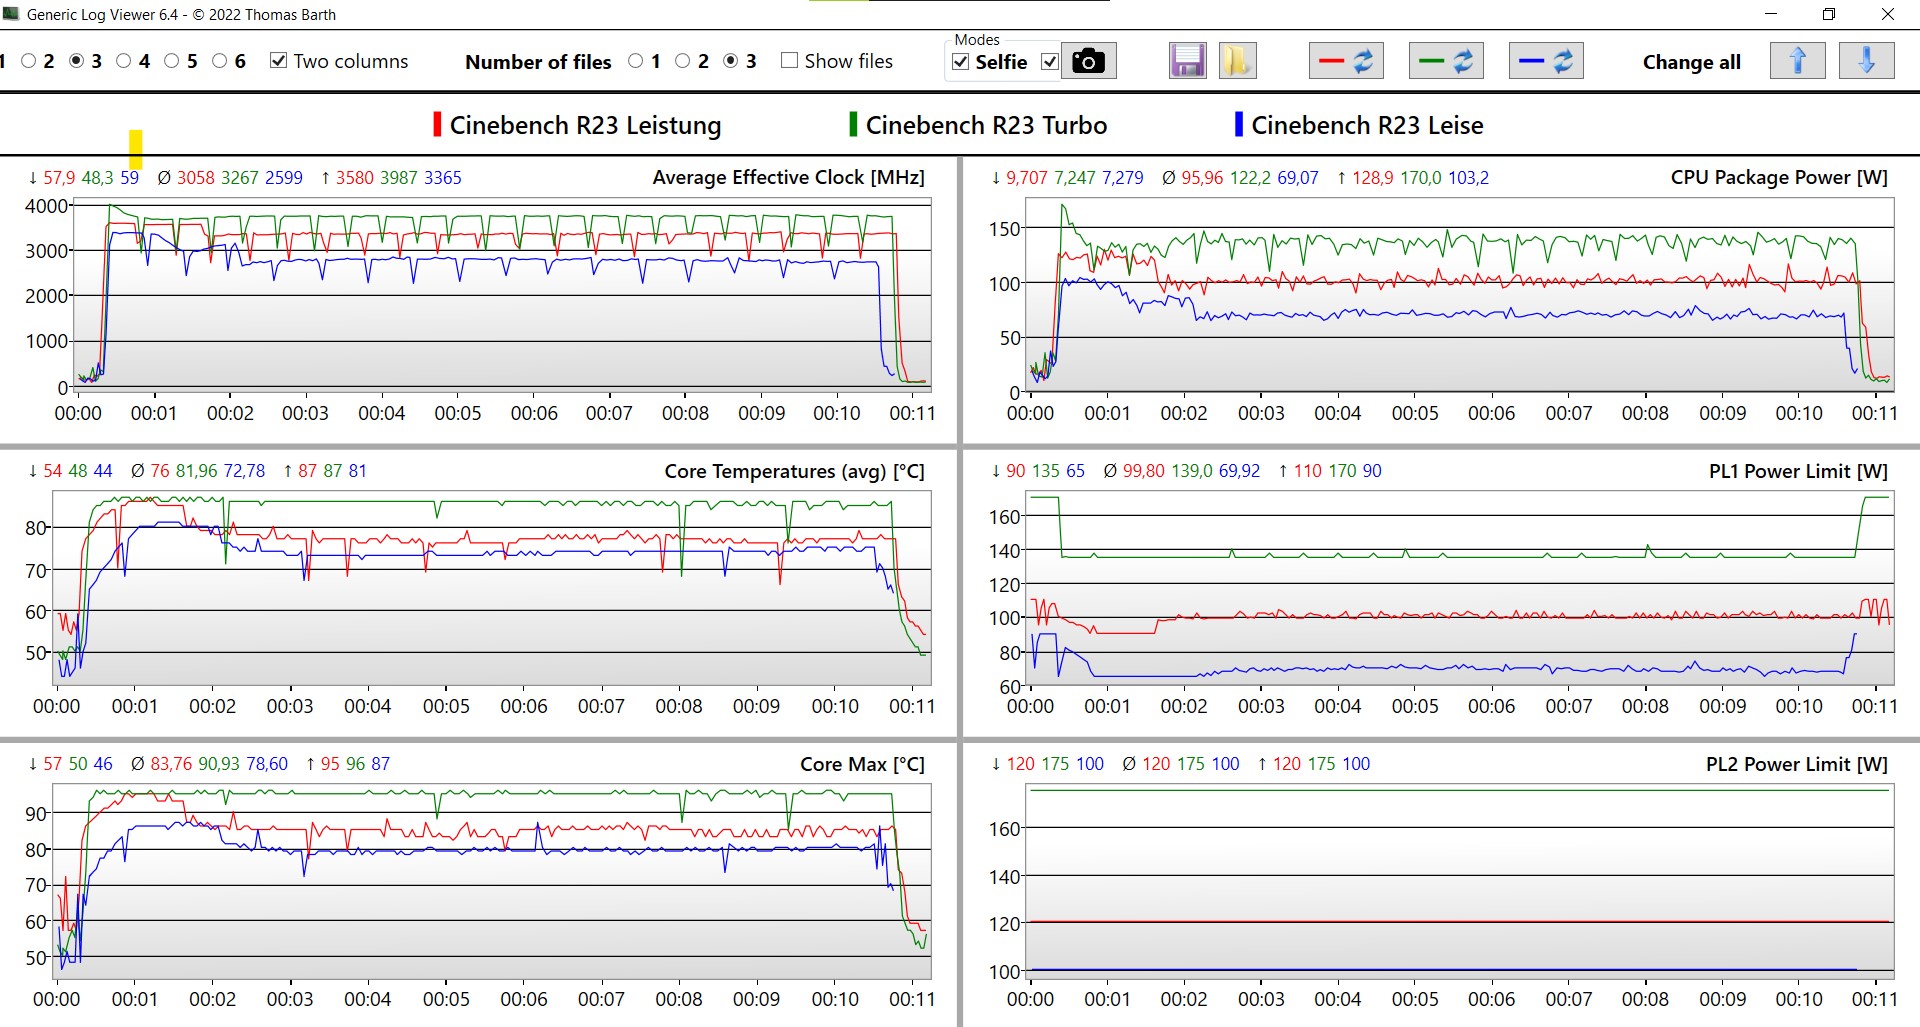
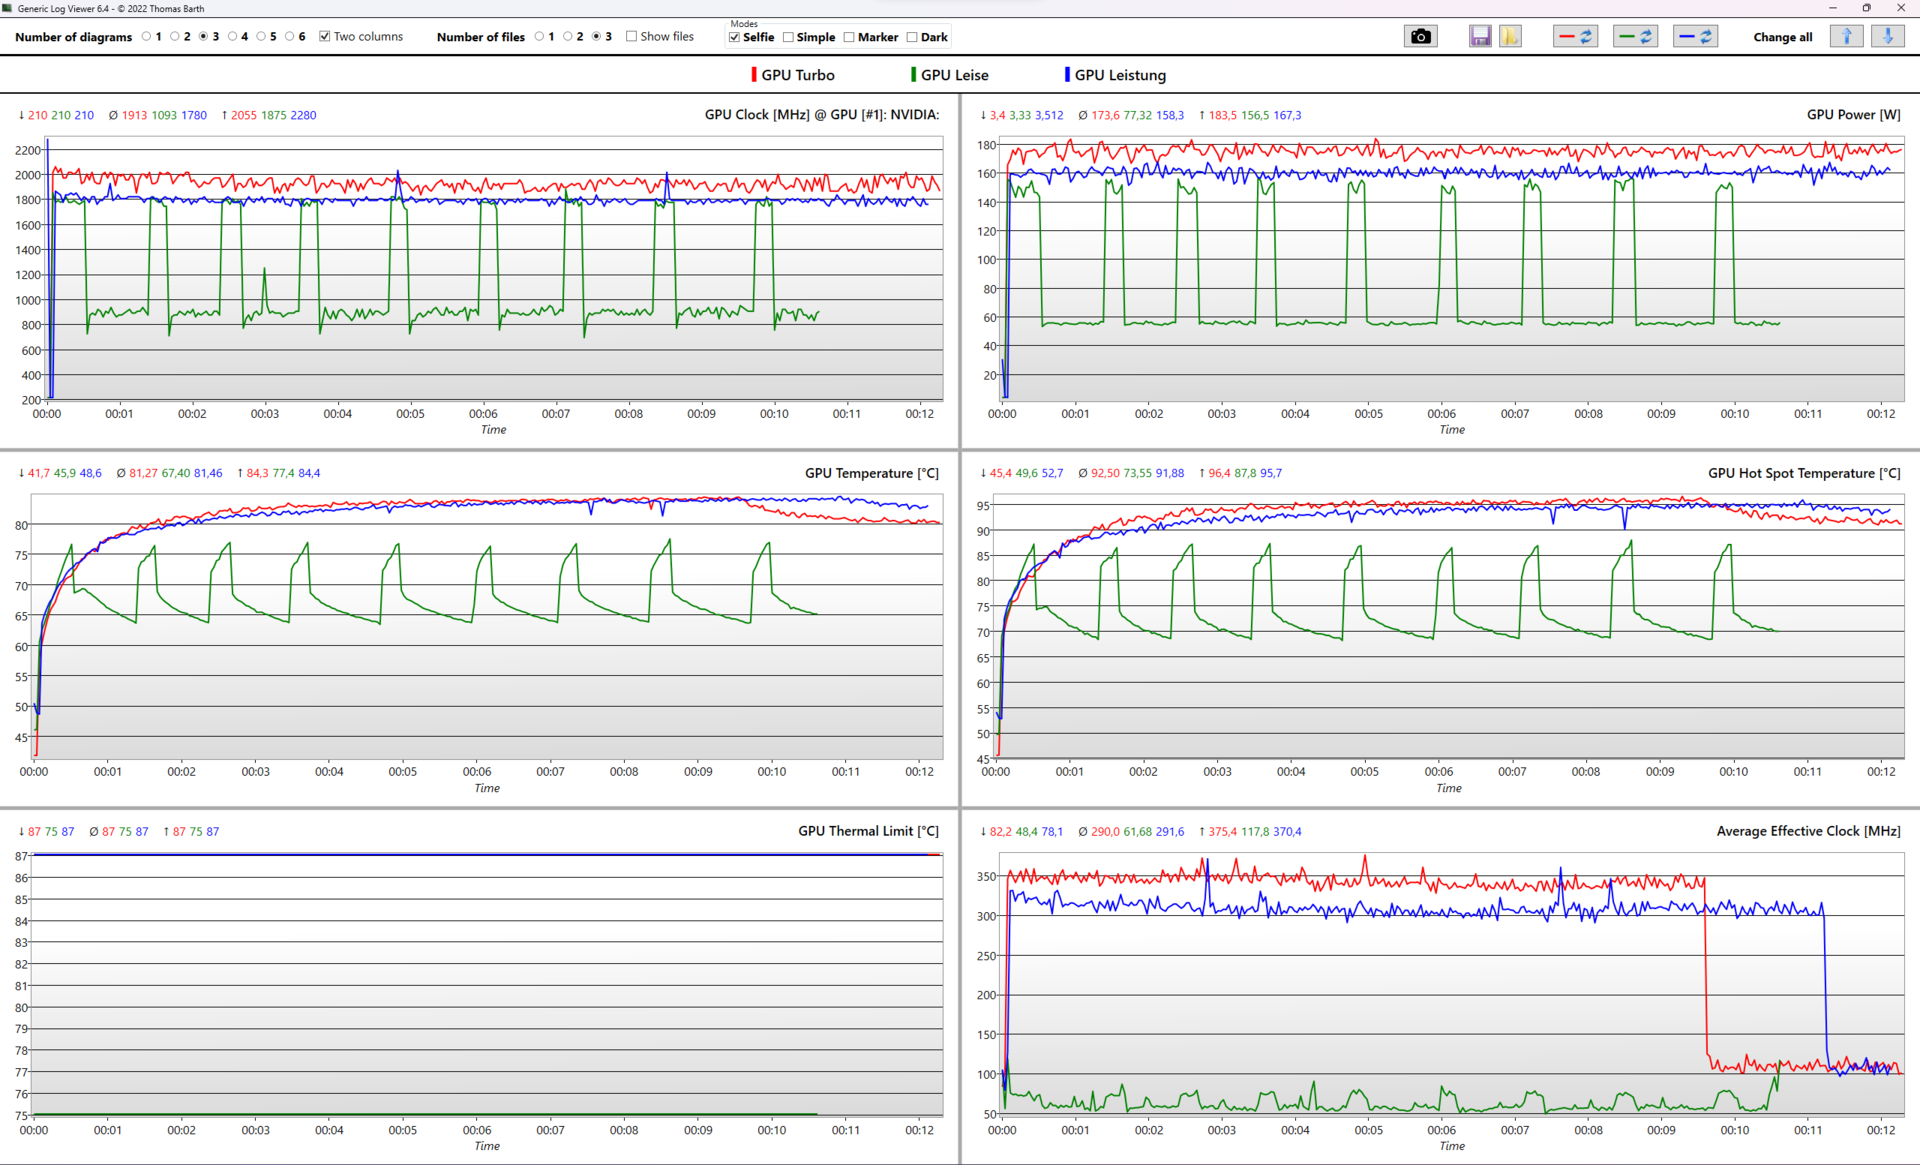
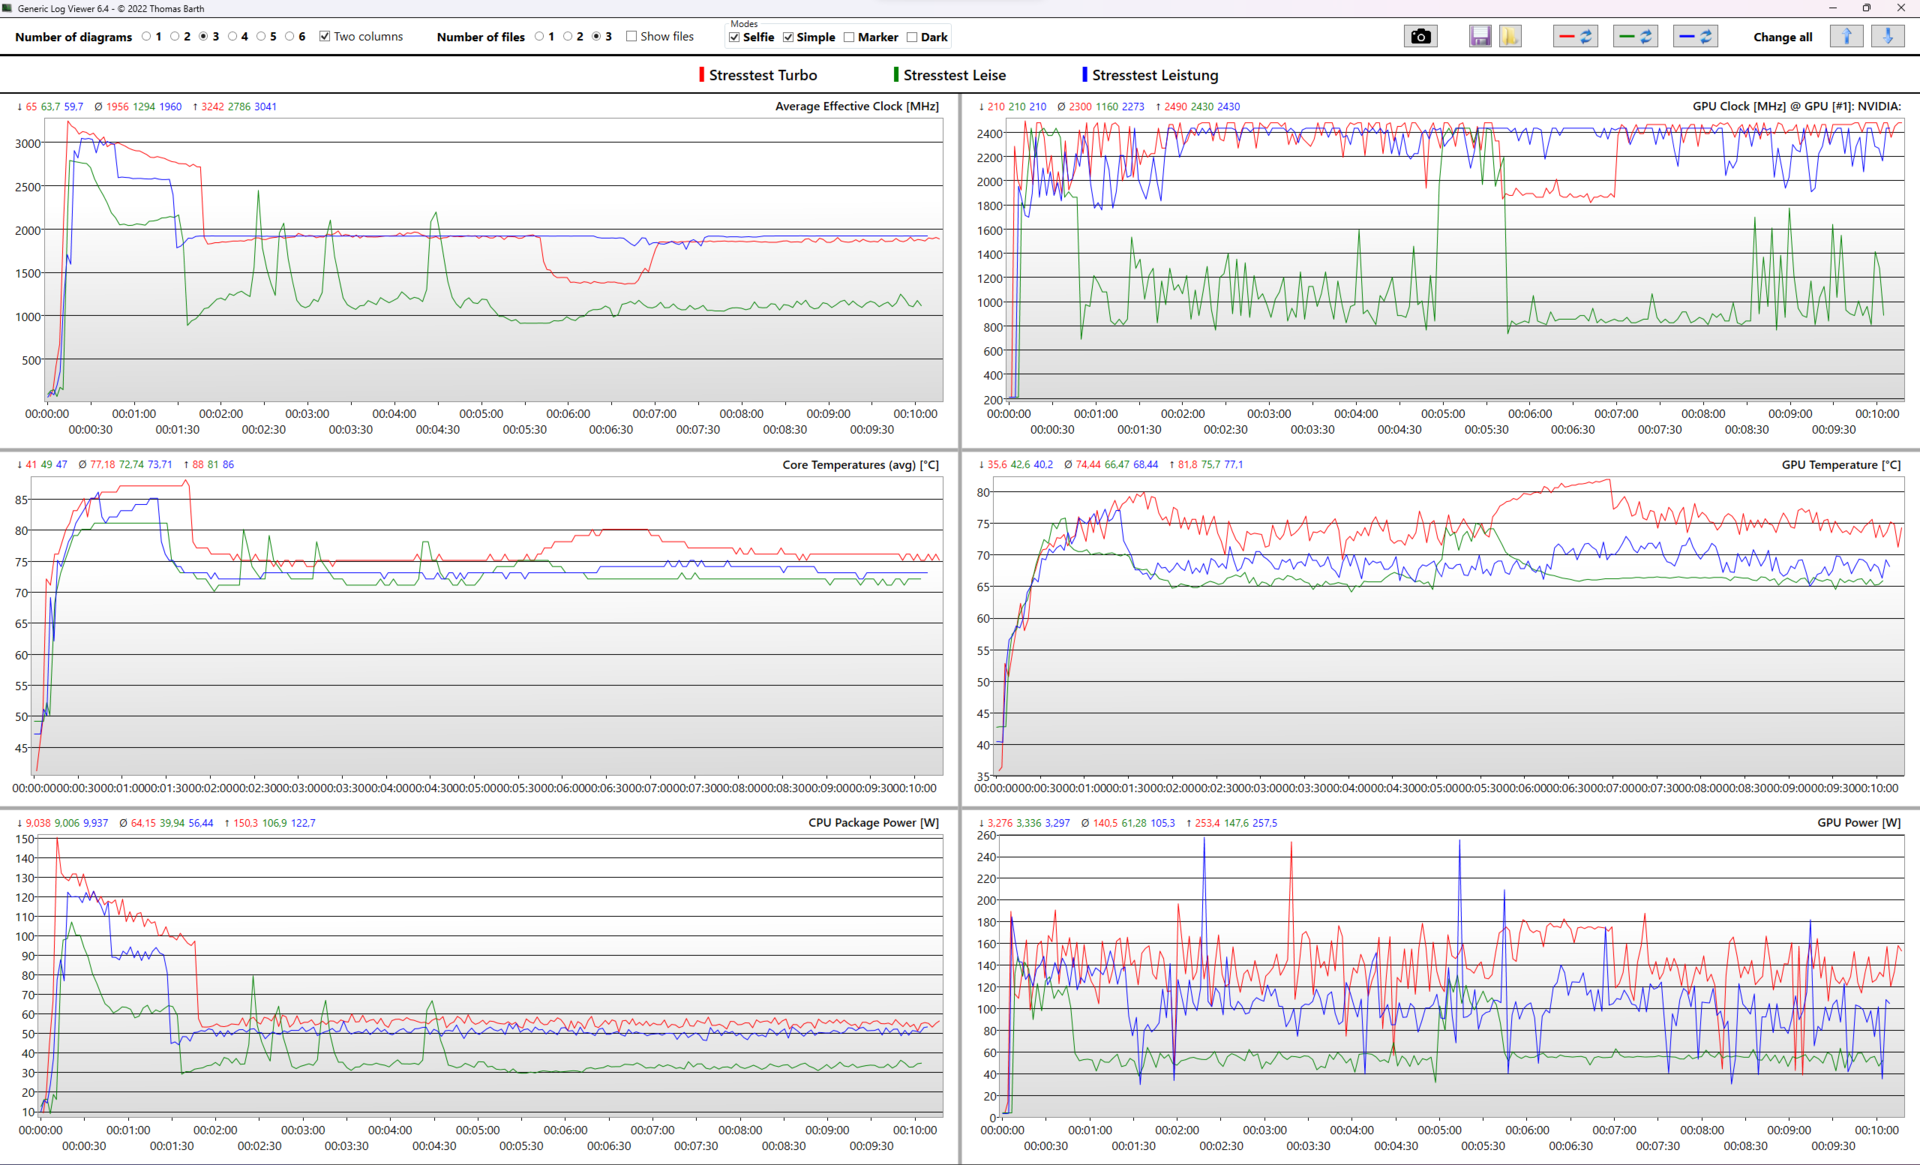
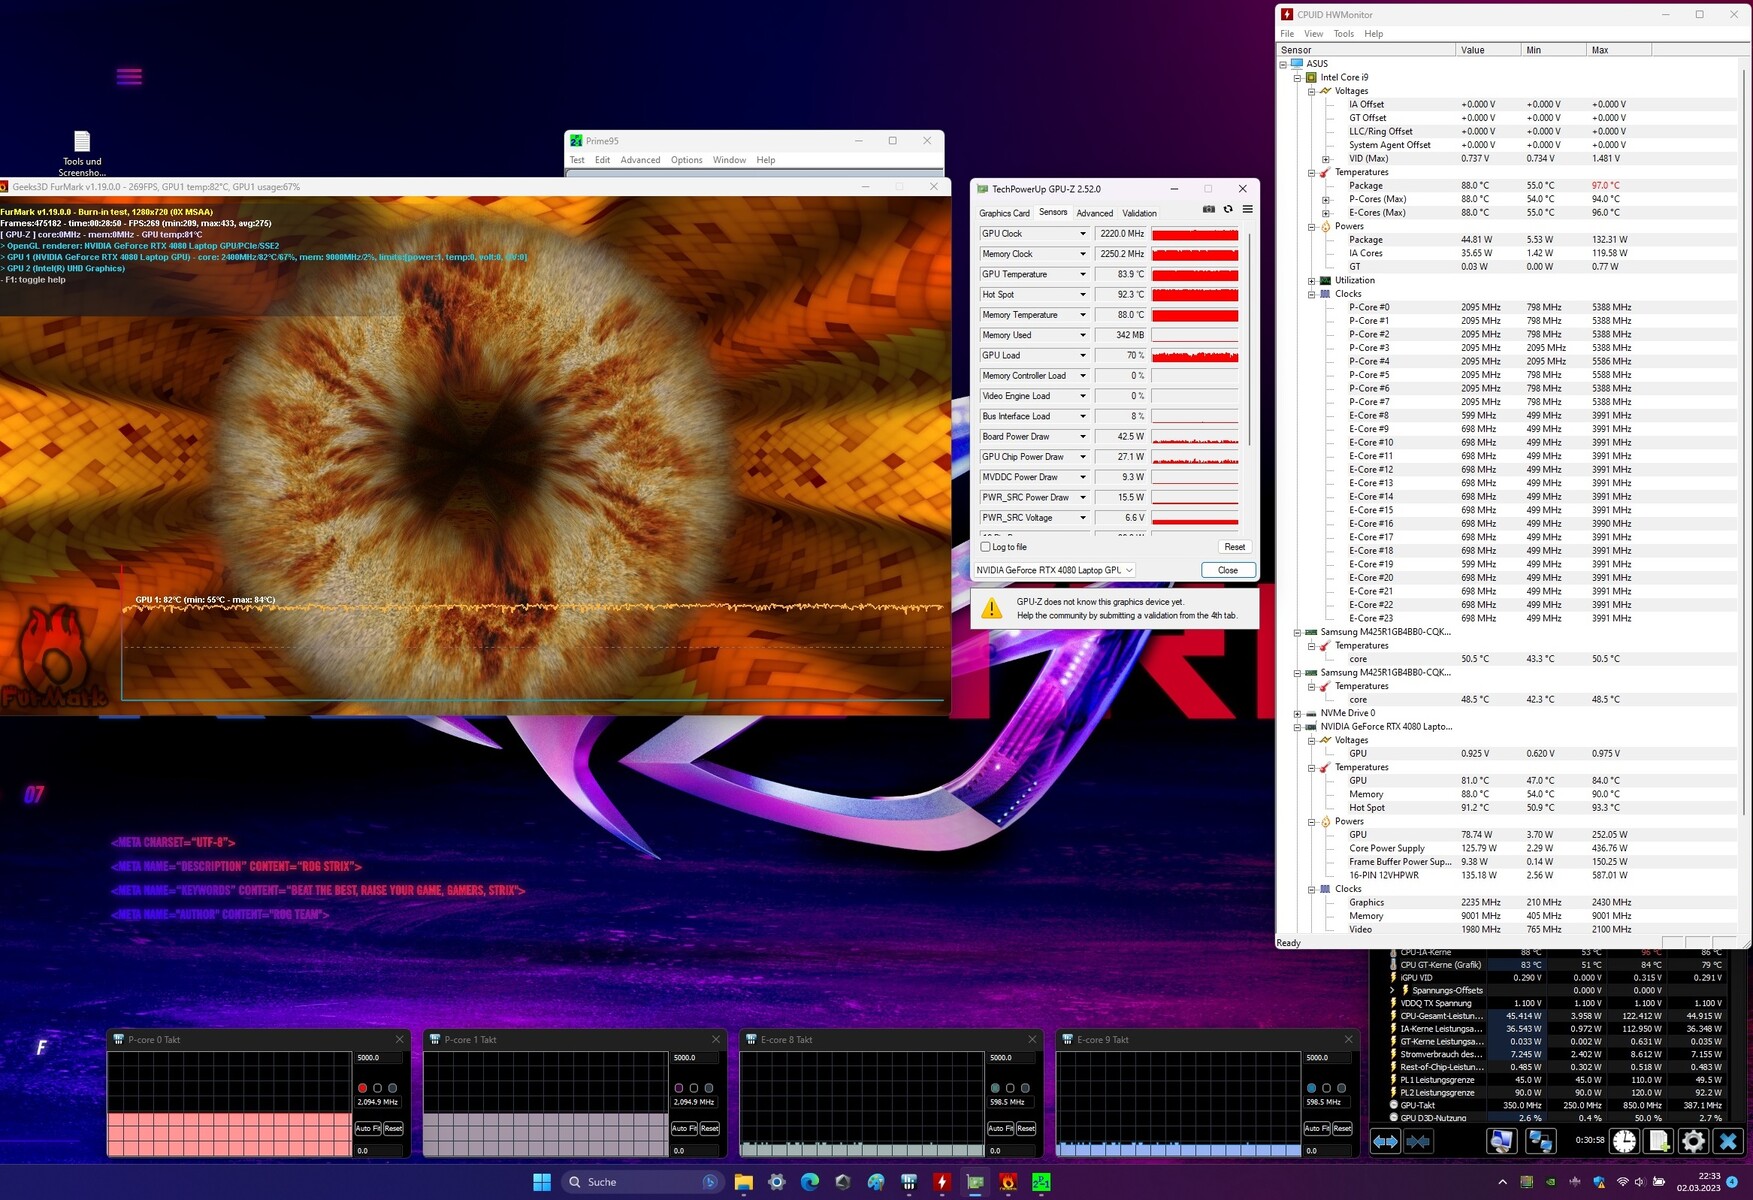
The various settings of Armory Crate can change the TGP and TDP values quite a bit. For example, the processor is able to extract 130 watts for long periods in Turbo mode, and around 70 watts in Silent mode. In stress testing with Prime95 and Furmark, the Intel Core i9 and Nvidia GeForce RTX 4080 work with a combined output of around 210 watts in Turbo mode and 95 watts in Silent mode. More precise values can be gleaned from the logs below. A closer look reveals that while the performance values of the hardware in watts are occasionally very far apart depending on the operating mode, the effective clock rates of the processor and graphics chip are not far apart.
On the other hand, we noticed significant differences in the notebook's noise emissions. In Silent mode, the three fans run at around 40 dB(A). Turbo mode is around 51 dB(A). Since the dB scale is logarithmic, this doubles the perceived loudness of the ROG Strix G16. Our measurements and benchmarks were mostly carried out in the standard GPU mode and in Performance mode.
Processor
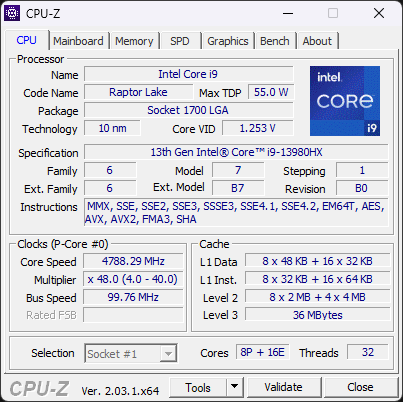
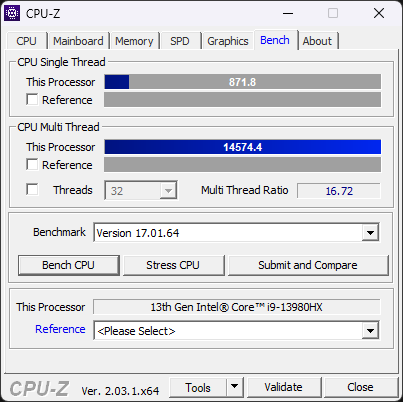
Raptor Lake is the name of Intel's 13th processor generation, which brought forth the Intel Core i9-13980HX. The high-end CPU is designed for larger notebooks with strong cooling. Thanks to eight P cores and 16 E cores, the i9 has 32 threads. According to HWinfo, the CPU in the Asus gaming notebook operates well above Intel's recommended TDP values. In Turbo mode, up to 130 watts of continuous power is possible.
In Performance mode, the fans repeatedly and noticeably start up quite late in the Cinebench R15 loop. This explains the sharp drop in performance after the first three runs. Shortly afterwards, however, the cooling stabilizes and the processor is able to continue working at a high level. The sharp drop in performance only occurs in this particular benchmark. After each run, Cinebench restarts, giving the processor one to three seconds to recover between runs. However, this can also lead to a delayed reaction of the performance control to the load scenario. In the loop with Cinebench R23, we were unable to elicit a sharp drop in performance. Here the times between the individual runs are somewhat shorter. After two strong runs with over 30,000 points, the ROG Strix G16 remained at around 29,000 points in the CB R23 loop for 10 minutes. Multi-core performance drops by around 30% to around 20,000 points in Battery mode.
Overall, the Intel Core i9 in the ROG Strix G16 is quite strong. The benchmark results here are consistently top level. However, the i9 is no match for the Ryzen 9 in the Asus Zephyrus Duo 16.
Cinebench R15 Multi Sustained Load
Cinebench R23: Multi Core | Single Core
Cinebench R20: CPU (Multi Core) | CPU (Single Core)
Cinebench R15: CPU Multi 64Bit | CPU Single 64Bit
Blender: v2.79 BMW27 CPU
7-Zip 18.03: 7z b 4 | 7z b 4 -mmt1
Geekbench 5.5: Multi-Core | Single-Core
HWBOT x265 Benchmark v2.2: 4k Preset
LibreOffice : 20 Documents To PDF
R Benchmark 2.5: Overall mean
| CPU Performance Rating | |
| Asus Zephyrus Duo 16 GX650PY-NM006W | |
| Lenovo Legion Pro 7 16IRX8H | |
| Average Intel Core i9-13980HX | |
| Asus ROG Strix G16 G614JZ | |
| Razer Blade 16 Early 2023 | |
| Average of class Gaming | |
| Gigabyte AERO 16 OLED BSF | |
| Asus TUF Gaming A16 FA617 | |
| Cinebench R23 / Multi Core | |
| Asus Zephyrus Duo 16 GX650PY-NM006W | |
| Average Intel Core i9-13980HX (28301 - 33052, n=11) | |
| Lenovo Legion Pro 7 16IRX8H | |
| Asus ROG Strix G16 G614JZ | |
| Razer Blade 16 Early 2023 | |
| Average of class Gaming (2435 - 34613, n=229, last 2 years) | |
| Gigabyte AERO 16 OLED BSF | |
| Asus TUF Gaming A16 FA617 | |
| Cinebench R23 / Single Core | |
| Asus ROG Strix G16 G614JZ | |
| Average Intel Core i9-13980HX (1825 - 2169, n=9) | |
| Lenovo Legion Pro 7 16IRX8H | |
| Razer Blade 16 Early 2023 | |
| Asus Zephyrus Duo 16 GX650PY-NM006W | |
| Average of class Gaming (527 - 2235, n=227, last 2 years) | |
| Gigabyte AERO 16 OLED BSF | |
| Asus TUF Gaming A16 FA617 | |
| Cinebench R20 / CPU (Multi Core) | |
| Asus Zephyrus Duo 16 GX650PY-NM006W | |
| Average Intel Core i9-13980HX (10353 - 12437, n=10) | |
| Asus ROG Strix G16 G614JZ | |
| Lenovo Legion Pro 7 16IRX8H | |
| Razer Blade 16 Early 2023 | |
| Average of class Gaming (930 - 13769, n=227, last 2 years) | |
| Gigabyte AERO 16 OLED BSF | |
| Asus TUF Gaming A16 FA617 | |
| Cinebench R20 / CPU (Single Core) | |
| Asus ROG Strix G16 G614JZ | |
| Average Intel Core i9-13980HX (717 - 825, n=10) | |
| Lenovo Legion Pro 7 16IRX8H | |
| Asus Zephyrus Duo 16 GX650PY-NM006W | |
| Razer Blade 16 Early 2023 | |
| Average of class Gaming (169 - 855, n=227, last 2 years) | |
| Gigabyte AERO 16 OLED BSF | |
| Asus TUF Gaming A16 FA617 | |
| Cinebench R15 / CPU Multi 64Bit | |
| Asus Zephyrus Duo 16 GX650PY-NM006W | |
| Lenovo Legion Pro 7 16IRX8H | |
| Asus ROG Strix G16 G614JZ | |
| Asus ROG Strix G16 G614JZ | |
| Average Intel Core i9-13980HX (4358 - 5172, n=11) | |
| Razer Blade 16 Early 2023 | |
| Average of class Gaming (400 - 5663, n=231, last 2 years) | |
| Gigabyte AERO 16 OLED BSF | |
| Asus TUF Gaming A16 FA617 | |
| Cinebench R15 / CPU Single 64Bit | |
| Asus Zephyrus Duo 16 GX650PY-NM006W | |
| Asus ROG Strix G16 G614JZ | |
| Asus ROG Strix G16 G614JZ | |
| Average Intel Core i9-13980HX (289 - 312, n=11) | |
| Lenovo Legion Pro 7 16IRX8H | |
| Razer Blade 16 Early 2023 | |
| Average of class Gaming (79.2 - 318, n=230, last 2 years) | |
| Asus TUF Gaming A16 FA617 | |
| Gigabyte AERO 16 OLED BSF | |
| Blender / v2.79 BMW27 CPU | |
| Asus TUF Gaming A16 FA617 | |
| Average of class Gaming (87 - 1259, n=225, last 2 years) | |
| Gigabyte AERO 16 OLED BSF | |
| Razer Blade 16 Early 2023 | |
| Average Intel Core i9-13980HX (97 - 136, n=10) | |
| Asus ROG Strix G16 G614JZ | |
| Lenovo Legion Pro 7 16IRX8H | |
| Asus Zephyrus Duo 16 GX650PY-NM006W | |
| 7-Zip 18.03 / 7z b 4 | |
| Asus Zephyrus Duo 16 GX650PY-NM006W | |
| Lenovo Legion Pro 7 16IRX8H | |
| Average Intel Core i9-13980HX (104616 - 129804, n=10) | |
| Asus ROG Strix G16 G614JZ | |
| Razer Blade 16 Early 2023 | |
| Average of class Gaming (11386 - 140932, n=226, last 2 years) | |
| Gigabyte AERO 16 OLED BSF | |
| Asus TUF Gaming A16 FA617 | |
| 7-Zip 18.03 / 7z b 4 -mmt1 | |
| Asus Zephyrus Duo 16 GX650PY-NM006W | |
| Lenovo Legion Pro 7 16IRX8H | |
| Average Intel Core i9-13980HX (6230 - 7163, n=10) | |
| Asus ROG Strix G16 G614JZ | |
| Razer Blade 16 Early 2023 | |
| Average of class Gaming (2685 - 7581, n=226, last 2 years) | |
| Asus TUF Gaming A16 FA617 | |
| Gigabyte AERO 16 OLED BSF | |
| Geekbench 5.5 / Multi-Core | |
| Lenovo Legion Pro 7 16IRX8H | |
| Average Intel Core i9-13980HX (18475 - 22200, n=10) | |
| Asus Zephyrus Duo 16 GX650PY-NM006W | |
| Asus ROG Strix G16 G614JZ | |
| Razer Blade 16 Early 2023 | |
| Gigabyte AERO 16 OLED BSF | |
| Average of class Gaming (1946 - 22200, n=231, last 2 years) | |
| Asus TUF Gaming A16 FA617 | |
| Geekbench 5.5 / Single-Core | |
| Asus Zephyrus Duo 16 GX650PY-NM006W | |
| Average Intel Core i9-13980HX (1796 - 2139, n=10) | |
| Asus ROG Strix G16 G614JZ | |
| Lenovo Legion Pro 7 16IRX8H | |
| Razer Blade 16 Early 2023 | |
| Average of class Gaming (158 - 2193, n=231, last 2 years) | |
| Gigabyte AERO 16 OLED BSF | |
| Asus TUF Gaming A16 FA617 | |
| HWBOT x265 Benchmark v2.2 / 4k Preset | |
| Asus Zephyrus Duo 16 GX650PY-NM006W | |
| Lenovo Legion Pro 7 16IRX8H | |
| Average Intel Core i9-13980HX (27 - 33.4, n=9) | |
| Asus ROG Strix G16 G614JZ | |
| Razer Blade 16 Early 2023 | |
| Average of class Gaming (3 - 37.6, n=229, last 2 years) | |
| Gigabyte AERO 16 OLED BSF | |
| Asus TUF Gaming A16 FA617 | |
| LibreOffice / 20 Documents To PDF | |
| Asus Zephyrus Duo 16 GX650PY-NM006W | |
| Asus TUF Gaming A16 FA617 | |
| Gigabyte AERO 16 OLED BSF | |
| Average of class Gaming (32.8 - 332, n=223, last 2 years) | |
| Asus ROG Strix G16 G614JZ | |
| Razer Blade 16 Early 2023 | |
| Lenovo Legion Pro 7 16IRX8H | |
| Average Intel Core i9-13980HX (35 - 51.4, n=10) | |
| R Benchmark 2.5 / Overall mean | |
| Asus TUF Gaming A16 FA617 | |
| Gigabyte AERO 16 OLED BSF | |
| Average of class Gaming (0.3609 - 4.47, n=226, last 2 years) | |
| Razer Blade 16 Early 2023 | |
| Asus Zephyrus Duo 16 GX650PY-NM006W | |
| Lenovo Legion Pro 7 16IRX8H | |
| Average Intel Core i9-13980HX (0.3793 - 0.4462, n=10) | |
| Asus ROG Strix G16 G614JZ | |
* ... smaller is better
AIDA64: FP32 Ray-Trace | FPU Julia | CPU SHA3 | CPU Queen | FPU SinJulia | FPU Mandel | CPU AES | CPU ZLib | FP64 Ray-Trace | CPU PhotoWorxx
| Performance Rating | |
| Lenovo Legion Pro 7 16IRX8H | |
| Average Intel Core i9-13980HX | |
| Asus ROG Strix G16 G614JZ | |
| Razer Blade 16 Early 2023 | |
| Gigabyte AERO 16 OLED BSF | |
| Average of class Gaming | |
| Asus TUF Gaming A16 FA617 | |
| AIDA64 / FP32 Ray-Trace | |
| Asus ROG Strix G16 G614JZ | |
| Lenovo Legion Pro 7 16IRX8H | |
| Average Intel Core i9-13980HX (21332 - 29553, n=9) | |
| Razer Blade 16 Early 2023 | |
| Average of class Gaming (3069 - 60169, n=222, last 2 years) | |
| Gigabyte AERO 16 OLED BSF | |
| Asus TUF Gaming A16 FA617 | |
| AIDA64 / FPU Julia | |
| Lenovo Legion Pro 7 16IRX8H | |
| Average Intel Core i9-13980HX (108001 - 148168, n=9) | |
| Asus ROG Strix G16 G614JZ | |
| Razer Blade 16 Early 2023 | |
| Asus TUF Gaming A16 FA617 | |
| Average of class Gaming (18567 - 252486, n=222, last 2 years) | |
| Gigabyte AERO 16 OLED BSF | |
| AIDA64 / CPU SHA3 | |
| Lenovo Legion Pro 7 16IRX8H | |
| Asus ROG Strix G16 G614JZ | |
| Average Intel Core i9-13980HX (5264 - 7142, n=9) | |
| Razer Blade 16 Early 2023 | |
| Average of class Gaming (629 - 10389, n=222, last 2 years) | |
| Gigabyte AERO 16 OLED BSF | |
| Asus TUF Gaming A16 FA617 | |
| AIDA64 / CPU Queen | |
| Asus ROG Strix G16 G614JZ | |
| Average Intel Core i9-13980HX (126758 - 143409, n=9) | |
| Lenovo Legion Pro 7 16IRX8H | |
| Razer Blade 16 Early 2023 | |
| Average of class Gaming (15371 - 200651, n=222, last 2 years) | |
| Asus TUF Gaming A16 FA617 | |
| Gigabyte AERO 16 OLED BSF | |
| AIDA64 / FPU SinJulia | |
| Asus ROG Strix G16 G614JZ | |
| Average Intel Core i9-13980HX (13785 - 17117, n=9) | |
| Razer Blade 16 Early 2023 | |
| Lenovo Legion Pro 7 16IRX8H | |
| Asus TUF Gaming A16 FA617 | |
| Average of class Gaming (2137 - 32988, n=222, last 2 years) | |
| Gigabyte AERO 16 OLED BSF | |
| AIDA64 / FPU Mandel | |
| Lenovo Legion Pro 7 16IRX8H | |
| Average Intel Core i9-13980HX (53398 - 73758, n=9) | |
| Asus ROG Strix G16 G614JZ | |
| Razer Blade 16 Early 2023 | |
| Asus TUF Gaming A16 FA617 | |
| Average of class Gaming (10291 - 134044, n=222, last 2 years) | |
| Gigabyte AERO 16 OLED BSF | |
| AIDA64 / CPU AES | |
| Gigabyte AERO 16 OLED BSF | |
| Asus ROG Strix G16 G614JZ | |
| Lenovo Legion Pro 7 16IRX8H | |
| Average Intel Core i9-13980HX (105169 - 136520, n=9) | |
| Razer Blade 16 Early 2023 | |
| Average of class Gaming (19065 - 328679, n=222, last 2 years) | |
| Asus TUF Gaming A16 FA617 | |
| AIDA64 / CPU ZLib | |
| Lenovo Legion Pro 7 16IRX8H | |
| Asus ROG Strix G16 G614JZ | |
| Average Intel Core i9-13980HX (1513 - 2039, n=9) | |
| Razer Blade 16 Early 2023 | |
| Average of class Gaming (150.9 - 2409, n=222, last 2 years) | |
| Gigabyte AERO 16 OLED BSF | |
| Asus TUF Gaming A16 FA617 | |
| AIDA64 / FP64 Ray-Trace | |
| Lenovo Legion Pro 7 16IRX8H | |
| Asus ROG Strix G16 G614JZ | |
| Average Intel Core i9-13980HX (11431 - 16325, n=9) | |
| Razer Blade 16 Early 2023 | |
| Average of class Gaming (1518 - 31796, n=222, last 2 years) | |
| Gigabyte AERO 16 OLED BSF | |
| Asus TUF Gaming A16 FA617 | |
| AIDA64 / CPU PhotoWorxx | |
| Razer Blade 16 Early 2023 | |
| Lenovo Legion Pro 7 16IRX8H | |
| Average Intel Core i9-13980HX (37069 - 52949, n=9) | |
| Gigabyte AERO 16 OLED BSF | |
| Asus ROG Strix G16 G614JZ | |
| Average of class Gaming (10805 - 60161, n=223, last 2 years) | |
| Asus TUF Gaming A16 FA617 | |
System Performance
In the PCMark 10 test, the Asus ROG Strix G16 lags behind many competitors with similar hardware. The performance drop occurs in the Productivity sub-section, which takes into account the performance of the RAM and the hard drive. Both are suboptimal in the ROG Strix G16 compared to other current gaming laptops. Nevertheless, one cannot speak of low values here, for the Asus ROG Strix is still well above the average gaming notebook.
That the laptop is very powerful becomes clear when you look at the results of Crossmark as well as PCMark 10 Essentials and Content Creation: the Asus ROG Strix G16 is equipped for all eventualities. Aside from its primary competence in gaming, the laptop is also very versatile in everyday use. The powerful computing hardware ensures short loading times and a very responsive system.
CrossMark: Overall | Productivity | Creativity | Responsiveness
| PCMark 10 / Score | |
| Asus Zephyrus Duo 16 GX650PY-NM006W | |
| Asus ROG Strix Scar 18 2023 G834JY-N6005W | |
| Gigabyte AERO 16 OLED BSF | |
| Razer Blade 16 Early 2023 | |
| Lenovo Legion Pro 7 16IRX8H | |
| Average of class Gaming (5235 - 9852, n=197, last 2 years) | |
| Asus TUF Gaming A16 FA617 | |
| Asus ROG Strix G16 G614JZ | |
| Average Intel Core i9-13980HX, NVIDIA GeForce RTX 4080 Laptop GPU () | |
| Asus ROG Strix G18 G814JI | |
| PCMark 10 / Essentials | |
| Asus Zephyrus Duo 16 GX650PY-NM006W | |
| Asus ROG Strix G16 G614JZ | |
| Average Intel Core i9-13980HX, NVIDIA GeForce RTX 4080 Laptop GPU () | |
| Lenovo Legion Pro 7 16IRX8H | |
| Gigabyte AERO 16 OLED BSF | |
| Razer Blade 16 Early 2023 | |
| Average of class Gaming (8300 - 12334, n=196, last 2 years) | |
| Asus TUF Gaming A16 FA617 | |
| Asus ROG Strix G18 G814JI | |
| PCMark 10 / Productivity | |
| Asus Zephyrus Duo 16 GX650PY-NM006W | |
| Lenovo Legion Pro 7 16IRX8H | |
| Average of class Gaming (7244 - 11833, n=196, last 2 years) | |
| Asus TUF Gaming A16 FA617 | |
| Gigabyte AERO 16 OLED BSF | |
| Asus ROG Strix G18 G814JI | |
| Razer Blade 16 Early 2023 | |
| Asus ROG Strix G16 G614JZ | |
| Average Intel Core i9-13980HX, NVIDIA GeForce RTX 4080 Laptop GPU () | |
| PCMark 10 / Digital Content Creation | |
| Razer Blade 16 Early 2023 | |
| Asus Zephyrus Duo 16 GX650PY-NM006W | |
| Gigabyte AERO 16 OLED BSF | |
| Average of class Gaming (6462 - 18475, n=196, last 2 years) | |
| Asus ROG Strix G16 G614JZ | |
| Average Intel Core i9-13980HX, NVIDIA GeForce RTX 4080 Laptop GPU () | |
| Asus TUF Gaming A16 FA617 | |
| Lenovo Legion Pro 7 16IRX8H | |
| Asus ROG Strix G18 G814JI | |
| CrossMark / Overall | |
| Asus ROG Strix G16 G614JZ | |
| Average Intel Core i9-13980HX, NVIDIA GeForce RTX 4080 Laptop GPU () | |
| Asus ROG Strix Scar 18 2023 G834JY-N6005W | |
| Asus Zephyrus Duo 16 GX650PY-NM006W | |
| Gigabyte AERO 16 OLED BSF | |
| Average of class Gaming (1247 - 2334, n=167, last 2 years) | |
| Razer Blade 16 Early 2023 | |
| CrossMark / Productivity | |
| Asus ROG Strix G16 G614JZ | |
| Average Intel Core i9-13980HX, NVIDIA GeForce RTX 4080 Laptop GPU () | |
| Asus Zephyrus Duo 16 GX650PY-NM006W | |
| Asus ROG Strix Scar 18 2023 G834JY-N6005W | |
| Average of class Gaming (1299 - 2204, n=167, last 2 years) | |
| Gigabyte AERO 16 OLED BSF | |
| Razer Blade 16 Early 2023 | |
| CrossMark / Creativity | |
| Asus ROG Strix Scar 18 2023 G834JY-N6005W | |
| Asus ROG Strix G16 G614JZ | |
| Average Intel Core i9-13980HX, NVIDIA GeForce RTX 4080 Laptop GPU () | |
| Asus Zephyrus Duo 16 GX650PY-NM006W | |
| Average of class Gaming (1275 - 2514, n=167, last 2 years) | |
| Gigabyte AERO 16 OLED BSF | |
| Razer Blade 16 Early 2023 | |
| CrossMark / Responsiveness | |
| Asus ROG Strix G16 G614JZ | |
| Average Intel Core i9-13980HX, NVIDIA GeForce RTX 4080 Laptop GPU () | |
| Gigabyte AERO 16 OLED BSF | |
| Average of class Gaming (1030 - 2330, n=167, last 2 years) | |
| Asus Zephyrus Duo 16 GX650PY-NM006W | |
| Asus ROG Strix Scar 18 2023 G834JY-N6005W | |
| Razer Blade 16 Early 2023 | |
| PCMark 10 Score | 7223 points | |
Help | ||
| AIDA64 / Memory Copy | |
| Lenovo Legion Pro 7 16IRX8H | |
| Razer Blade 16 Early 2023 | |
| Average Intel Core i9-13980HX (62189 - 80776, n=9) | |
| Asus ROG Strix Scar 18 2023 G834JY-N6005W | |
| Gigabyte AERO 16 OLED BSF | |
| Asus ROG Strix G18 G814JI | |
| Asus ROG Strix G16 G614JZ | |
| Average of class Gaming (21842 - 92565, n=222, last 2 years) | |
| Asus TUF Gaming A16 FA617 | |
| AIDA64 / Memory Read | |
| Lenovo Legion Pro 7 16IRX8H | |
| Razer Blade 16 Early 2023 | |
| Average Intel Core i9-13980HX (62624 - 89096, n=9) | |
| Asus ROG Strix Scar 18 2023 G834JY-N6005W | |
| Asus ROG Strix G16 G614JZ | |
| Asus ROG Strix G18 G814JI | |
| Gigabyte AERO 16 OLED BSF | |
| Average of class Gaming (24879 - 90647, n=222, last 2 years) | |
| Asus TUF Gaming A16 FA617 | |
| AIDA64 / Memory Write | |
| Razer Blade 16 Early 2023 | |
| Lenovo Legion Pro 7 16IRX8H | |
| Average Intel Core i9-13980HX (59912 - 79917, n=9) | |
| Gigabyte AERO 16 OLED BSF | |
| Asus ROG Strix Scar 18 2023 G834JY-N6005W | |
| Average of class Gaming (21619 - 103259, n=222, last 2 years) | |
| Asus ROG Strix G18 G814JI | |
| Asus ROG Strix G16 G614JZ | |
| Asus TUF Gaming A16 FA617 | |
| AIDA64 / Memory Latency | |
| Razer Blade 16 Early 2023 | |
| Gigabyte AERO 16 OLED BSF | |
| Asus ROG Strix Scar 18 2023 G834JY-N6005W | |
| Asus ROG Strix G16 G614JZ | |
| Average Intel Core i9-13980HX (79.4 - 93.2, n=9) | |
| Average of class Gaming (59.5 - 152.5, n=219, last 2 years) | |
| Asus TUF Gaming A16 FA617 | |
| Asus ROG Strix G18 G814JI | |
| Lenovo Legion Pro 7 16IRX8H | |
* ... smaller is better
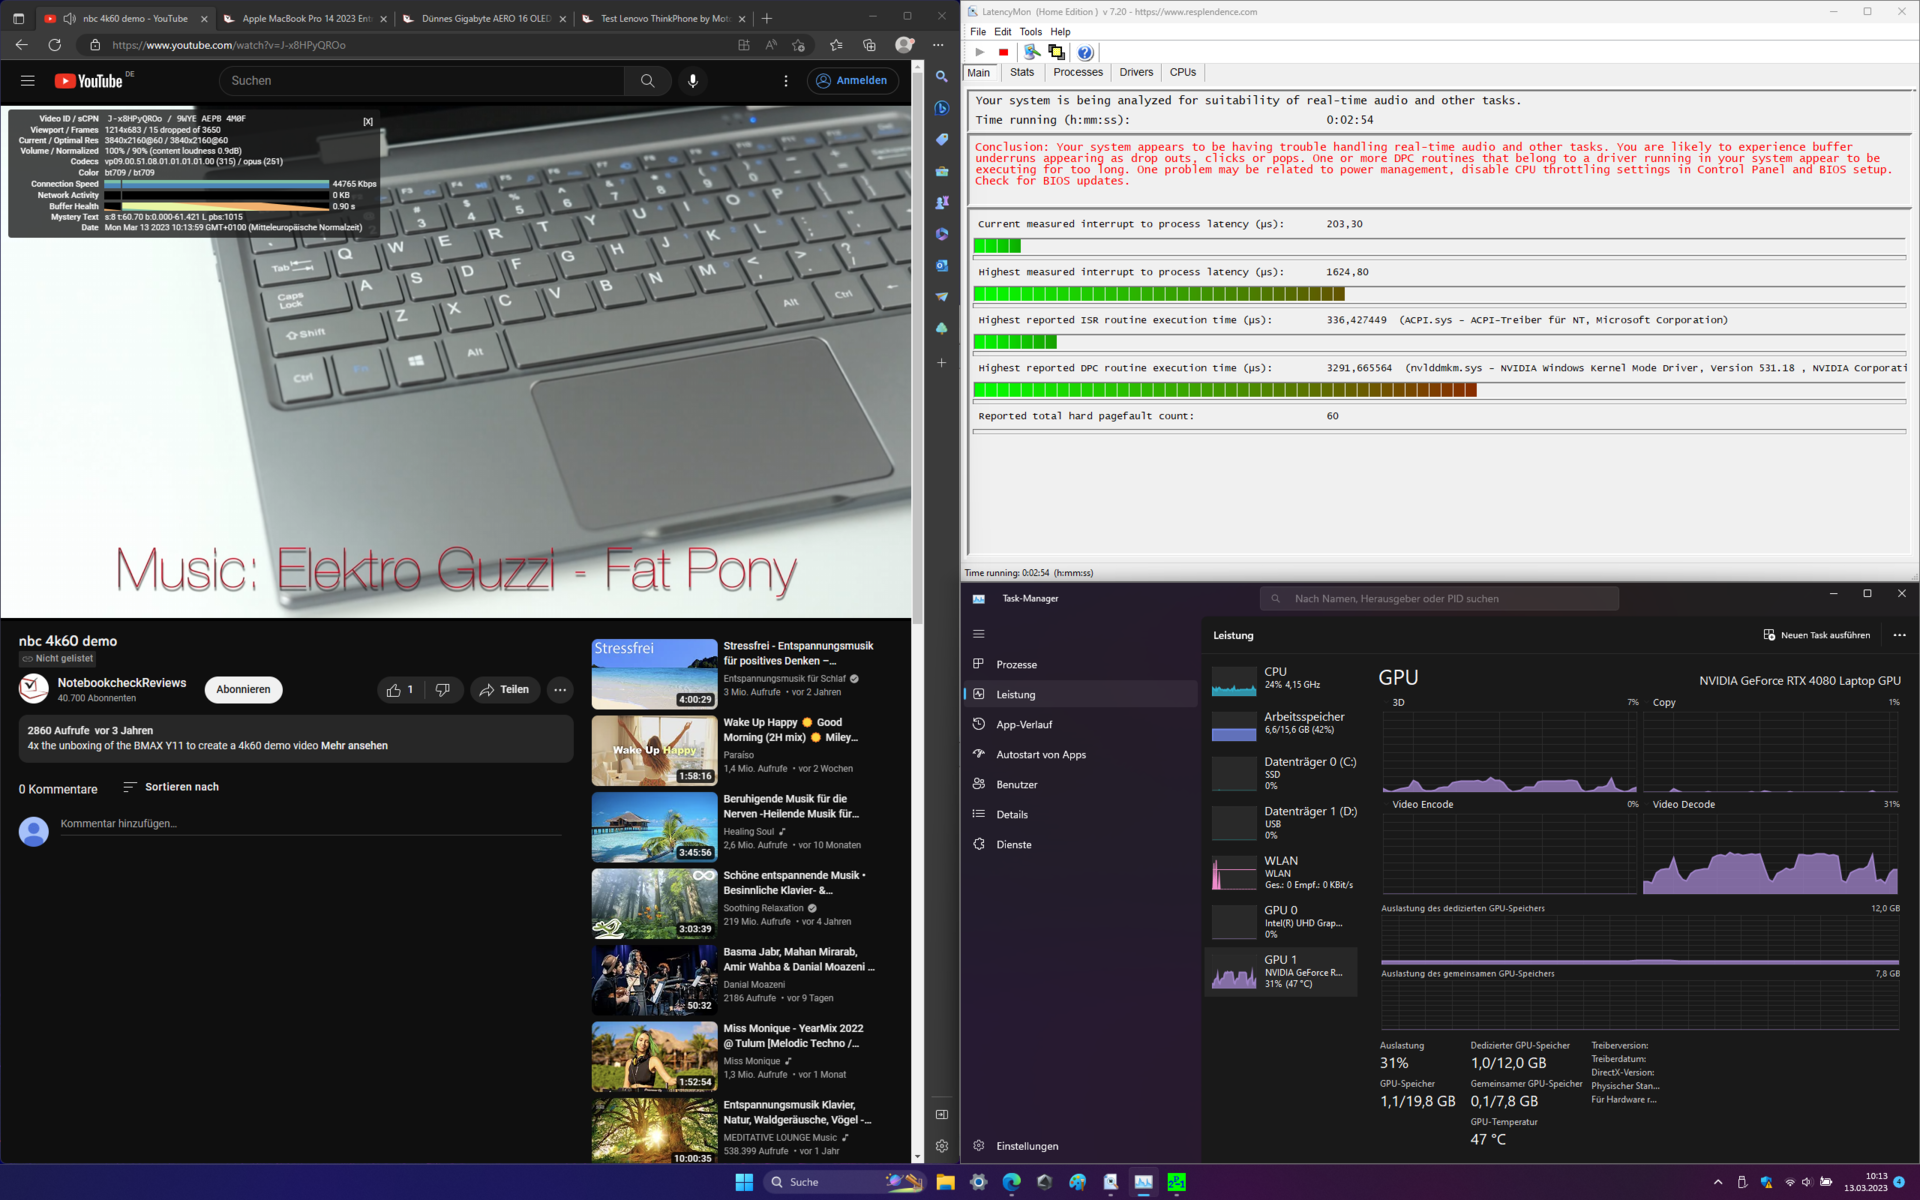
DPC Latency
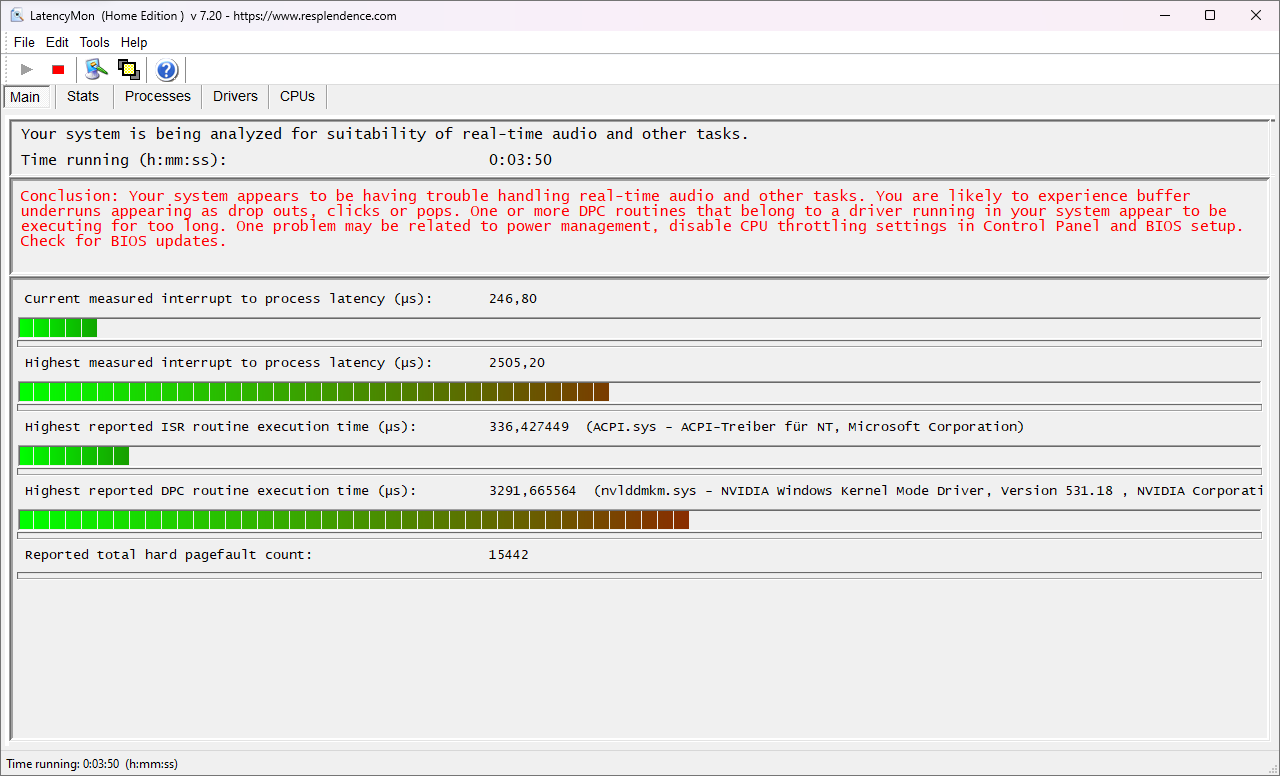
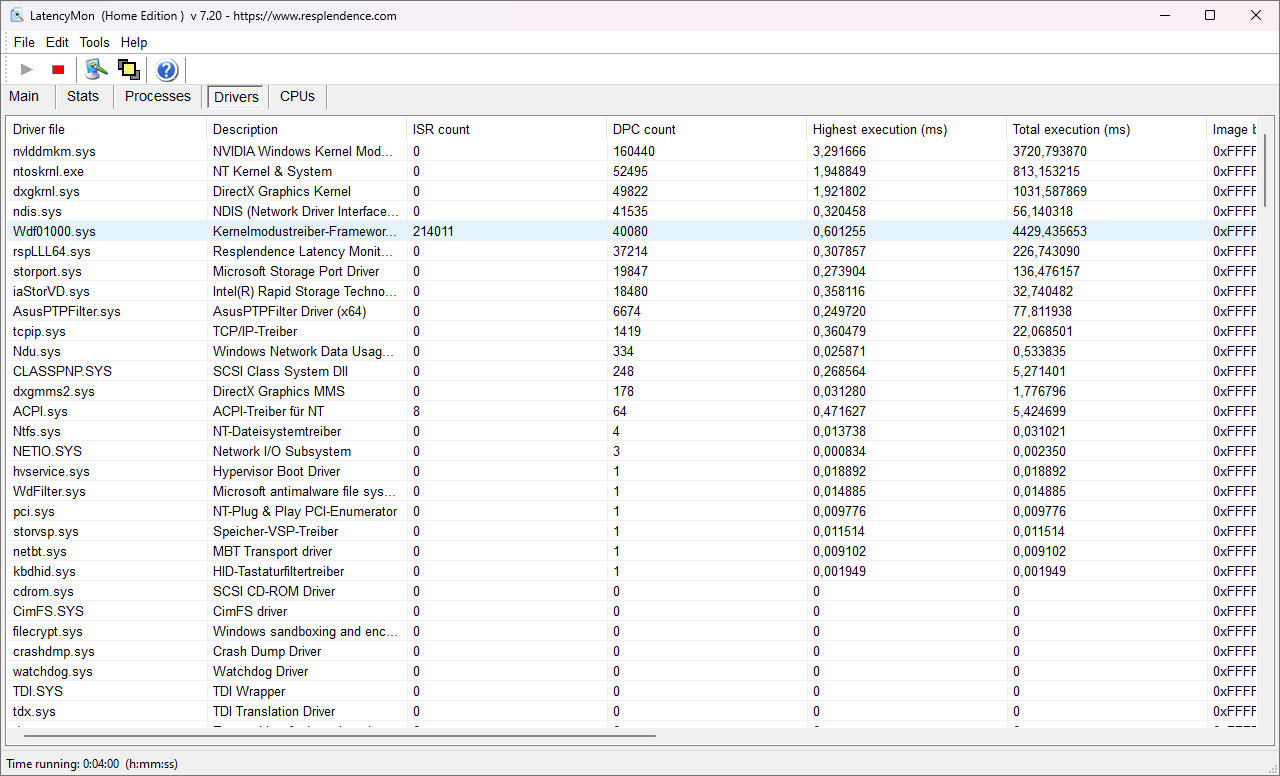
In the current driver configuration at the time of review, the DPC latencies of the ROG Strix G16 were relatively high. Real-time applications such as audio processing could therefore run into trouble here.
| DPC Latencies / LatencyMon - interrupt to process latency (max), Web, Youtube, Prime95 | |
| Asus Zephyrus Duo 16 GX650PY-NM006W | |
| Asus ROG Strix G16 G614JZ | |
| Razer Blade 16 Early 2023 | |
| Gigabyte AERO 16 OLED BSF | |
| Lenovo Legion Pro 7 16IRX8H | |
| Asus TUF Gaming A16 FA617 | |
* ... smaller is better
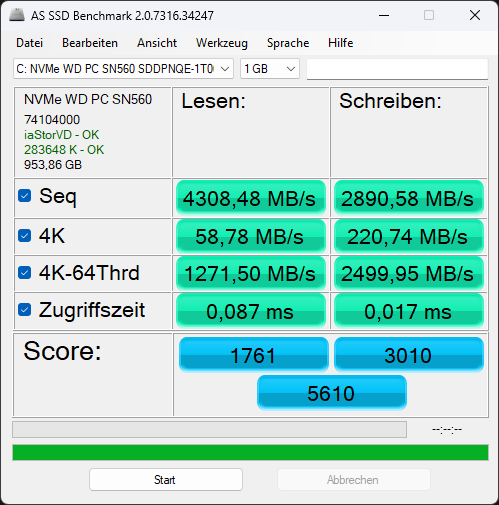
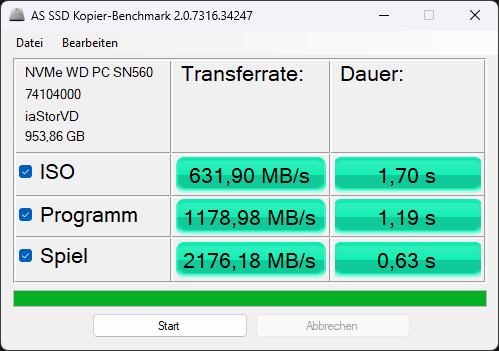
Storage Devices
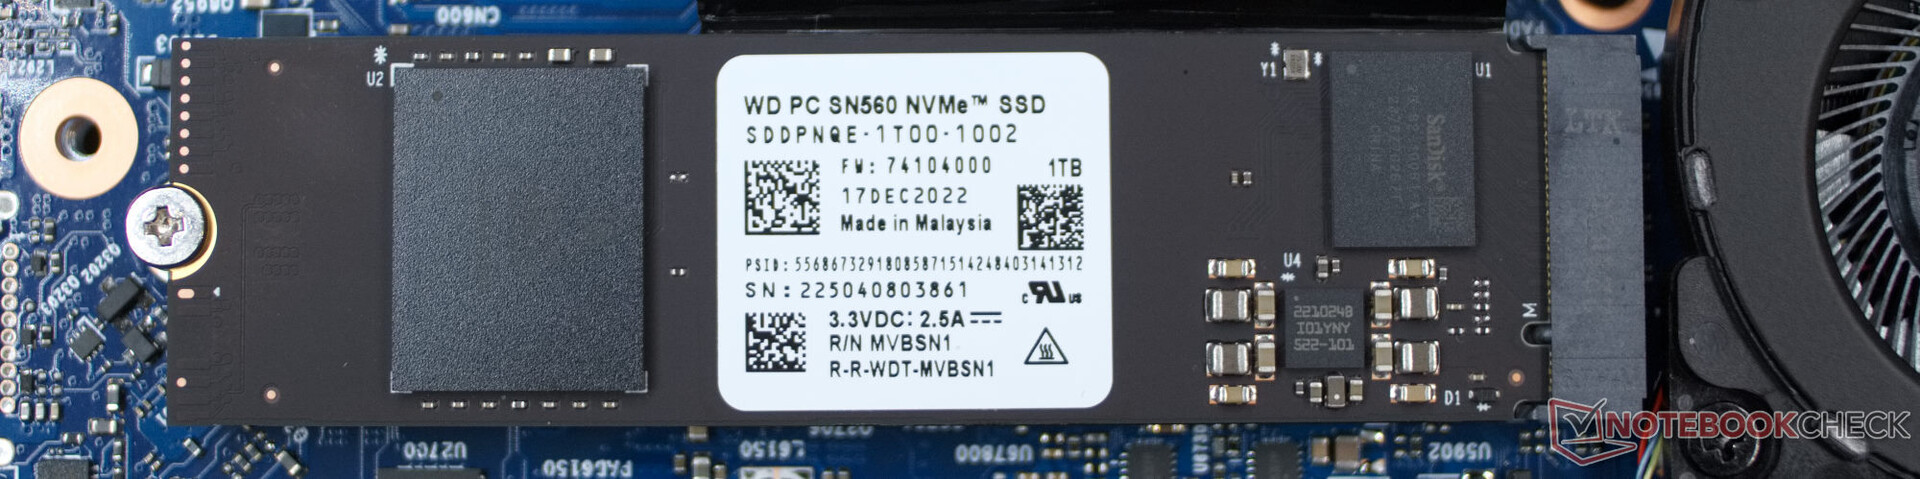
The Western Digital PC SN560 NVMe SSD is not really slow, but it doesn't quite come close to the extremely fast hard drives of several other gaming notebooks in the comparison field. So the SSD has to settle for a place in the midfield. For the performance of the Asus ROG Strix G16, this means only minor performance losses and possibly slightly longer loading times in some games.

* ... smaller is better
Sustained Read Performance: DiskSpd Read Loop, Queue Depth 8
Graphics Card
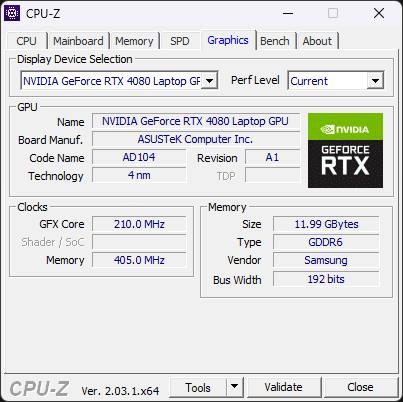
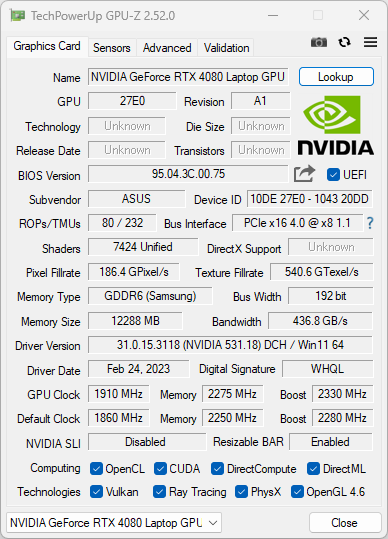
The RTX 4080 takes second place in Nvidia's latest generation of graphics cards. The powerful AD104 chip is supported by 12 GB of GDDR6X memory and offers a maximum of 7,680 shaders and 232 tensor cores. Asus also relies on high performance rates for the graphics chip. In Turbo mode, the RTX 4080 is able to work continuously with around 170 watts. This puts the graphics performance of the Strix G16 within striking distance of the Asus ROG Strix Scar 18. However, this notebook has the RTX 4090 with similar cooling. The RTX 4080 is thus in the sweet spot in terms of a balance between cooling options and graphics performance.
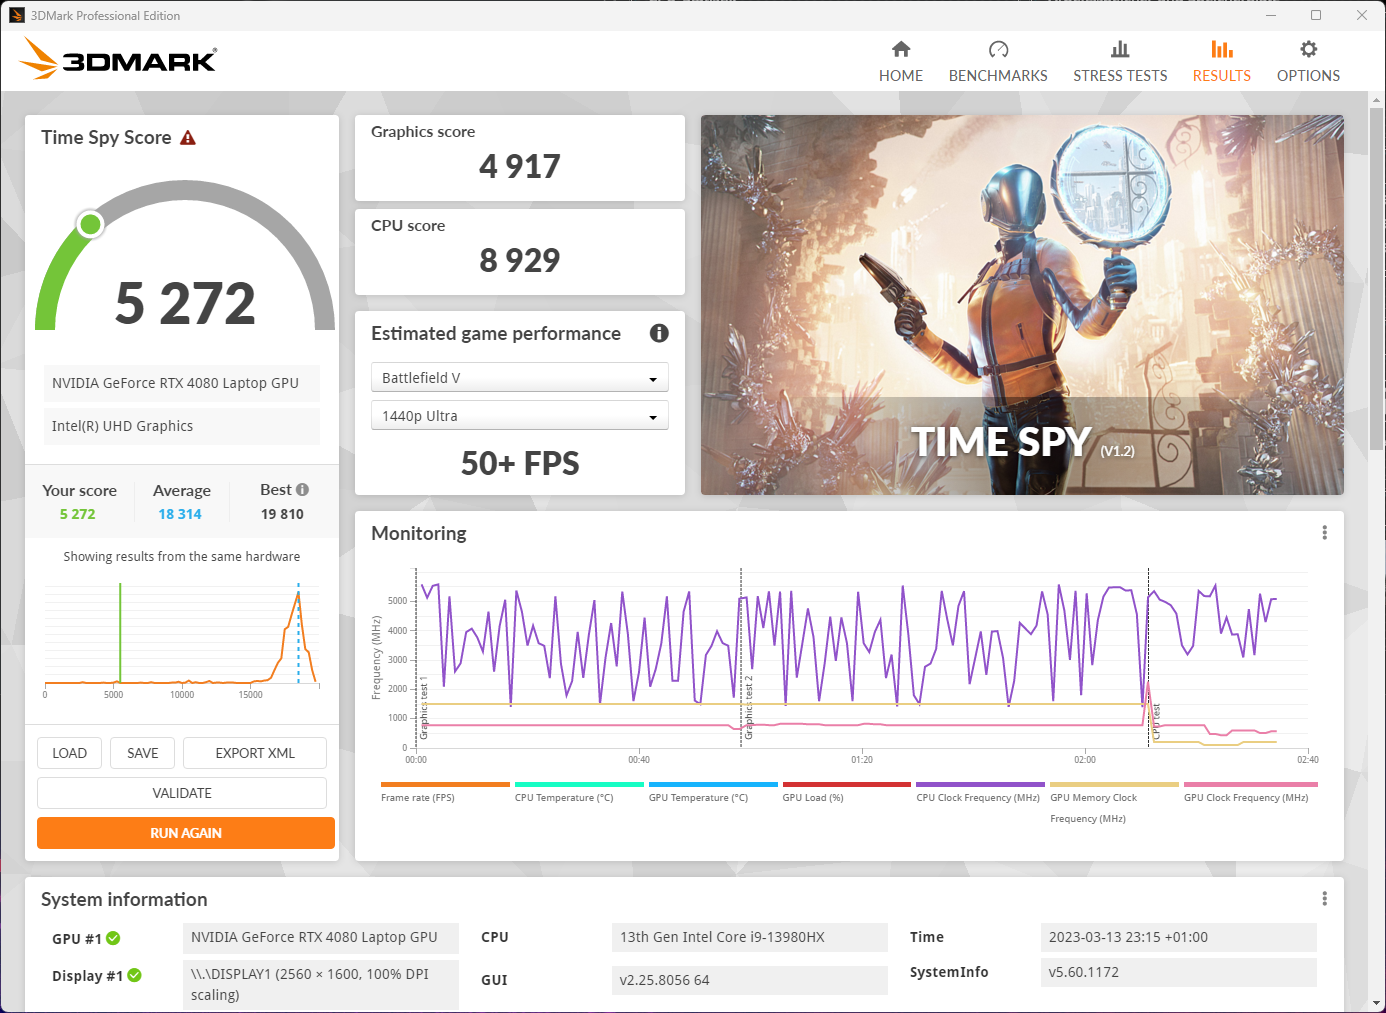
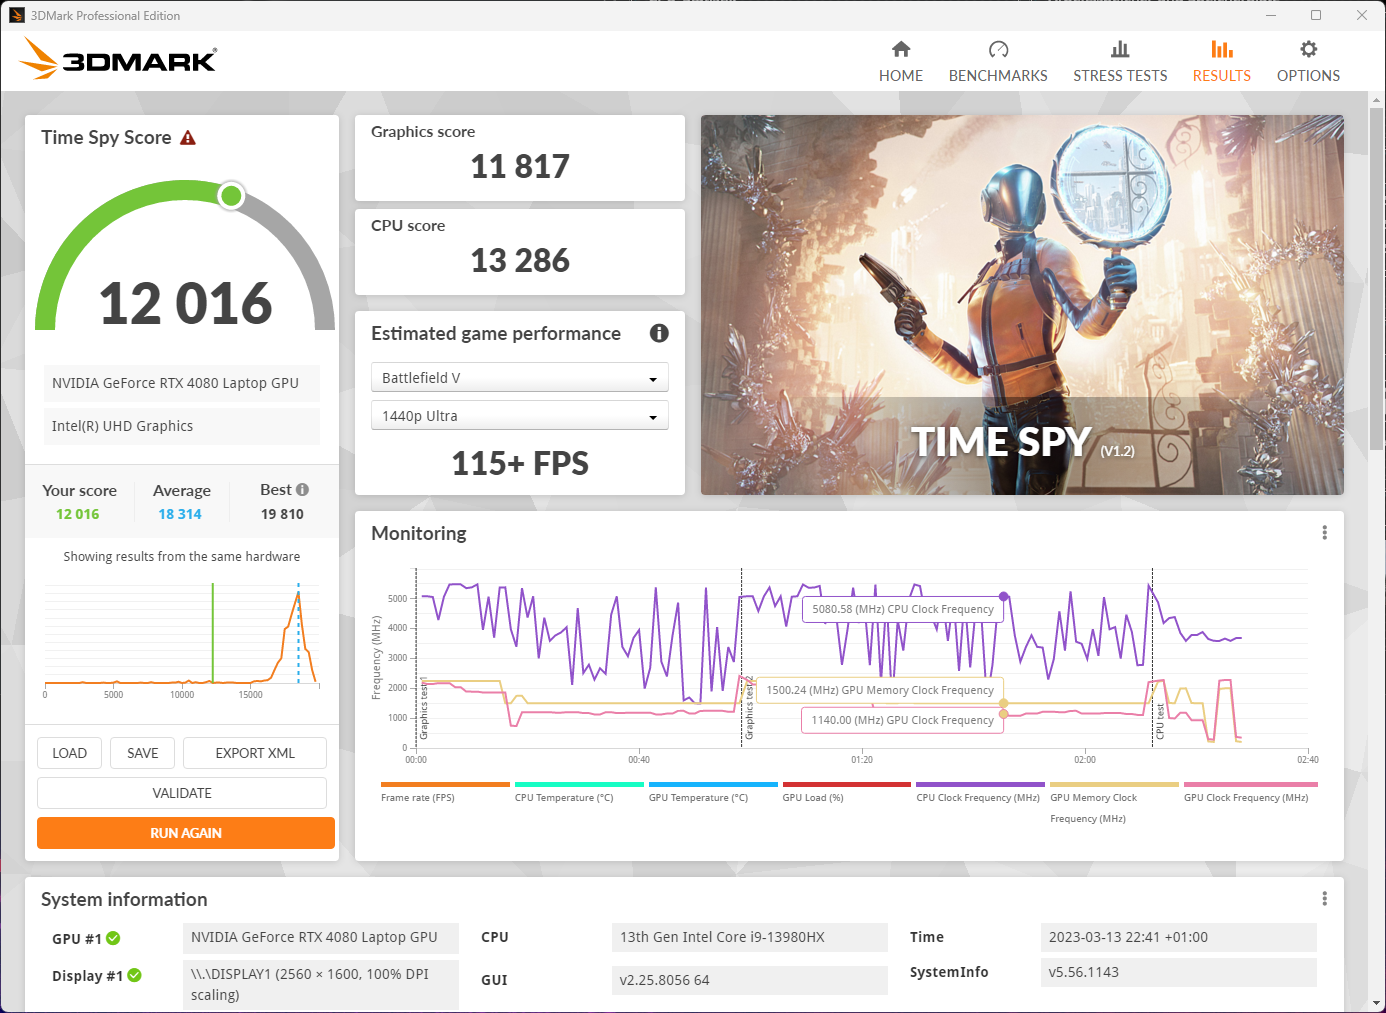
The high graphics performance of the ROG Strix G16 in quiet mode is also interesting. Here we can again draw a direct comparison to another Asus ROG device: The ROG Strix G18 with its RTX 4070 achieves 12,111 points in the Time Spy benchmark with Performance mode activated. The RTX 4080 in the G16 achieves 11,817 points in Silent mode. So the gaming notebook can run quietly without sacrificing good graphics performance.


| 3DMark 11 Performance | 44528 points | |
| 3DMark Ice Storm Standard Score | 288532 points | |
| 3DMark Cloud Gate Standard Score | 72794 points | |
| 3DMark Fire Strike Score | 34456 points | |
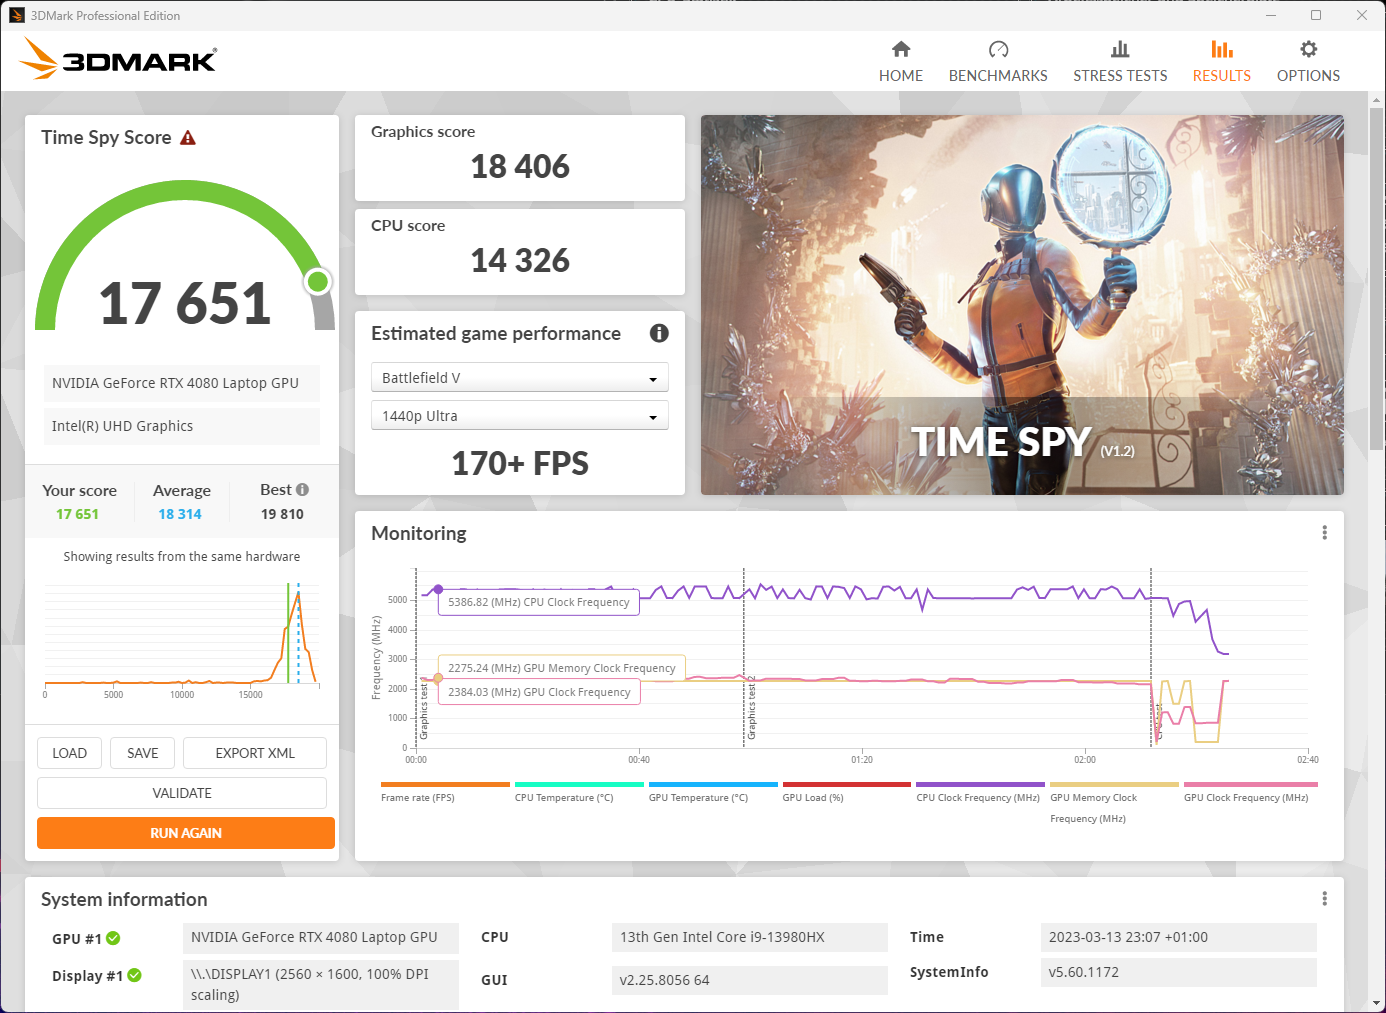
| 3DMark Time Spy Score | 18495 points | |
Help | ||
* ... smaller is better
Gaming Performance
Thanks to the ample graphics performance values of the RTX 4080, high frame rates (FPS) are possible in many current titles, even at the highest quality settings and in QHD resolution. The graphics chip can also handle ray tracing well. In the native resolution of 2560 × 1600, however, the display's 240 Hz can only be fully utilized in undemanding games or at reduced quality settings.
After the strong results in Silent mode, we didn't miss the chance to test the gaming performance of the ROG Strix G16 in this mode as well. The result: Silent mode is suitable for gaming. Hence, those who are not after the highest FPS should not be shy in using the mode. In the F1 22 benchmark, there was occasionally only a difference of 30 FPS between Silent- and Performance mode. The graphics unit also handles ray tracing very well at 72 FPS. None of the tested games lagged despite the lower cooling.
| The Witcher 3 - 1920x1080 Ultra Graphics & Postprocessing (HBAO+) | |
| Asus Zephyrus Duo 16 GX650PY-NM006W | |
| Lenovo Legion Pro 7 16IRX8H | |
| Razer Blade 16 Early 2023 | |
| Asus ROG Strix G16 G614JZ | |
| Asus ROG Strix G18 G814JI | |
| Average of class Gaming (8.61 - 216, n=225, last 2 years) | |
| Gigabyte AERO 16 OLED BSF | |
| Asus TUF Gaming A16 FA617 | |
| Hogwarts Legacy | |
| 1920x1080 Ultra Preset + Full Ray Tracing AA:High T | |
| Average NVIDIA GeForce RTX 4080 Laptop GPU (53 - 66, n=2) | |
| Asus ROG Strix G16 G614JZ | |
| Average of class Gaming (26.8 - 67, n=13, last 2 years) | |
| Asus ROG Strix G18 G814JI | |
| 2560x1440 Ultra Preset AA:High T | |
| Asus ROG Strix G16 G614JZ | |
| Average NVIDIA GeForce RTX 4080 Laptop GPU (76 - 102, n=3) | |
| Asus ROG Strix G18 G814JI | |
| Average of class Gaming (35 - 125.9, n=16, last 2 years) | |
| 1920x1080 Ultra Preset AA:High T | |
| Asus ROG Strix G16 G614JZ | |
| Average NVIDIA GeForce RTX 4080 Laptop GPU (108 - 131, n=3) | |
| Asus ROG Strix G18 G814JI | |
| Average of class Gaming (10.3 - 166.1, n=25, last 2 years) | |
| 1920x1080 High Preset AA:High T | |
| Asus ROG Strix G16 G614JZ | |
| Average NVIDIA GeForce RTX 4080 Laptop GPU (134 - 161.6, n=3) | |
| Asus ROG Strix G18 G814JI | |
| Average of class Gaming (12.8 - 186.5, n=24, last 2 years) | |
| GRID Legends | |
| 2560x1440 Ultra Preset | |
| Asus ROG Strix G16 G614JZ | |
| Average NVIDIA GeForce RTX 4080 Laptop GPU () | |
| Average of class Gaming (20.2 - 190, n=11, last 2 years) | |
| 1920x1080 Ultra Preset | |
| Asus ROG Strix G16 G614JZ | |
| Average NVIDIA GeForce RTX 4080 Laptop GPU () | |
| Average of class Gaming (14.3 - 199, n=17, last 2 years) | |
| 1920x1080 High Preset | |
| Asus ROG Strix G16 G614JZ | |
| Average NVIDIA GeForce RTX 4080 Laptop GPU () | |
| Average of class Gaming (21.2 - 210, n=16, last 2 years) | |
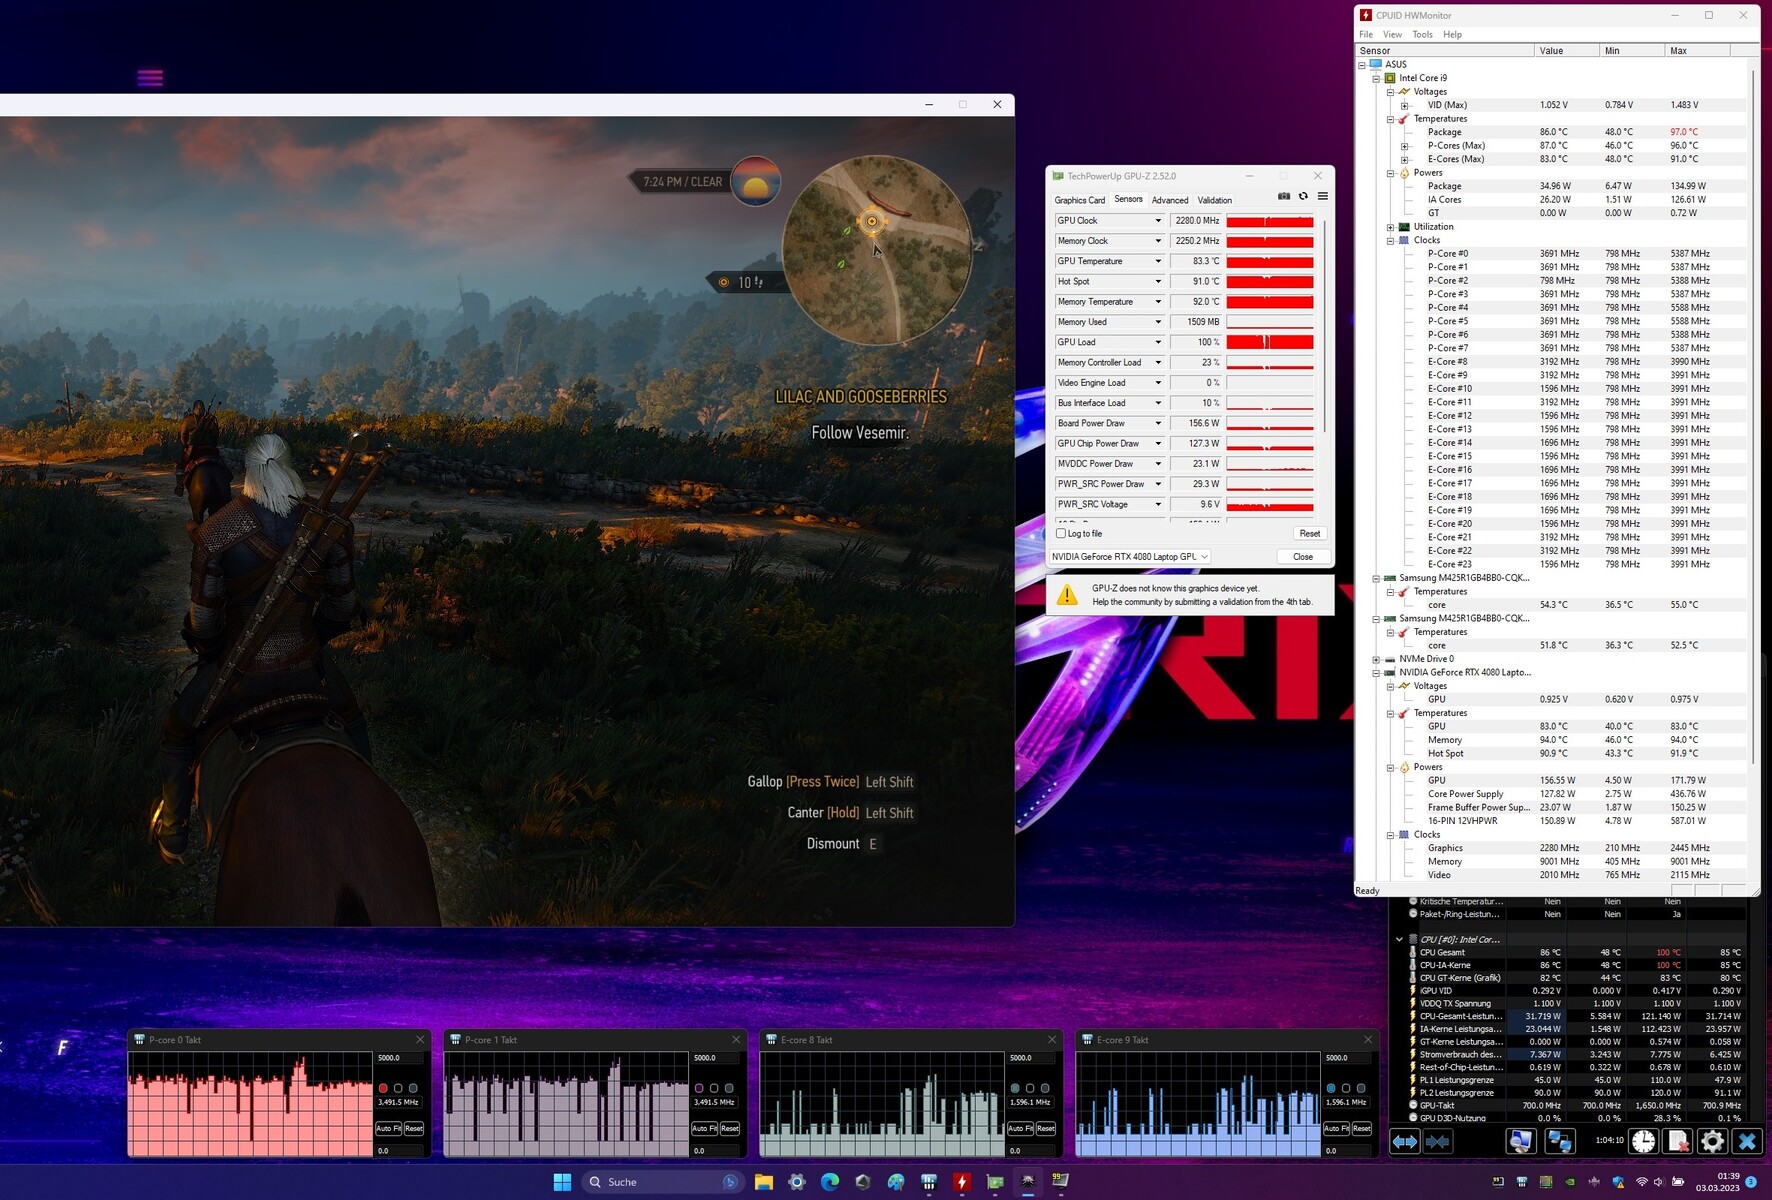
The long-term test with Witcher 3 shows that the G16 can maintain its performance over long stretches of time. The slight fluctuations in FPS here are due to the day-night cycle. Among other things, this changes the range of vision in the game.
Witcher 3 FPS Chart
| low | med. | high | ultra | QHD | 4K | |
| GTA V (2015) | 186.9 | 186.4 | 183 | 146.1 | 131.4 | |
| The Witcher 3 (2015) | 175 | |||||
| Dota 2 Reborn (2015) | 233 | 205 | 193.9 | 180.7 | 182.6 | |
| Final Fantasy XV Benchmark (2018) | 224 | 201 | 168.1 | 128.3 | 74.2 | |
| X-Plane 11.11 (2018) | 192.2 | 181 | 138.8 | |||
| Strange Brigade (2018) | 497 | 399 | 369 | 338 | 241 | |
| GRID Legends (2022) | 241 | 220 | 199 | 187 | 158 | |
| Cyberpunk 2077 1.6 (2022) | 123.48 | 121.41 | 81.98 | |||
| F1 22 (2022) | 312 | 294 | 263 | 117 | ||
| FIFA 23 (2022) | 165 | 158 | 160 | 155 | ||
| Call of Duty Modern Warfare 2 2022 (2022) | 154 | 145 | 108 | |||
| Hogwarts Legacy (2023) | 207 | 178.5 | 161.6 | 131 | 102 |
Emissions - The ROG Strix can also be quiet
Noise
The three fans of the ROG Strix G16 create a lot of wind, but also a considerable amount of noise, depending on the power setting. At 52 dB(A), the fans drown out a lot of the environmental noise and also other kinds of noise from the notebook that would be otherwise audible. If desired, the gaming notebook can also be quiet, but this doesn't necessarily mean that you have to rely on headphones, since the notebook remains in a tolerable range with a maximum of 40 dB(A) in Silent mode and still has enough power for gaming. However, a coil whine then becomes clearly audible. Whenever the CPU and GPU are running in Turbo mode, you can hear the VRMs or other components of the notebook beeping. When gaming with the speakers on, the coil whine is no longer as noticeable.
Noise Level
| Idle |
| 26 / 28 / 30 dB(A) |
| Load |
| 48 / 52 dB(A) |
 | ||
30 dB silent 40 dB(A) audible 50 dB(A) loud |
||
min: | ||
| Asus ROG Strix G16 G614JZ i9-13980HX, NVIDIA GeForce RTX 4080 Laptop GPU | Asus Zephyrus Duo 16 GX650PY-NM006W R9 7945HX, NVIDIA GeForce RTX 4090 Laptop GPU | Lenovo Legion Pro 7 16IRX8H i9-13900HX, NVIDIA GeForce RTX 4080 Laptop GPU | Gigabyte AERO 16 OLED BSF i9-13900H, NVIDIA GeForce RTX 4070 Laptop GPU | Asus TUF Gaming A16 FA617 R7 7735HS, Radeon RX 7600S | Razer Blade 16 Early 2023 i9-13950HX, NVIDIA GeForce RTX 4080 Laptop GPU | |
|---|---|---|---|---|---|---|
| Noise | -4% | -4% | 0% | 6% | 11% | |
| off / environment * | 25 | 23.9 4% | 24 4% | 23 8% | 24 4% | 23 8% |
| Idle Minimum * | 26 | 23.9 8% | 26 -0% | 23 12% | 24 8% | 23 12% |
| Idle Average * | 28 | 32.9 -18% | 28 -0% | 23 18% | 25 11% | 23 18% |
| Idle Maximum * | 30 | 36.5 -22% | 34 -13% | 33.64 -12% | 28 7% | 23.6 21% |
| Load Average * | 48 | 42.9 11% | 47 2% | 51.49 -7% | 42 12% | 39 19% |
| Witcher 3 ultra * | 49 | 51.2 -4% | 55 -12% | 55.27 -13% | 50 -2% | 51.6 -5% |
| Load Maximum * | 52 | 56 -8% | 56 -8% | 55.24 -6% | 50 4% | 51.3 1% |
* ... smaller is better
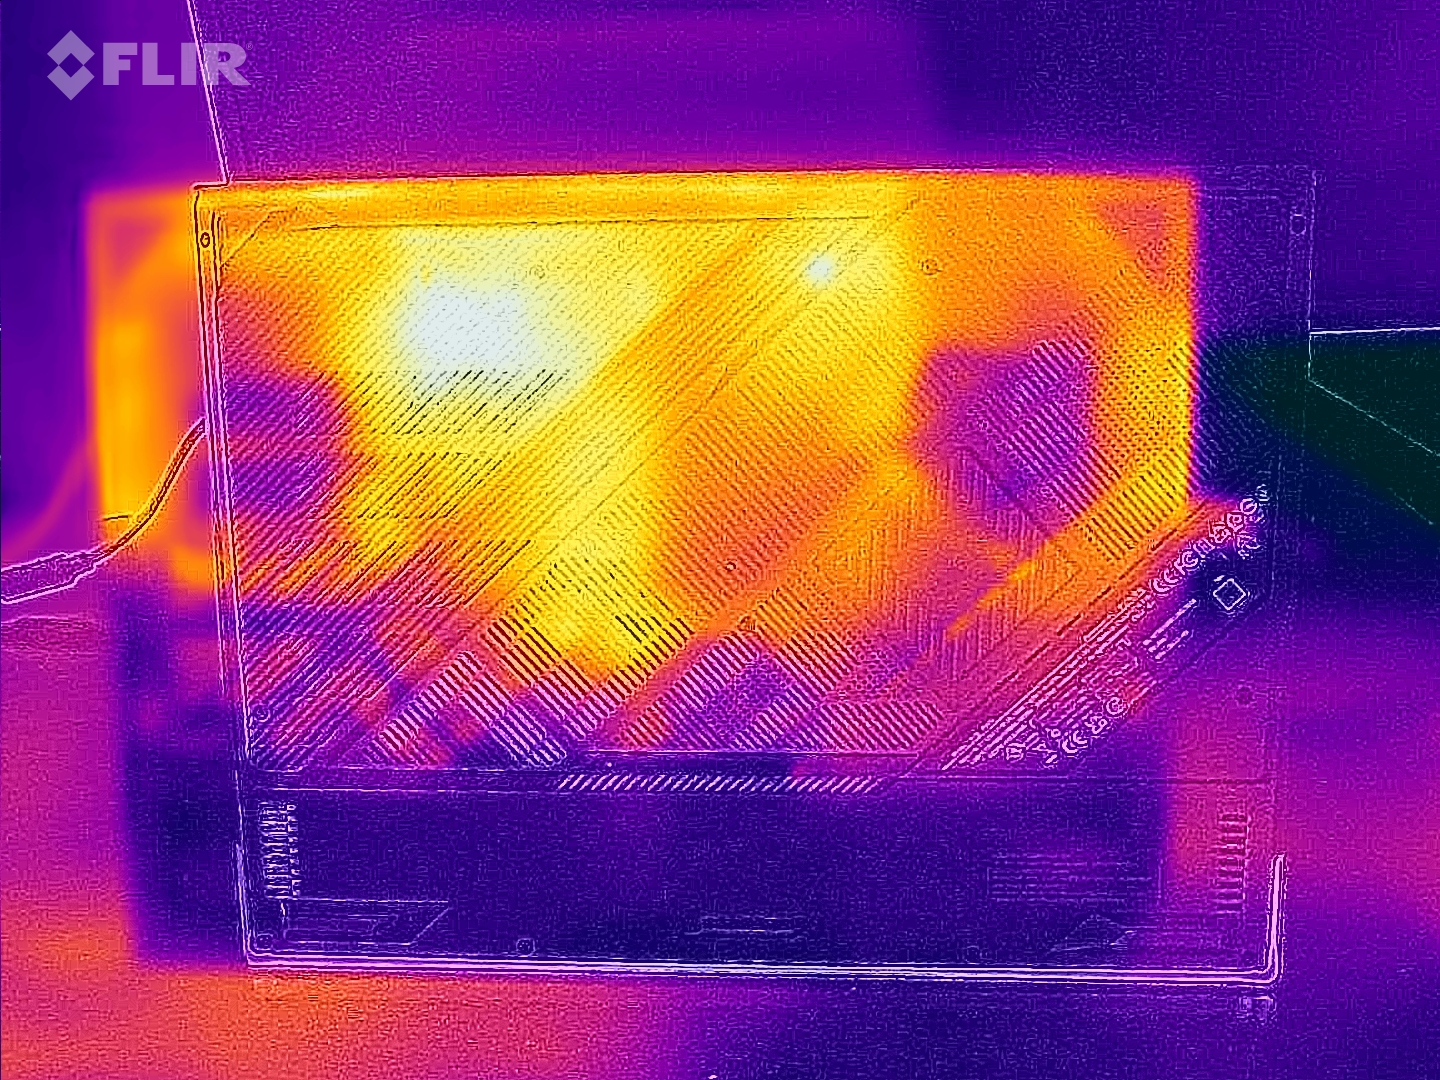
Temperature
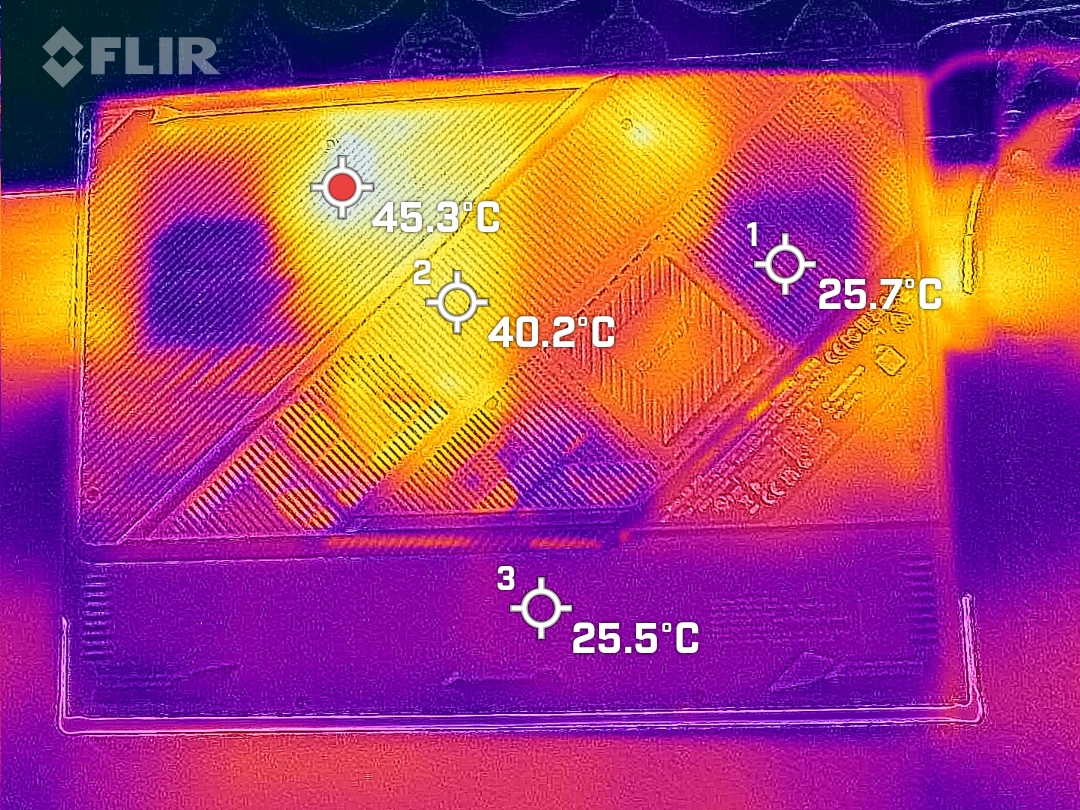
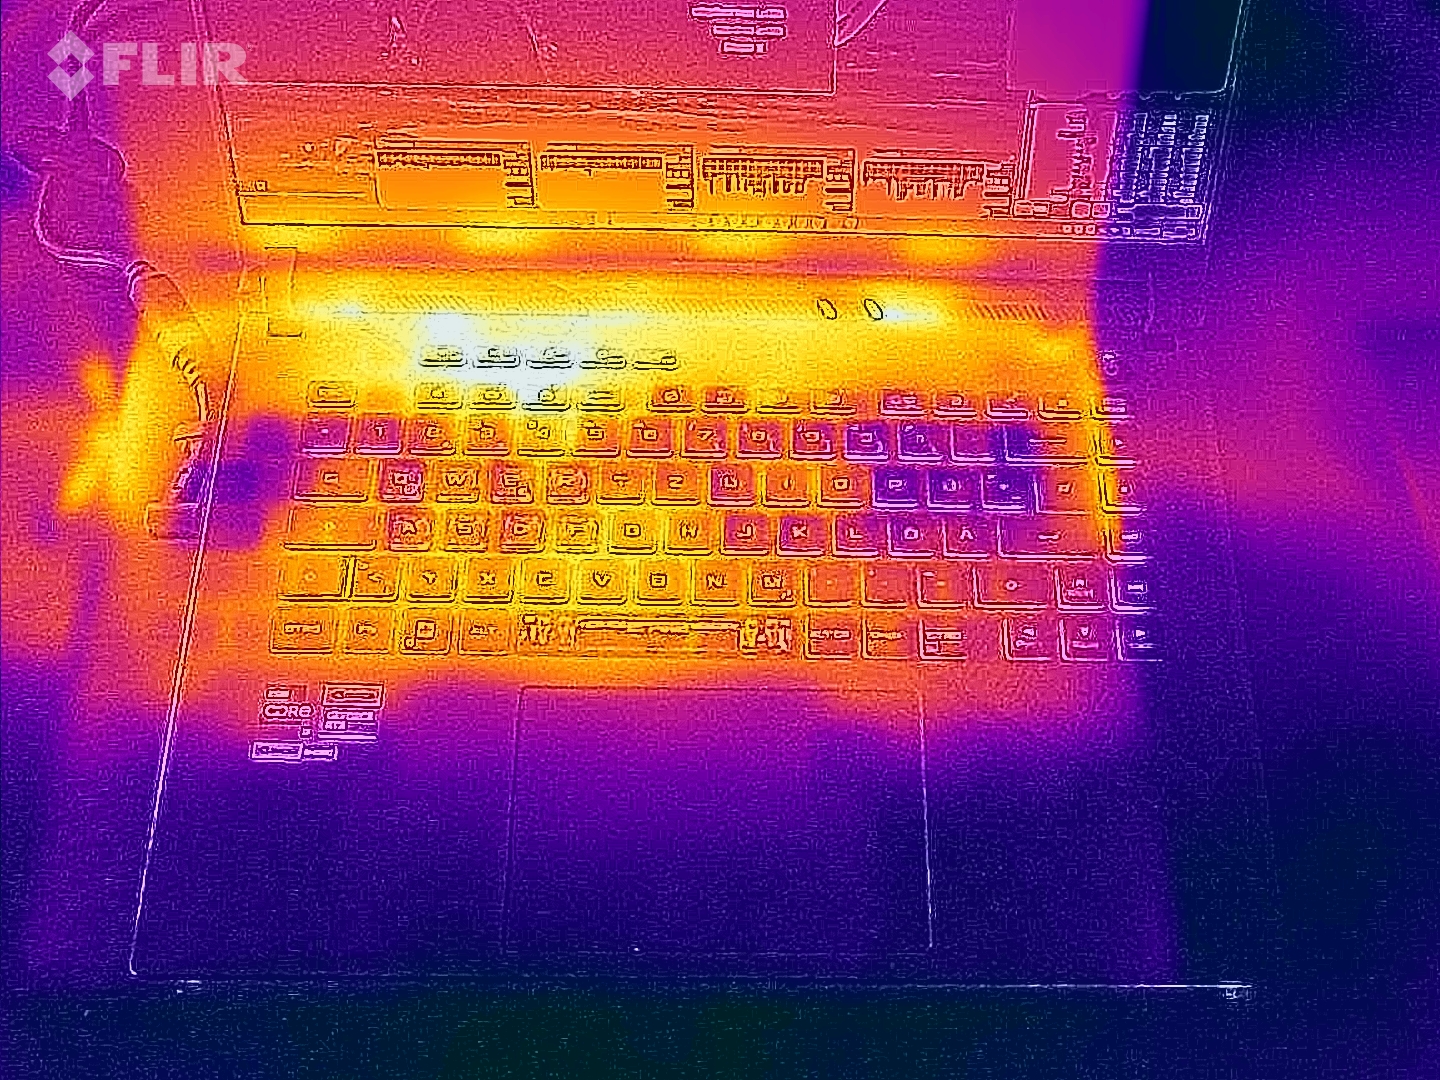
The powerful hardware heats up the case of the ROG Strix G16 quite a bit. During gaming, the temperatures at the top of the notebook rise to up to 54°C. Fortunately, the gaming notebook's fans are located directly under the WASD keys. Here the temperature drops noticeably, so you don't burn your fingers while playing. The palm rests always stay cool. You should place the notebook on a solid surface when gaming.
The situation is different when the load is lower. Whether idling, editing photos and videos, or even CAD drawing, the ROG Strix G16 doesn't really get warm. At almost 30°C on the underside, the operating heat is much more tolerable than in the load scenario.
(-) The maximum temperature on the upper side is 54 °C / 129 F, compared to the average of 40.4 °C / 105 F, ranging from 21.2 to 68.8 °C for the class Gaming.
(-) The bottom heats up to a maximum of 55 °C / 131 F, compared to the average of 43.2 °C / 110 F
(+) In idle usage, the average temperature for the upper side is 27.6 °C / 82 F, compared to the device average of 33.8 °C / 93 F.
(-) Playing The Witcher 3, the average temperature for the upper side is 40.1 °C / 104 F, compared to the device average of 33.8 °C / 93 F.
(±) The palmrests and touchpad can get very hot to the touch with a maximum of 38 °C / 100.4 F.
(-) The average temperature of the palmrest area of similar devices was 28.9 °C / 84 F (-9.1 °C / -16.4 F).
| Asus ROG Strix G16 G614JZ Intel Core i9-13980HX, NVIDIA GeForce RTX 4080 Laptop GPU | Asus Zephyrus Duo 16 GX650PY-NM006W AMD Ryzen 9 7945HX, NVIDIA GeForce RTX 4090 Laptop GPU | Lenovo Legion Pro 7 16IRX8H Intel Core i9-13900HX, NVIDIA GeForce RTX 4080 Laptop GPU | Gigabyte AERO 16 OLED BSF Intel Core i9-13900H, NVIDIA GeForce RTX 4070 Laptop GPU | Asus TUF Gaming A16 FA617 AMD Ryzen 7 7735HS, AMD Radeon RX 7600S | Razer Blade 16 Early 2023 Intel Core i9-13950HX, NVIDIA GeForce RTX 4080 Laptop GPU | |
|---|---|---|---|---|---|---|
| Heat | 10% | -4% | 23% | -11% | 13% | |
| Maximum Upper Side * | 54 | 44.2 18% | 48 11% | 41 24% | 54 -0% | 40 26% |
| Maximum Bottom * | 55 | 46.8 15% | 49 11% | 47 15% | 47 15% | 37.6 32% |
| Idle Upper Side * | 29 | 29.2 -1% | 40 -38% | 23 21% | 40 -38% | 32.4 -12% |
| Idle Bottom * | 33 | 30.2 8% | 33 -0% | 23 30% | 40 -21% | 31.4 5% |
* ... smaller is better
Stress Testing
Liquid metal and three fans in combination with the massive heat sinks should ensure stable temperatures. In stress testing, equilibrium is reached after about eight to ten minutes. From then on, temperatures of the CPU and GPU move between 83 and 88 °C. The i9 works constantly at around 55 watts, the RTX 4080 at around 140 watts. The hotspots of the GeForce RTX 4080 are striking, which are clearly above average at almost 93 °C. Such high hotspots should not occur in the presence of good liquid metal cooling.

Speakers
Four speaker modules are installed in the ROG Strix G16. Two downward-facing full-range drivers in the front part of the base are complemented by two tweeters between the hinges. This allows for a good sound landscape, even if the basses are a little weak. The mids and highs are very well balanced. At 83 dB(A) maximum volume, the speakers also drown out the fans of the gaming notebook. Headphones can be dispensed with here, even if the 3.5 mm headphone jack and Bluetooth 5.2 offer the option of connecting external speakers and headsets.
Asus ROG Strix G16 G614JZ audio analysis
(+) | speakers can play relatively loud (87 dB)
Bass 100 - 315 Hz
(-) | nearly no bass - on average 16.6% lower than median
(±) | linearity of bass is average (8.7% delta to prev. frequency)
Mids 400 - 2000 Hz
(+) | balanced mids - only 1.9% away from median
(+) | mids are linear (4.1% delta to prev. frequency)
Highs 2 - 16 kHz
(+) | balanced highs - only 3.8% away from median
(+) | highs are linear (6.2% delta to prev. frequency)
Overall 100 - 16.000 Hz
(+) | overall sound is linear (12.2% difference to median)
Compared to same class
» 11% of all tested devices in this class were better, 4% similar, 85% worse
» The best had a delta of 6%, average was 18%, worst was 132%
Compared to all devices tested
» 7% of all tested devices were better, 2% similar, 91% worse
» The best had a delta of 4%, average was 25%, worst was 134%
Lenovo Legion Pro 7 16IRX8H audio analysis
(+) | speakers can play relatively loud (82 dB)
Bass 100 - 315 Hz
(±) | reduced bass - on average 8.9% lower than median
(+) | bass is linear (6.4% delta to prev. frequency)
Mids 400 - 2000 Hz
(+) | balanced mids - only 2.8% away from median
(+) | mids are linear (4.2% delta to prev. frequency)
Highs 2 - 16 kHz
(+) | balanced highs - only 2.5% away from median
(+) | highs are linear (6% delta to prev. frequency)
Overall 100 - 16.000 Hz
(+) | overall sound is linear (9.4% difference to median)
Compared to same class
» 2% of all tested devices in this class were better, 2% similar, 96% worse
» The best had a delta of 6%, average was 18%, worst was 132%
Compared to all devices tested
» 2% of all tested devices were better, 1% similar, 97% worse
» The best had a delta of 4%, average was 25%, worst was 134%
Power Management - 90 Wh battery and Optimus ensure long battery life
Power Consumption
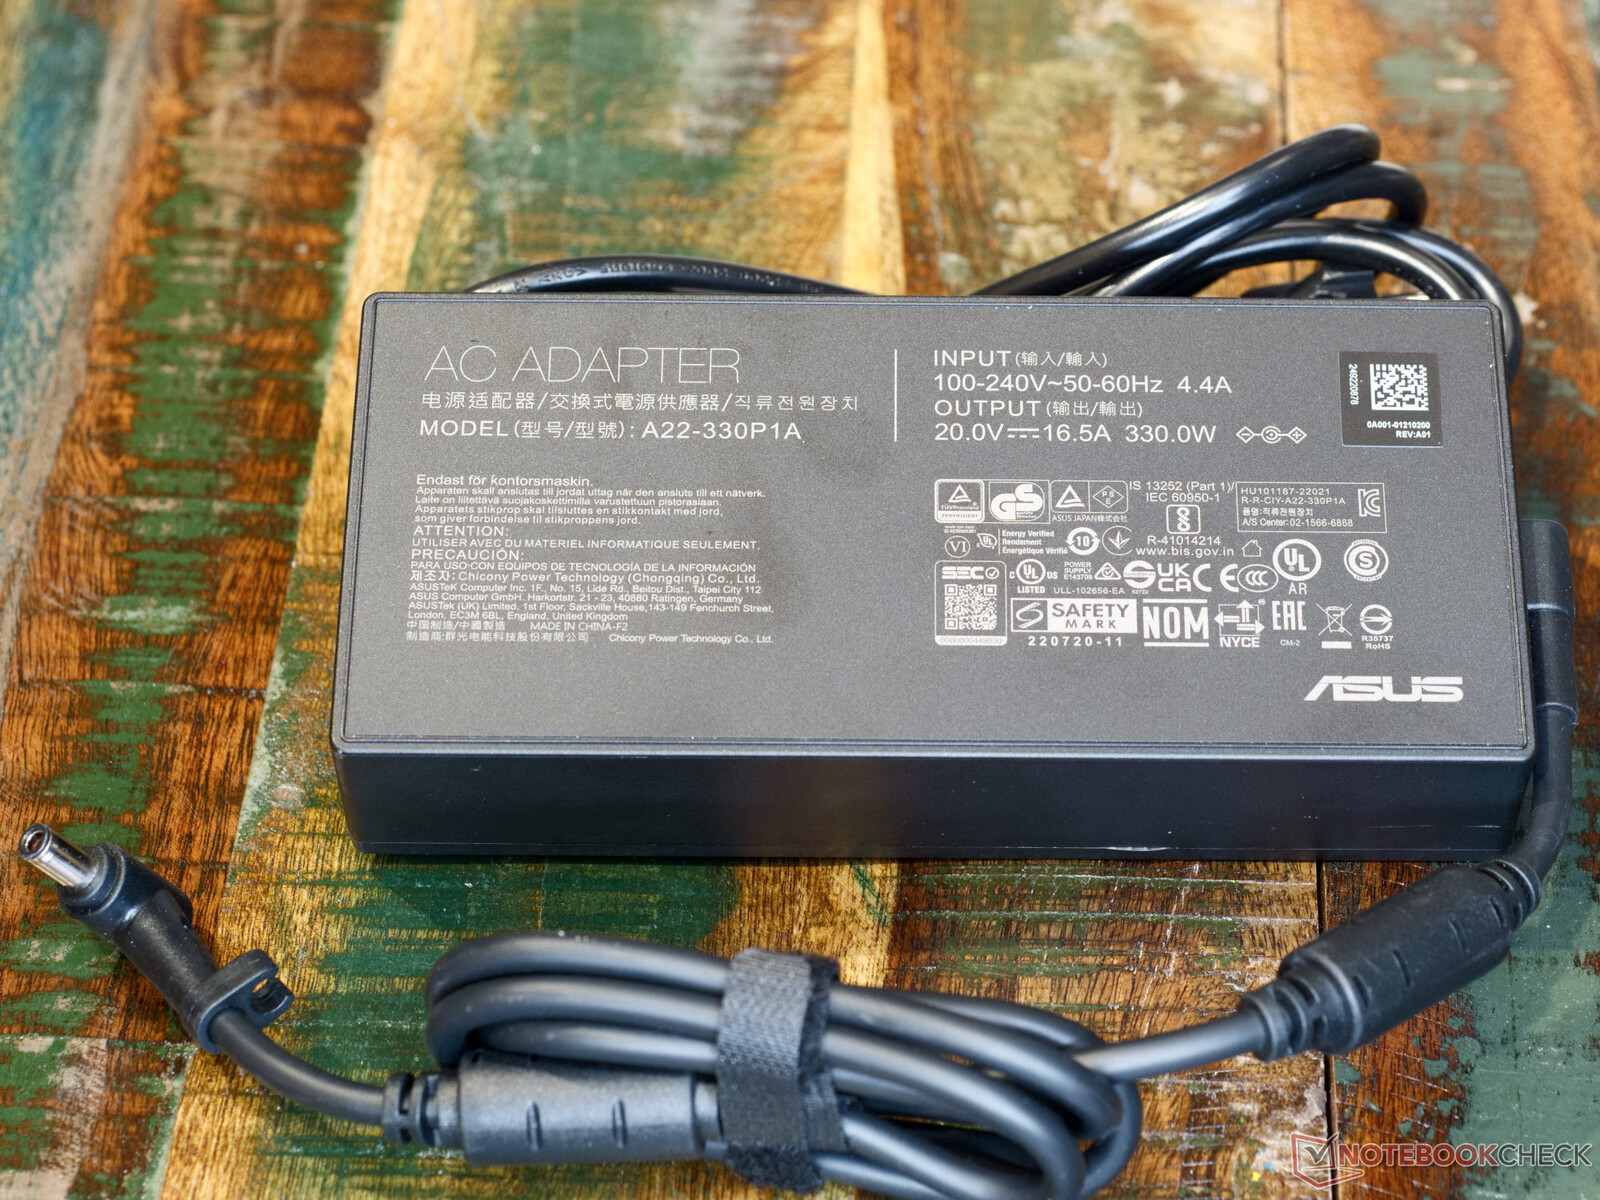
With a power consumption of 10 to 20 watts when idle, the gaming notebook is within the tolerable range. However, these relatively low rates are only reached via active graphics switching. Under load, power consumption rises up to 342 watts, which is a short peak during boost. The included 330 watt power supply should be able to cope with this. Over longer periods, the power consumption remains quite stable at 260 watts, even under load.
| Off / Standby | |
| Idle | |
| Load |
|
| Asus ROG Strix G16 G614JZ i9-13980HX, NVIDIA GeForce RTX 4080 Laptop GPU | Asus Zephyrus Duo 16 GX650PY-NM006W R9 7945HX, NVIDIA GeForce RTX 4090 Laptop GPU | Lenovo Legion Pro 7 16IRX8H i9-13900HX, NVIDIA GeForce RTX 4080 Laptop GPU | Gigabyte AERO 16 OLED BSF i9-13900H, NVIDIA GeForce RTX 4070 Laptop GPU | Asus TUF Gaming A16 FA617 R7 7735HS, Radeon RX 7600S | Razer Blade 16 Early 2023 i9-13950HX, NVIDIA GeForce RTX 4080 Laptop GPU | Average NVIDIA GeForce RTX 4080 Laptop GPU | Average of class Gaming | |
|---|---|---|---|---|---|---|---|---|
| Power Consumption | -32% | -25% | 20% | 34% | -25% | -21% | -3% | |
| Idle Minimum * | 10 | 19.2 -92% | 18 -80% | 11.8 -18% | 8 20% | 15.2 -52% | 16.6 ? -66% | 13.7 ? -37% |
| Idle Average * | 16 | 29.7 -86% | 24 -50% | 16.1 -1% | 11 31% | 22.8 -43% | 21.9 ? -37% | 19.1 ? -19% |
| Idle Maximum * | 27 | 30.8 -14% | 32 -19% | 17 37% | 16 41% | 49.8 -84% | 34 ? -26% | 26.8 ? 1% |
| Load Average * | 129 | 126 2% | 130 -1% | 100.6 22% | 97 25% | 121.2 6% | 117.7 ? 9% | 110.9 ? 14% |
| Witcher 3 ultra * | 247 | 258 -4% | 260 -5% | 158 36% | 161.5 35% | 242 2% | ||
| Load Maximum * | 342 | 330 4% | 320 6% | 192 44% | 168 51% | 273.7 20% | 292 ? 15% | 250 ? 27% |
* ... smaller is better
Power Consumption Witcher 3 / Stress Test
Power Consumption with an external monitor
Battery Life
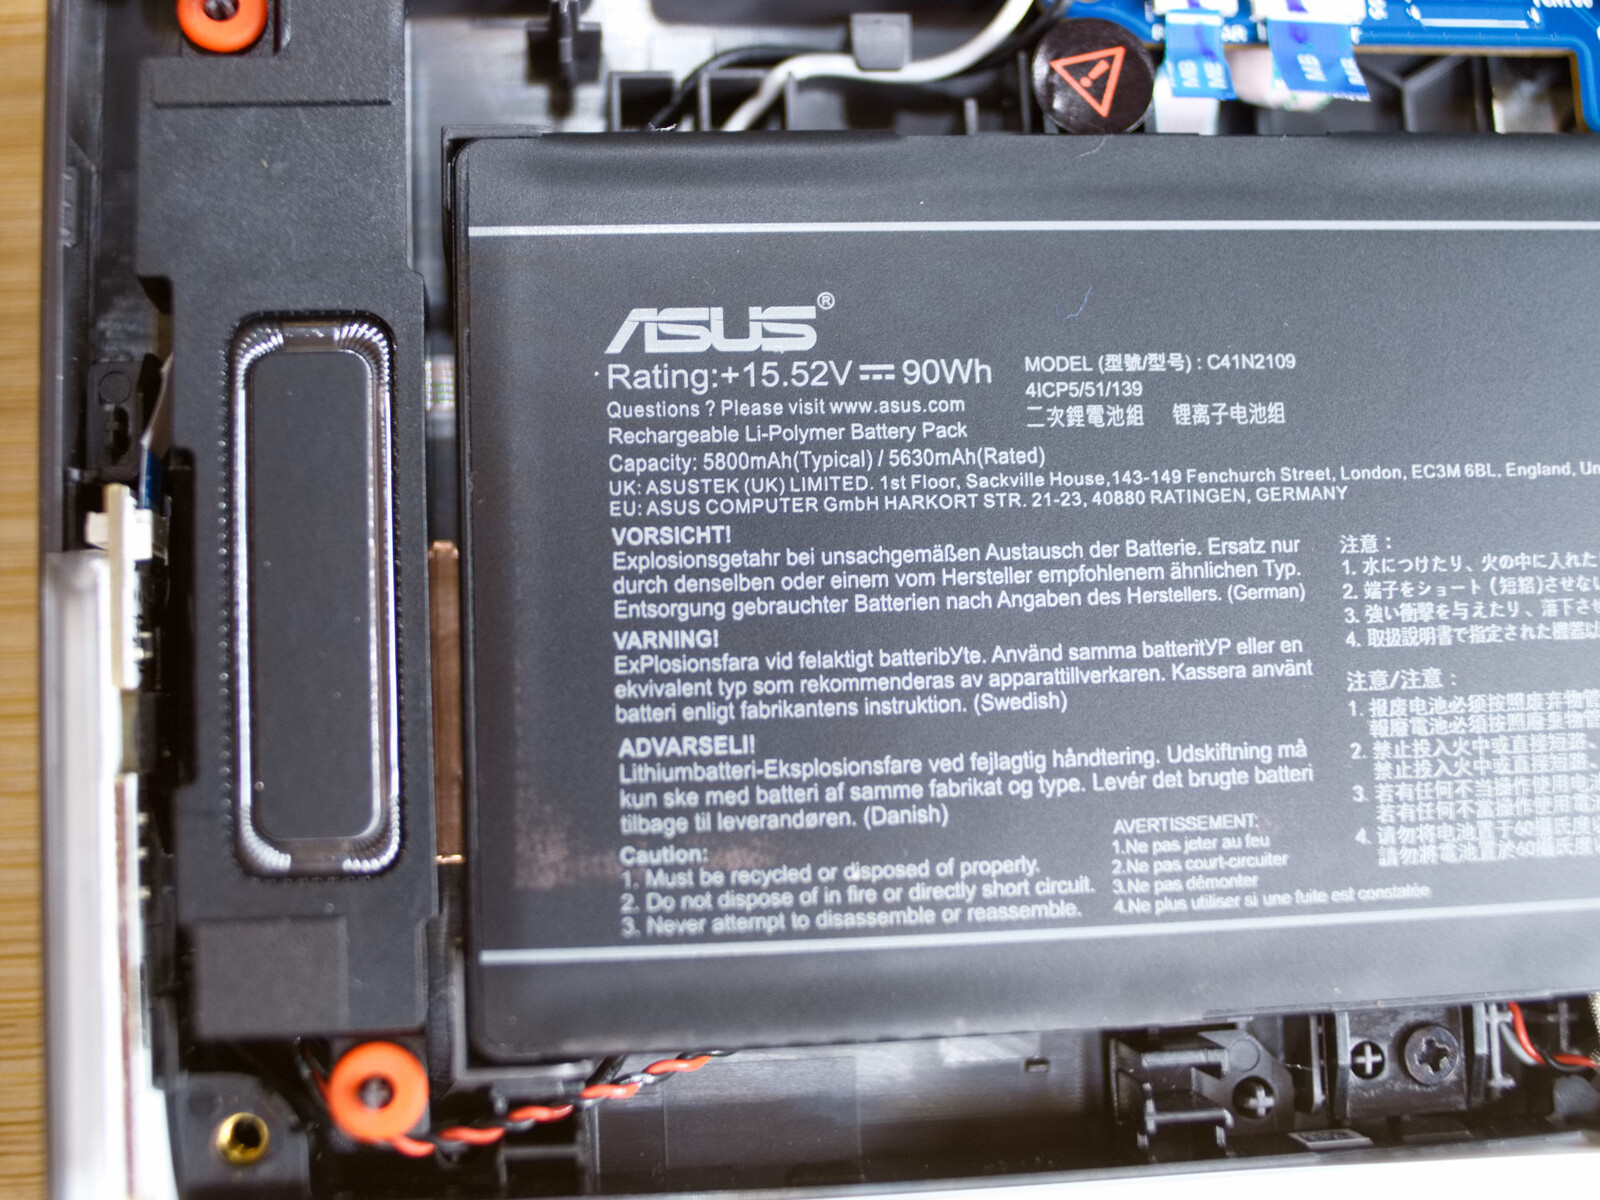
With a capacity of 90 watt hours, the battery of the Asus ROG Strix G16 should be able to provide good runtimes away from the socket. However, the notebook only achieves more than nine hours in the WiFi web surfing test with active graphics switching. As soon as the GeForce RTX 4080 is active, the runtimes drop significantly. Under high load, the battery lasts only one hour in some cases. Nevertheless, the battery runtimes are still exceptionally good for a gaming notebook in 2023.
| Asus ROG Strix G16 G614JZ i9-13980HX, NVIDIA GeForce RTX 4080 Laptop GPU, 90 Wh | Asus Zephyrus Duo 16 GX650PY-NM006W R9 7945HX, NVIDIA GeForce RTX 4090 Laptop GPU, 90 Wh | Lenovo Legion Pro 7 16IRX8H i9-13900HX, NVIDIA GeForce RTX 4080 Laptop GPU, 99.9 Wh | Gigabyte AERO 16 OLED BSF i9-13900H, NVIDIA GeForce RTX 4070 Laptop GPU, 88 Wh | Asus TUF Gaming A16 FA617 R7 7735HS, Radeon RX 7600S, 90 Wh | Razer Blade 16 Early 2023 i9-13950HX, NVIDIA GeForce RTX 4080 Laptop GPU, 95.2 Wh | Average of class Gaming | |
|---|---|---|---|---|---|---|---|
| Battery Runtime | -36% | 22% | 36% | 31% | -6% | -4% | |
| WiFi v1.3 | 583 | 238 -59% | 303 -48% | 448 -23% | 724 24% | 365 -37% | 368 ? -37% |
| Load | 65 | 57 -12% | 124 91% | 126 94% | 90 38% | 81 25% | 84.2 ? 30% |
| H.264 | 230 | 442 | 399 ? | ||||
| Reader / Idle | 385 | 1212 | 533 | 544 ? |
Pros
Cons
Verdict - The 4080 is a good choice

With the mobile Nvidia GeForce RTX 4080, the Asus ROG Stix G16 hits the sweet spot between performance and cooling. The G16 also does not have to shy away from direct comparison with its supposedly stronger family member, the ROG Strix Scar 18 with its RTX 4090, as most benchmarks of the two laptops are very close to each other. Moreover, the G16 should be significantly cheaper. Depending on the supplier, the price difference here could be almost US$ 2,000.
In the 2023 model series, Asus has significantly leveled out the differences between the two high-end lines. Due to the omission of the vapor chamber in the Strix Scar devices, the differences between the Scar 18 and the G16 are almost entirely cosmetic. Those who absolutely insist on a laptop with a translucent chassis will have to dig much deeper into their pockets. We also recently reviewed a Strix G18 with an RTX 4070. Just like in the G16, a good screen and strong hardware with good heat dissipation are used here. That said, the 16-incher might be the better choice because of its somewhat more stable build.
Powerful performance in an eye-catching package. The Asus ROG Strix G16 is fun to use thanks to its strong capabilities.
Interestingly, the ROG Strix G16 offers the real possibility of gaming without noise pollution. The preconfigured Silent Mode scores with more than playable FPS and low fan noise. Unfortunately, this also brings the coil whine of the G16 to the fore. The penetrating noise is especially audible during boosts and is probably generated by the voltage converters.
The ROG Strix G16 is roughly on par with the Lenovo Legion Pro 7 and Razer Blade 16 in terms of performance, but is likely to be cheaper. However, the two competitors have advantages in case quality and connectivity. These two points are also the biggest weaknesses of the ROG Strix G16.
Price and Availability
Considering its recent launch, global availability of the Asus ROG Strix G16 with a Nvidia GeForce RTX 4080 is currently either limited or not available at all. In the US, only configurations with the RTX 4070 (via Amazon for US$1999.99) or the RTX 4050 (via the Asus ROG website for US$1799.99) appear to be available.
Models with an RTX 4080 are expected to be around US$3000 as soon as they become available.
Prices are as of 17.03.2023 and subject to change.
Asus ROG Strix G16 G614JZ
-
03/16/2023 v7
Marc Herter
More articles related to this device
Asus ROG Strix G16 G614JZ (ROG Strix G16 Series)Related Articles


Transparency
The present review sample was made available to the author as a loan by the manufacturer or a shop for the purposes of review. The lender had no influence on this review, nor did the manufacturer receive a copy of this review before publication. There was no obligation to publish this review.
Pricecompare

