 Deutsch
 English
 Español
 Français
 Italiano
 Nederlands
 Polski
 Português
 Русский
 Türkçe
 Svenska
 Chinese
 Magyar
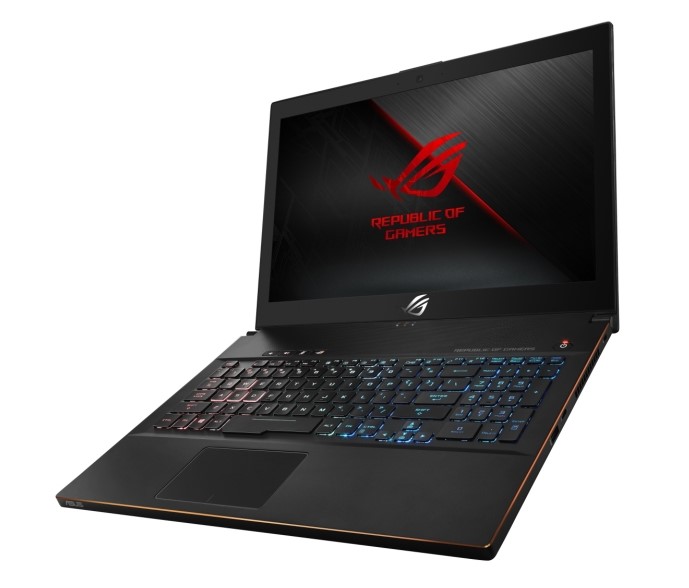
Asus ROG GU501GM (i7-8750H, GTX 1060) Laptop Review
"Thin-and-light" is quickly becoming the norm for mid-range and high-end gaming laptops, and Asus is one of the market leaders in this regard. The Zephyrus GX501 and Zephyrus M GM501 are perhaps the epitomai of Asus' new designs, but they come at quite a cost. The Asus ROG GU501GM under review today borrows heavily from both of these devices, but it sacrifices some specs in order to cut the price by a few hundred dollars.
Intel's Coffee Lake Core i7-8750H makes the transition, but the GPU has been dropped to an Nvidia GeForce GTX 1060. The whole package retails for about USD $1900, although Best Buy is currently offering the device for $1500 exclusively in the U.S. This is a $900 price drop from the standard Zephyrus M, which may make the device more appealing in spite of the downgrade in graphical power.
As said earlier, the thin-and-light gaming laptop market is replete Asus ROG Zephyrus M GM501 (i7-8750H, GTX 1070, Full-HD) Laptop Reviewwith competent machines. We will compare the ROG GU501GM to similar devices, including Asus' own Zephyrus M GM501, MSI's GS65 Stealth Thin, the Aorus x5 v8, the Predator Triton 700 from Acer, and Gigabyte's Aero 15x. Most of these devices have recently landed on our "Top 10 Slim & Light Gaming Laptops" list. Does the GU501GM deserve a spot amongst these champions? Let's take a look.
Case
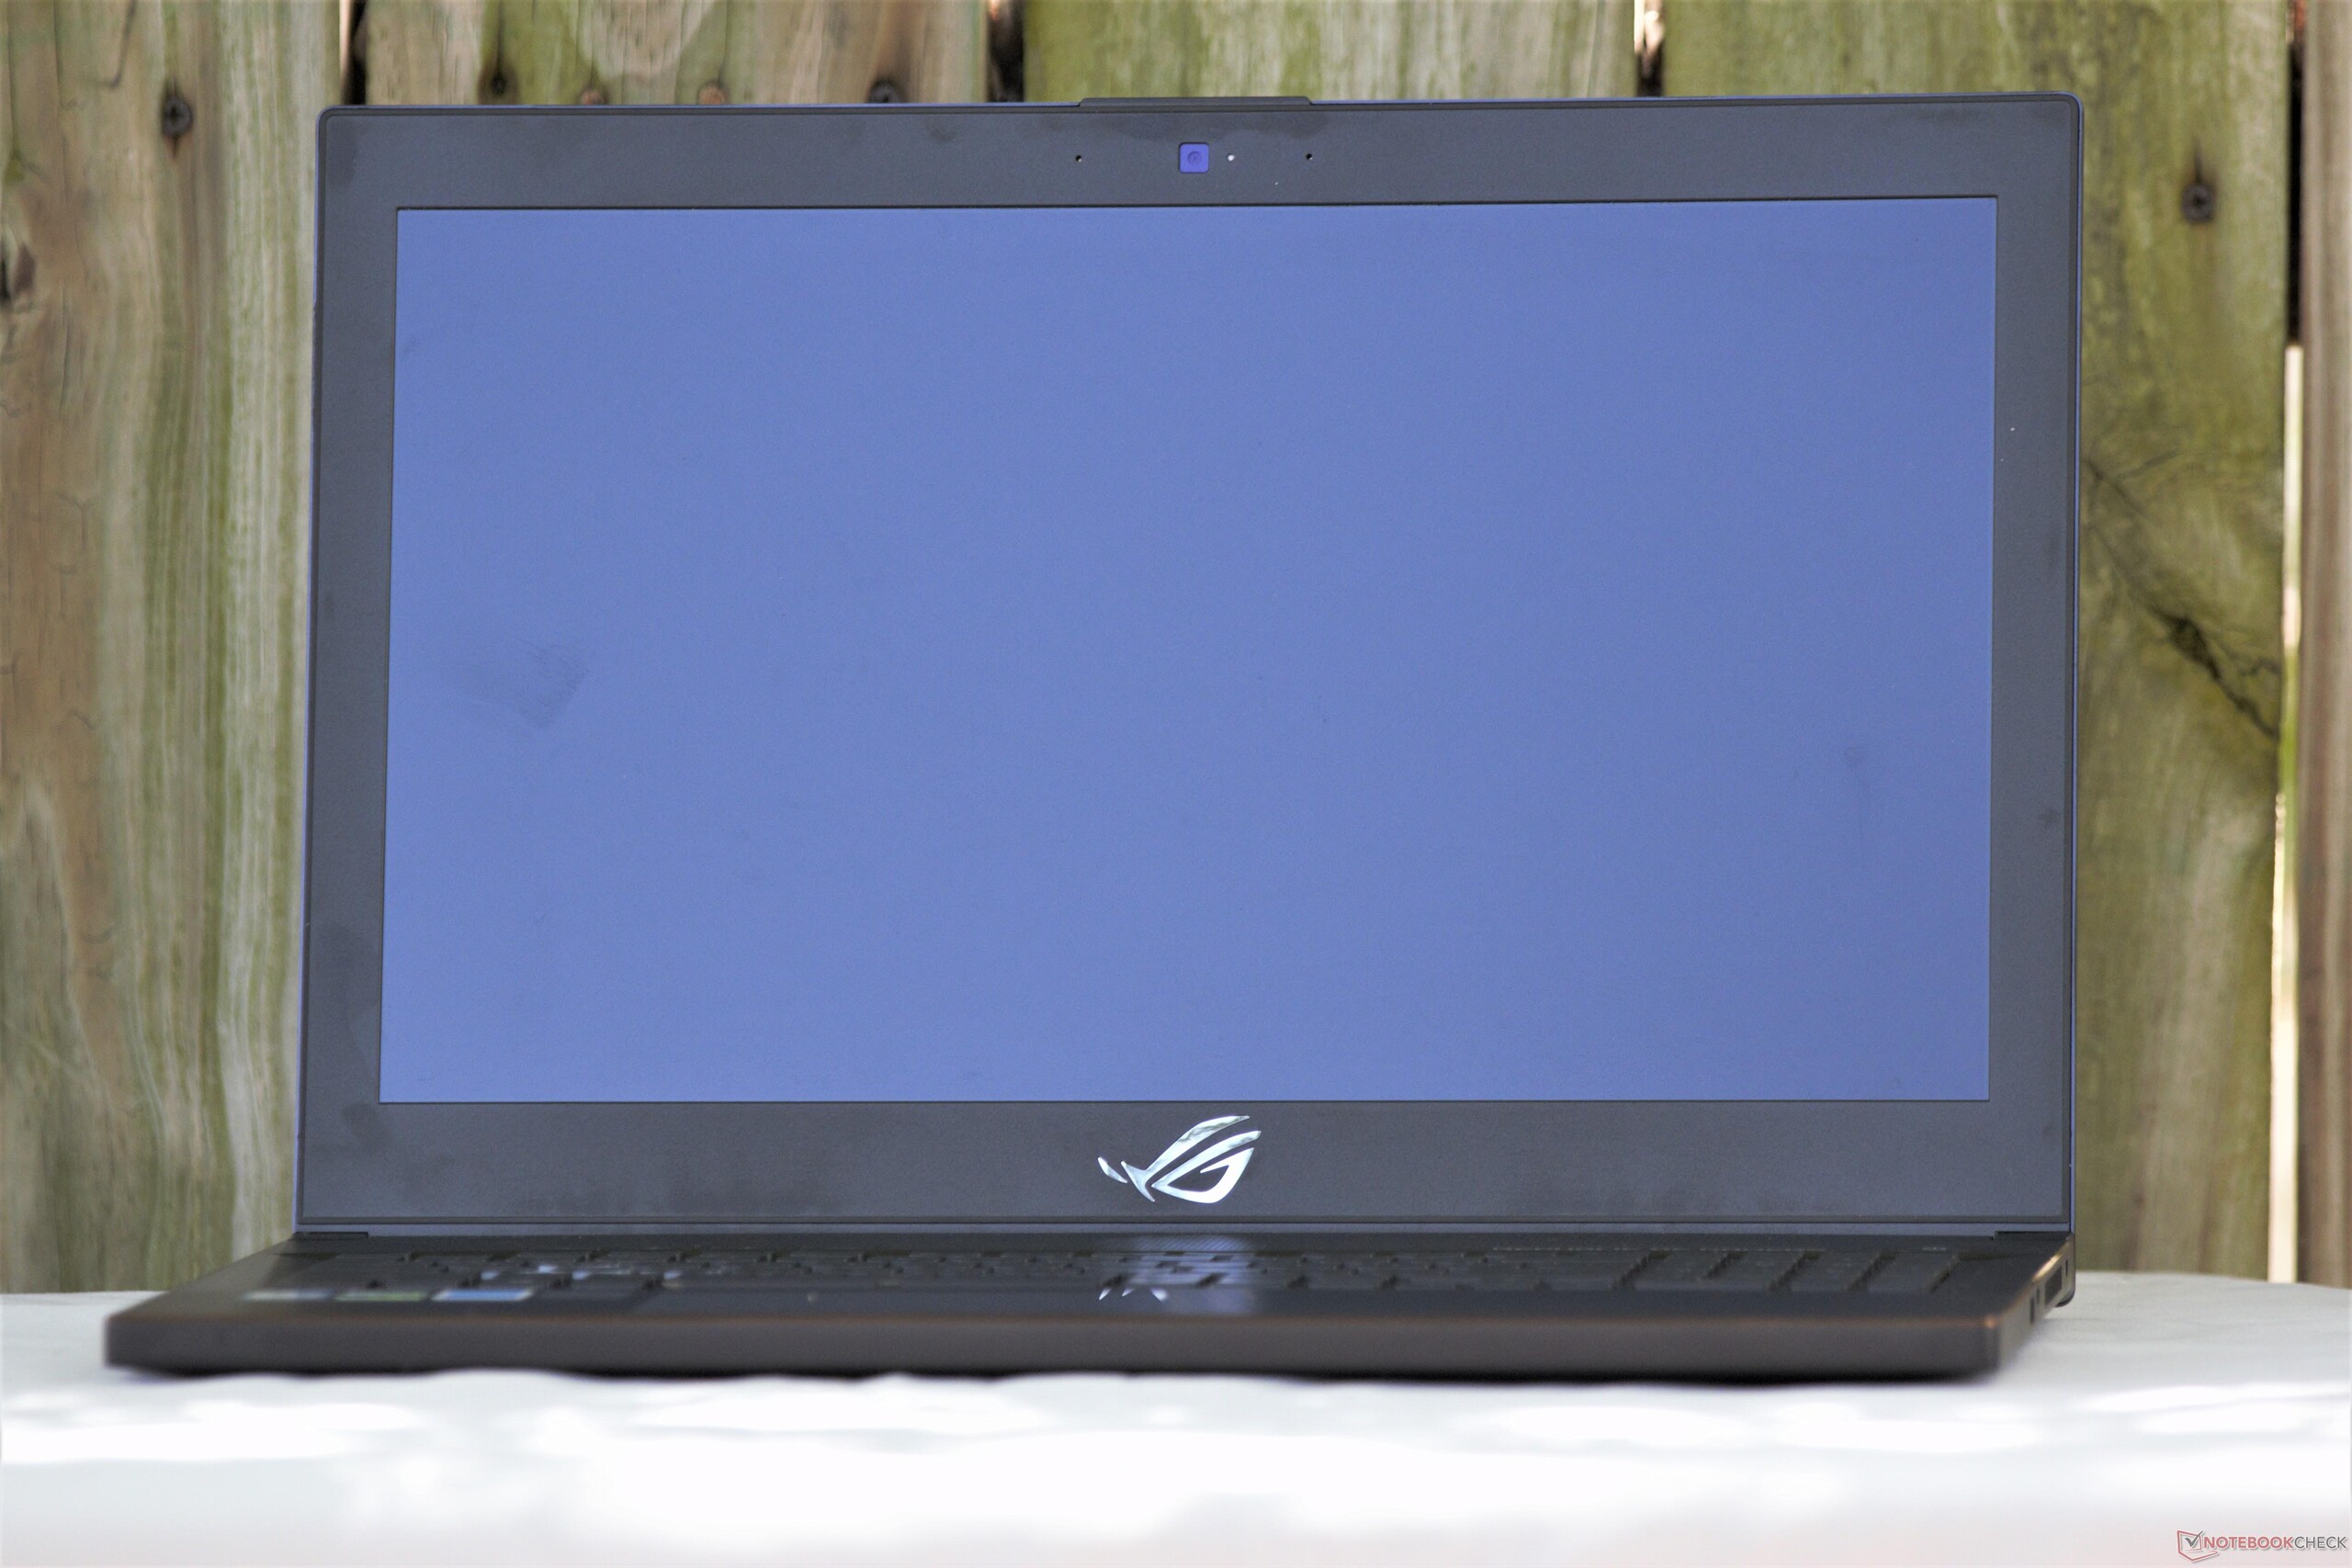
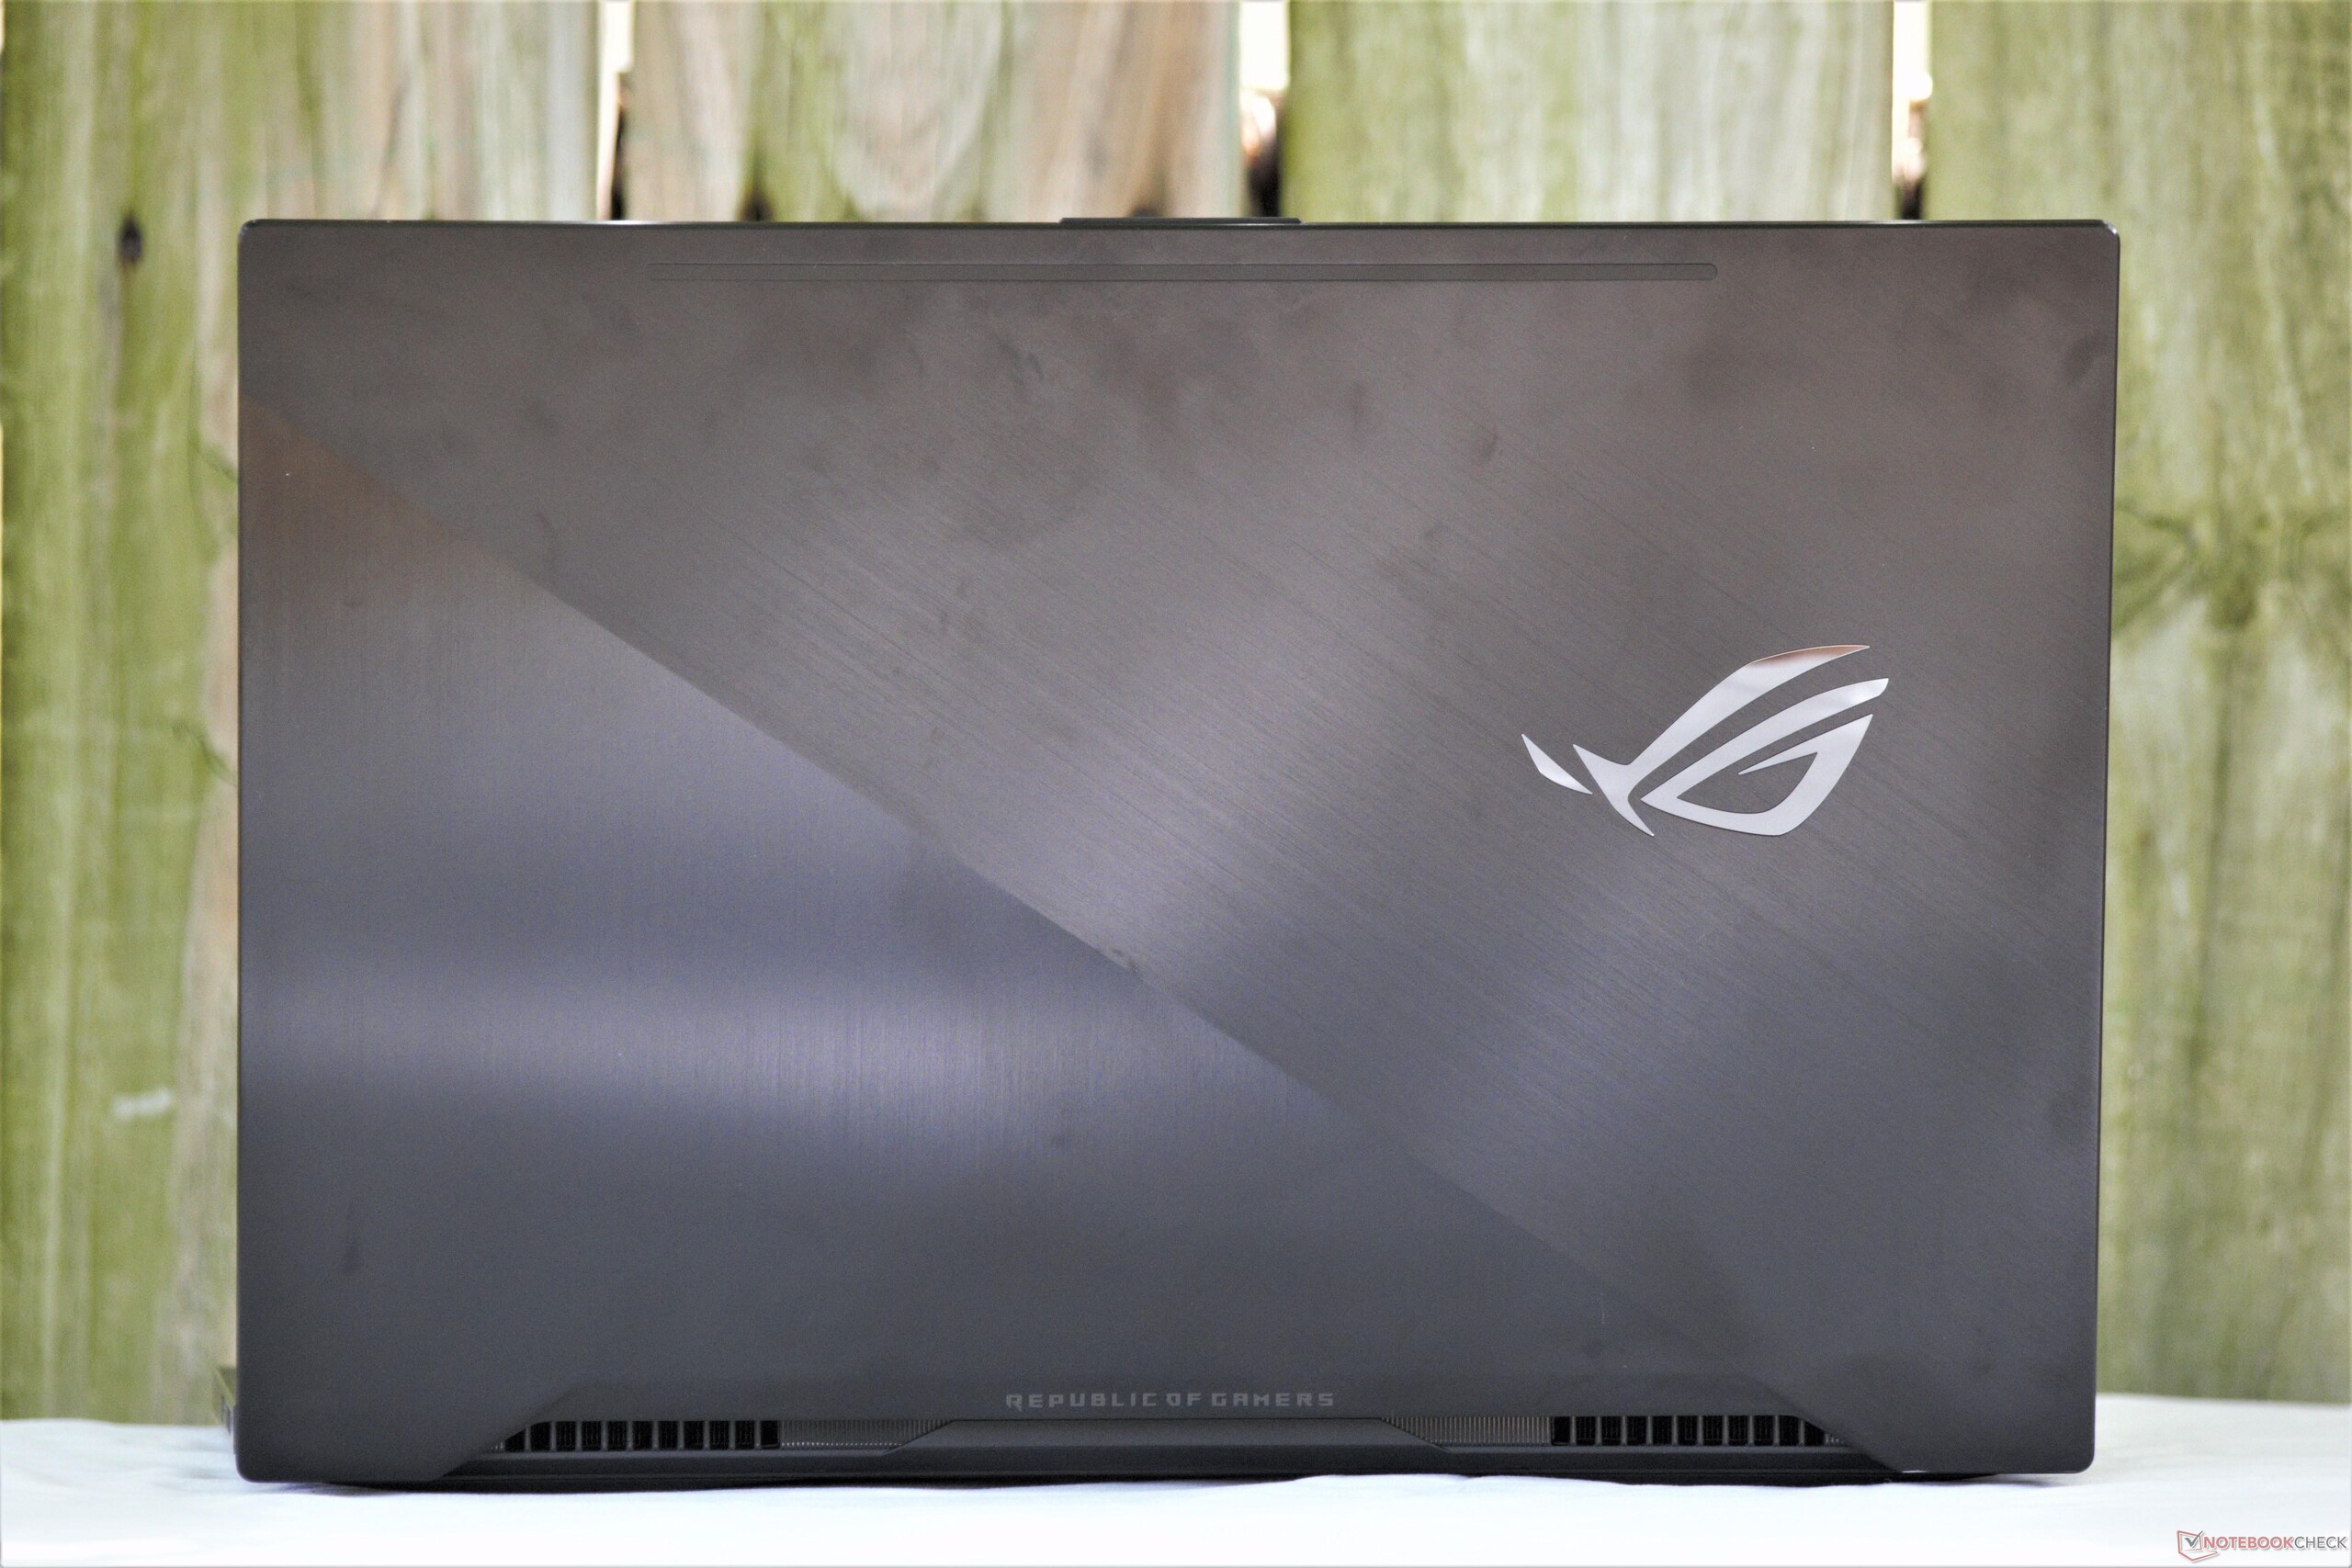
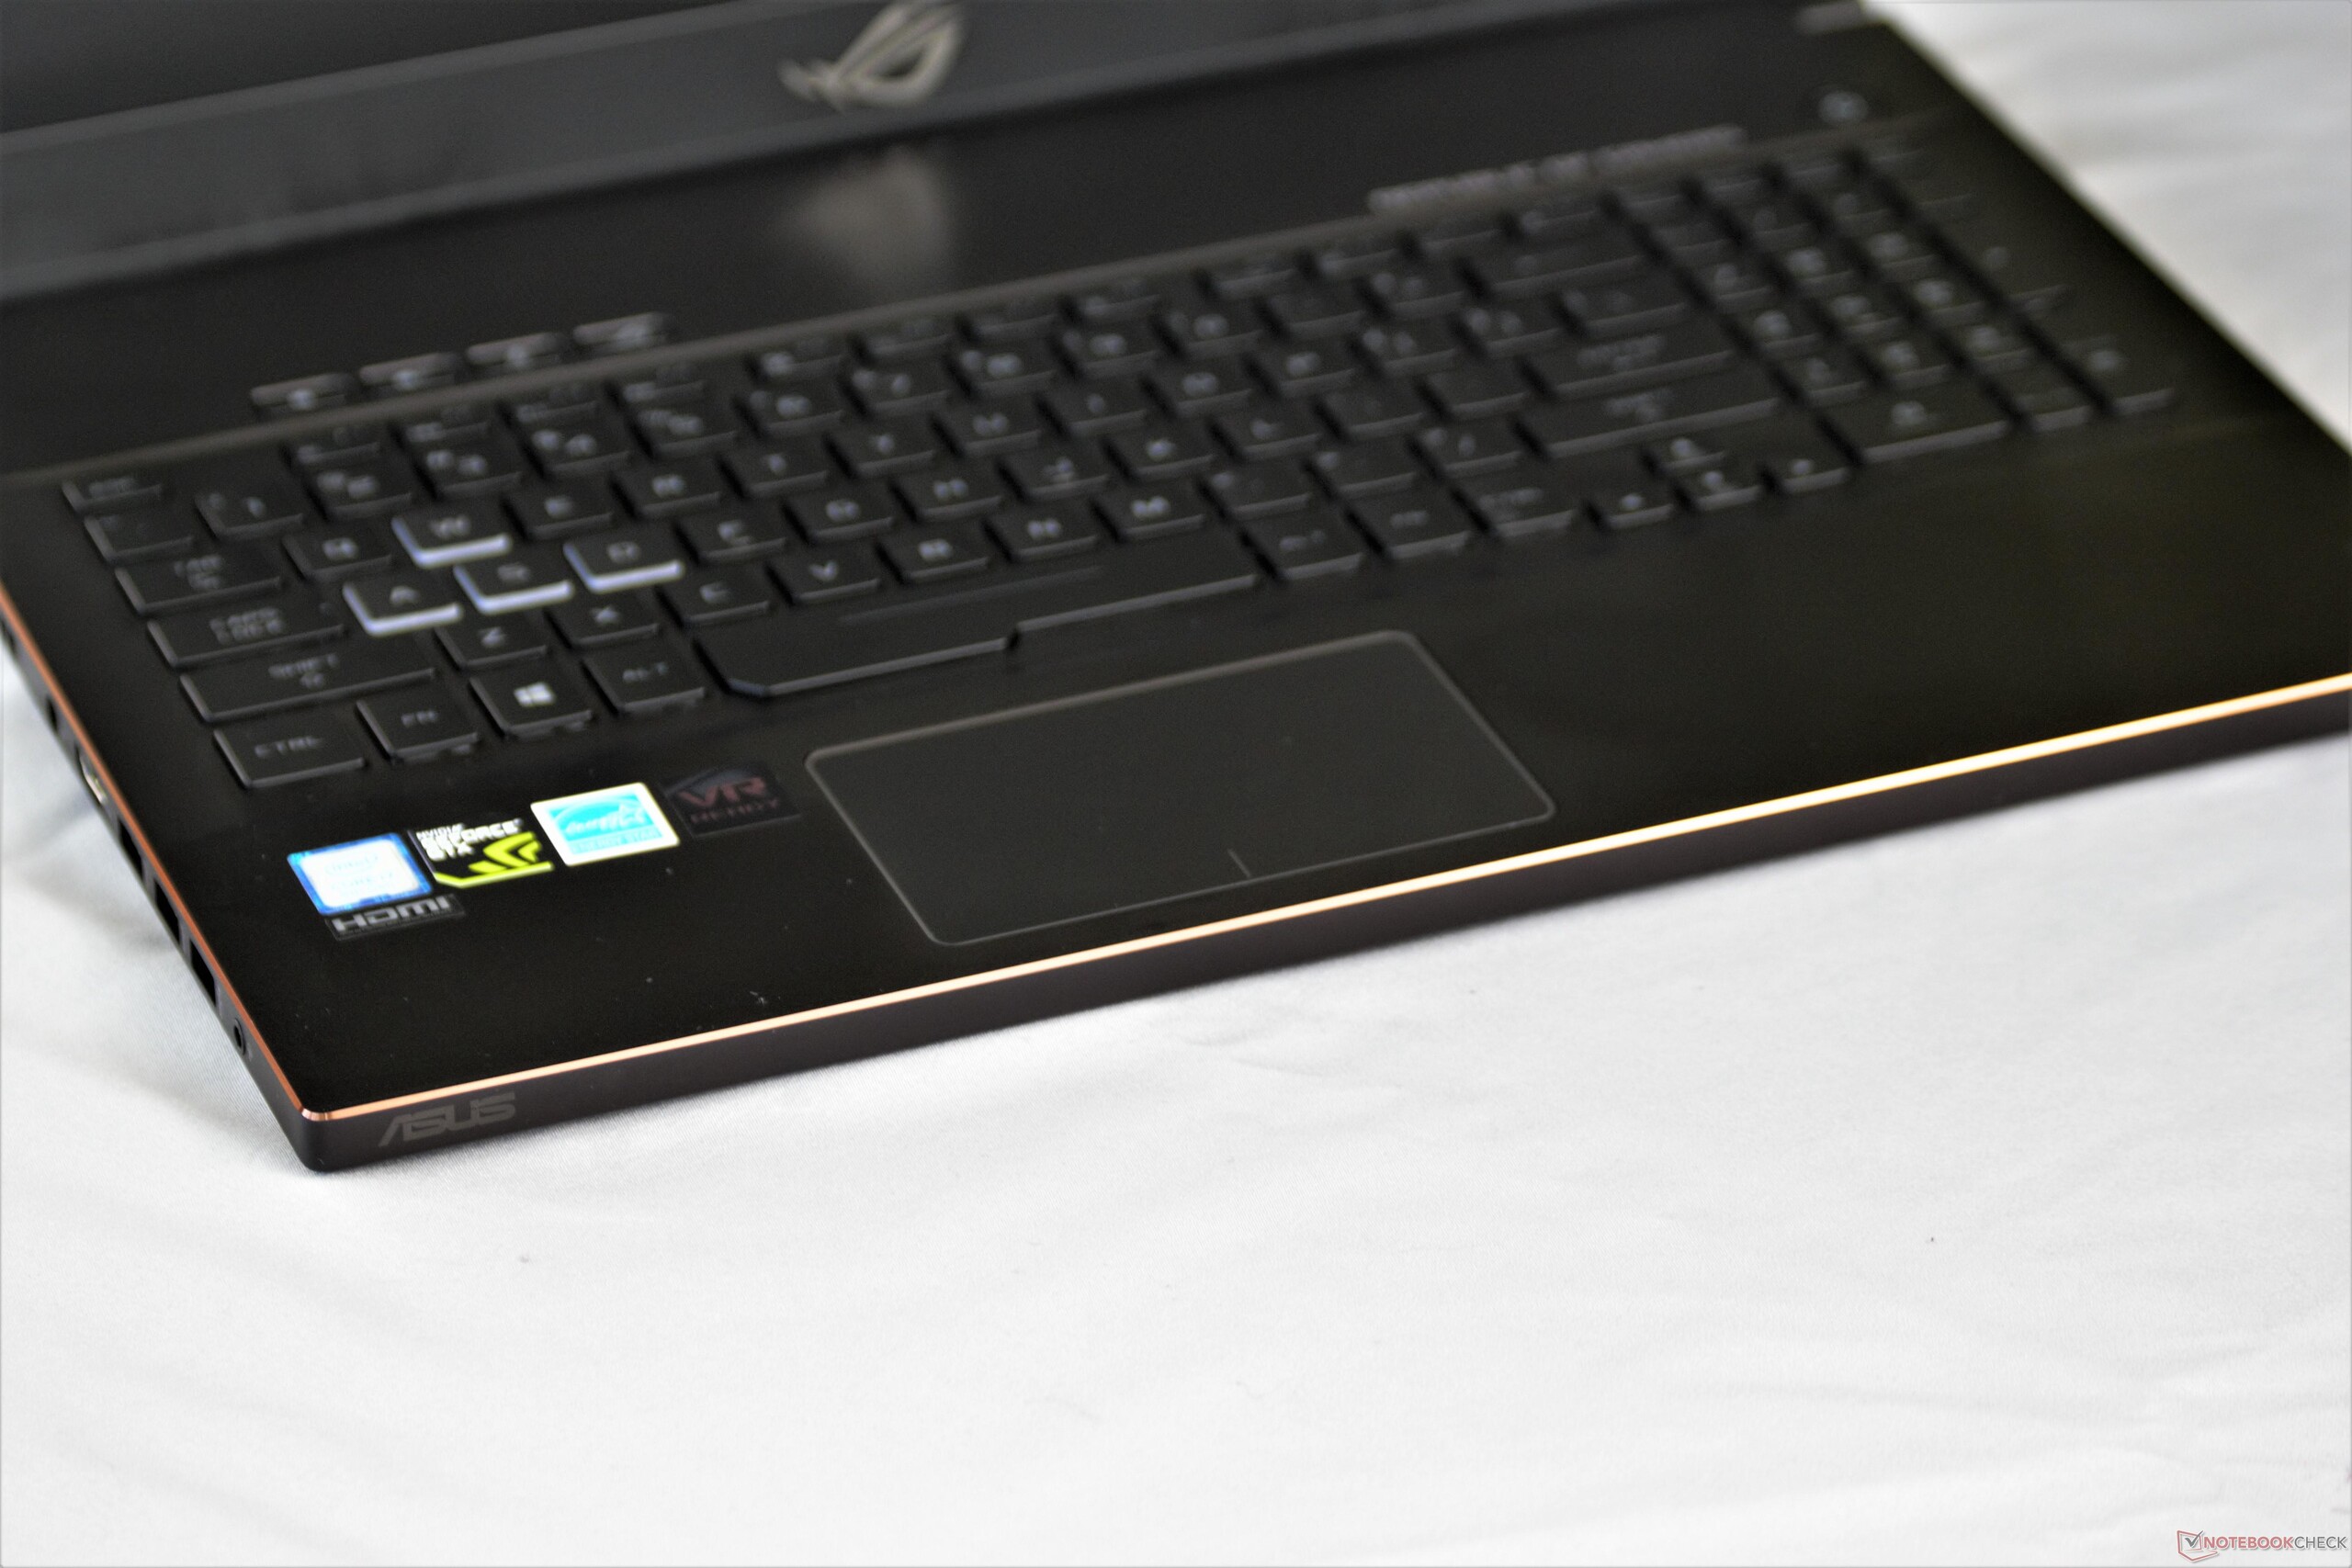
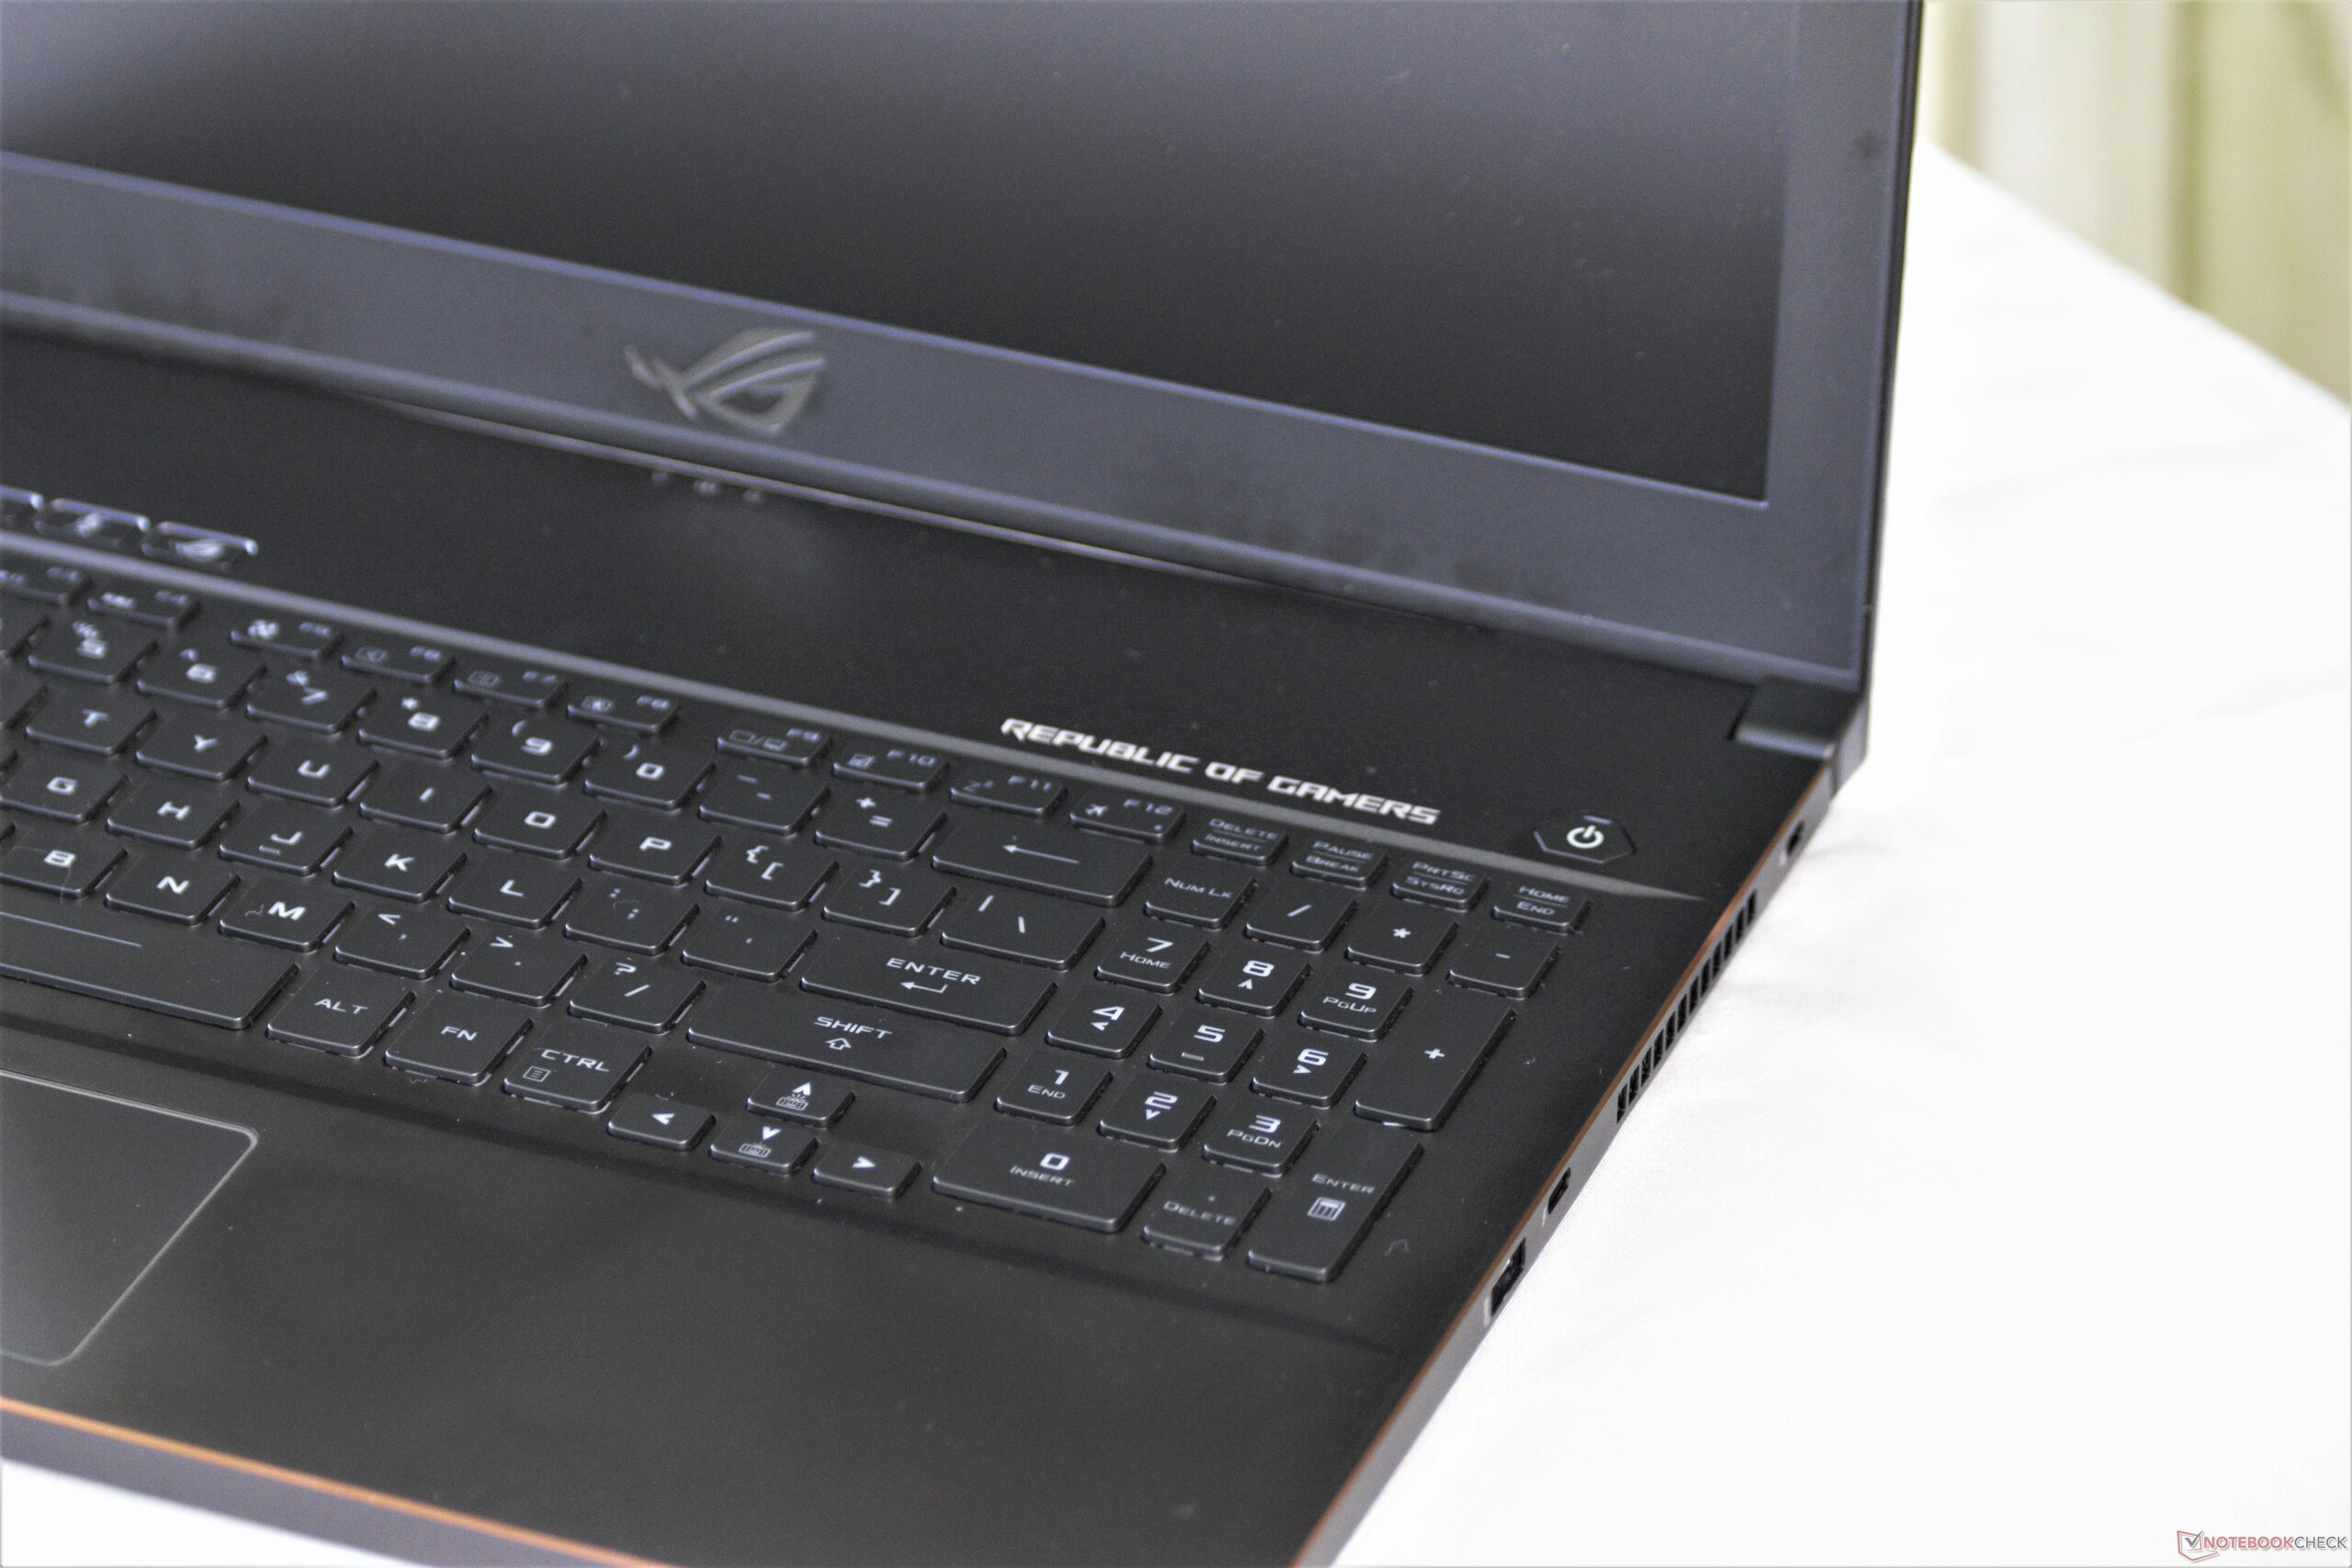
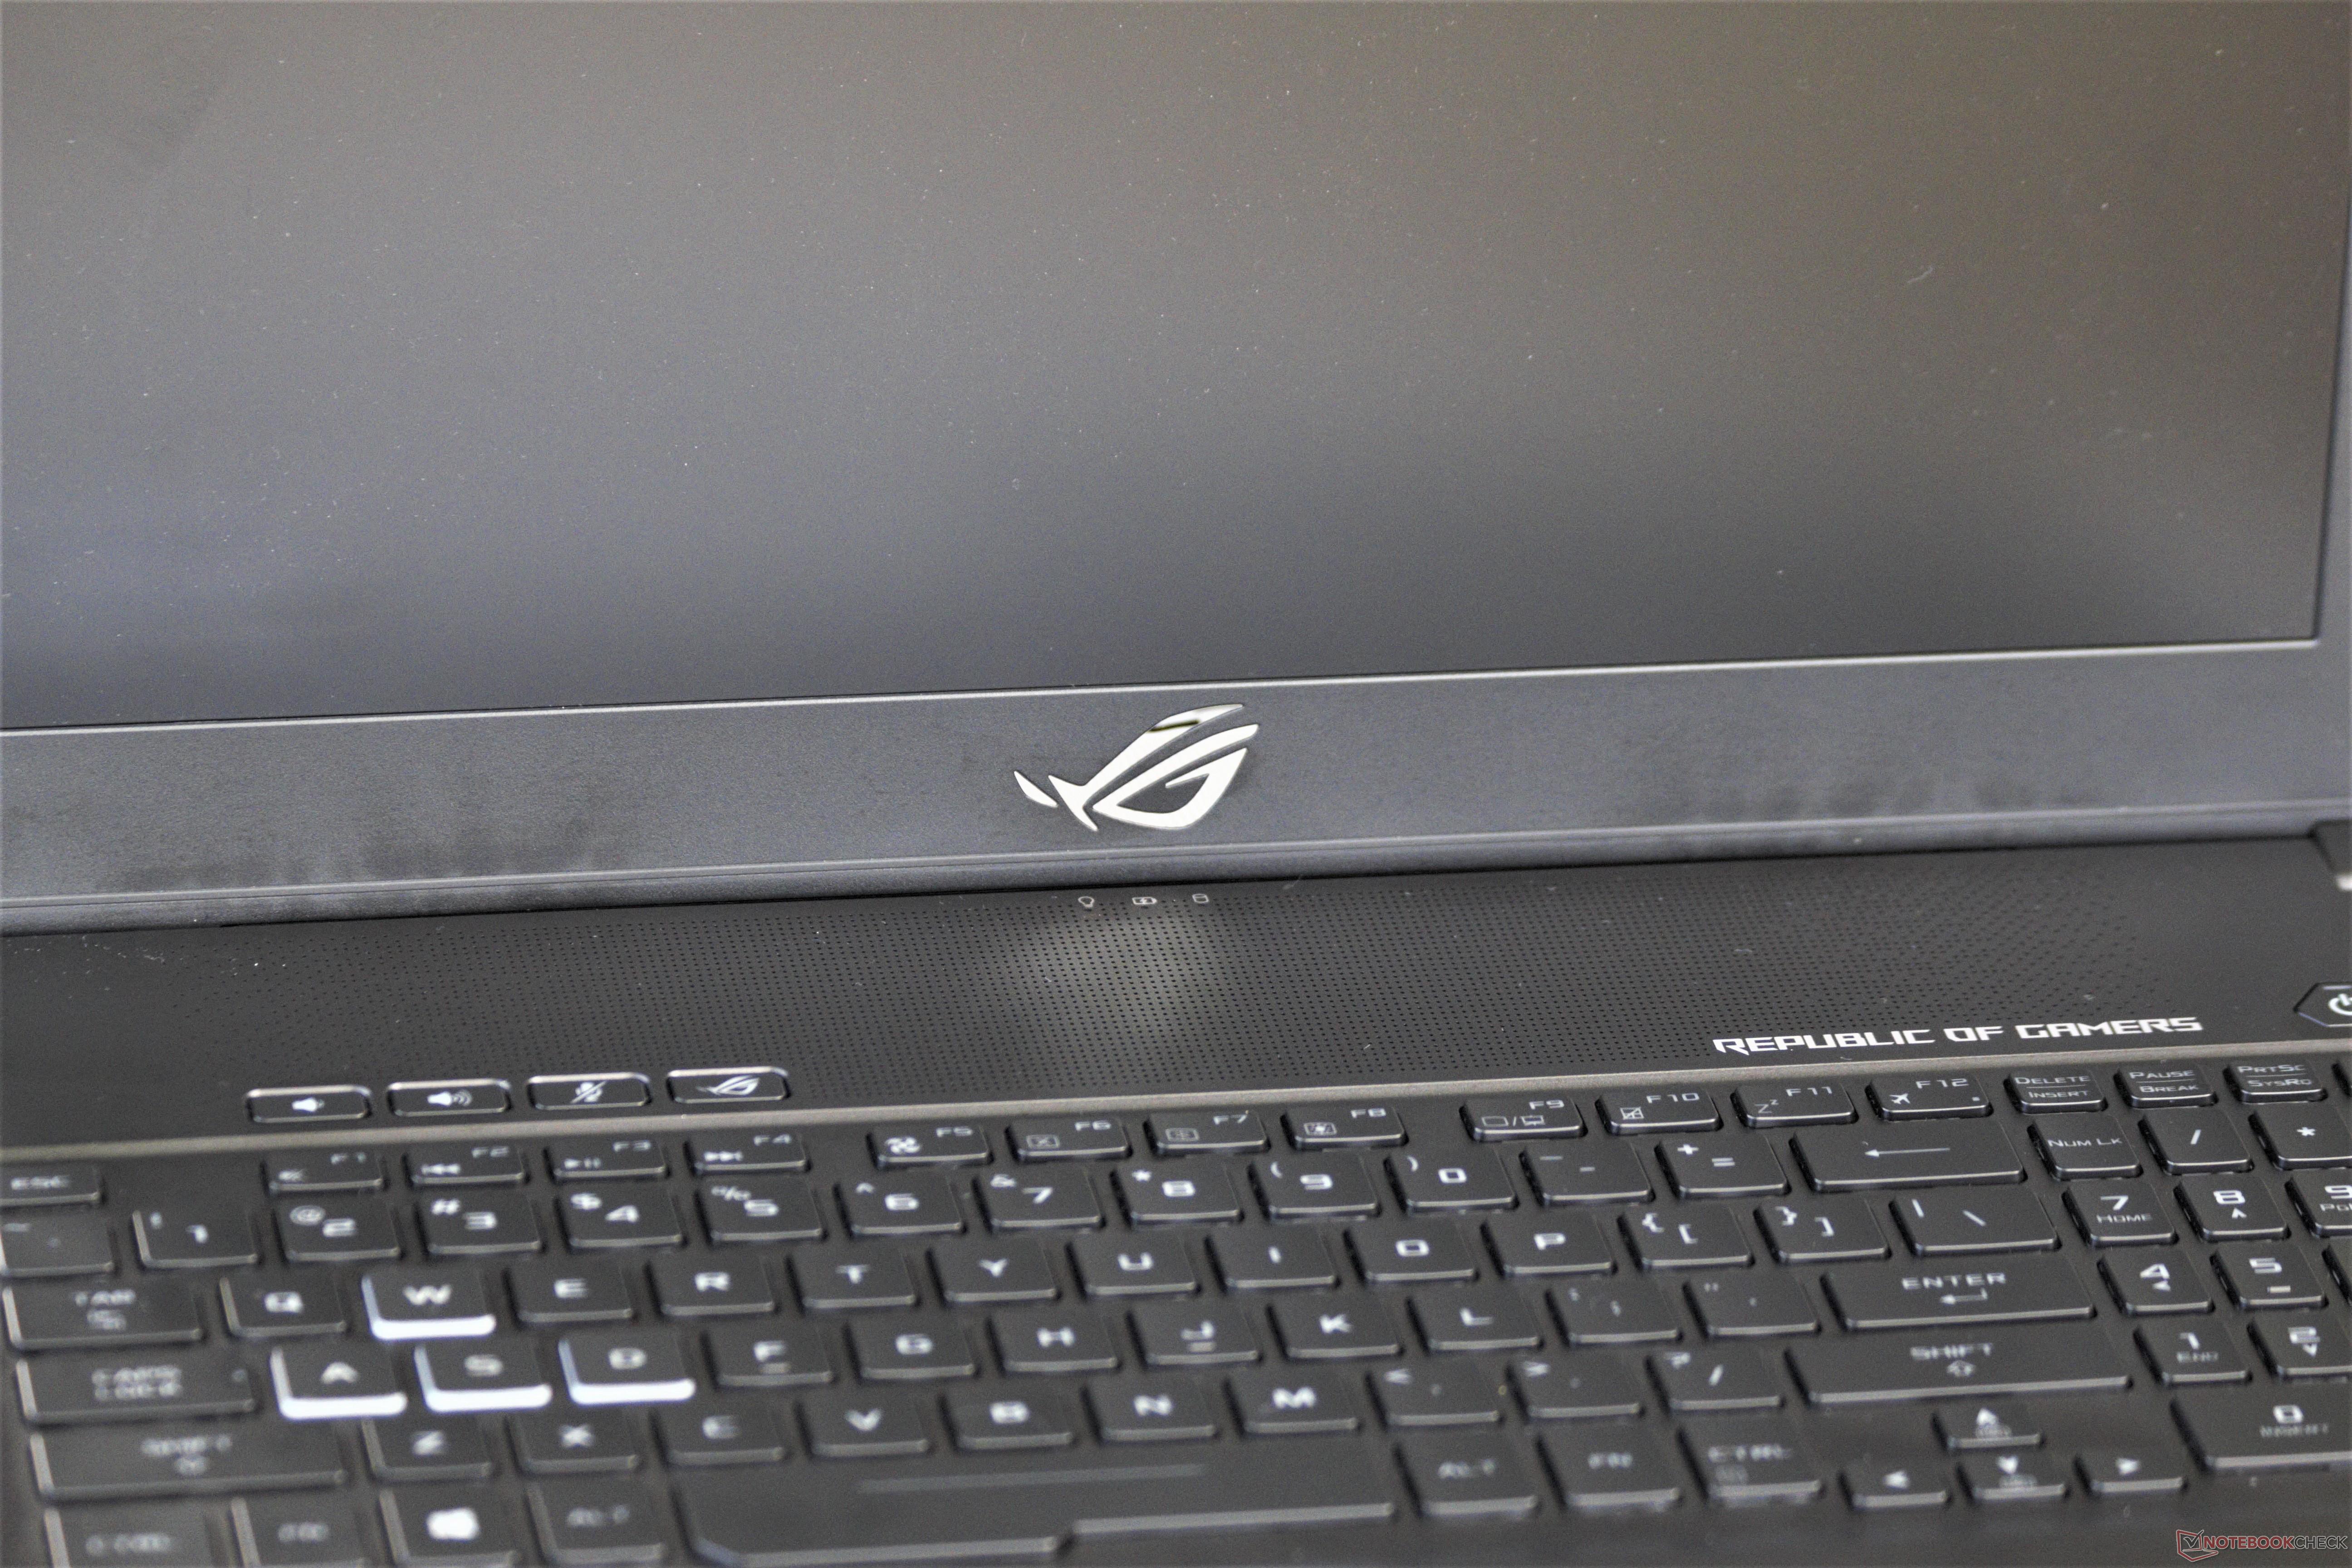
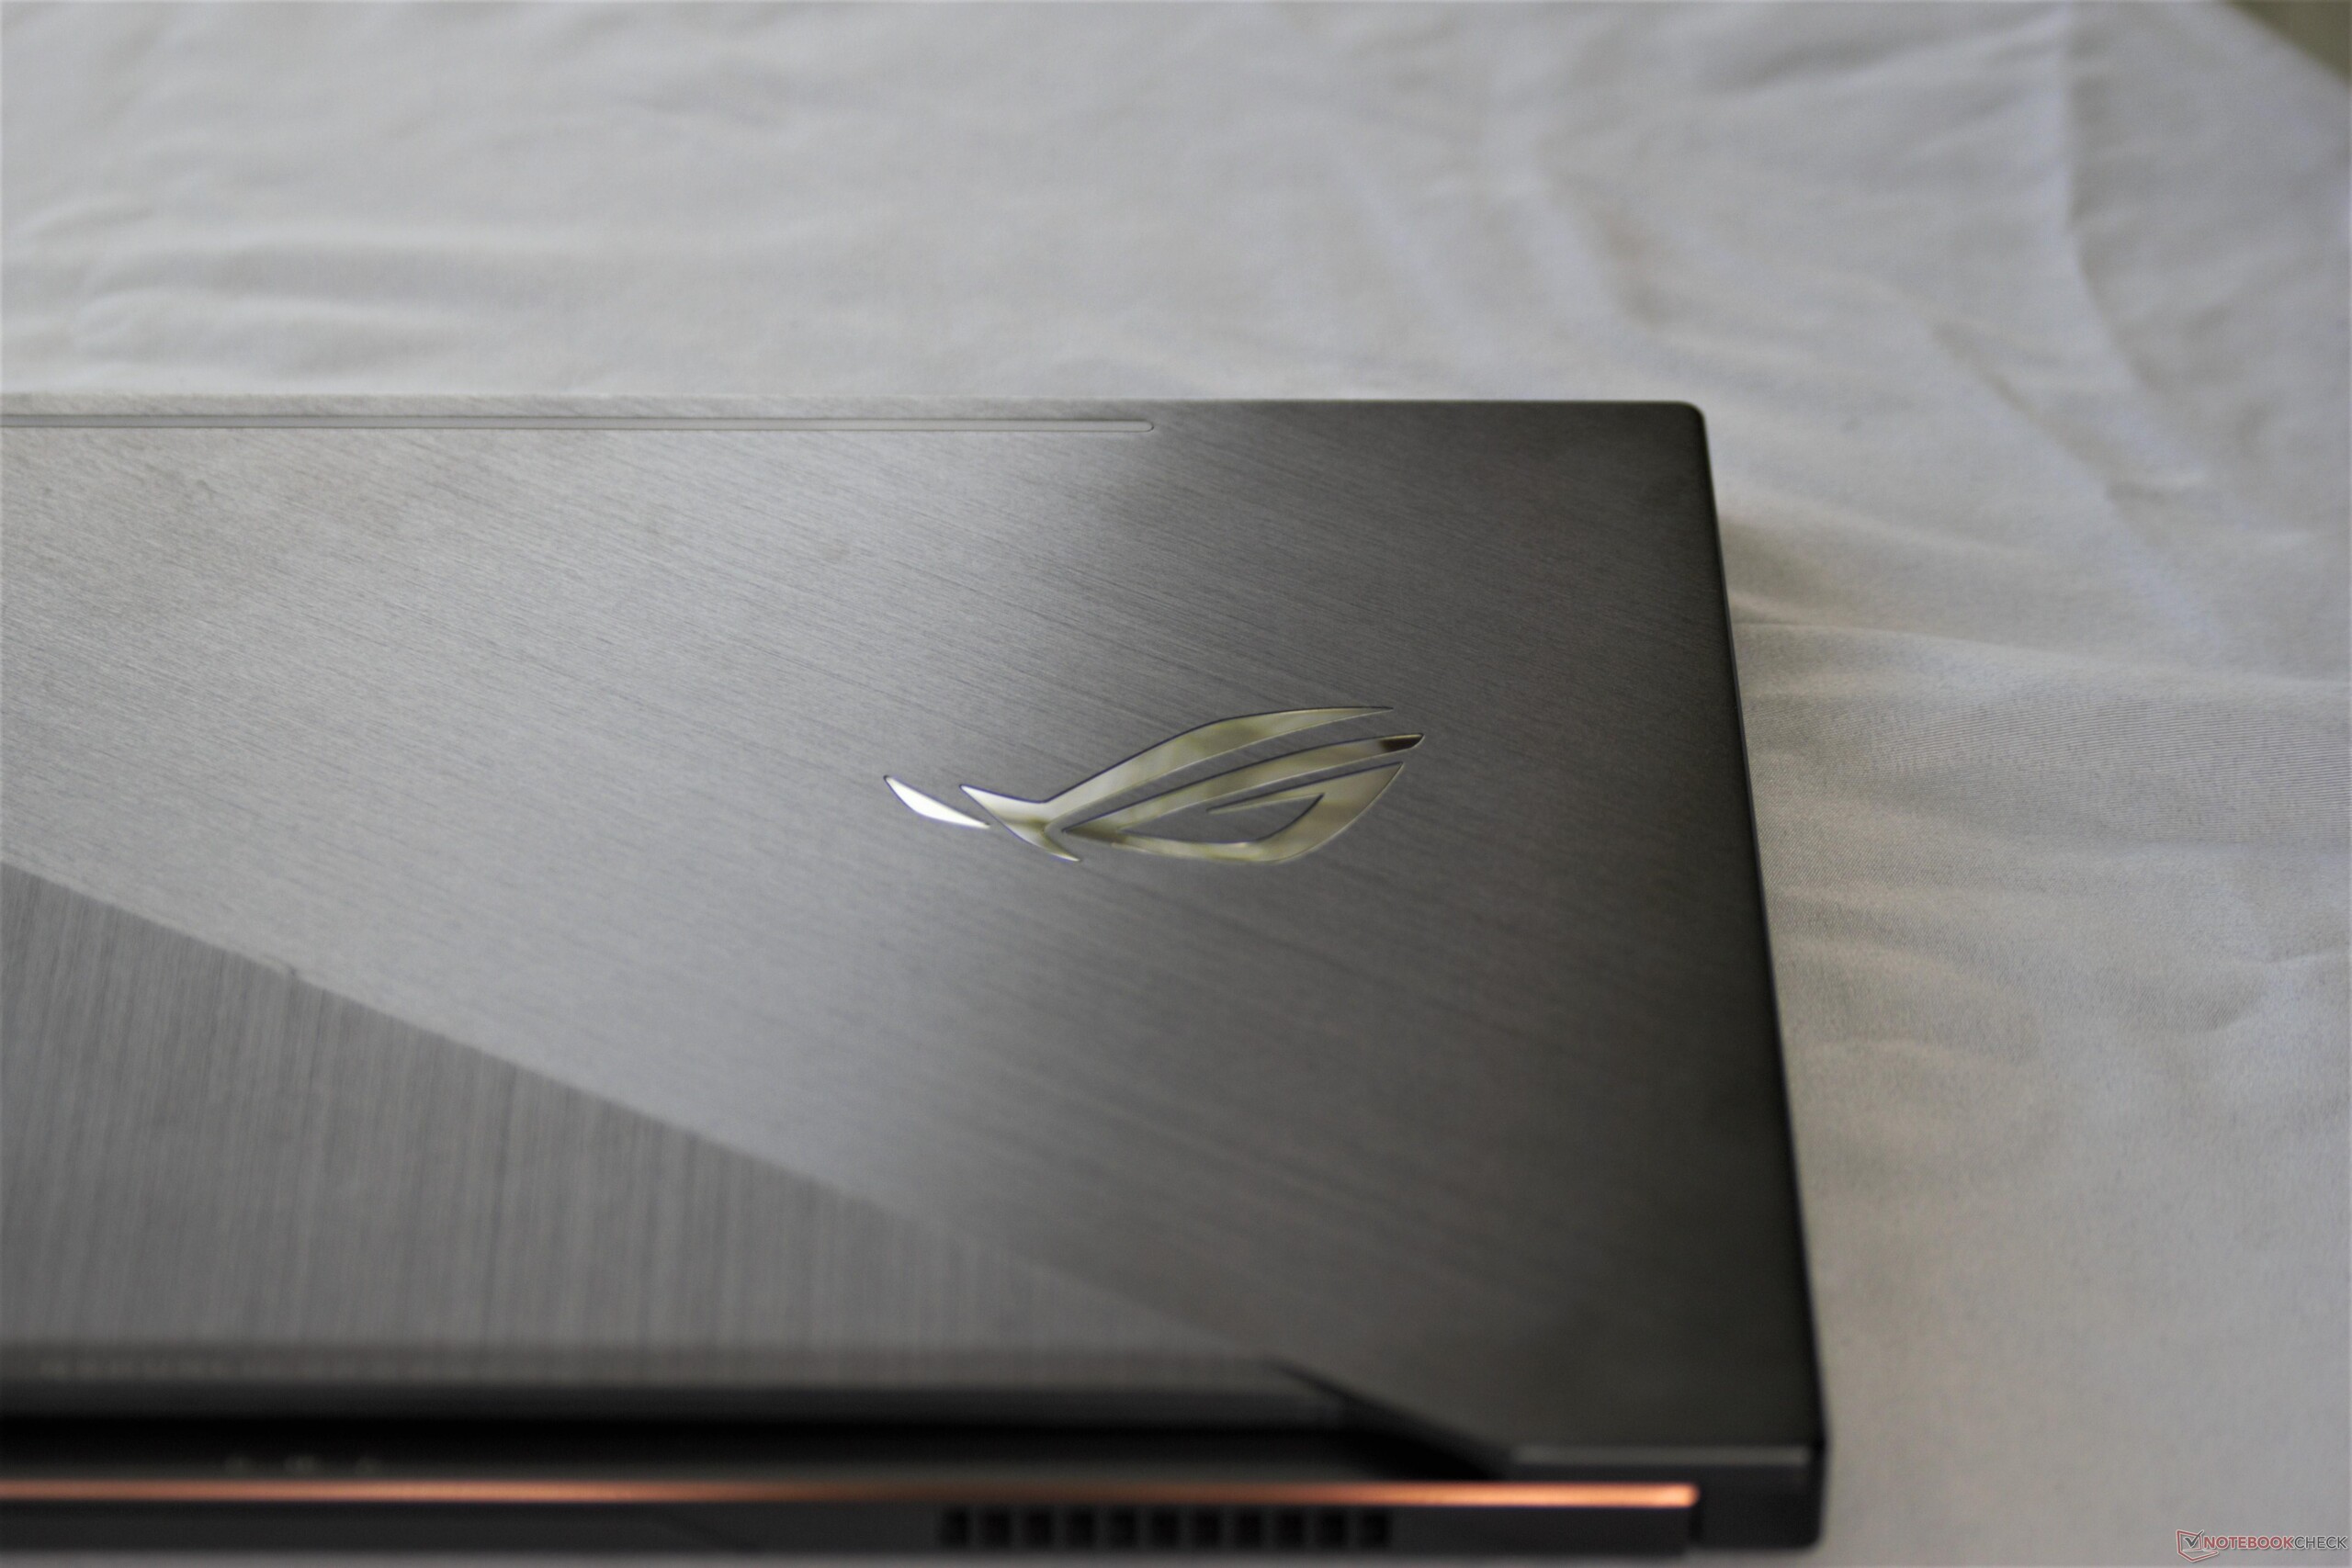
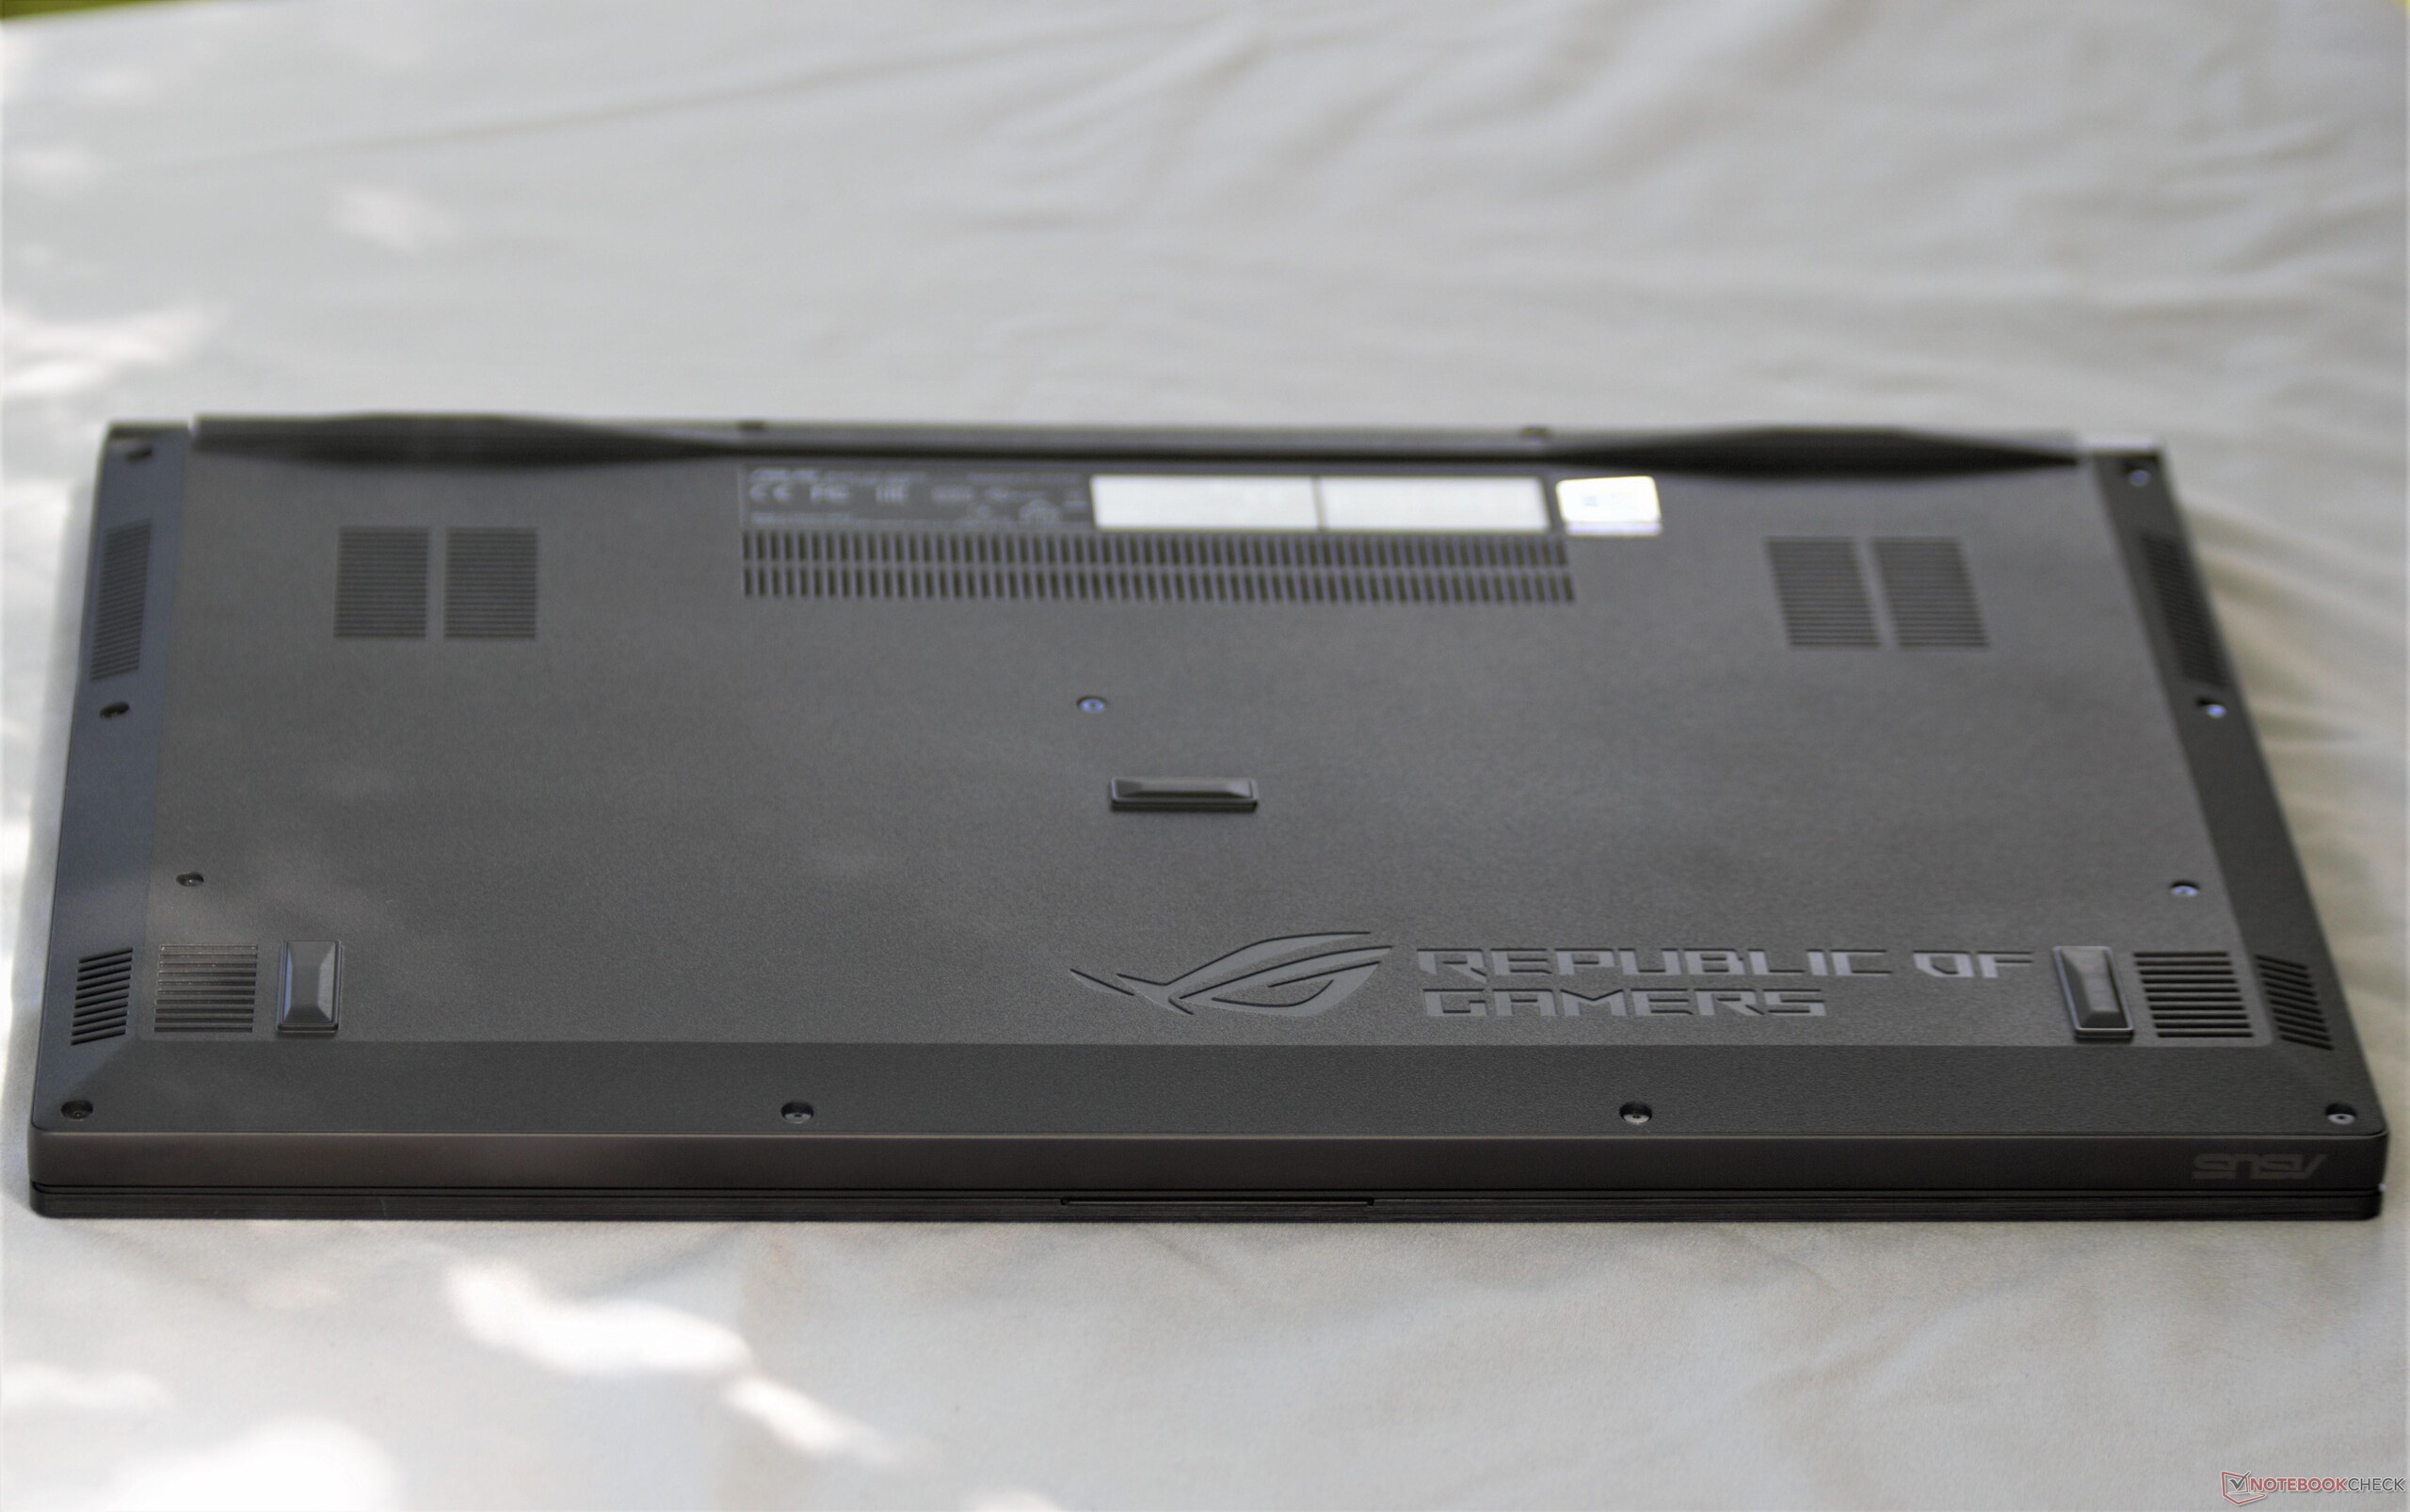
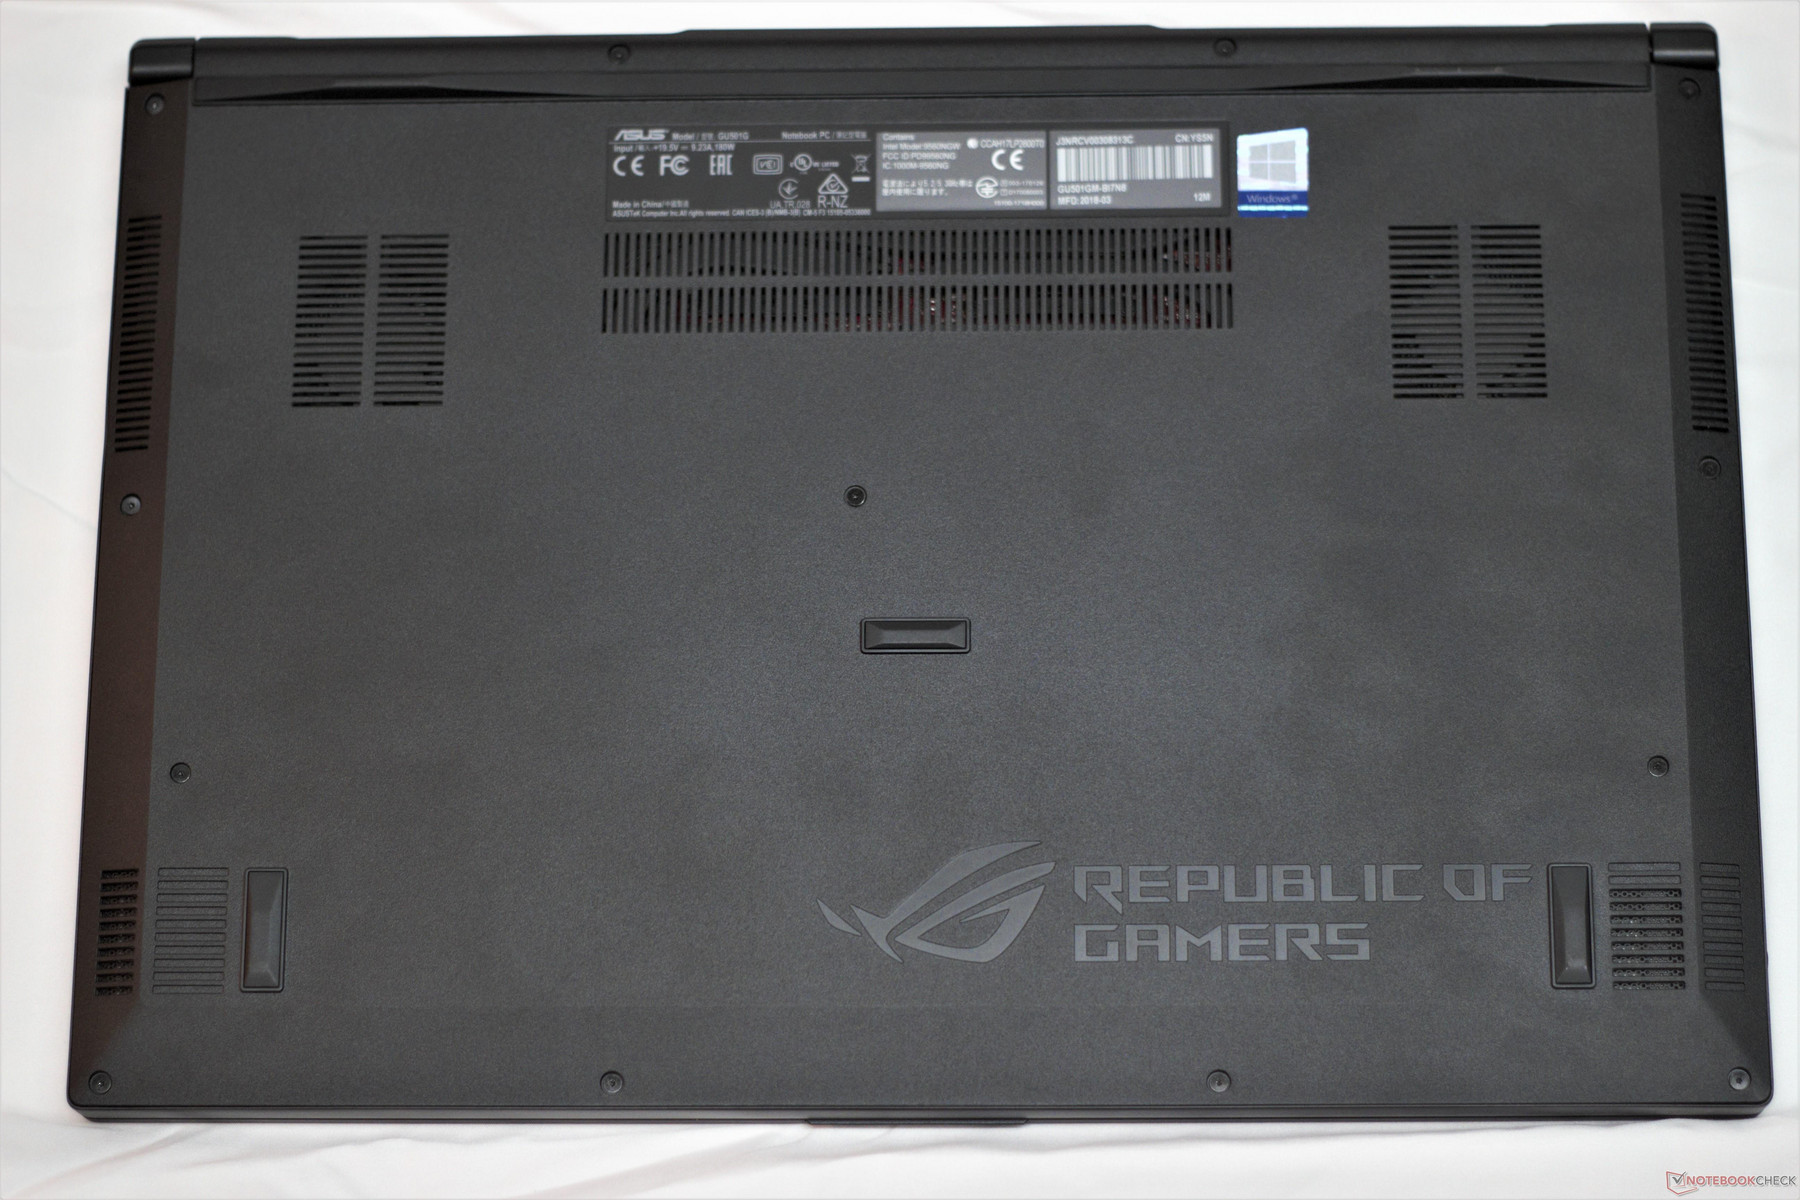
The GU501GM is almost a carbon copy of its bigger brother, the Zephyrus M GM501. The same slim chassis is used, wrapped in the same copper-colored trim. The brushed black finish across the case give the device a decidedly premium look and feel, and the surface of the keyboard deck is highly resistant to fingerprints. The only difference lies in the hinge mechanism. While the actual hinge is the same, the GU501GM lacks the Zephyrus' most unique feature; the back panel remains in place when the GU501GM's lid is opened.
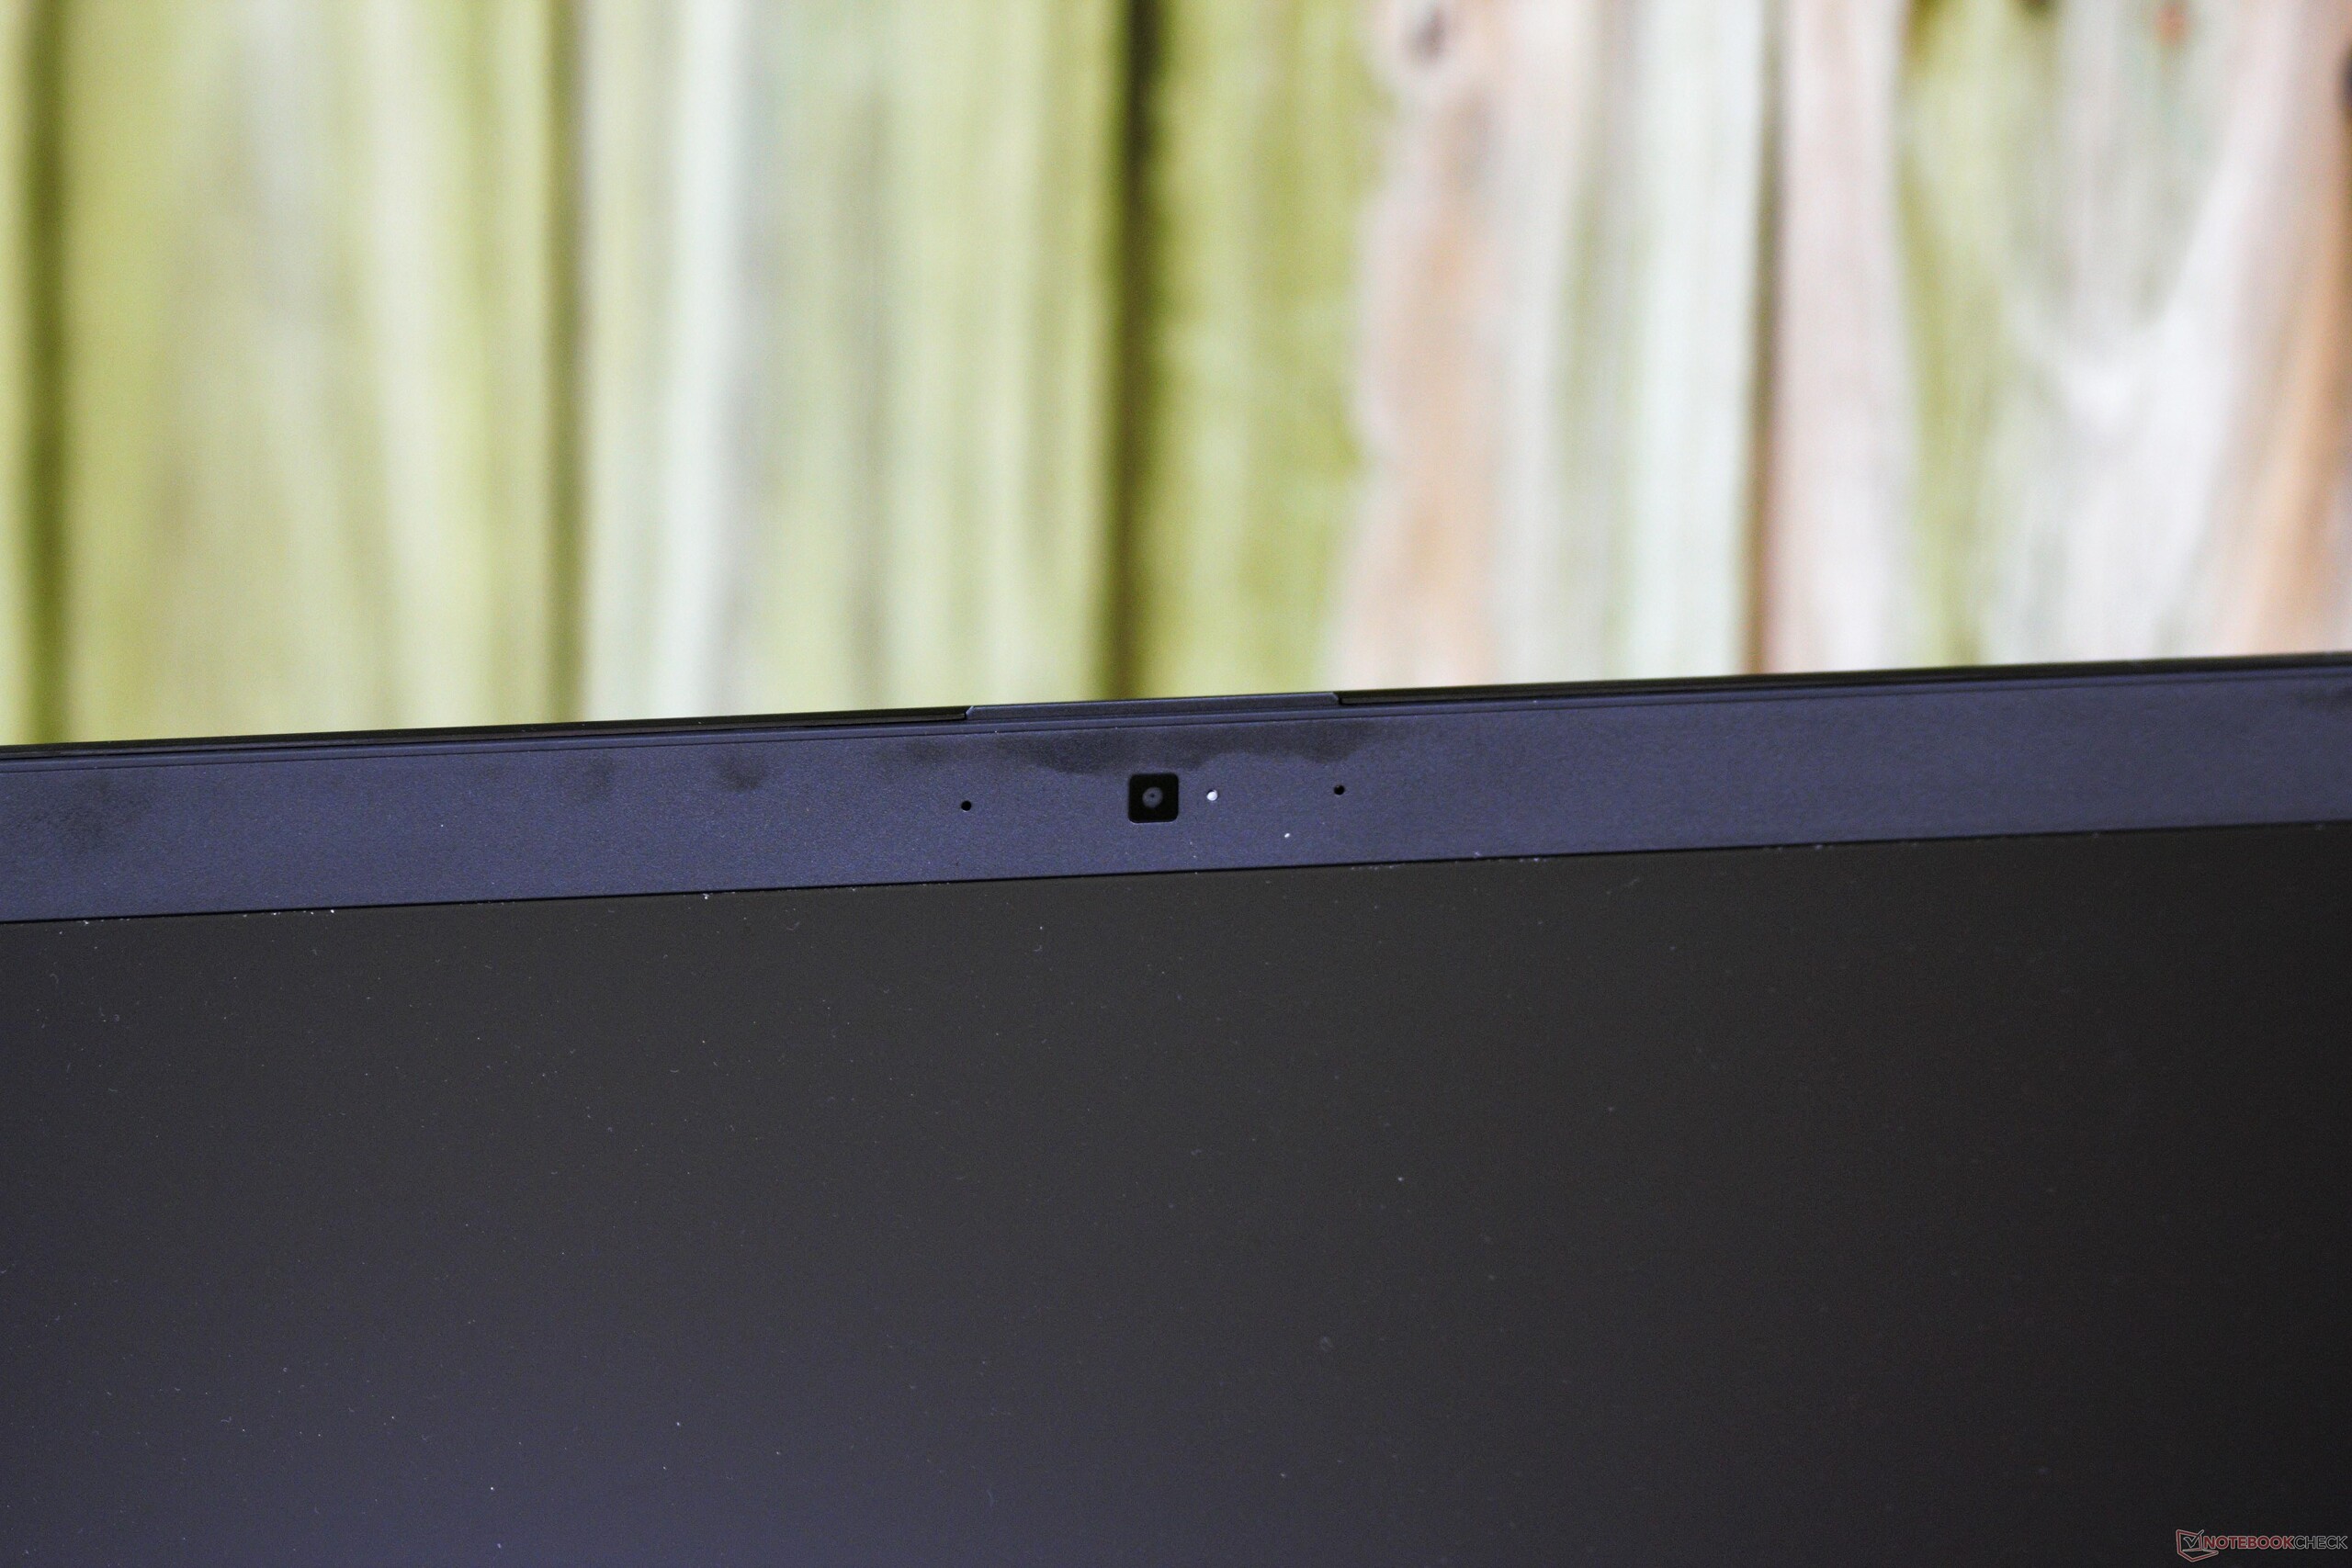
The case is otherwise the same as that of the Zephyrus M GM501. Despite its thin profile, the chassis is sturdy and resists deformation. The plastic bottom panel also remains firm when pressed. The lid can be warped (slightly indented) with direct pressure in the center. The lid can also be bent concave without much work, but no deformation is permanent. The hinge mechanism is well-tuned, allowing for one-handed opening and keeping the screen stable while typing. The biggest sore points in the design are the plastic bezels around the display. Both the Aero 15X and MSI GS65 have much smaller bezels holding the screen in place and have a smaller overall footprint as a result. The plastic bezels on the GU501GM look almost comically large in contrast.
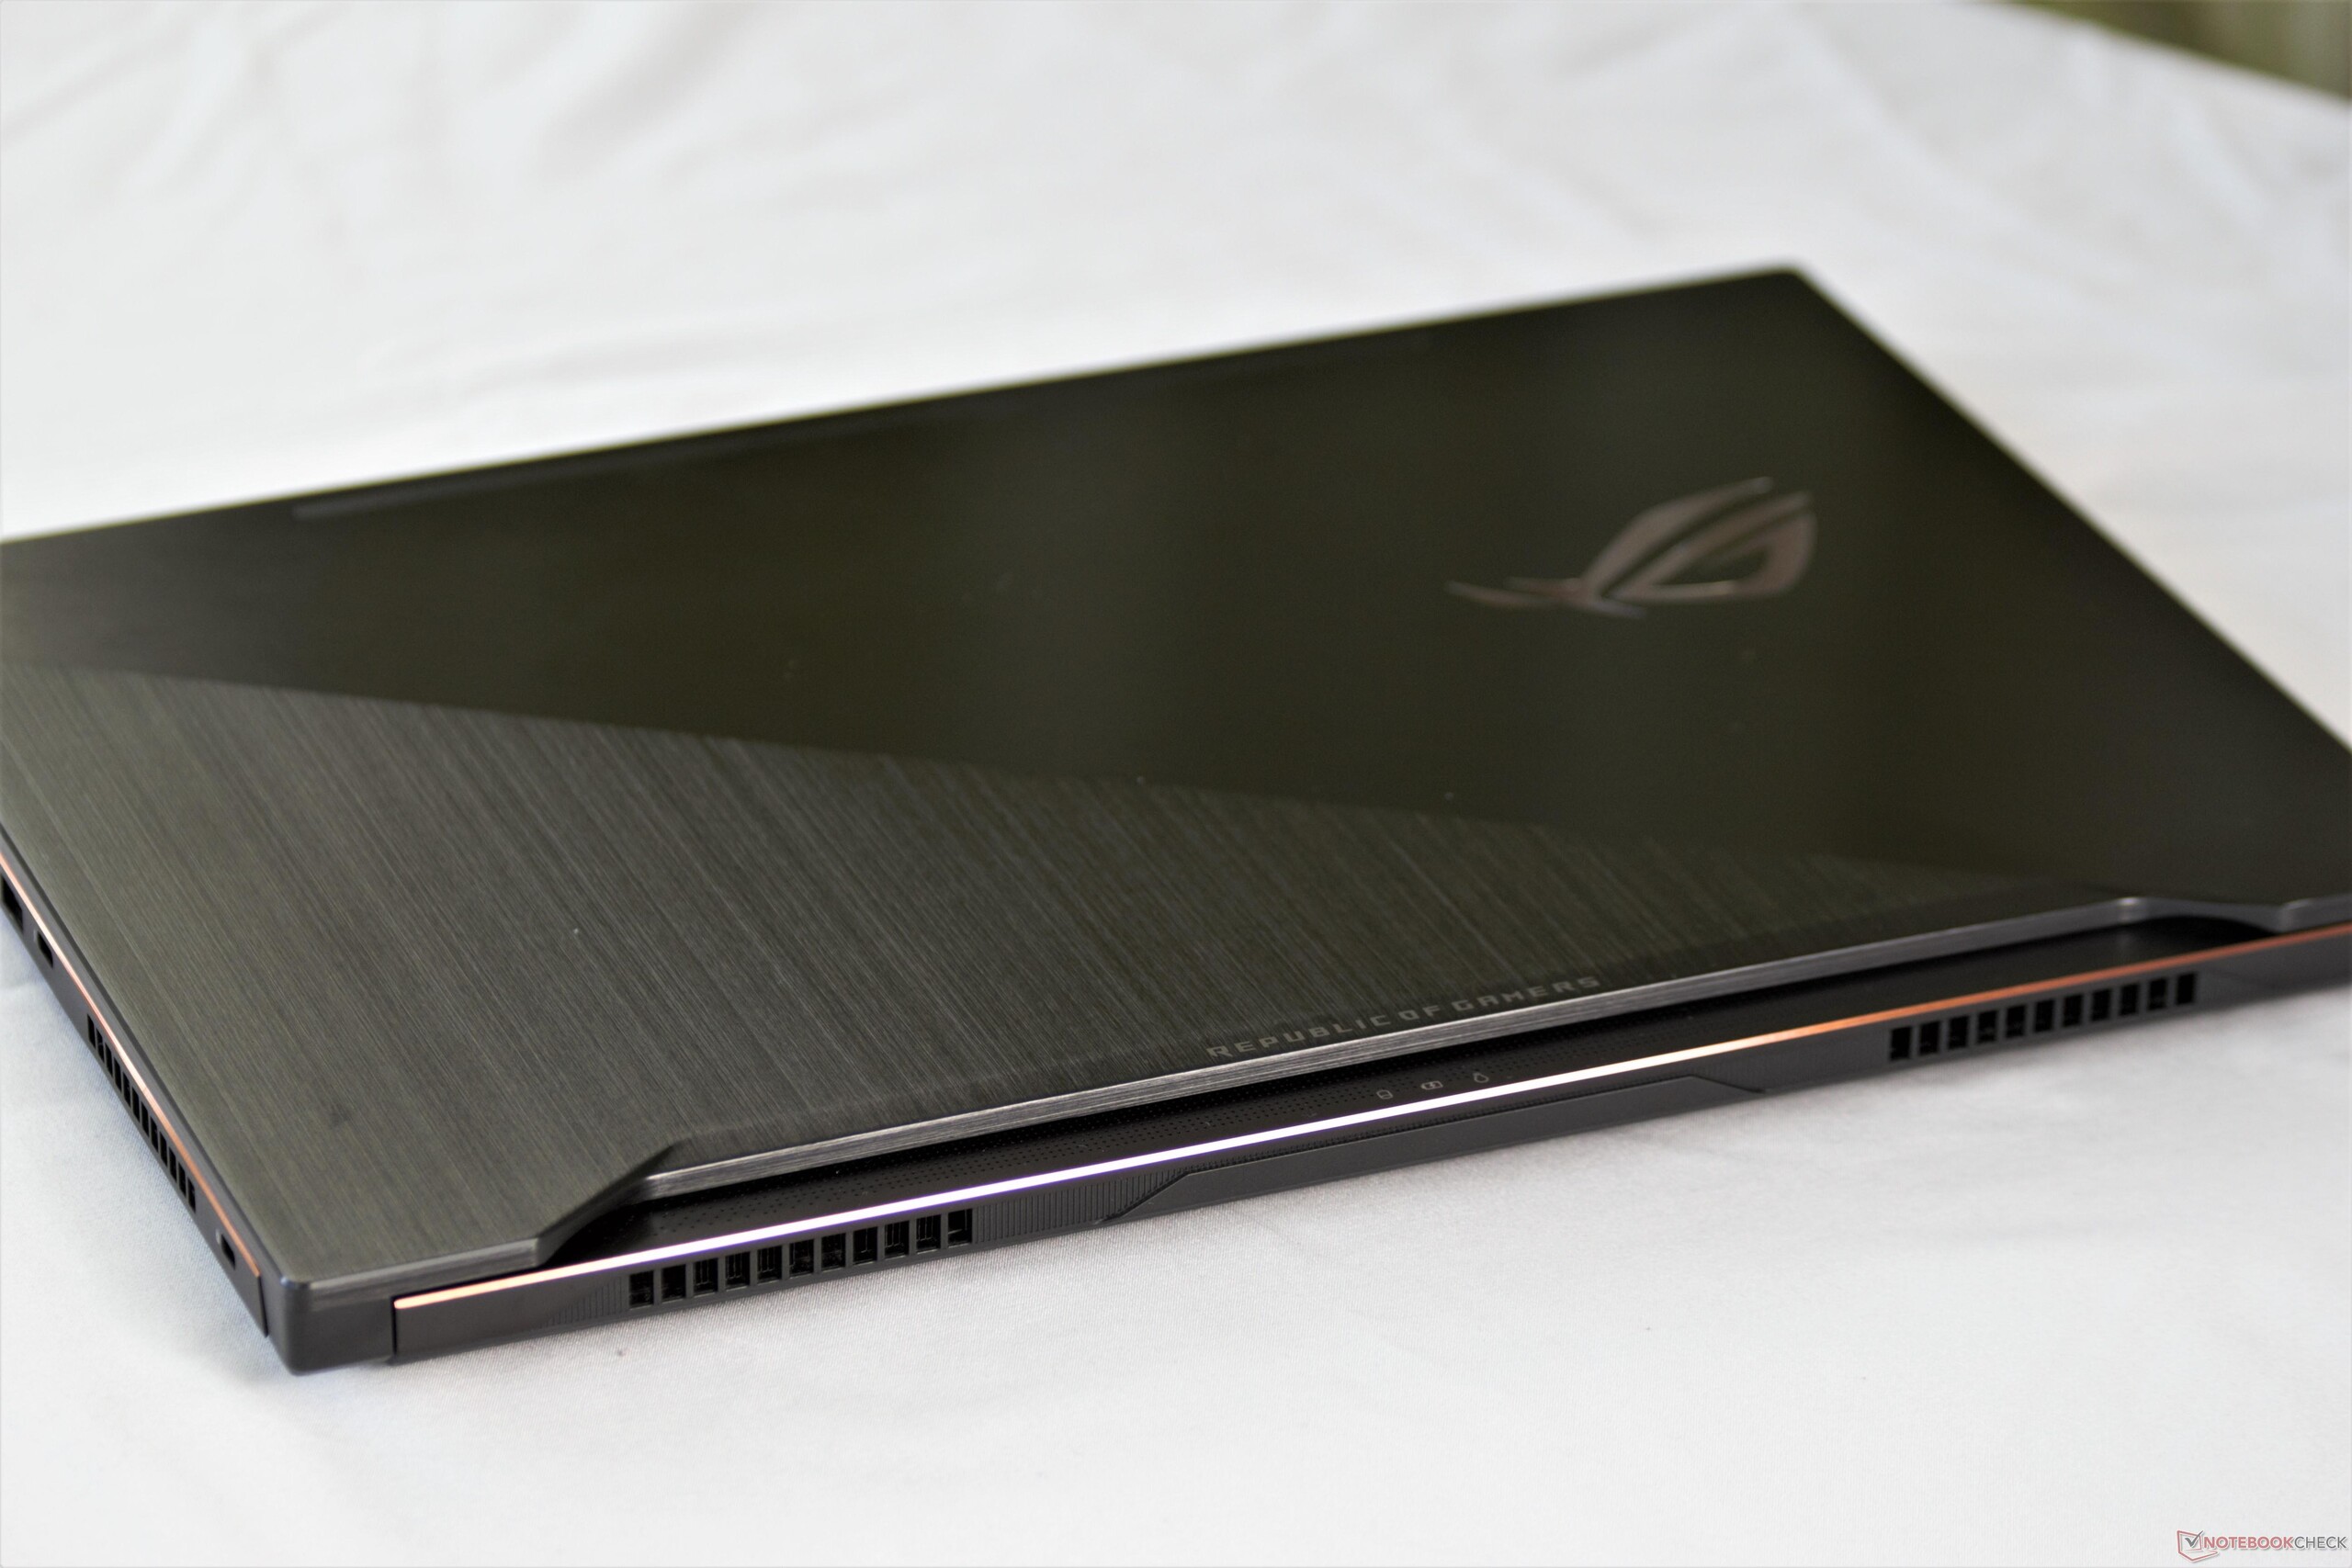
The GU501GM's footprint does not meet the 2018 standards for a premium-built gaming device. While the size is not out of the ordinary, competitors like the MSI GS65 have managed to compact their 15-inch gamers into a case close in size to that of a 14-inch laptop. More devices are chiselling away at screen bezels to fit more into less, and the GU501GM feels outdated in this regard. Not only is GU501GM larger than competitors, it is heavier as well. Again, at 2.5 kg, the machine is not unreasonably massive, but competitors have the upper hand here as well.
Connectivity
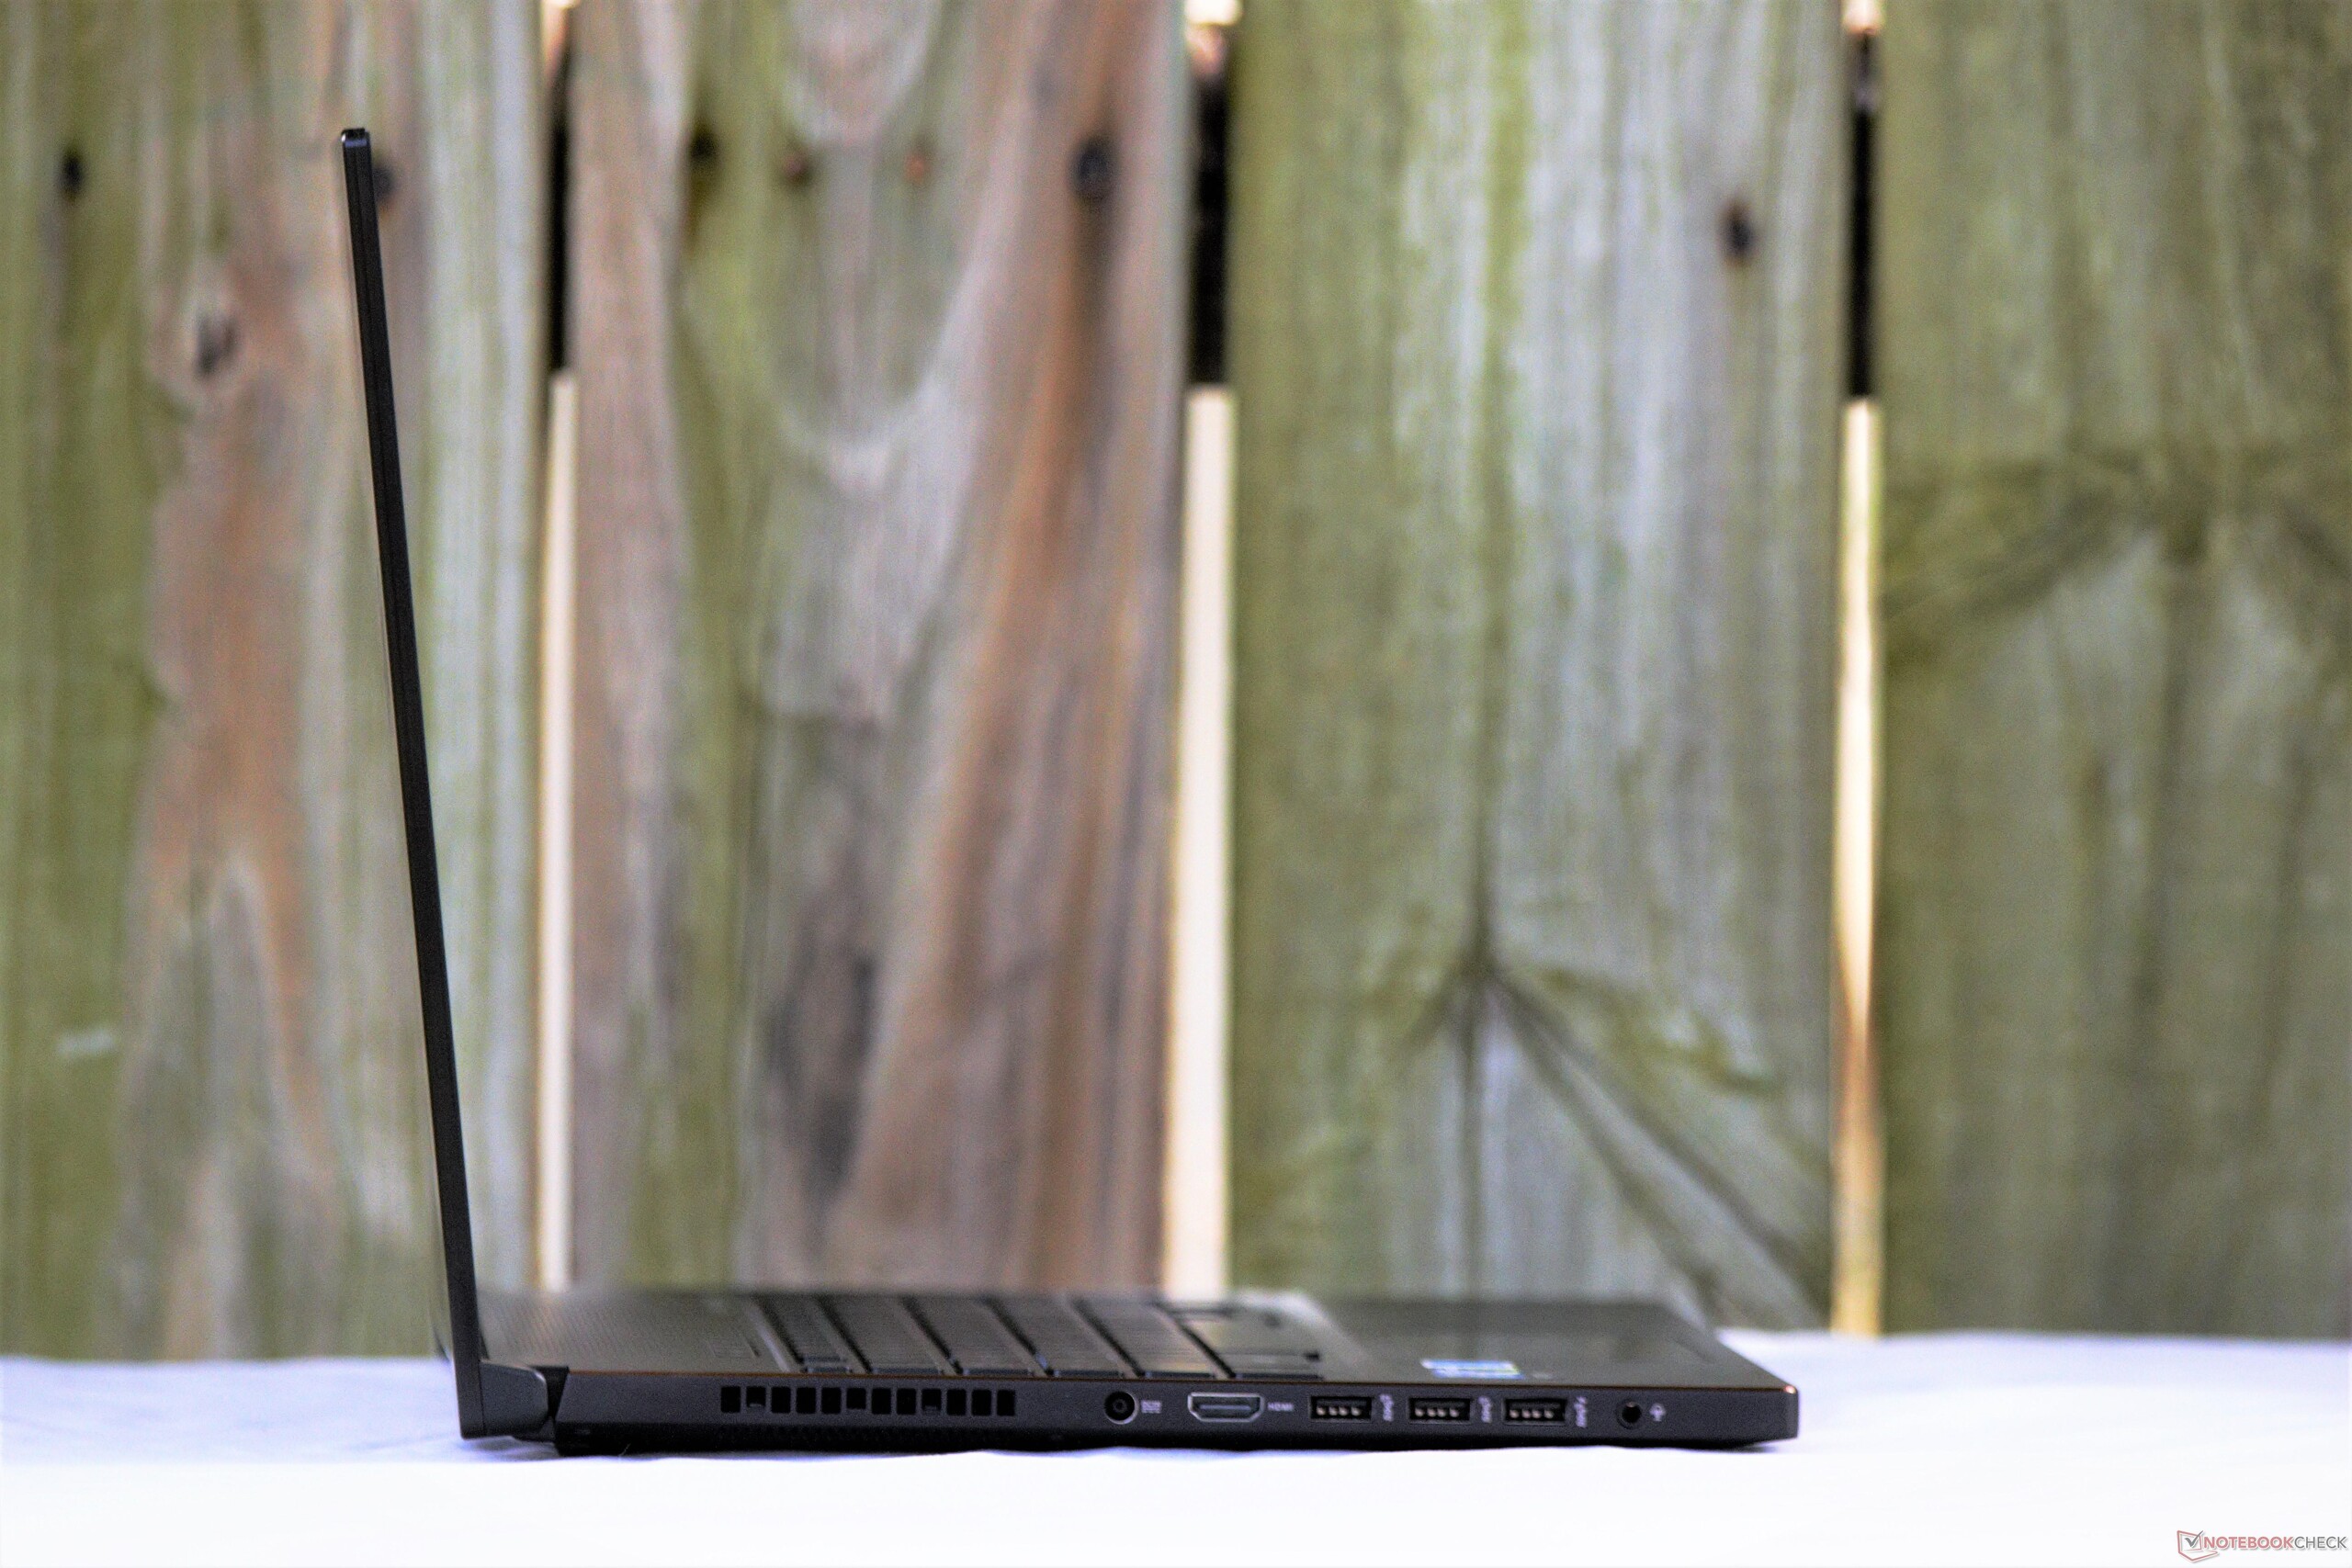
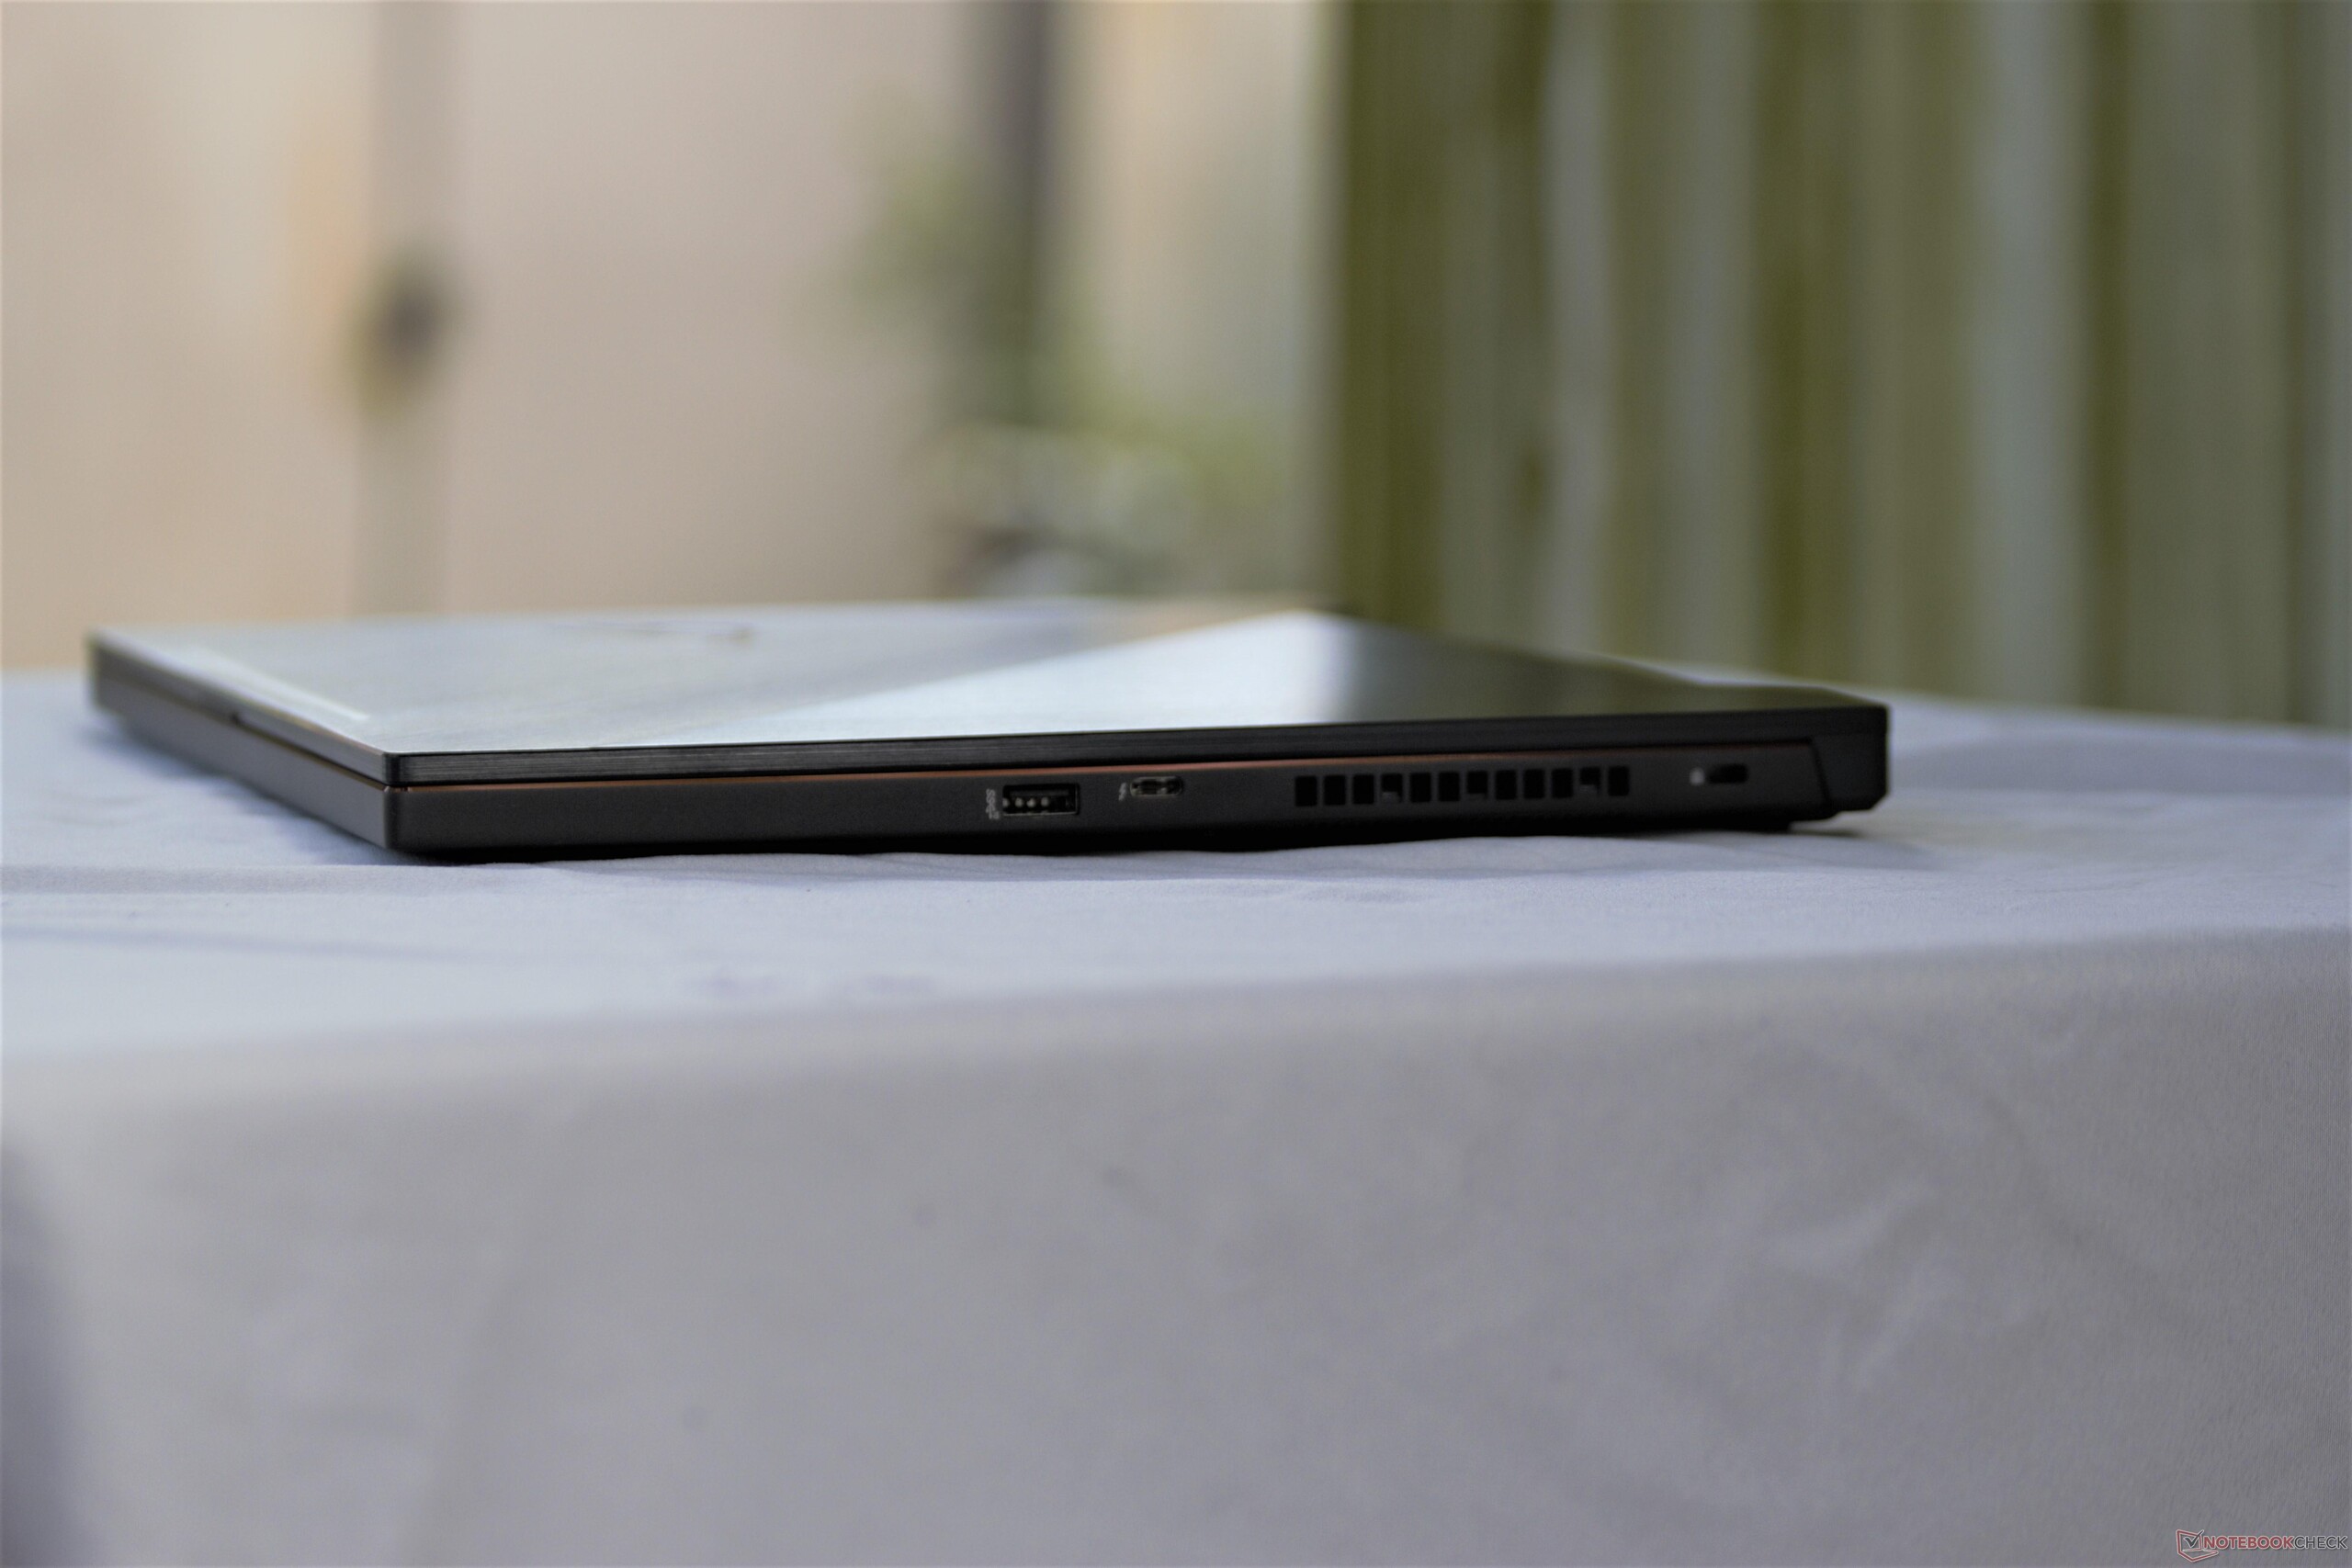
Just like the case, the port selection is a mirror image of the Zephyrus M GM501. Thus, while it offers the same variety of connections (4x USB 3.1 Gen 2, HDMI 1.4, Thunderbolt 3), the port layout suffers the same poor placement we noted on the Zephyrus. All ports are pushed toward the front of the device to make room for the side ventilation, which may annoy some users. The lack of an SD Card reader is also worth noting; while not a deal breaker, the absence of a card reader will be frustrating to some.


Communication
WiFi speeds are in range for a higher-end gaming device and about on par with competitors. Users should find no cause for complaint with transfer speeds or signal strength. During our testing period, we saw no dropped signals. The GU501GM does not have a built-in Ethernet port, however, so a dongle is required for physical connections.
Maintenance & Warranty
Unlike the Zephyrus M, the GU501GM's bottom panel is a single, solid piece of plastic. The panel is held in by 13 Torx T5 screws of varying length, so would-be DIYers should make sure to keep them organized. Despite our best efforts, we could not find a suitable pry point to remove the bottom panel. As such, we did not proceed with further disassembly to prevent damaging the outer case.
Asus offers a standard 12-month warranty with the GU501GM.
Input Devices
Keyboard
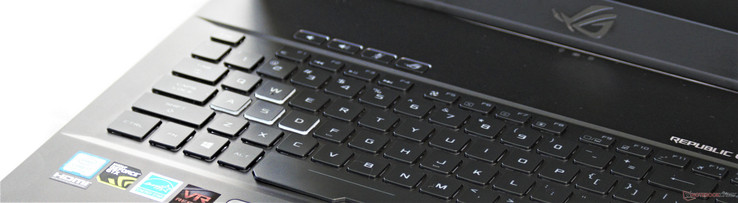
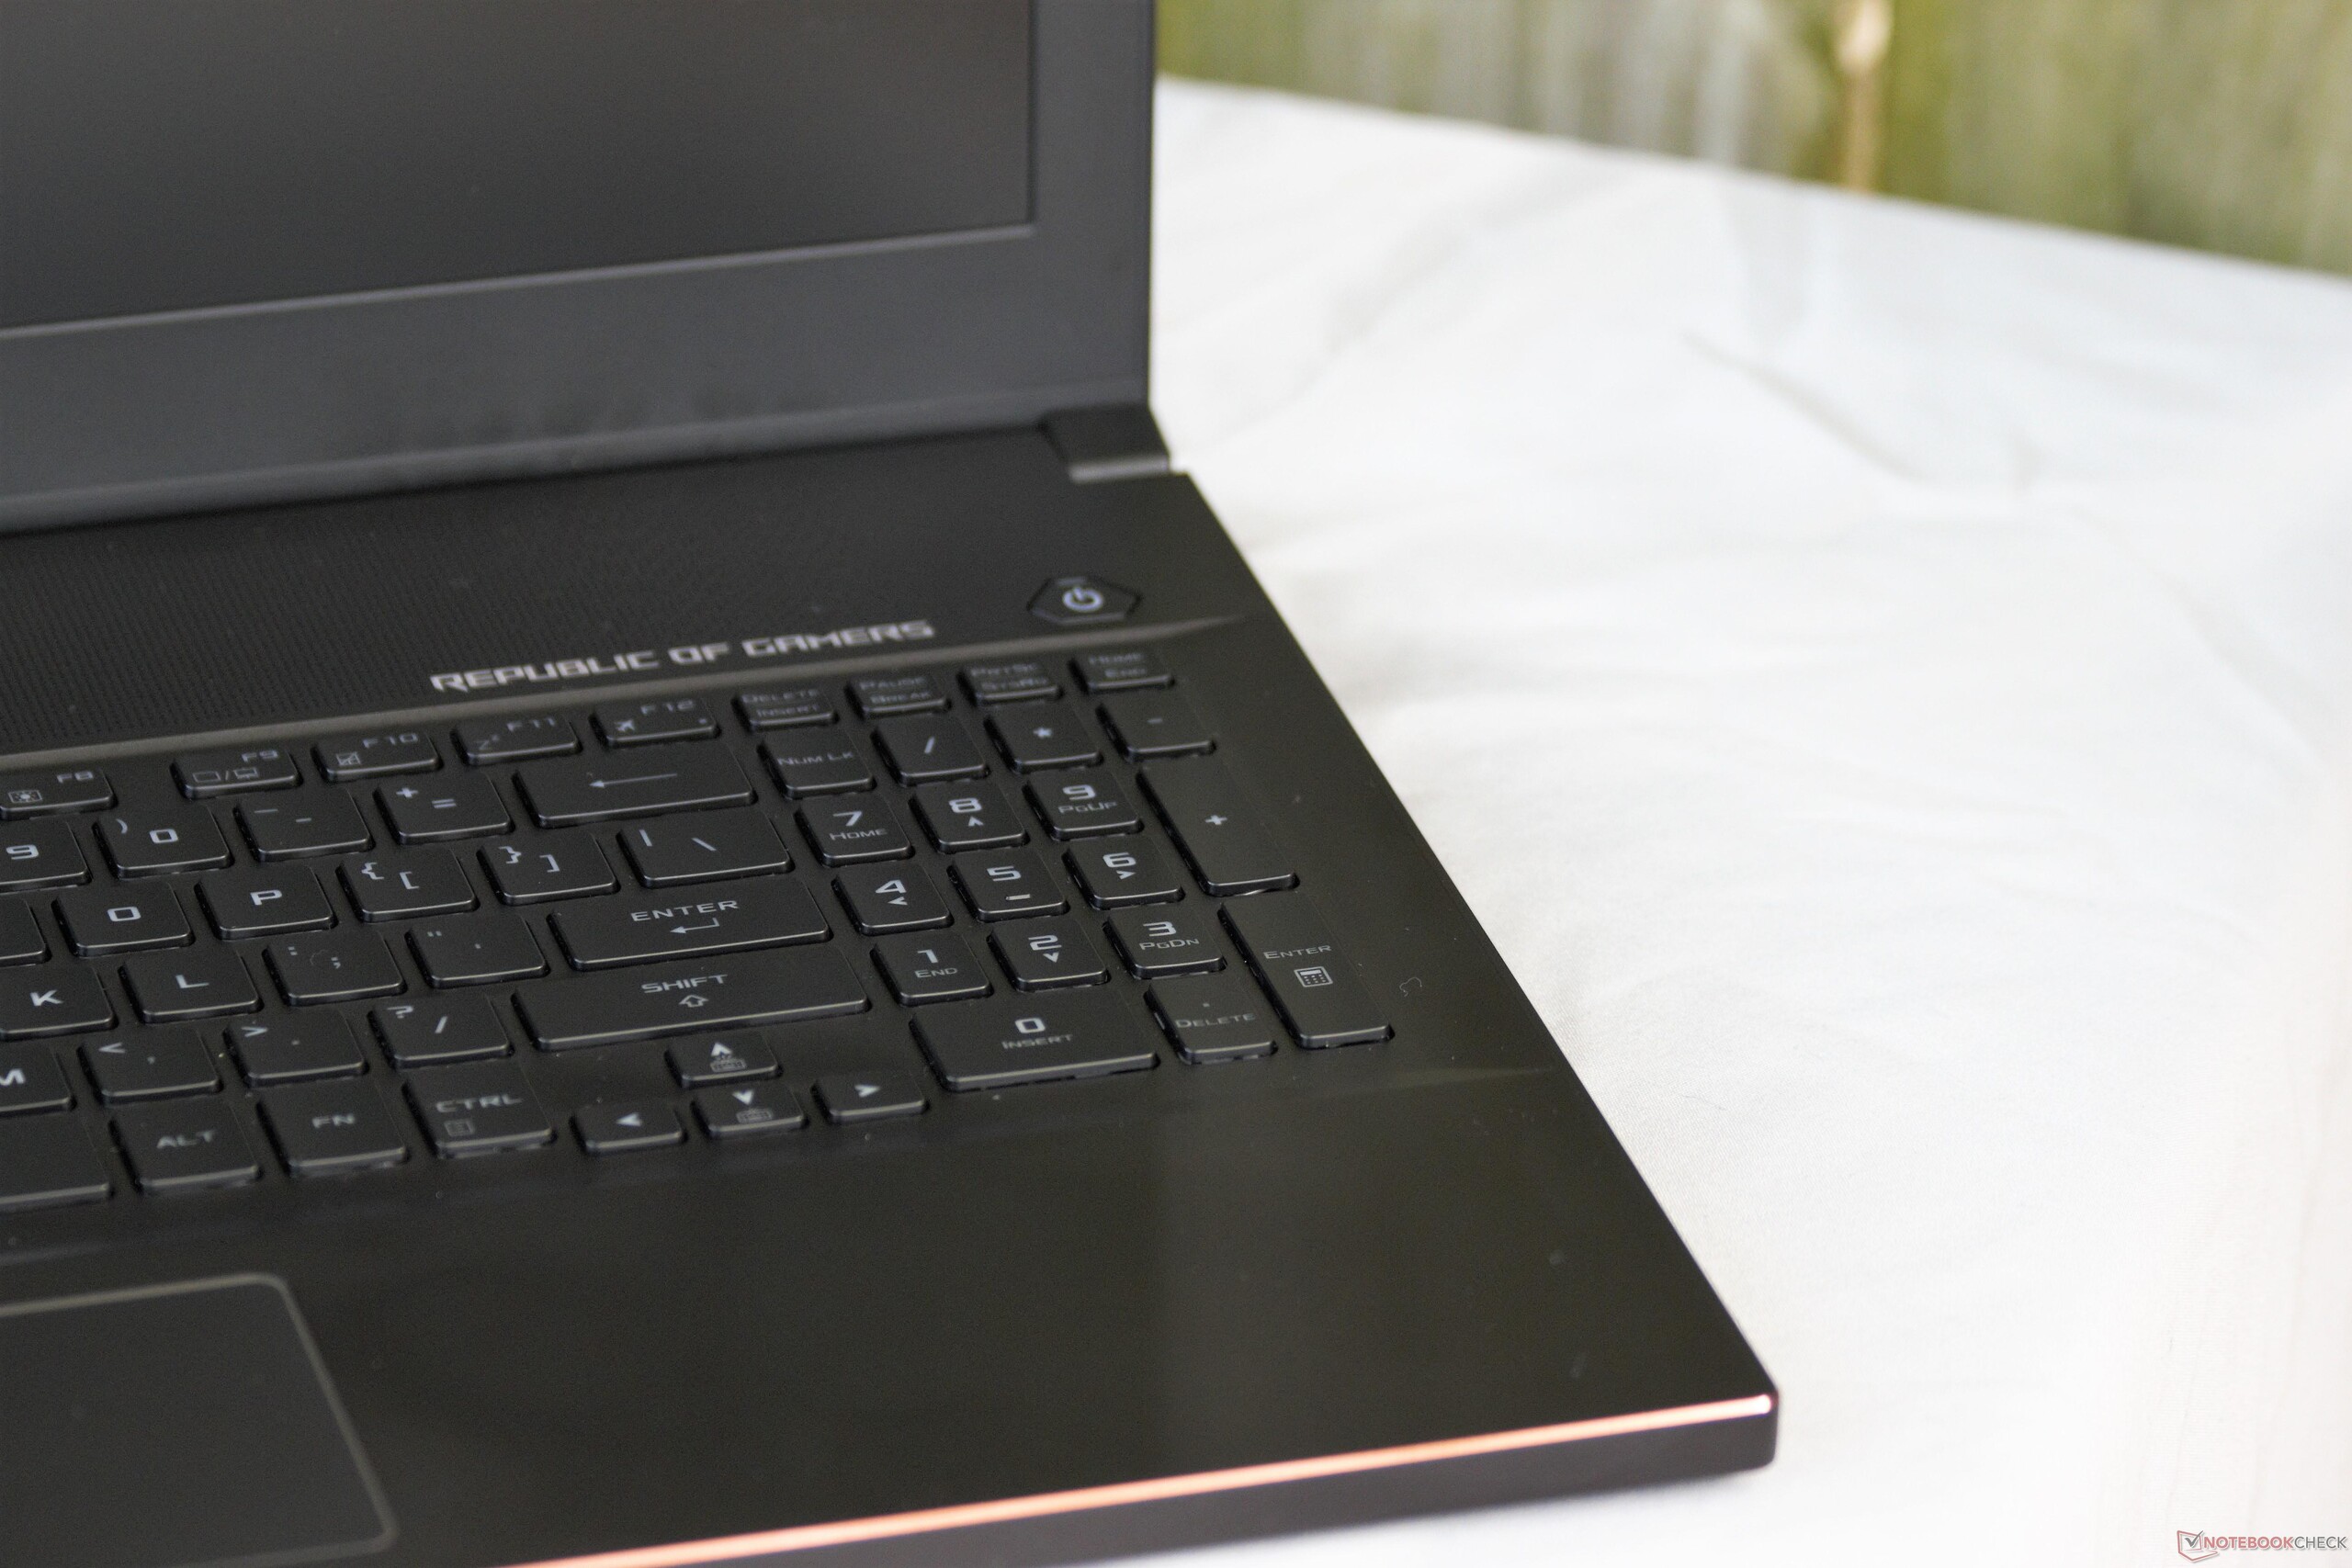
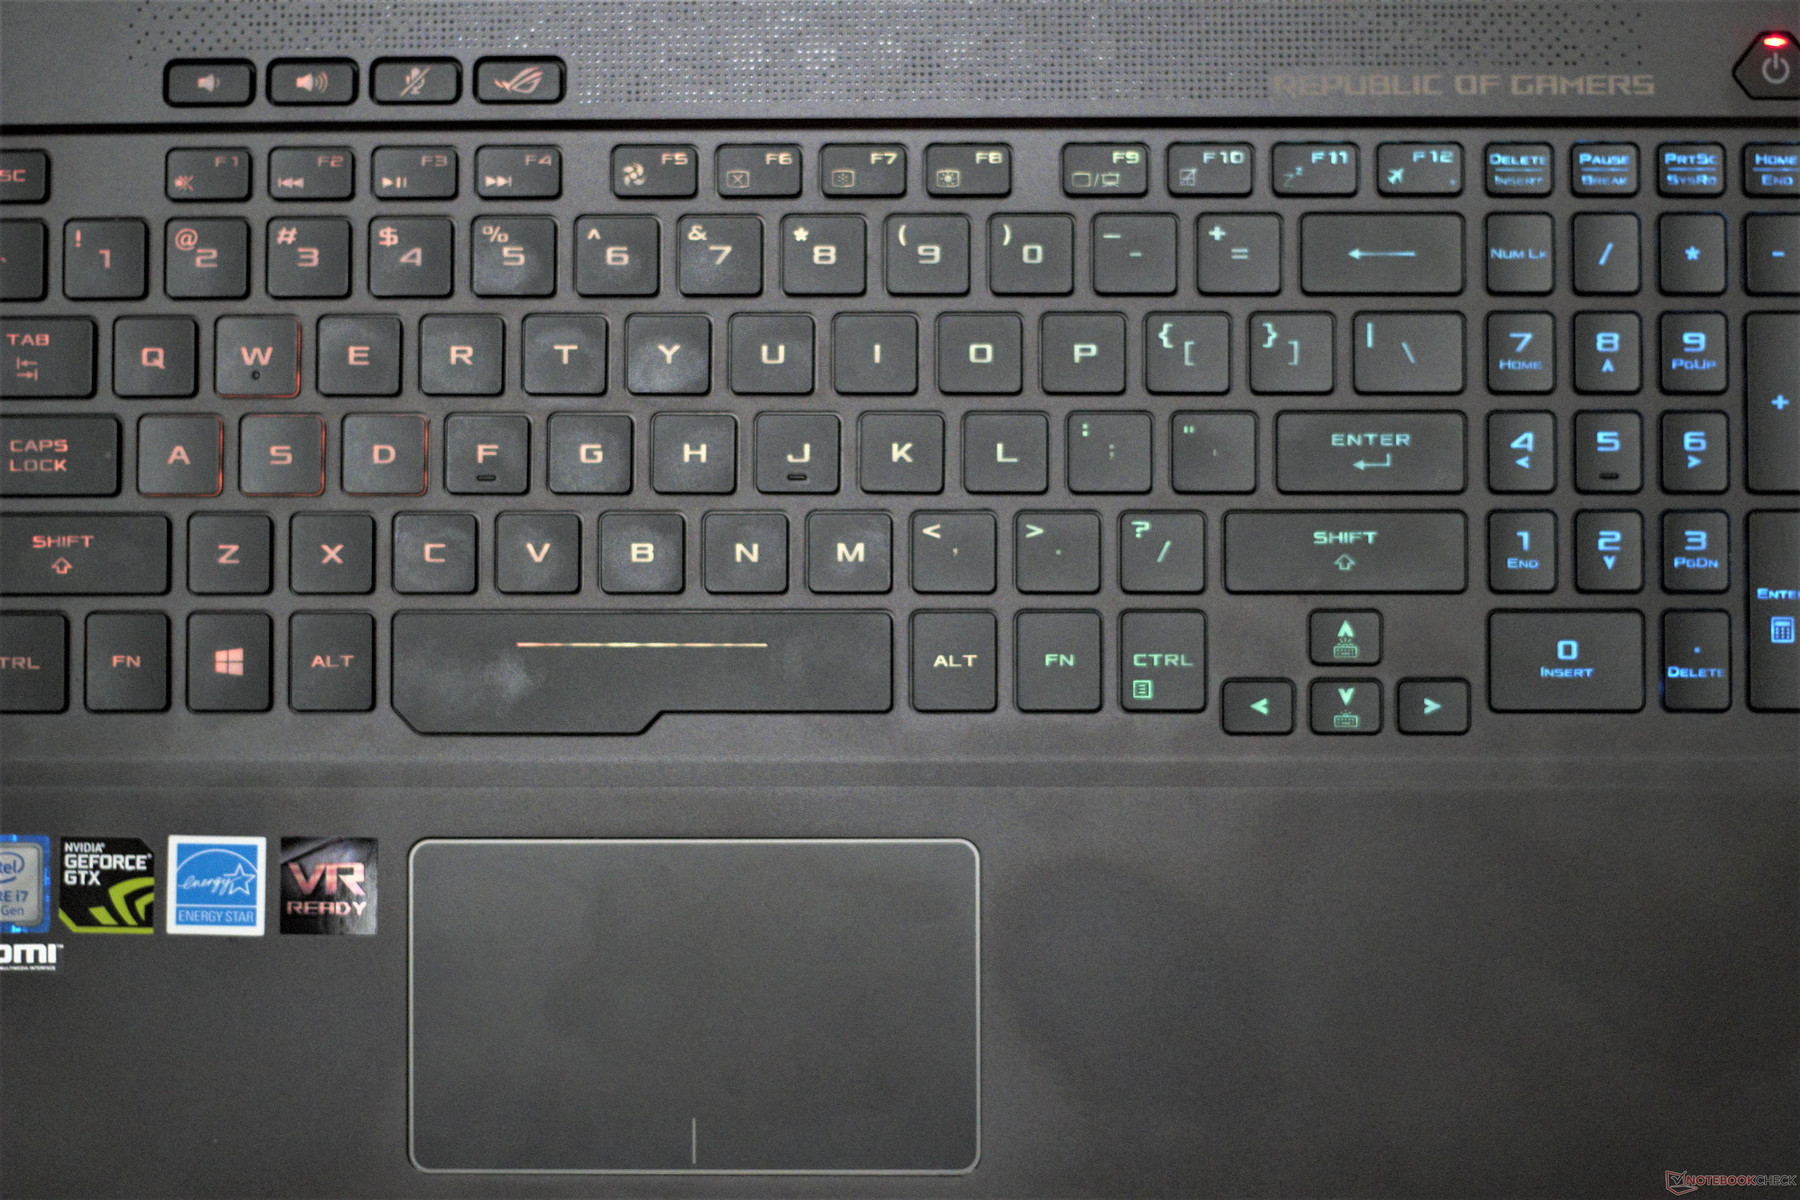
The keyboard is one of the stronger points of the GU501GM. The arrow keys are a bit too small for our tastes, but the rest of the keys are well-sized and well-spaced. Key feedback is excellent with a smooth downward action and springy response. Key clatter is minimal, and the overall typing experience is one of the better keyboards used in a gaming laptop. The GU501GM's keyboard feels similar to MSI's highly-regarded SteelSeries keyboards, save for a bit of travel distance in the keys. Feedback mirrors that of other ROG G series laptops.
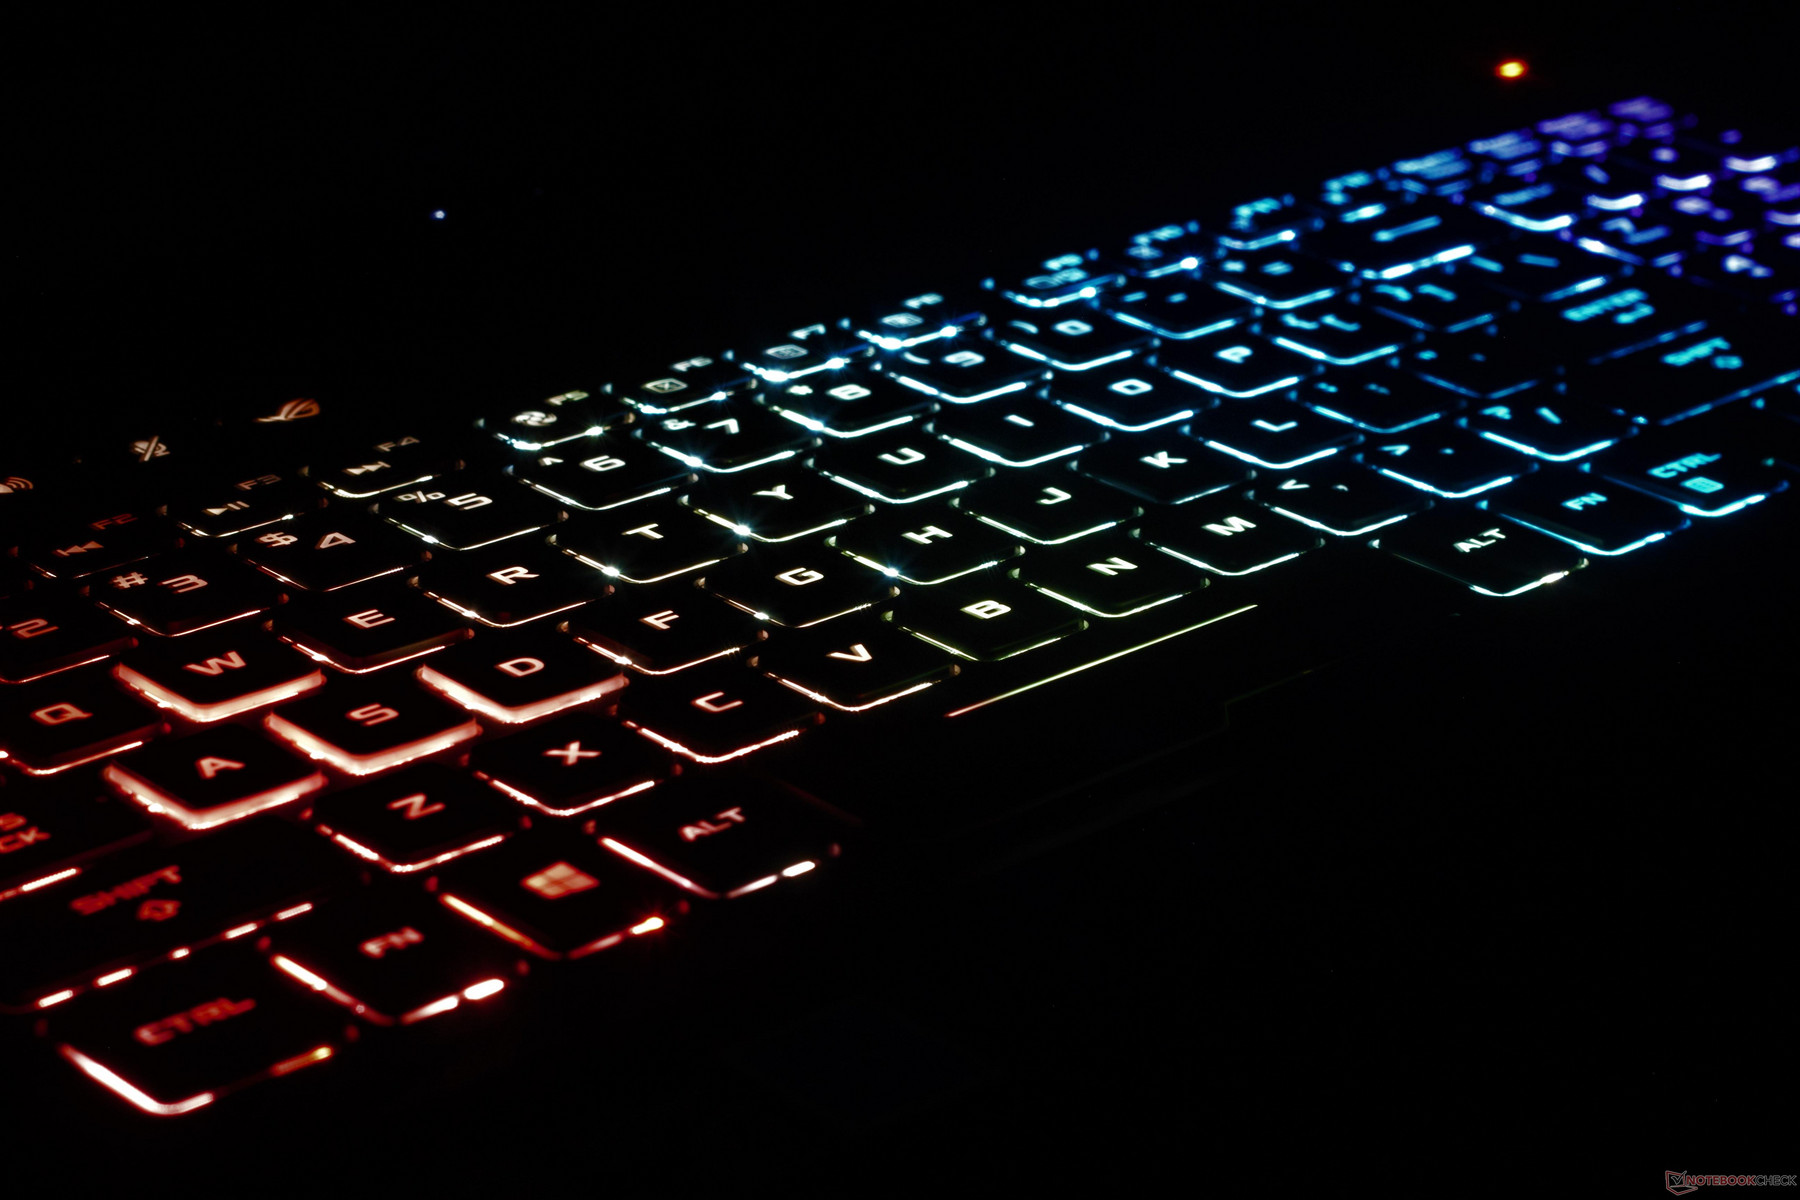
The keyboard, like so many other factors, is a carryover from the more expensive Zephyrus M and deserves the same praises we lauded in that review. That is, the multiple Fn key functions (fan speed, trackpad disabling, etc.) and dedicated volume, microphone, and ROG Center keys are excellent additions. The copious amounts of RGB modes are a nice addition, but other notebooks (like the Aero 15X) offer per-key RGB backlighting.
Touchpad
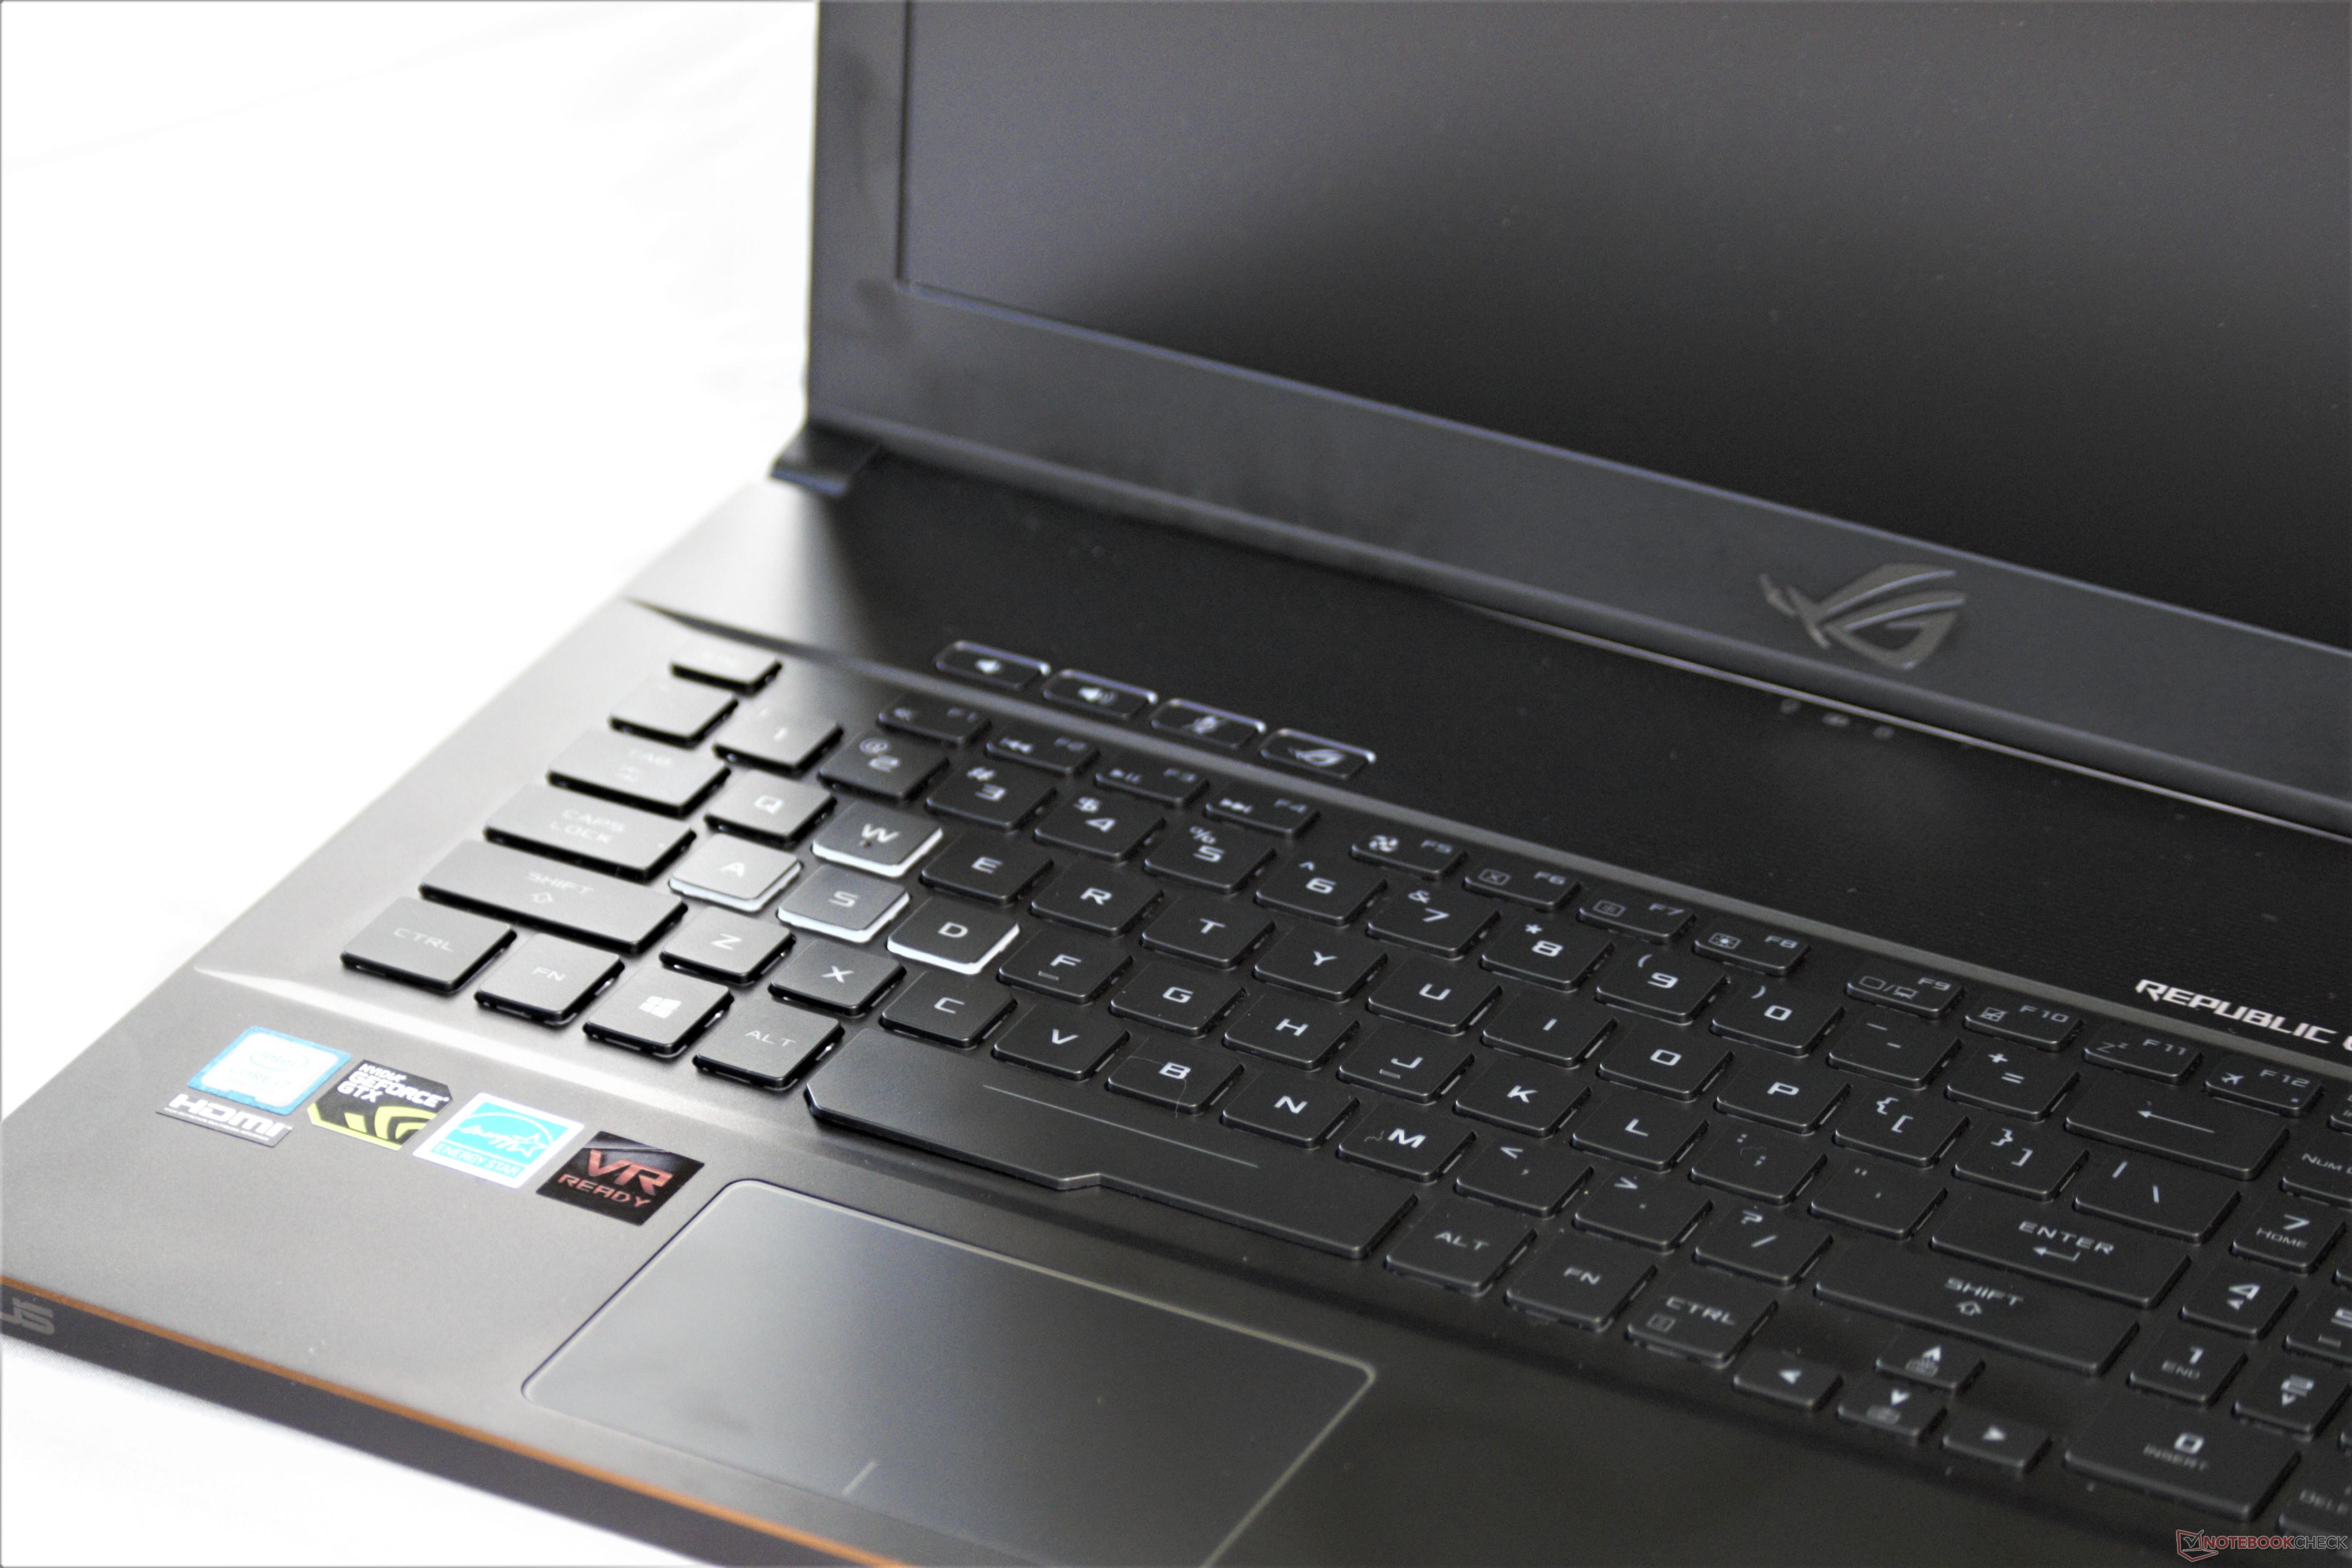
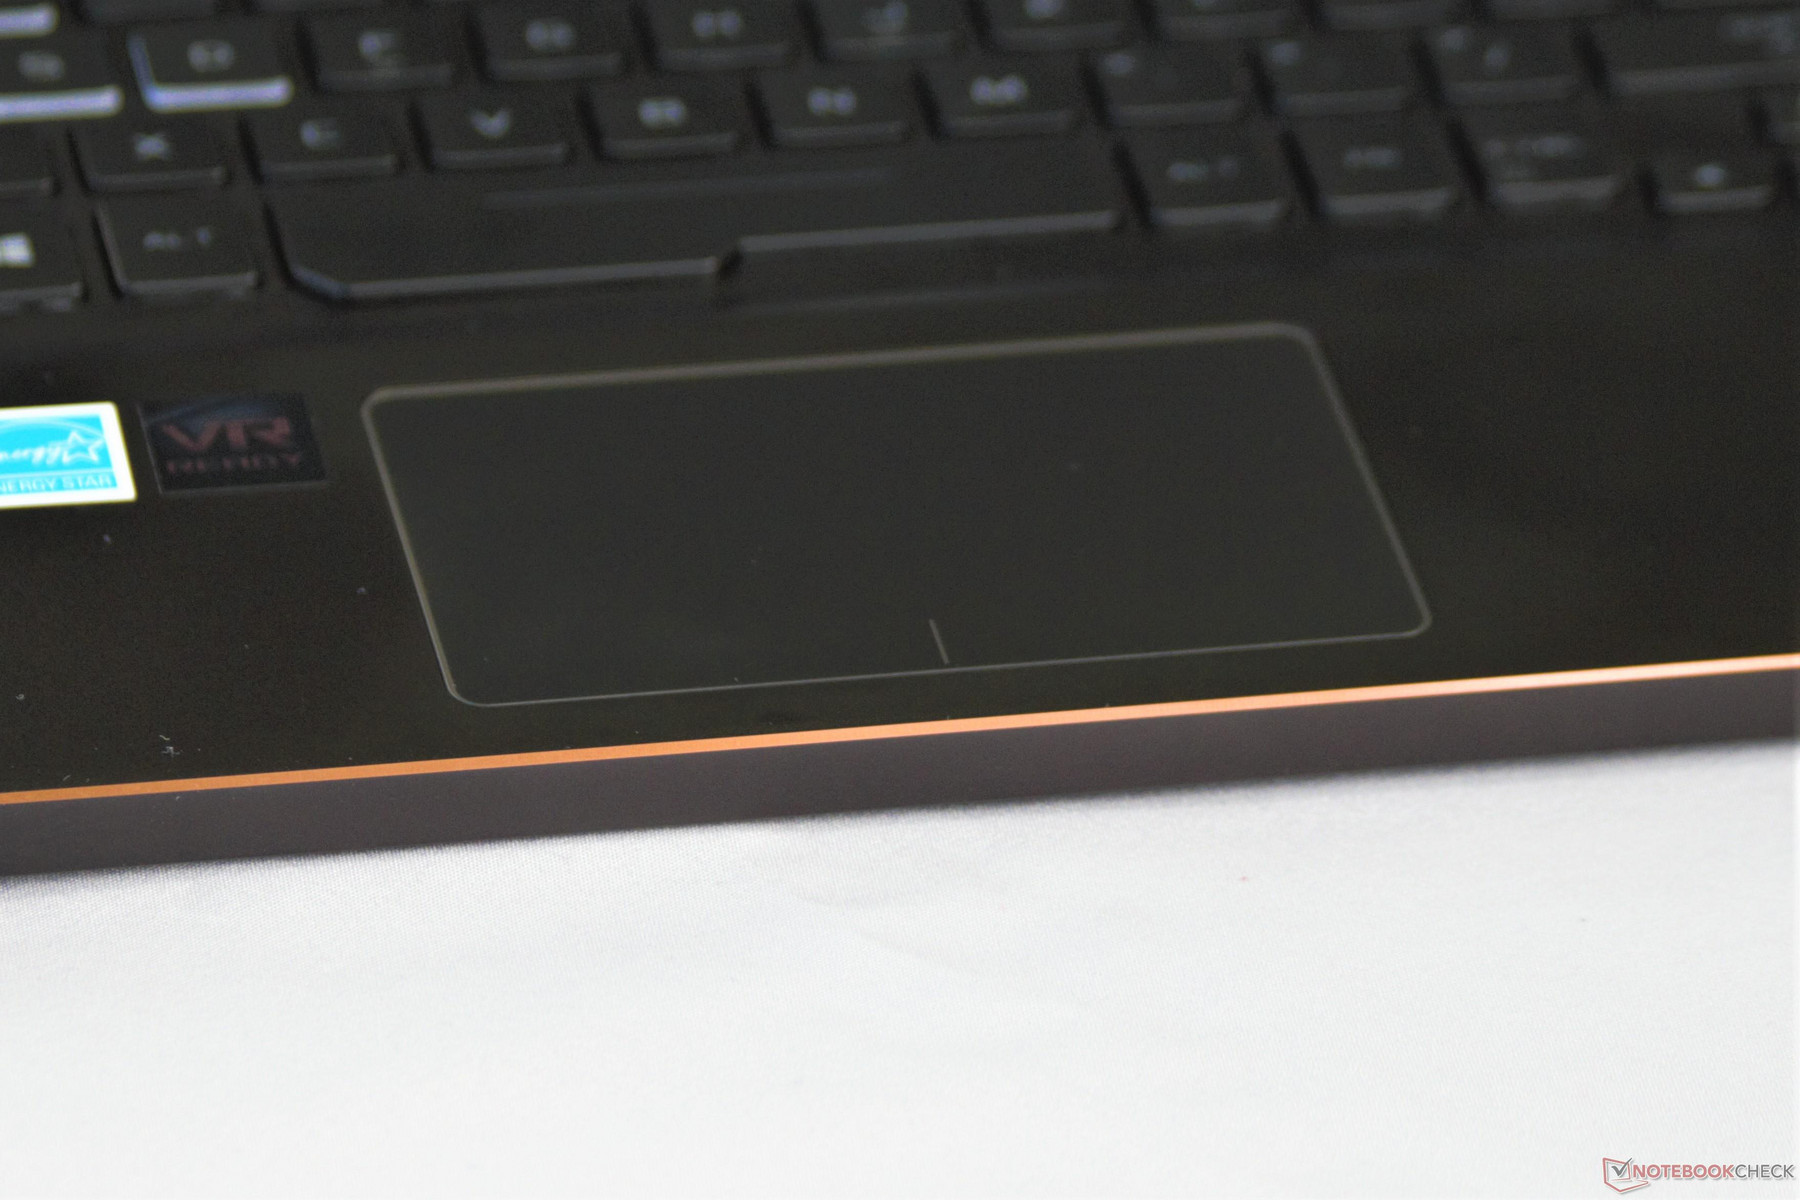
The touchpad is marred only by its lilliputian footprint (10.4 cm x 6 cm). Glide is smooth across the glass surface, and the clicking mechanism in our unit feels responsive, if a bit hollow. Unfortunately, the small size makes tracking feel cramped and can be very frustrating. Thankfully, the whole surface of the touchpad responds to input (including the lower area with button markings), granting a bit more space to the user.
Display
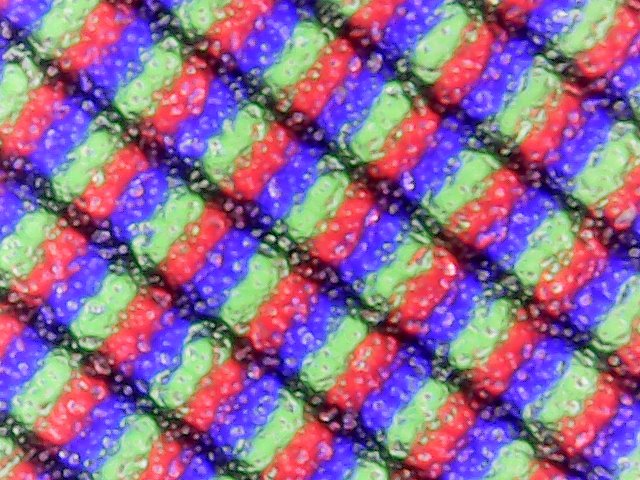
The matte 1920x1080 display by AU Optronics is about average for most mid-range gaming laptops but feels out of place considering the price of the GU501GM. The standard 60 Hz refresh rate is a downside here; other devices (like the MSI GS65 and Aorus X5 v8) offer 120 or 144 Hz panels, albeit at higher prices. Brightness is fairly even across the screen. Contrast levels are average for an IPS screen at a mere 735:1. The result is that darker colors tend to bleed into each other due to the poor black levels.
The biggest weak point in the display is its sub-optimal brightness. Peaking at an average of 281 nits, the screen gets bright enough for indoor use, but images become hard to discern when outdoors or in direct sunlight. The matte finish across the screen helps with this, cutting reflections well. There is a slight grain on white backgrounds due to the matte coating. Whites are also off-center, shifting slightly blue at max brightness and tinting red at lower levels. It should be noted that the screens of most gaming laptops typically average 300 nits or less.
| |||||||||||||||||||||||||
Brightness Distribution: 92 %
Center on Battery: 286.7 cd/m²
Contrast: 735:1 (Black: 0.39 cd/m²)
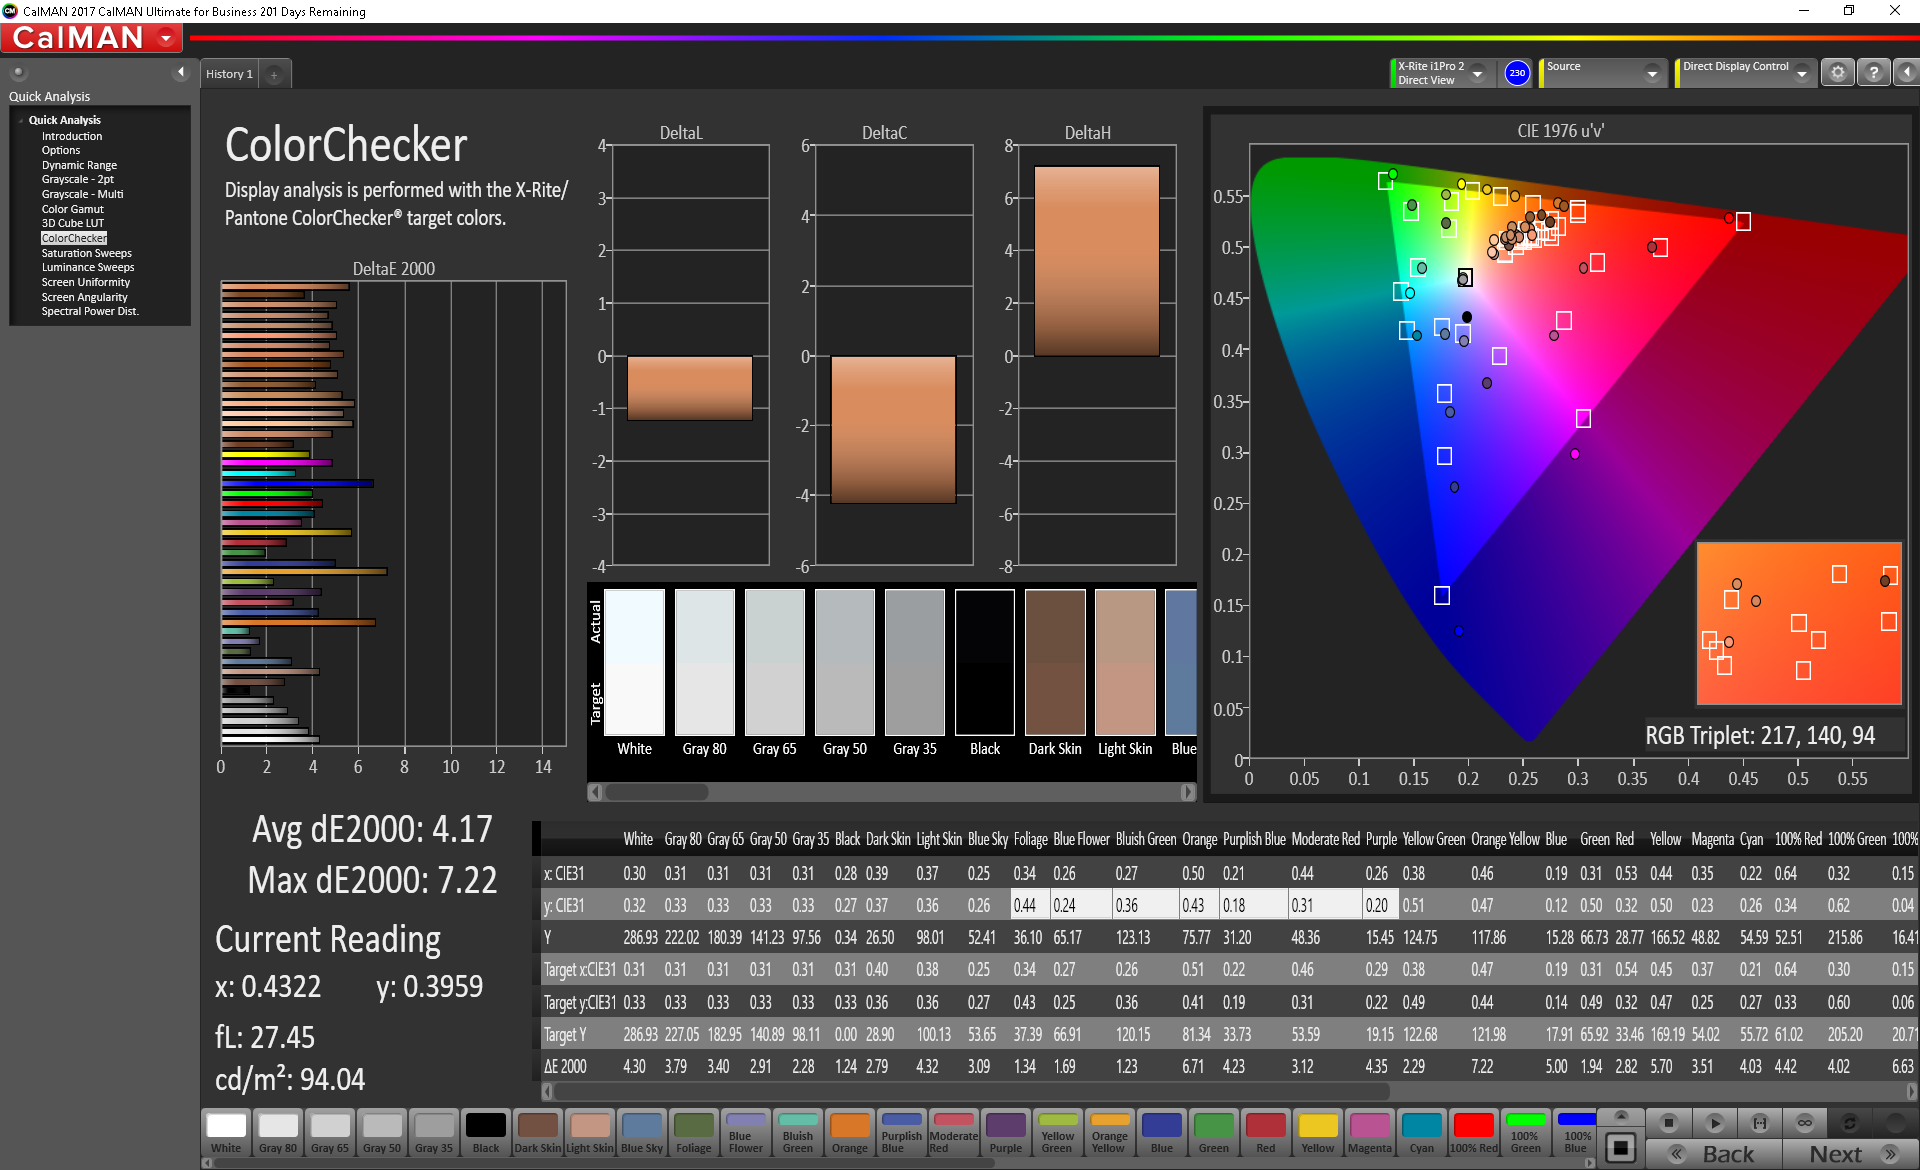
ΔE Color 4.17 | 0.5-29.43 Ø5
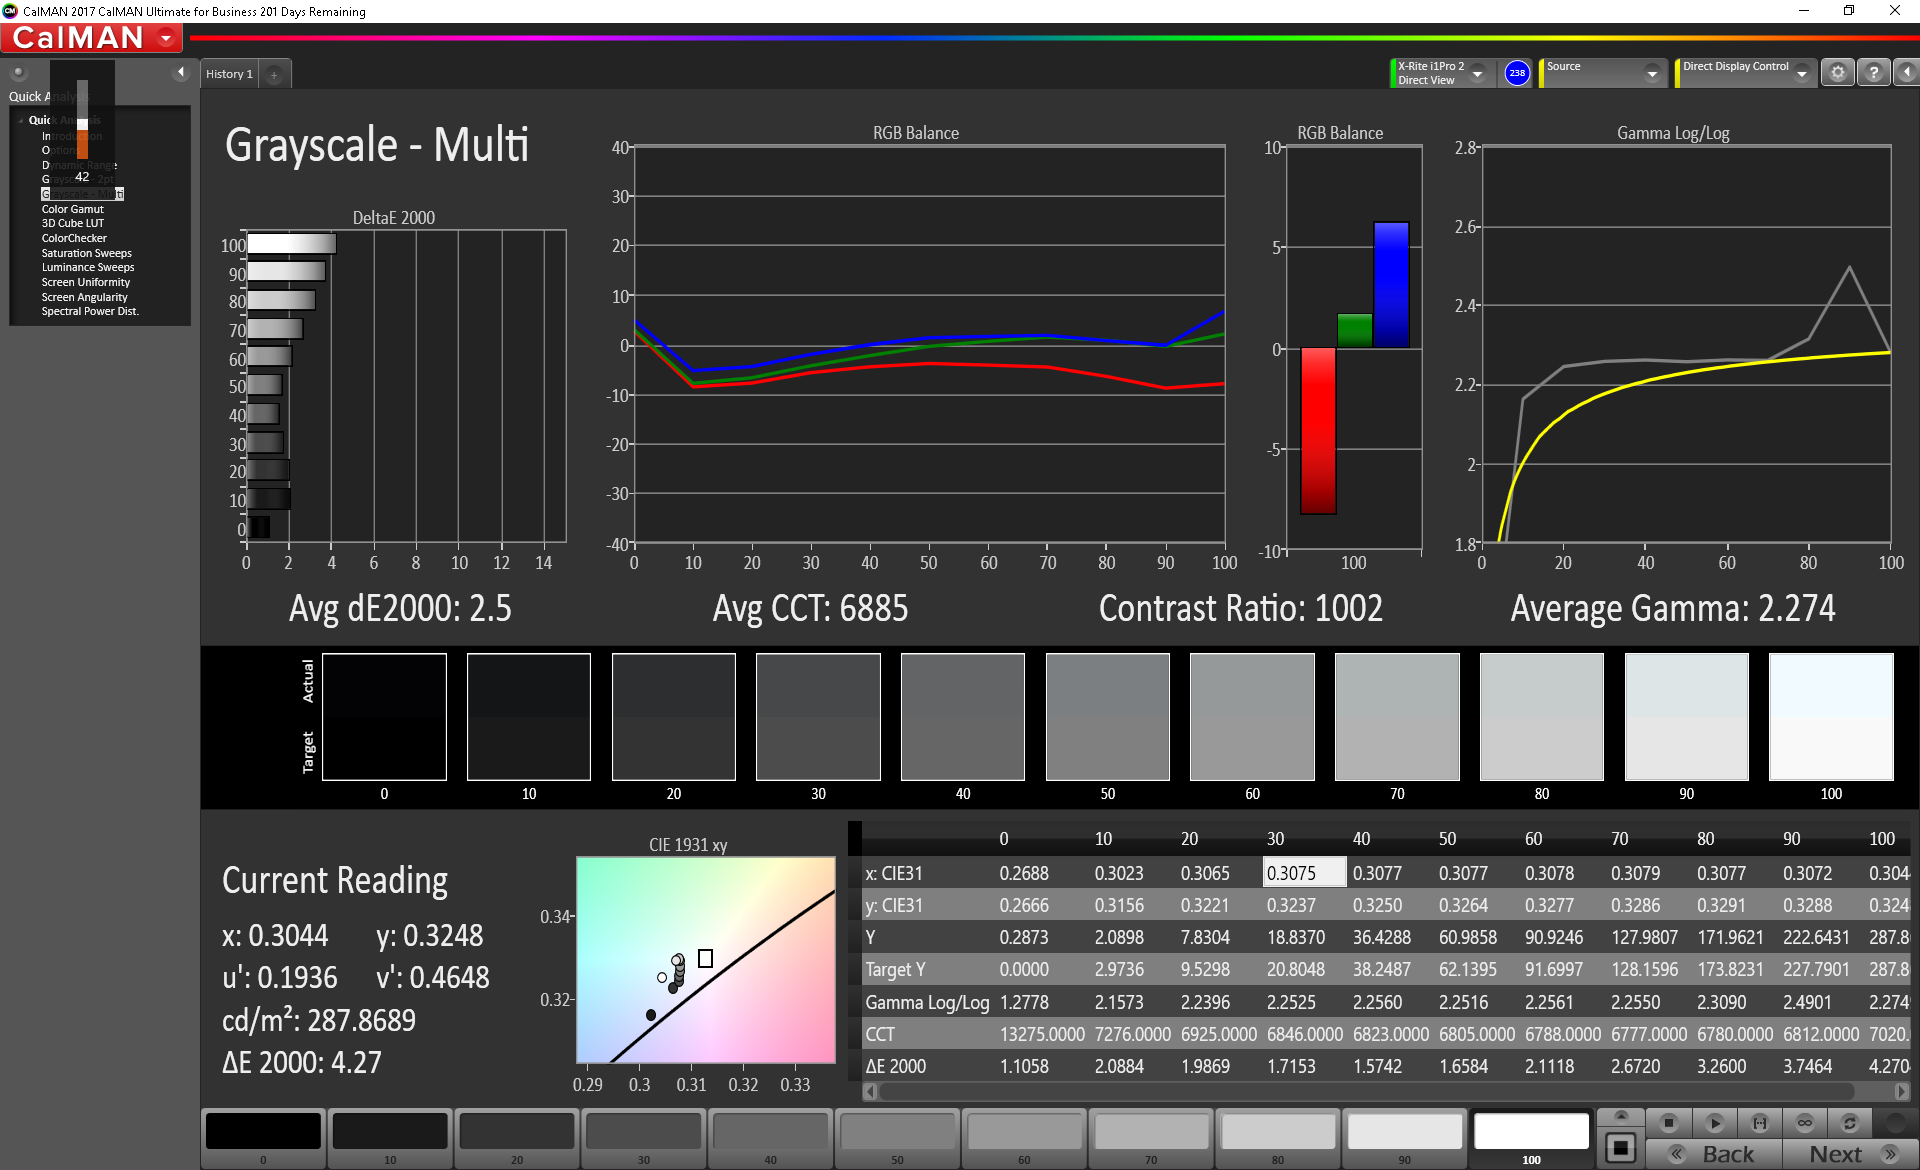
ΔE Greyscale 2.5 | 0.57-98 Ø5.3
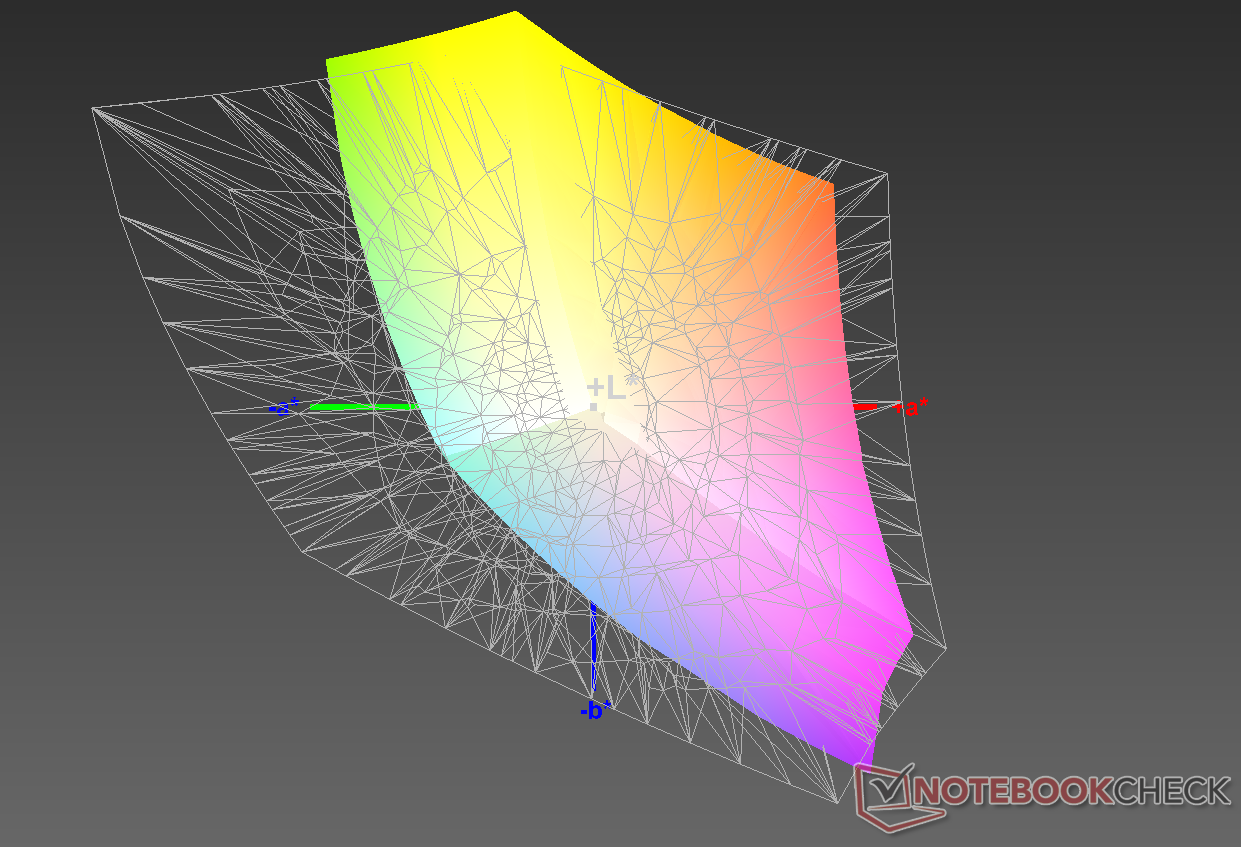
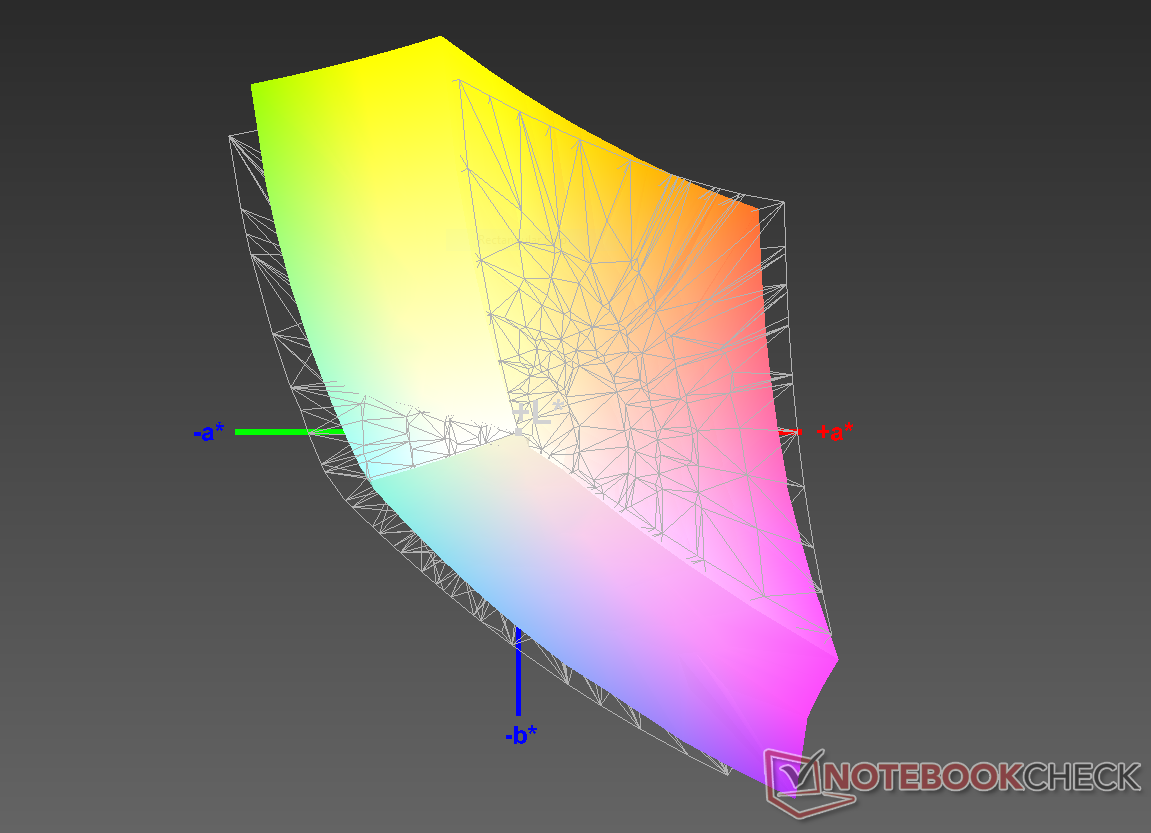
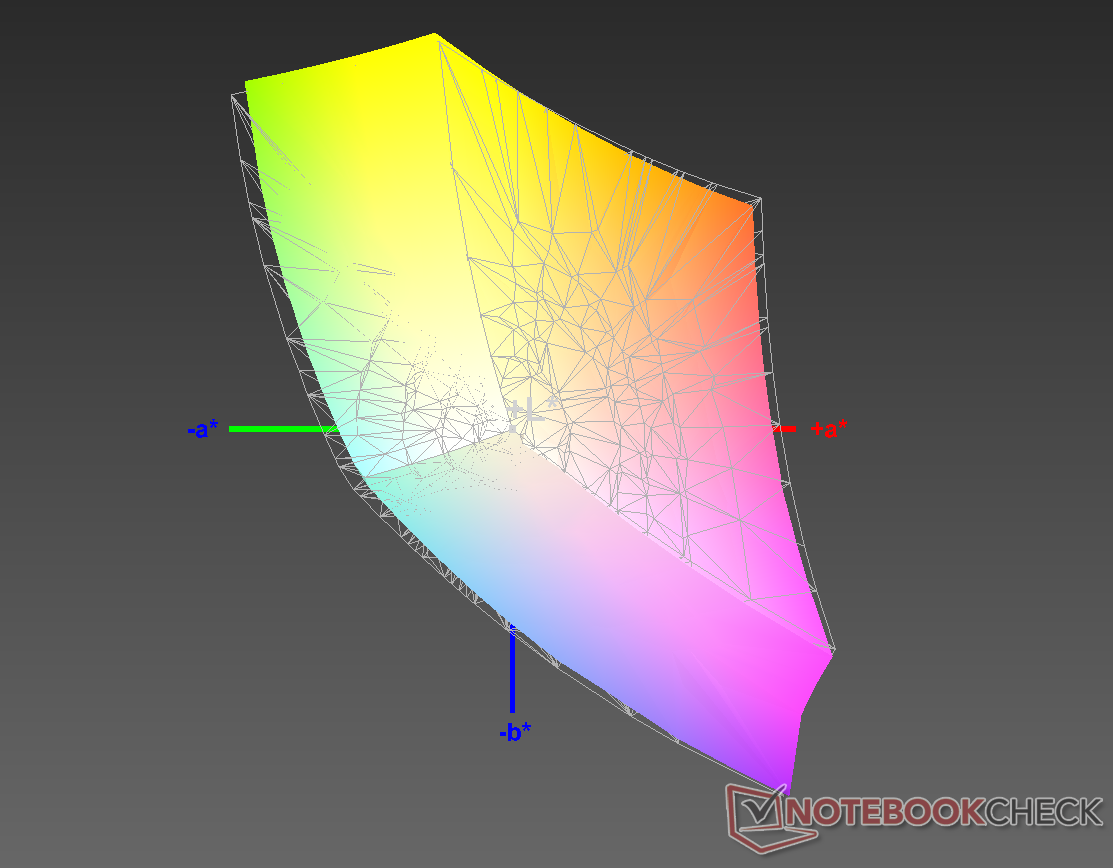
87% sRGB (Argyll 1.6.3 3D)
57% AdobeRGB 1998 (Argyll 1.6.3 3D)
87.7% sRGB (Argyll 2.2.0 3D)
63.4% Display P3 (Argyll 2.2.0 3D)
Gamma: 2.274
| Asus ROG GU501GM-BI7N8 AU Optronics AUO45ED, IPS, 15.60, 1920x1080 | MSI GS65 8RF-019DE Stealth Thin AU Optronics B156HAN08.0 (AUO80ED), IPS, 15.60, 1920x1080 | Asus Zephyrus M GM501 AUO B156HAN07.1 (AUO71ED), IPS, 15.60, 1920x1080 | Gigabyte Aero 15X v8 LGD05C0, IPS, 15.60, 1920x1080 | Aorus X5 v8 AU Optronics B156HAN07.0 (AUO70ED), IPS, 15.60, 1920x1080 | Acer Predator Triton 700 AUO B156HAN04.2 (AUO42ED), IPS, 15.60, 1920x1080 | |
|---|---|---|---|---|---|---|
| Display | 5% | 5% | 4% | 6% | 0% | |
| Display P3 Coverage | 63.4 | 66.2 4% | 66.1 4% | 63.6 0% | 67.1 6% | 62.5 -1% |
| sRGB Coverage | 87.7 | 92.1 5% | 92.7 6% | 93.8 7% | 93.4 6% | 88.7 1% |
| AdobeRGB 1998 Coverage | 67.2 | 67.2 | 64.9 | 68.1 | 63.5 | |
| Response Times | 49% | 71% | 52% | 48% | -26% | |
| Response Time Grey 50% / Grey 80% * | 30.8 ? | 17.6 ? 43% | 6.6 ? 79% | 16.8 ? 45% | 18.8 ? 39% | 44.8 ? -45% |
| Response Time Black / White * | 27.6 ? | 12.8 ? 54% | 10.4 ? 62% | 11.2 ? 59% | 12 ? 57% | 29.6 ? -7% |
| PWM Frequency | ||||||
| Screen | 21% | -13% | 27% | 23% | -13% | |
| Brightness middle | 286.7 | 254 -11% | 307 7% | 313 9% | 271 -5% | 291 1% |
| Brightness | 281 | 262 -7% | 296 5% | 300 7% | 259 -8% | 277 -1% |
| Brightness Distribution | 92 | 89 -3% | 89 -3% | 78 -15% | 87 -5% | 84 -9% |
| Black Level * | 0.39 | 0.22 44% | 0.25 36% | 0.33 15% | 0.27 31% | 0.22 44% |
| Contrast | 735 | 1155 57% | 1228 67% | 948 29% | 1004 37% | 1323 80% |
| Colorchecker dE 2000 * | 4.17 | 2.37 43% | 5.74 -38% | 1.29 69% | 1.81 57% | 5.52 -32% |
| Colorchecker dE 2000 max. * | 7.22 | 4.71 35% | 11.32 -57% | 2.04 72% | 3.33 54% | 10.72 -48% |
| Greyscale dE 2000 * | 2.5 | 1.58 37% | 6.44 -158% | 0.69 72% | 1.09 56% | 6.59 -164% |
| Gamma | 2.274 97% | 2.48 89% | 2.48 89% | 2.43 91% | 2.45 90% | 2.44 90% |
| CCT | 6885 94% | 6785 96% | 8395 77% | 6550 99% | 6435 101% | 7816 83% |
| Color Space (Percent of AdobeRGB 1998) | 57 | 60 5% | 60 5% | 60 5% | 61 7% | 58 2% |
| Color Space (Percent of sRGB) | 87 | 92 6% | 93 7% | 94 8% | 93 7% | 89 2% |
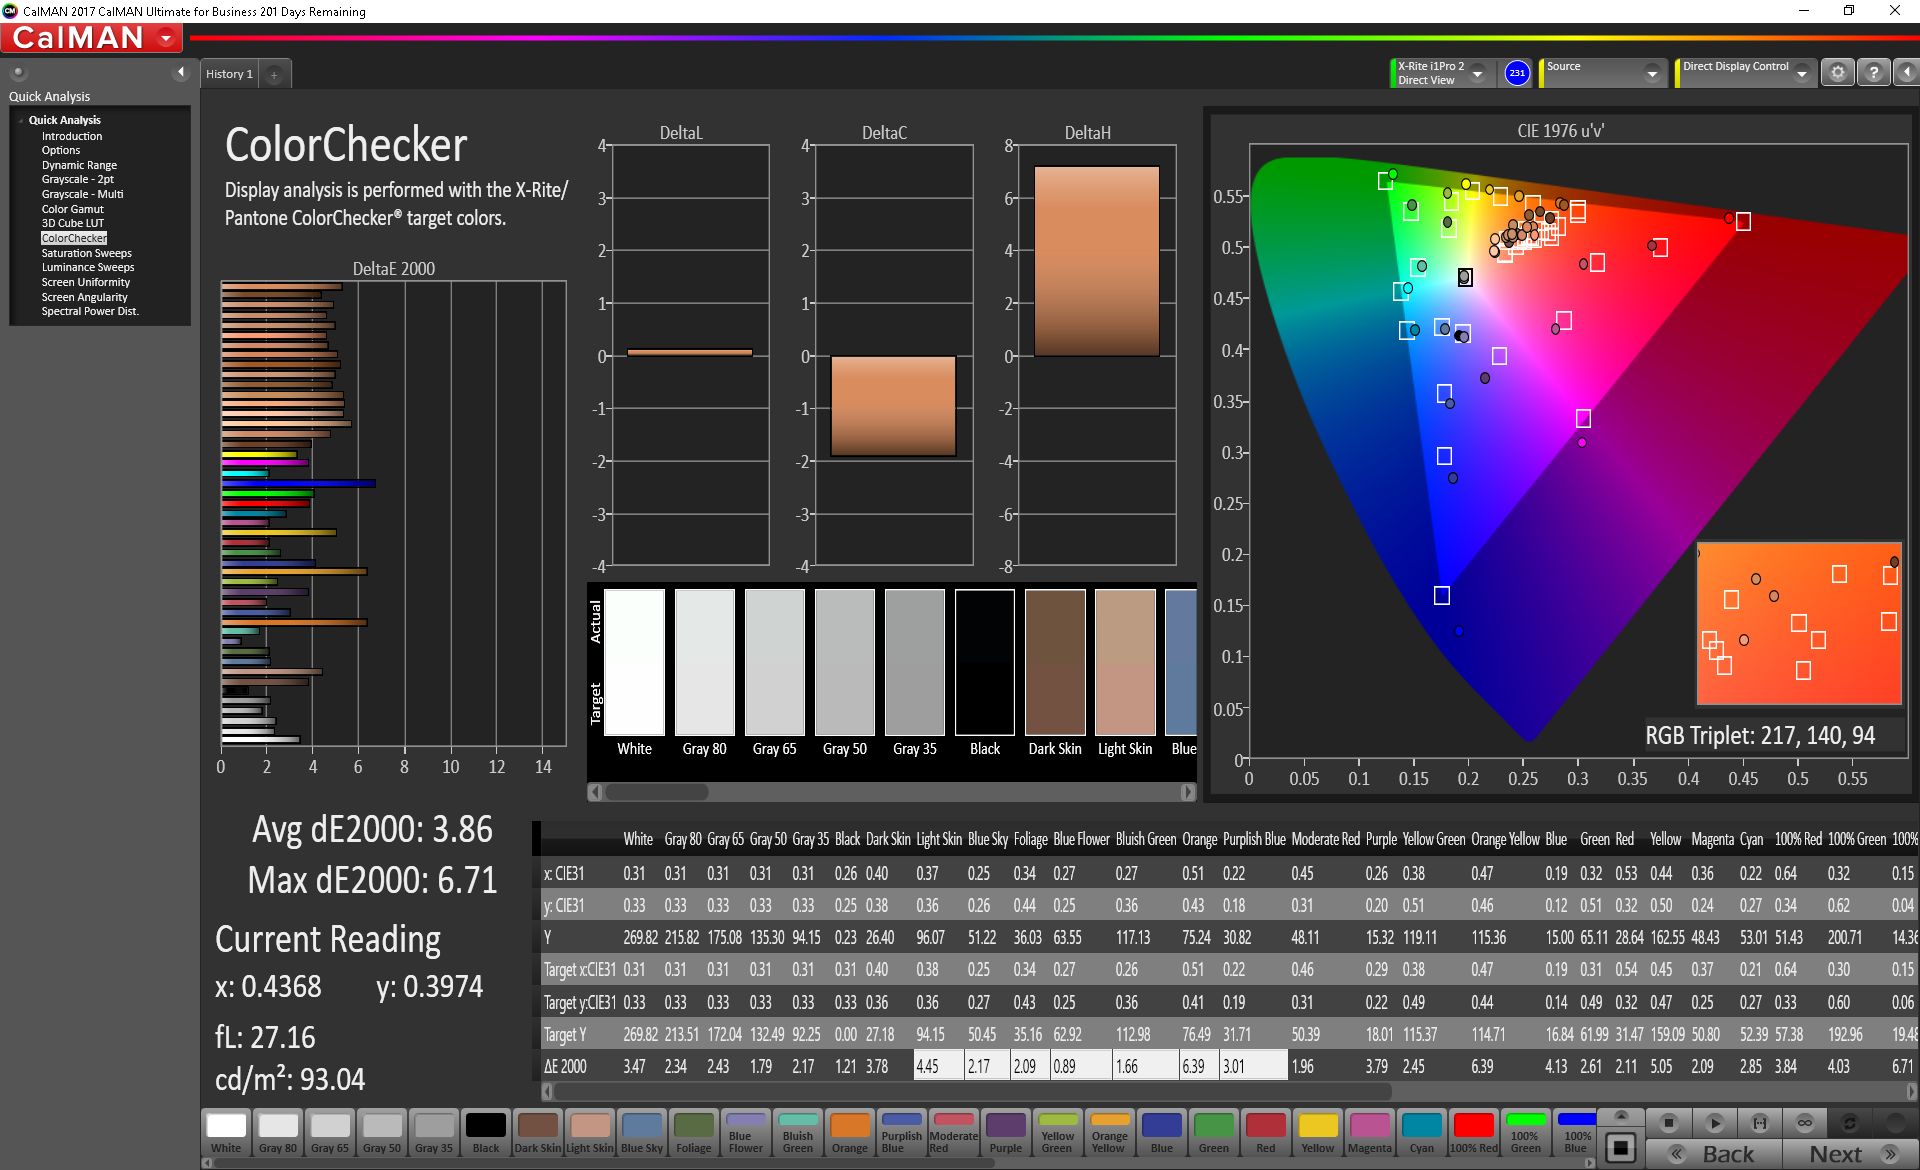
| Colorchecker dE 2000 calibrated * | 1.84 | 1.94 | ||||
| Total Average (Program / Settings) | 25% /
22% | 21% /
2% | 28% /
27% | 26% /
24% | -13% /
-13% |
* ... smaller is better
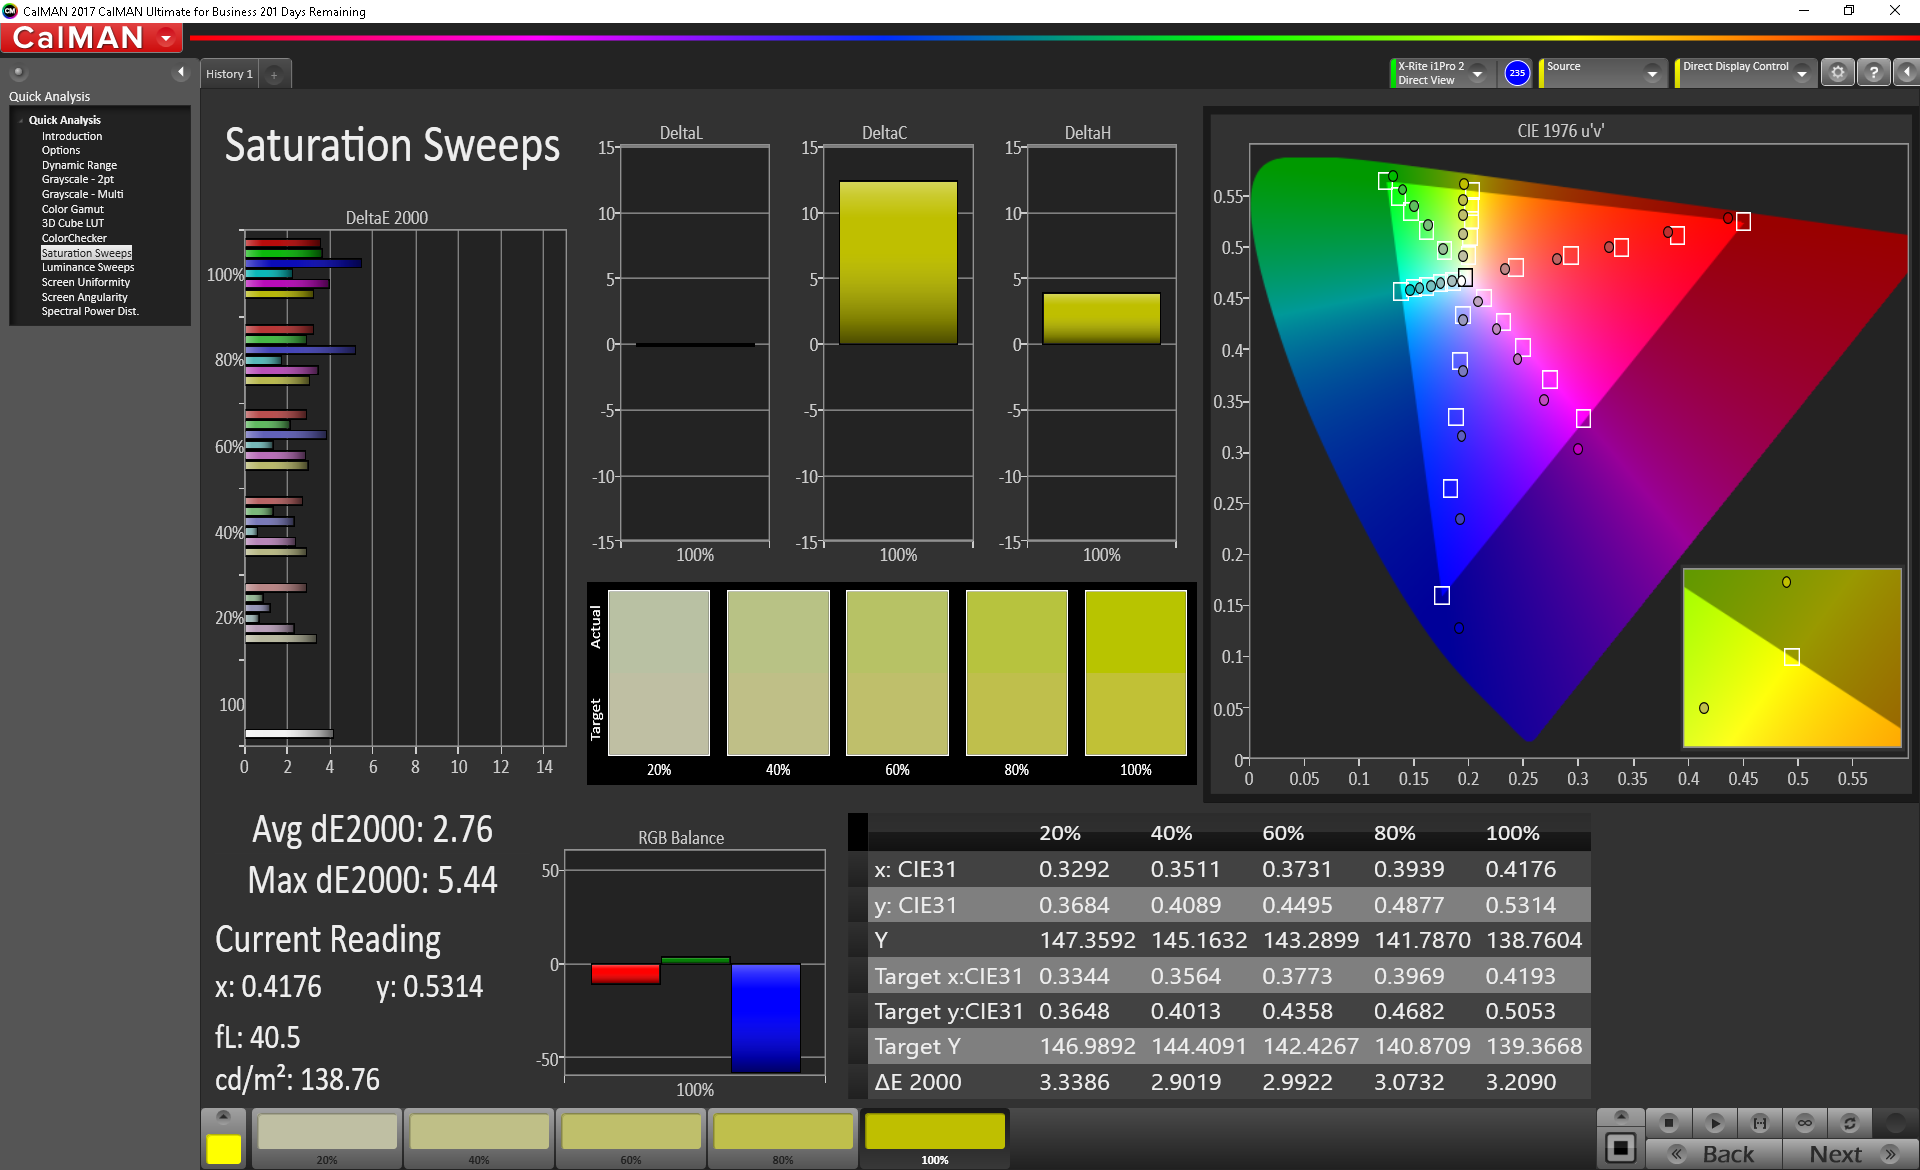
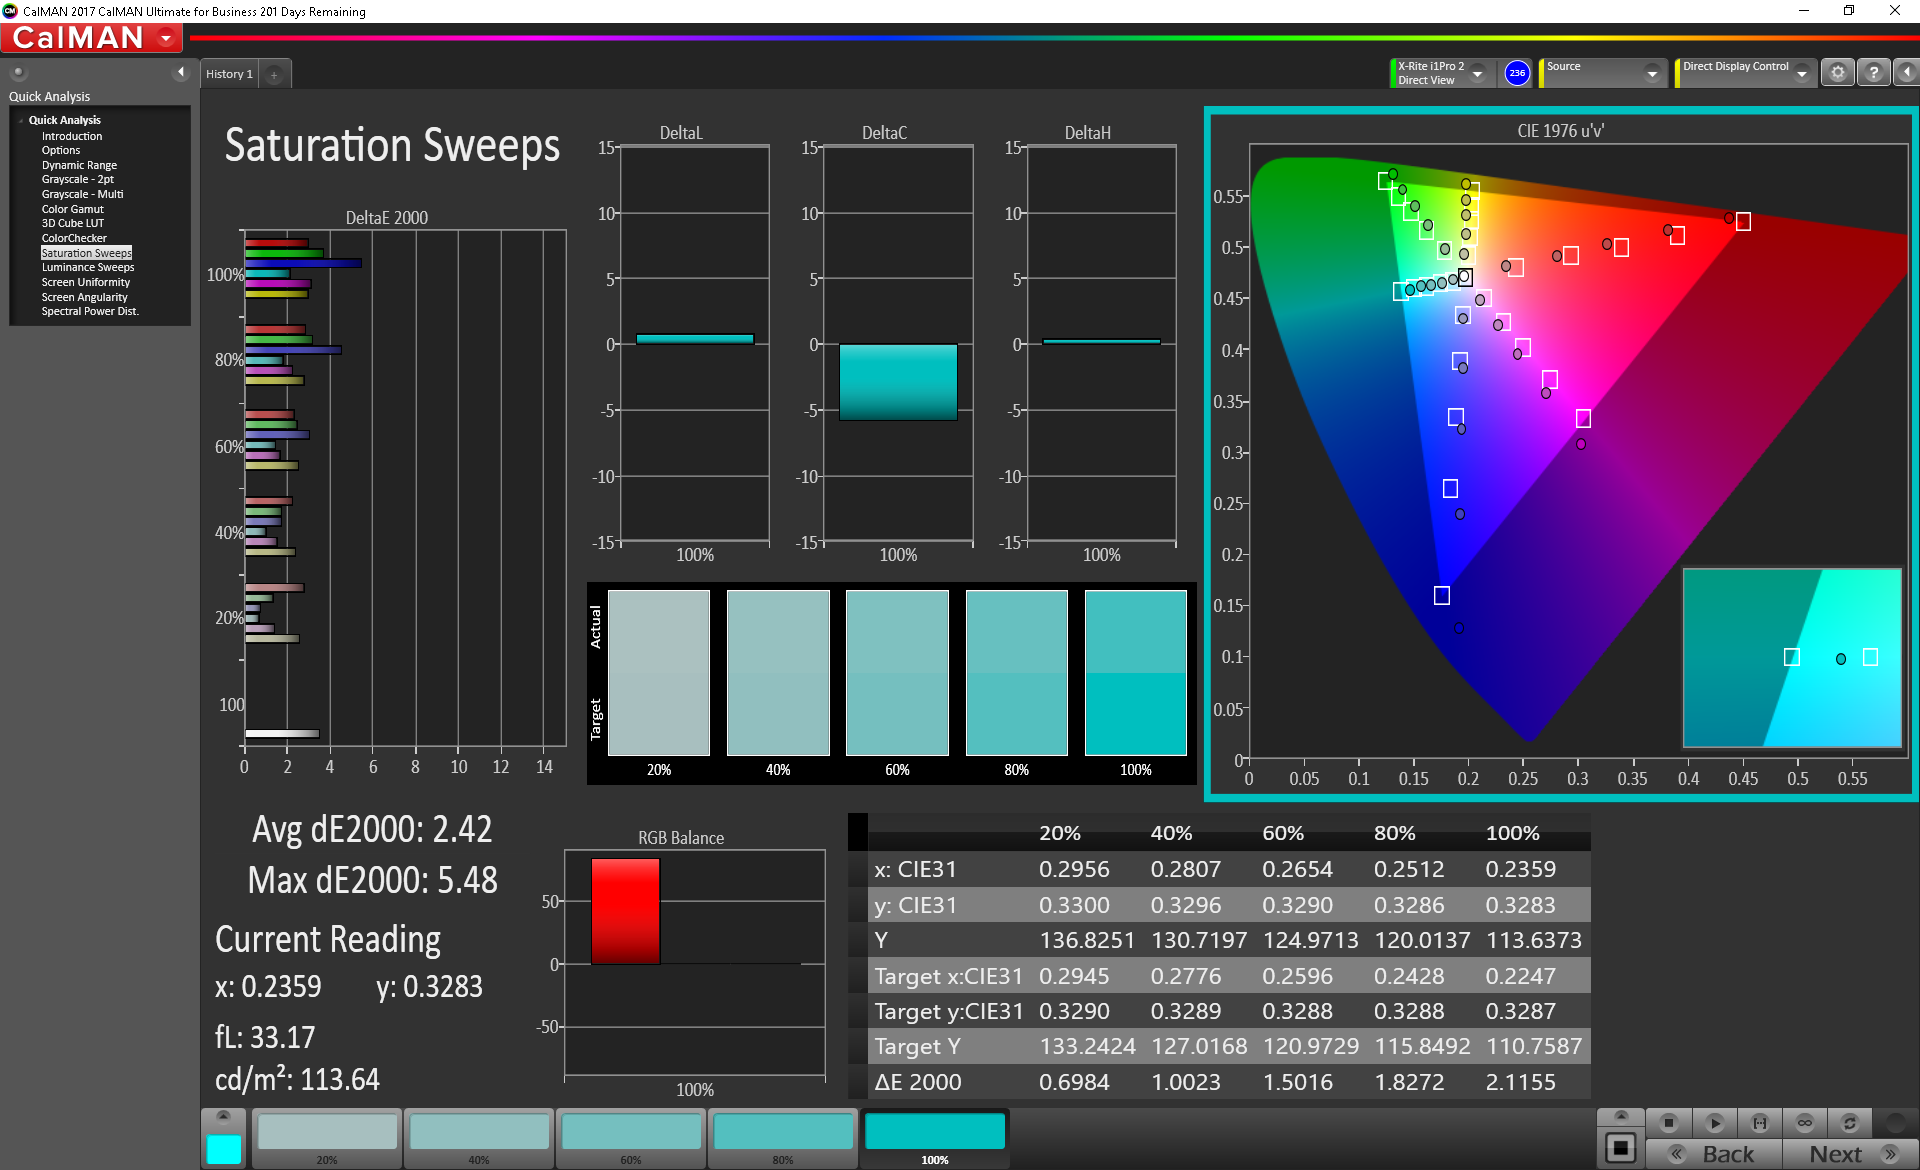
Color accuracy is also average. DeltaE scores are good at 4.17 for color and 2.5 for greys (a DeltaE of 3 or less is considered acceptable for professional work). Color space coverage is adequate at 57% and 87% of the AdobeRGB and sRGB color gamuts, respectively. This is competitive with other gaming laptops, but those that rely on accurate colors for professional work should look elsewhere.
Display Response Times
| ↔ Response Time Black to White | ||
|---|---|---|
| 27.6 ms ... rise ↗ and fall ↘ combined | ↗ 16 ms rise | 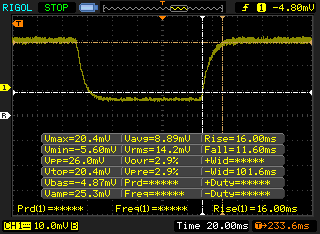 |
| ↘ 11.6 ms fall | ||
| The screen shows relatively slow response rates in our tests and may be too slow for gamers. In comparison, all tested devices range from 0.1 (minimum) to 240 (maximum) ms. » 66 % of all devices are better. This means that the measured response time is worse than the average of all tested devices (21.5 ms). | ||
| ↔ Response Time 50% Grey to 80% Grey | ||
| 30.8 ms ... rise ↗ and fall ↘ combined | ↗ 13.6 ms rise | 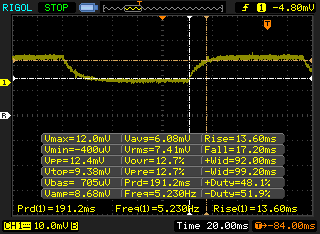 |
| ↘ 17.2 ms fall | ||
| The screen shows slow response rates in our tests and will be unsatisfactory for gamers. In comparison, all tested devices range from 0.2 (minimum) to 636 (maximum) ms. » 35 % of all devices are better. This means that the measured response time is similar to the average of all tested devices (33.7 ms). | ||
Screen Flickering / PWM (Pulse-Width Modulation)
| Screen flickering / PWM not detected | 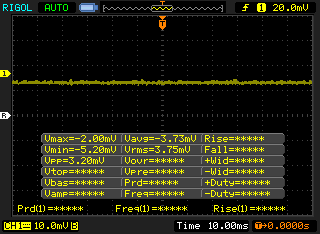 | ||
In comparison: 53 % of all tested devices do not use PWM to dim the display. If PWM was detected, an average of 17924 (minimum: 5 - maximum: 3846000) Hz was measured. | |||
Viewing angles are excellent. There is no discernible color shift or image dimming when the screen is viewed off angle. As mentioned, the screen is practically useless outdoors. Even under overcast skies, images and text are difficult to make out.


Performance
The combination of Intel's hexacore Core i7-8750H and Nvidia's GeForce GTX 1060 is likely to become the standard configuration for mid-range gaming notebooks this year (at least until Volta hits the market, if at all). While the GTX 1060 has proved its worth in slim gaming notebooks time and again, the 8750H may be more than the GU501GM can handle.
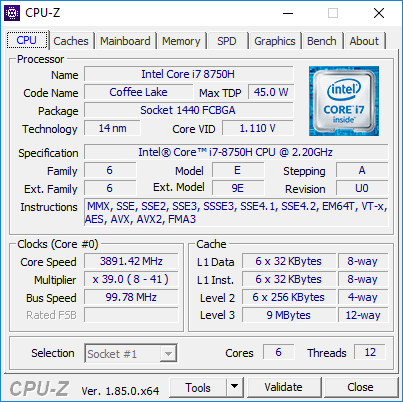
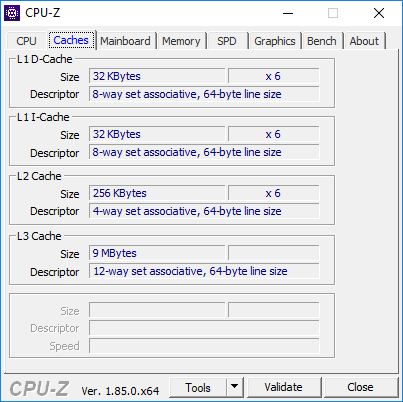
Processor
Coffee Lake is making its way into more and more devices by the week, and leading the charge is the Core i7-8750H. The six-core Hyperthreaded CPU boasts a base clock of 2.2 GHz with a single-core boost up to 4.1 GHz (up to 3.9 GHz on all six cores). The 45 W TDP remains the same as older flagship CPUs from Intel, but L3 cache has been bumped to 9 MB (up from 8 MB on the generation i7-7700HQ).
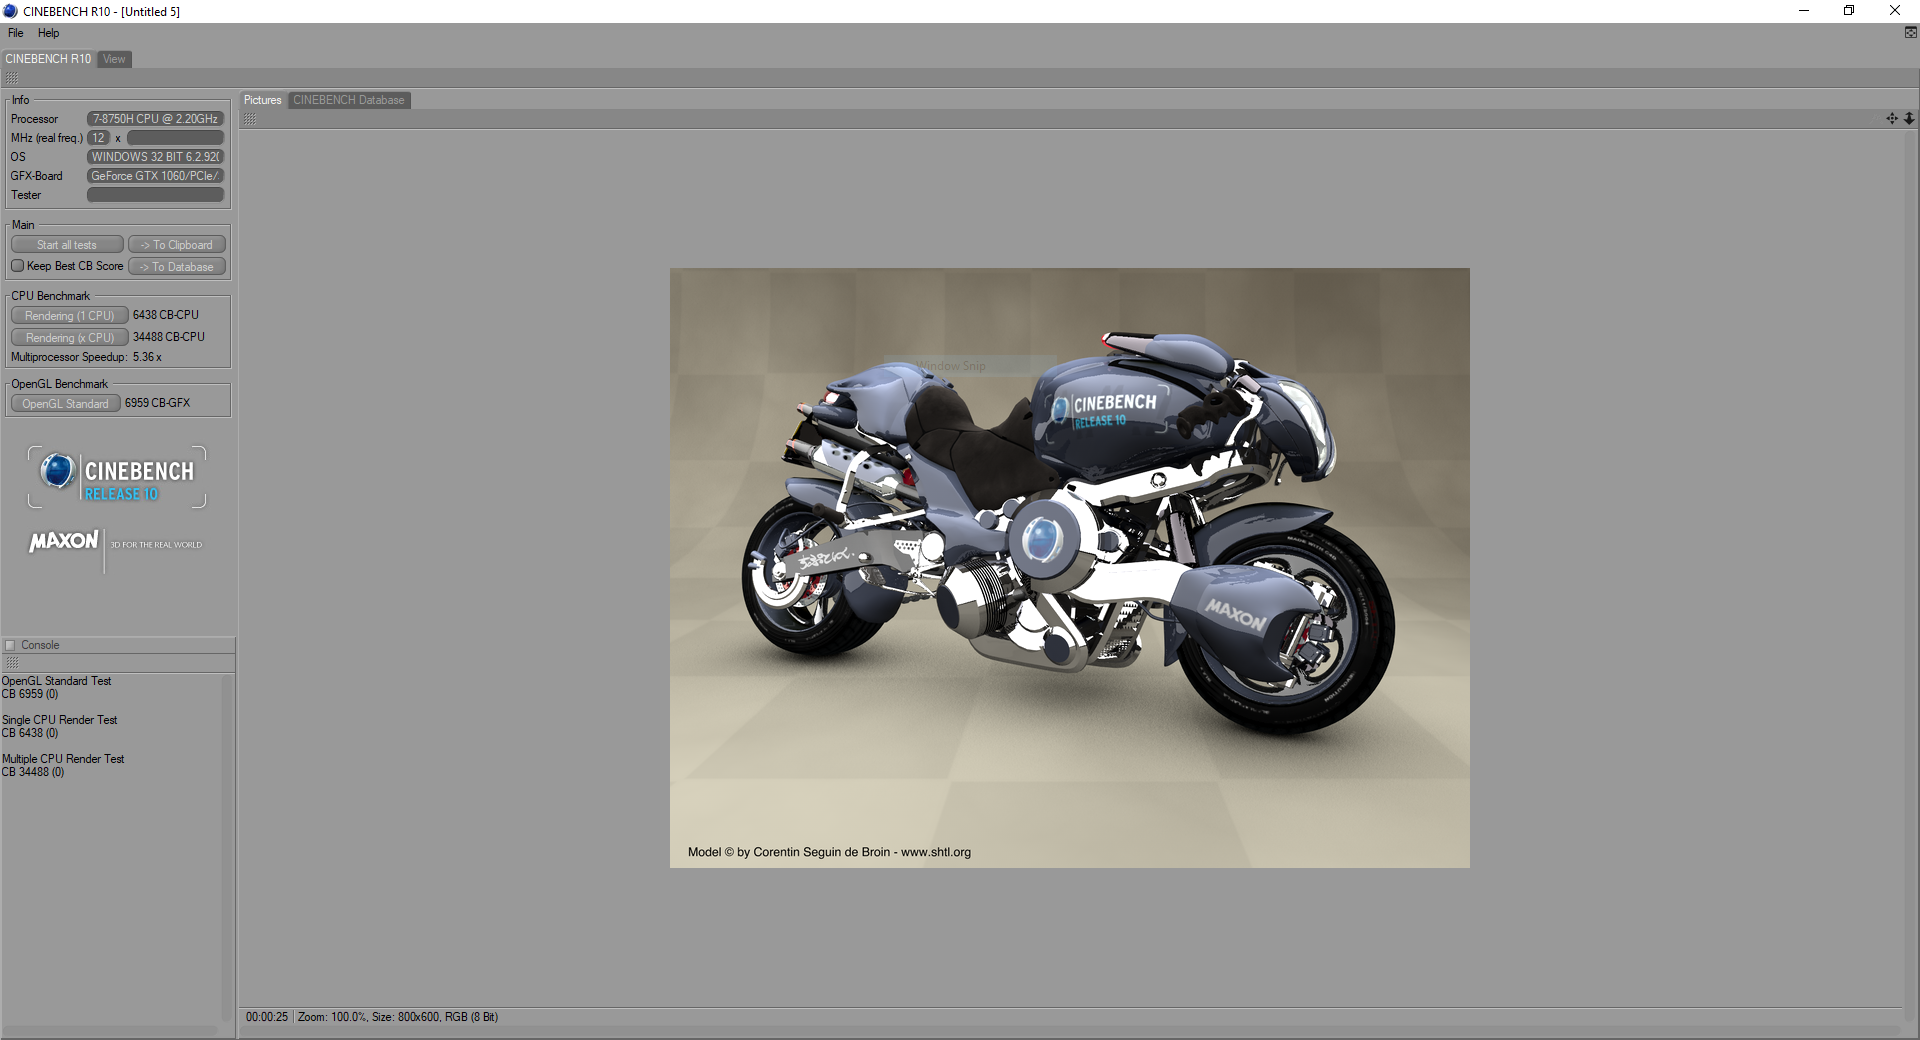
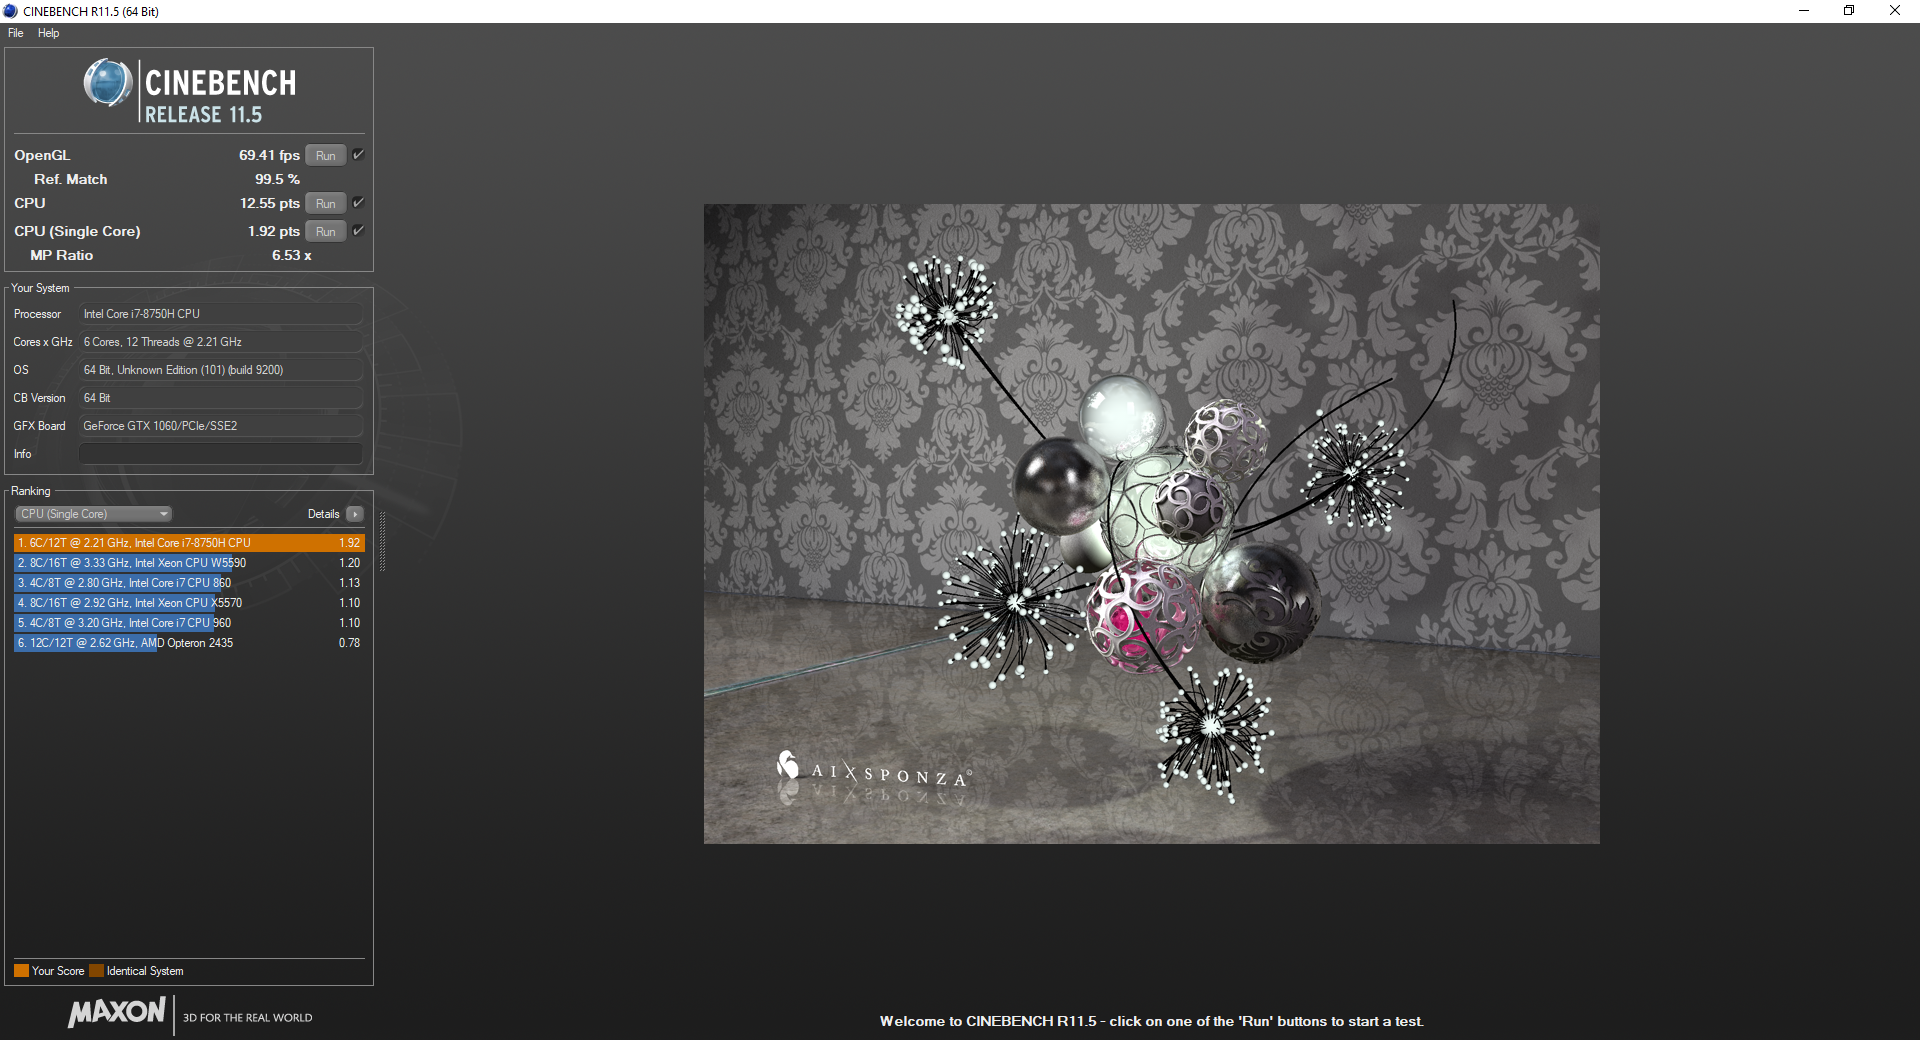
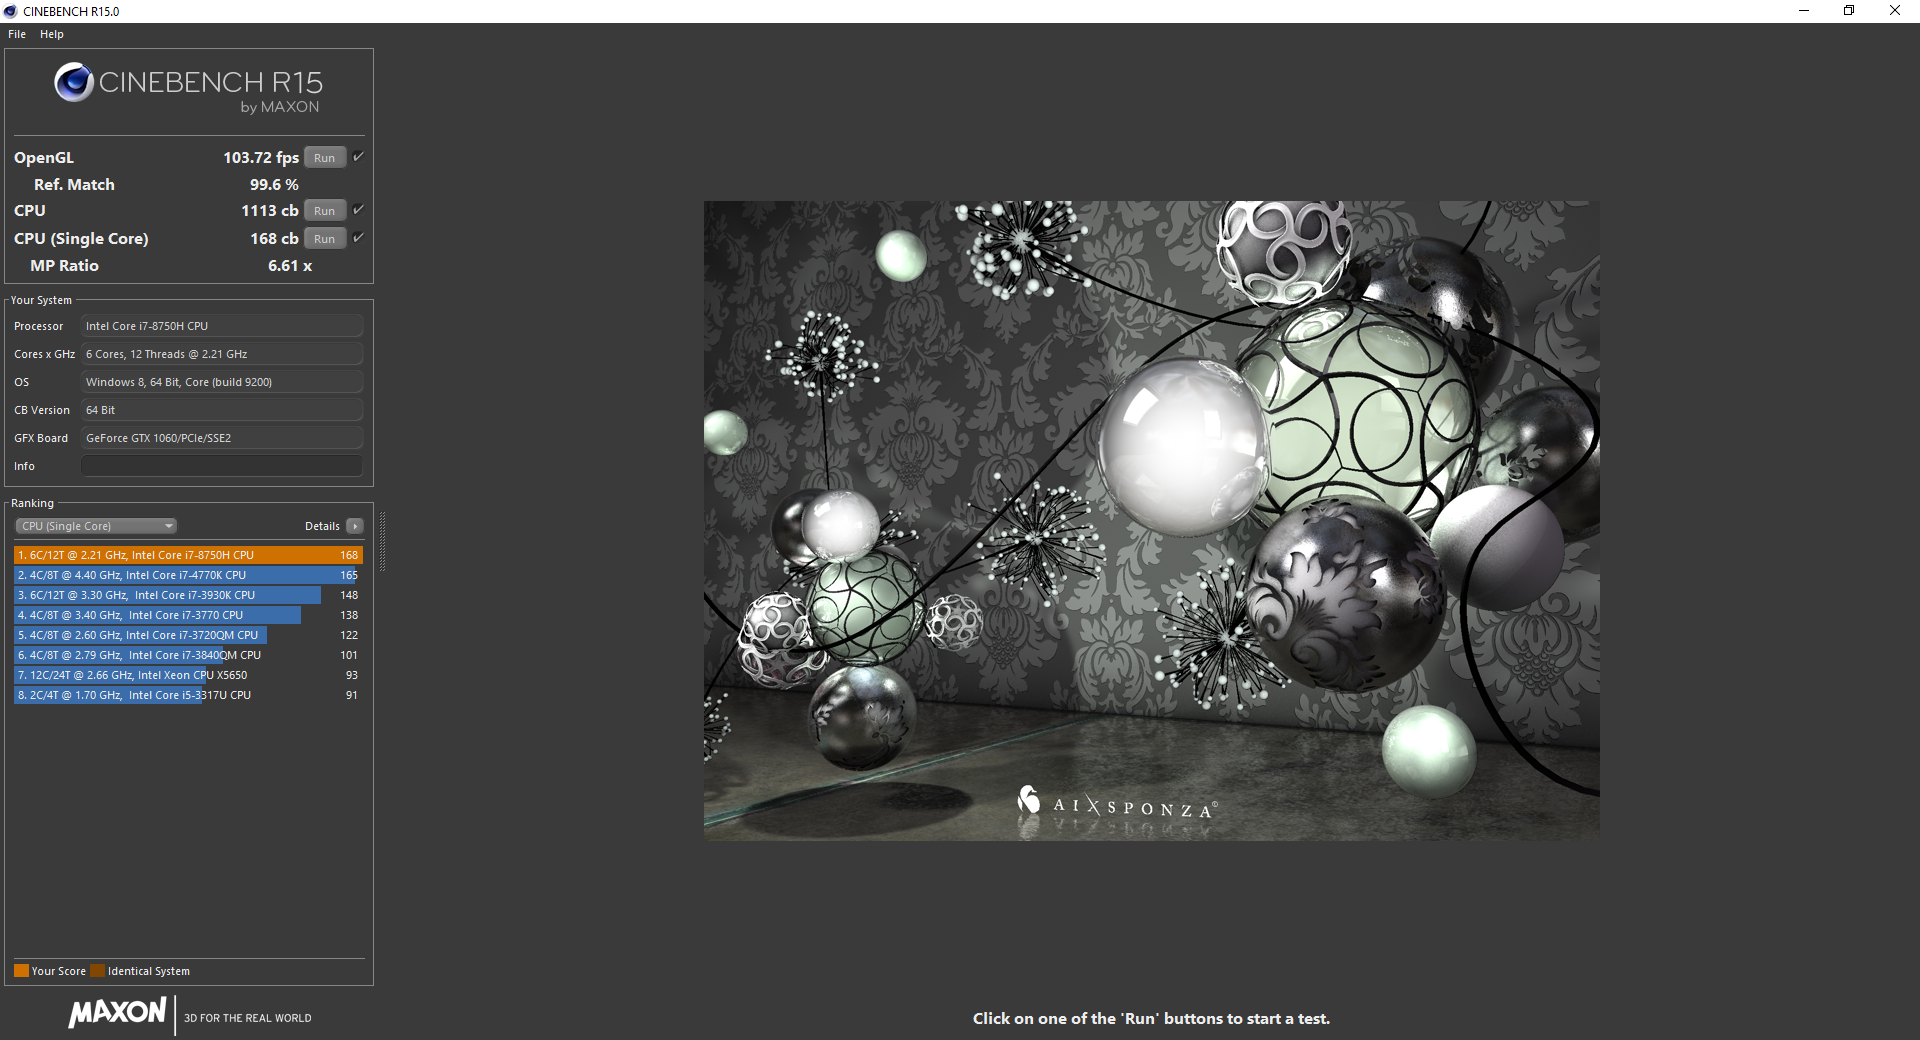
The addition of two cores and four threads should mean that the 8750H tops the older i7-7700HQ by 50%. This is indeed what we see in Cinebench R15's multi-core benchmark; the 8750H in our GU501GM bests the 7700HQ (seen in the Acer Triton 700) by 52%. The 8750H is about on par with AMD's Ryzen 5 1600, a desktop CPU used in Asus' ROG Strix GL702ZC. For those that need more power, there are better processors in the mobile space, like the Core i9-8950HK and the Ryzen 7 1700, although these come at the cost of increased power draw and heat output.
Long-term CPU performance, as measured by our CB15 loop, is a bit disappointing. After an initial strong run, we see a 15% drop in performance over the next two passes. CB15 scores are erratic over subsequent tests but never surpasses about 85% the performance of the first pass. On battery, the GU501GM hit similar numbers, only achieving about 85% of its plugged-in performance.
* ... smaller is better
System Performance
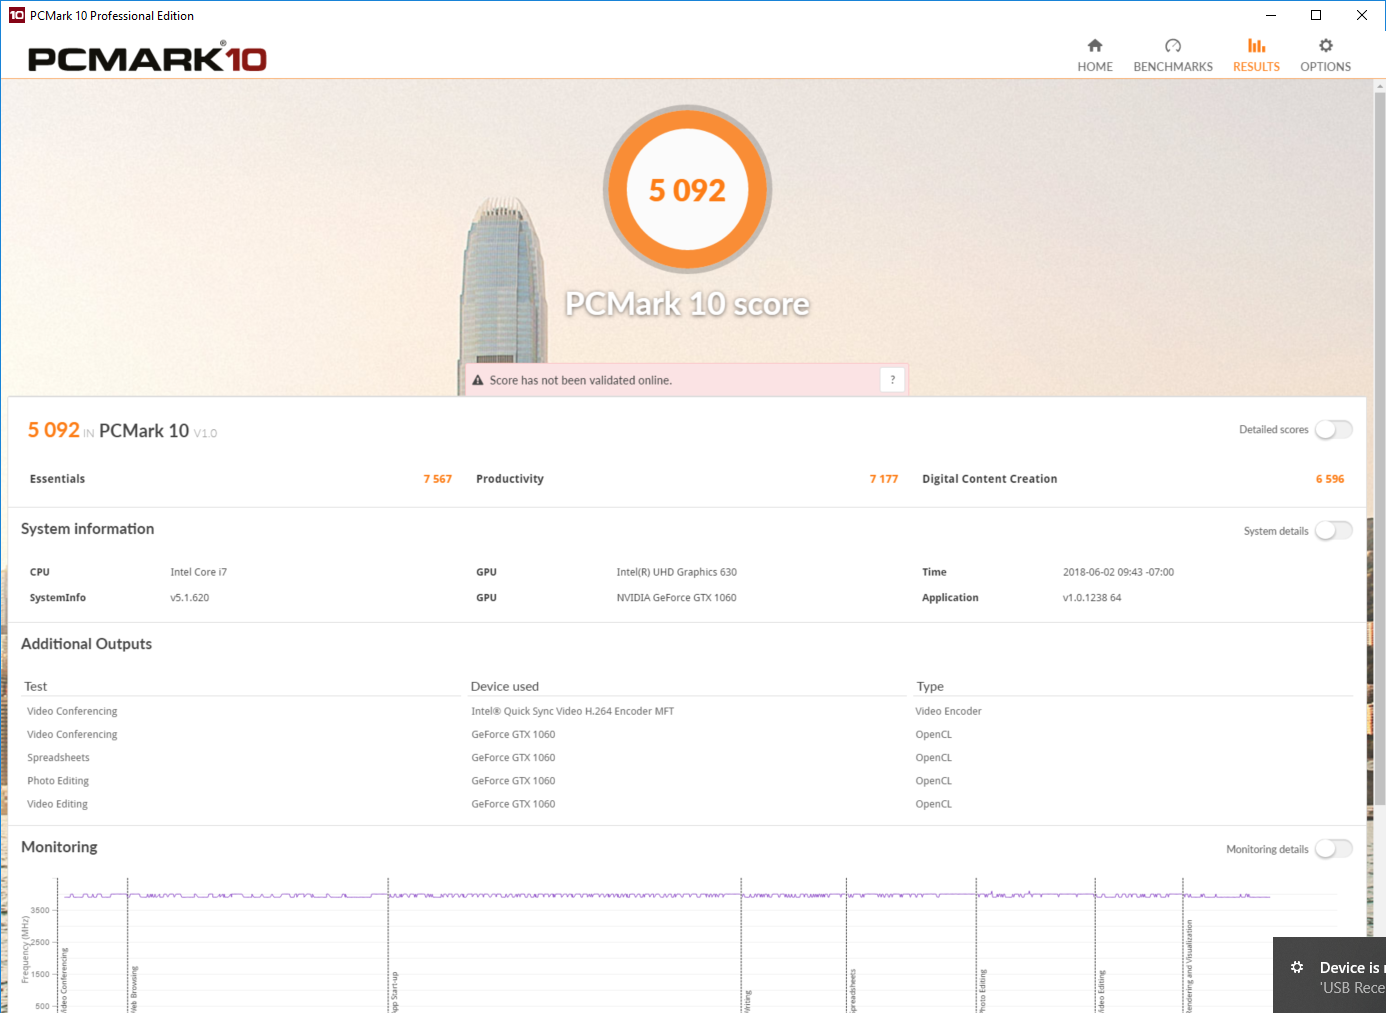
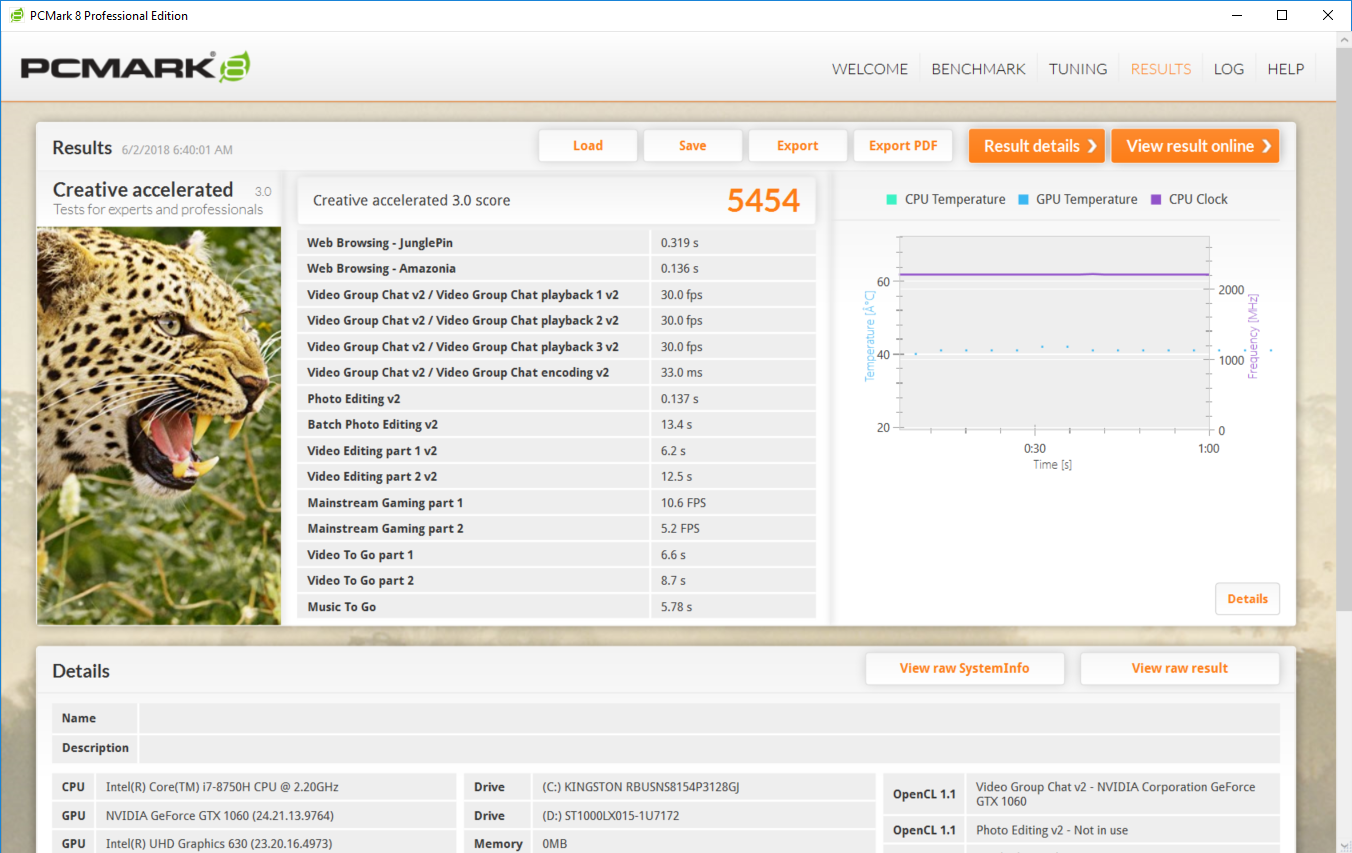
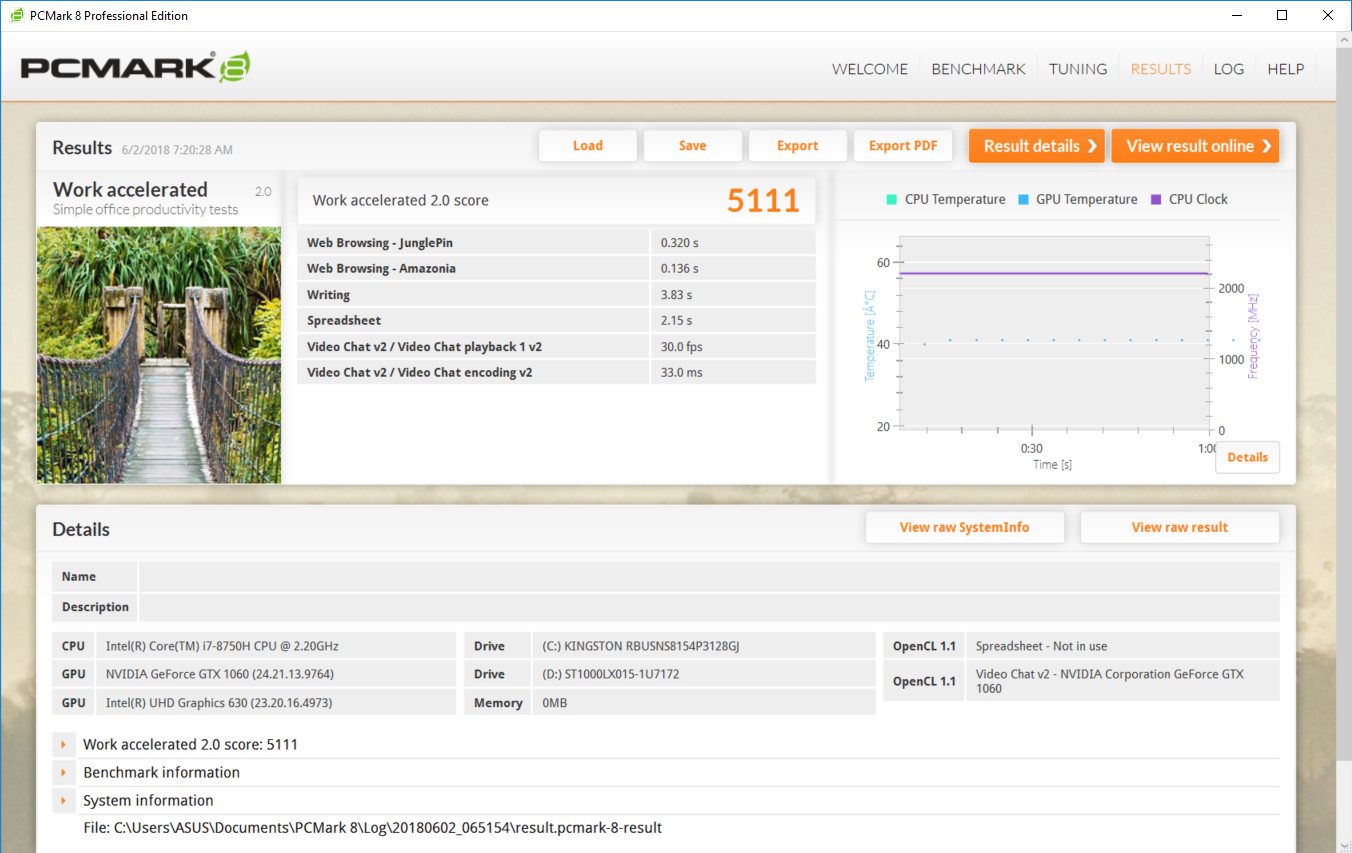
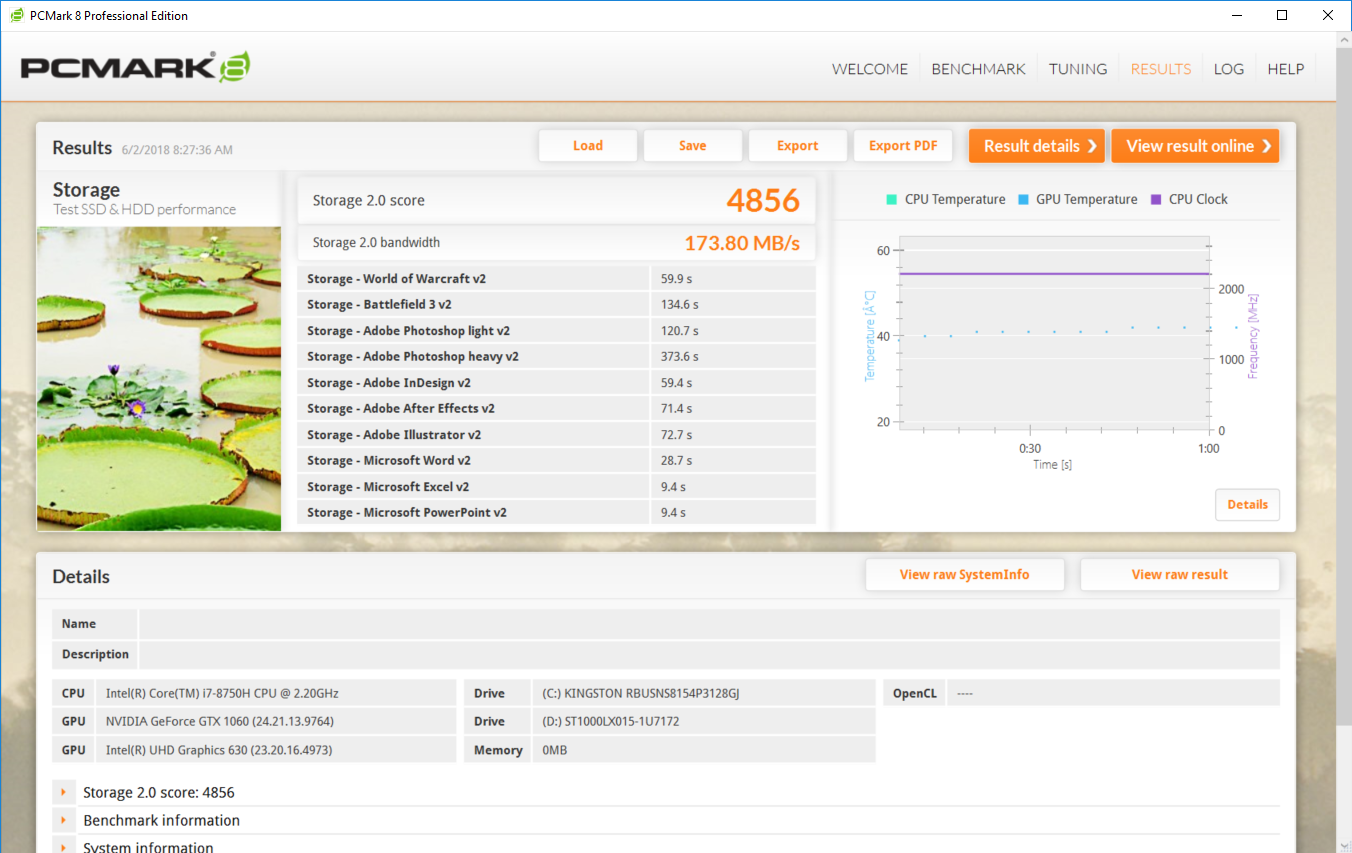
Overall system performance is snappy and in line with expectations. The relatively quick NVMe SSD makes for a widely responsive system; applications open almost immediately, and load times in games are reasonable. Normal tasks will not leave users waiting, and Windows 10 Home runs smoothly across the system.
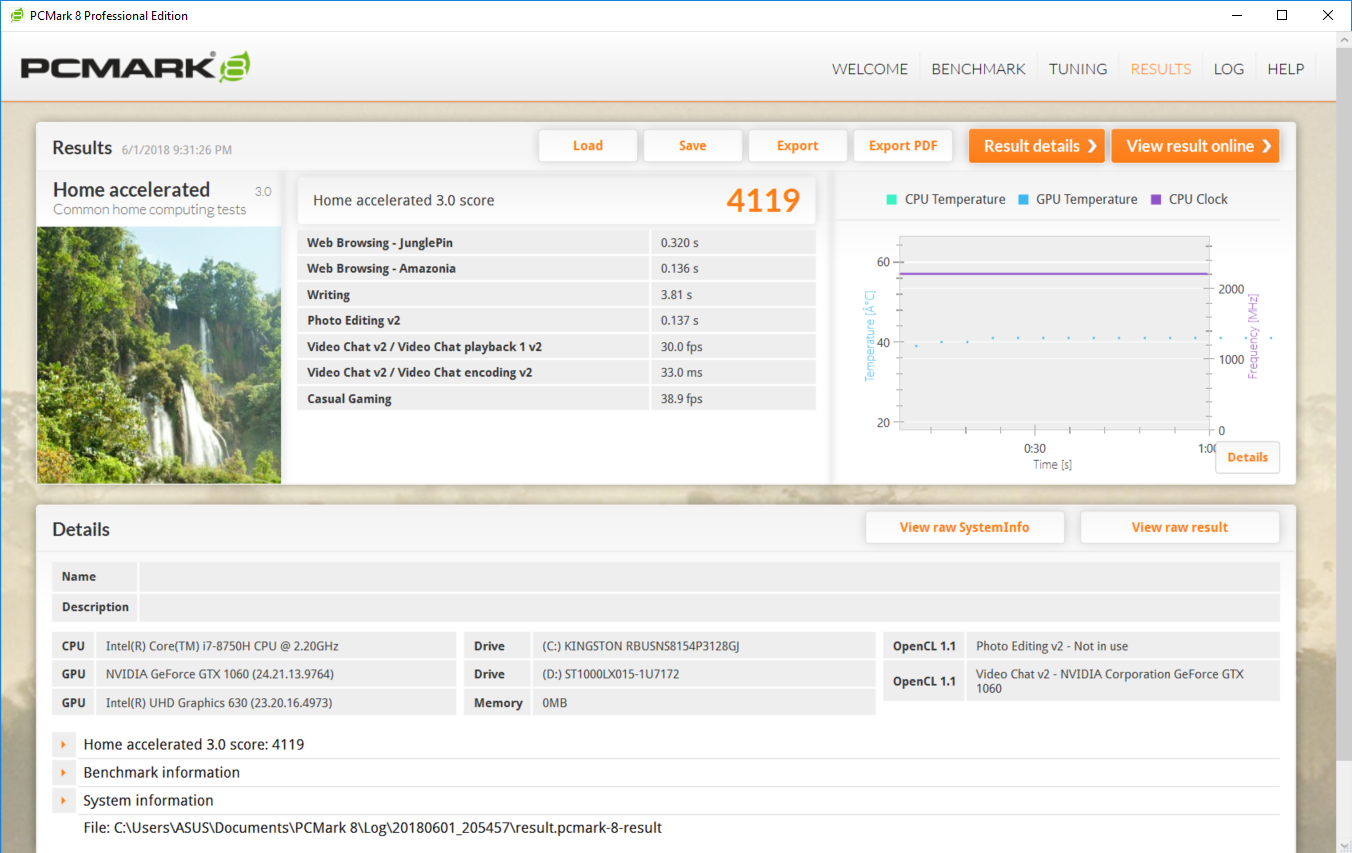
| PCMark 8 Home Score Accelerated v2 | 4119 points | |
| PCMark 8 Creative Score Accelerated v2 | 5454 points | |
| PCMark 8 Work Score Accelerated v2 | 5111 points | |
| PCMark 10 Score | 5092 points | |
Help | ||
Storage Devices
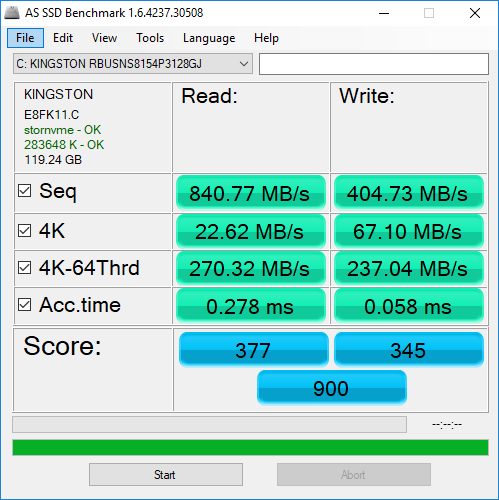
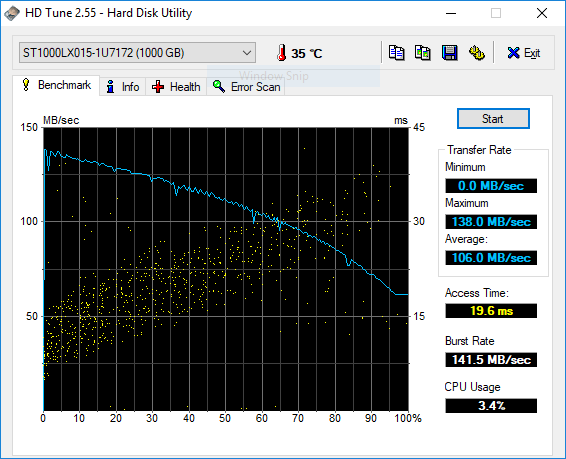
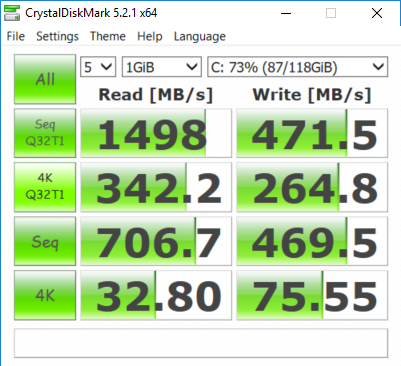
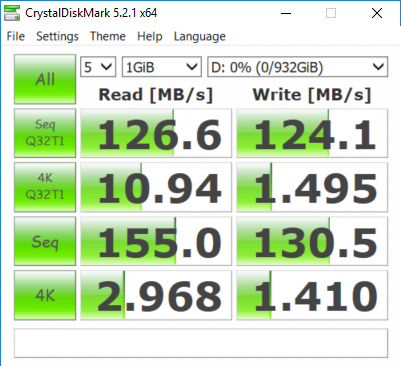
The GU501GM uses a hybrid storage solution, matching a small 128 GB NVMe boot drive with a larger 1 TB SSHD for mass storage. The Kingston NVMe drive is disappointing; read and write speeds are more reminiscent of SATA SSDs than their faster PCIe-based counterparts. This doesn't affect system performance for the most part (4K tests in AS SSD and CDM5 are both similar to other NVMe drives) but can create frustration when loading up large amounts of sequential data, such as when opening a large movie file or launching a game. The 1 TB SSHD has an 8 GB SSD cache for frequently used files stored on the larger drive.

| Asus ROG GU501GM-BI7N8 Kingston RBUSNS8154P3128GJ | MSI GS65 8RF-019DE Stealth Thin Samsung SSD PM981 MZVLB512HAJQ | Asus Zephyrus M GM501 Samsung SM961 MZVKW512HMJP m.2 PCI-e | Gigabyte Aero 15X v8 Toshiba NVMe THNSN5512GPU7 | Aorus X5 v8 Toshiba NVMe THNSN5512GPU7 | Acer Predator Triton 700 2x SK Hynix Canvas SC300 512GB M.2 (HFS512G39MND) (RAID 0) | Average Kingston RBUSNS8154P3128GJ | |
|---|---|---|---|---|---|---|---|
| AS SSD | 253% | 213% | 129% | 121% | 207% | 3% | |
| Copy Game MB/s | 419.3 | 369 ? -12% | |||||
| Copy Program MB/s | 269.2 | 209 ? -22% | |||||
| Copy ISO MB/s | 773 | 549 ? -29% | |||||
| Score Total | 900 | 4122 358% | 3649 305% | 2536 182% | 2515 179% | 3282 265% | 1014 ? 13% |
| Score Write | 345 | 2051 494% | 1446 319% | 939 172% | 954 177% | 1243 260% | 365 ? 6% |
| Score Read | 377 | 1346 257% | 1471 290% | 1092 190% | 1061 181% | 1350 258% | 443 ? 18% |
| Access Time Write * | 0.058 | 0.035 40% | 0.041 29% | 0.046 21% | 0.044 24% | 0.041 29% | 0.06829 ? -18% |
| Access Time Read * | 0.278 | 0.073 74% | 0.046 83% | 0.119 57% | 0.166 40% | 0.062 78% | 0.2317 ? 17% |
| 4K-64 Write | 237 | 1760 643% | 1198 405% | 742 213% | 773 226% | 913 285% | 259 ? 9% |
| 4K-64 Read | 270.3 | 1170 333% | 1218 351% | 847 213% | 856 217% | 1057 291% | 317 ? 17% |
| 4K Write | 67.1 | 107.2 60% | 90.2 34% | 80.4 20% | 84.5 26% | 93 39% | 65.5 ? -2% |
| 4K Read | 22.62 | 48.94 116% | 43.42 92% | 23.36 3% | 23.21 3% | 41.47 83% | 28.2 ? 25% |
| Seq Write | 404.7 | 1834 353% | 1580 290% | 1163 187% | 966 139% | 2372 486% | 404 ? 0% |
| Seq Read | 841 | 1266 51% | 2091 149% | 2213 163% | 1813 116% | 2517 199% | 973 ? 16% |
* ... smaller is better

GPU Performance
The NVIDIA GeForce GTX 1060 Max-Q GPU - Benchmarks and SpecsNvidia Geforce GTX 1060 in our GU501GM performs a bit better than the average 1060-equipped device and is about on par with AMD's Radeon RX 580 with the benefit of a lower power draw. For those that need a bit more graphical oomph, Nvidia's GeForce GTX 1070 Max-Q offers about 25% more punch, and the full GTX 1070 increases performance by almost half.
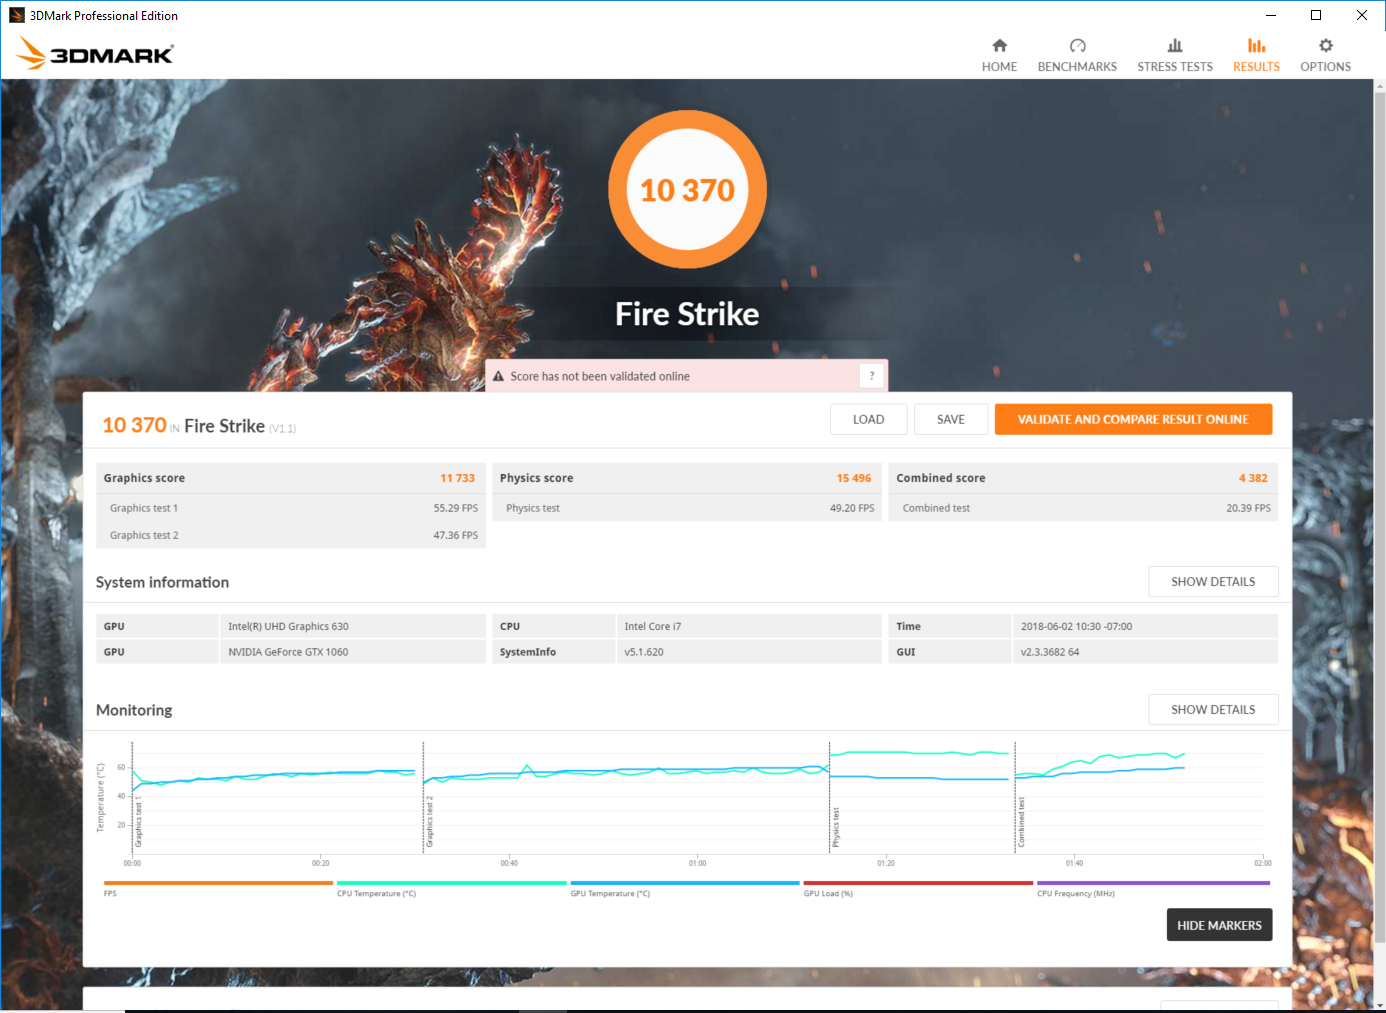
The GU501GM is a good showing of Nvidia's now-storied mid-range GPU, putting up a respectable 11733 in Fire Strike. This means the graphics card is adequate for 1080p work and should be more than enough for rendering and video editing, so long as 1080p is the highest resolution needed. The GPU will reach limits under 2K and 4K workloads. On battery, the GU501GM hits about 90-95% of the performance observed when plugged in.
For more about the Nvidia GeForce GTX 1060, please visit our dedicated GPU page here.

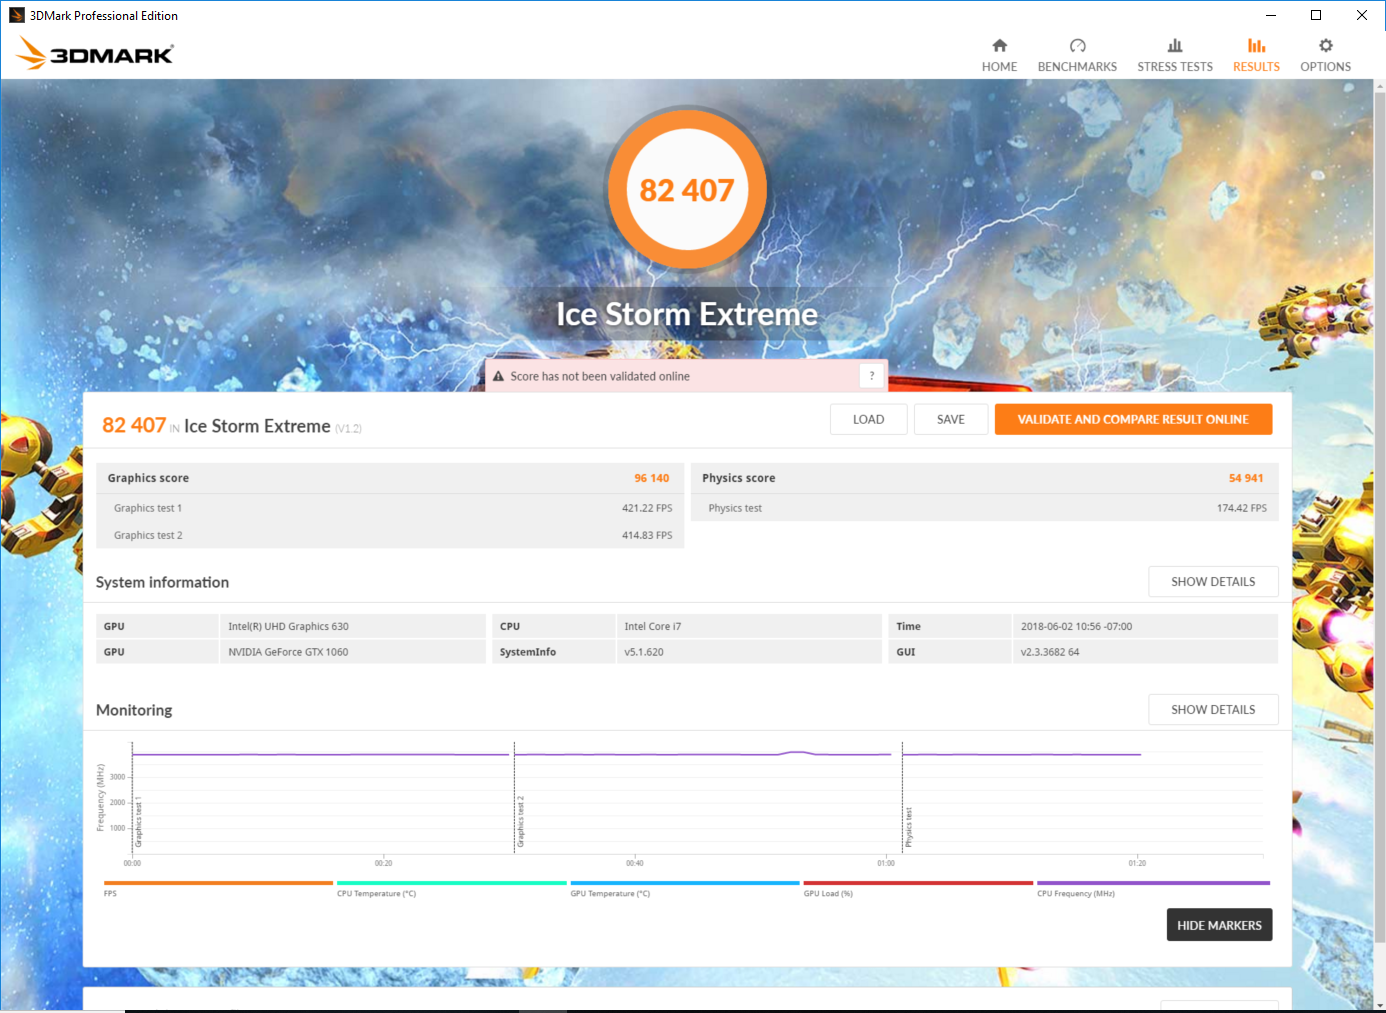
| 3DMark 06 Standard Score | 33570 points | |
| 3DMark 11 Performance | 13082 points | |
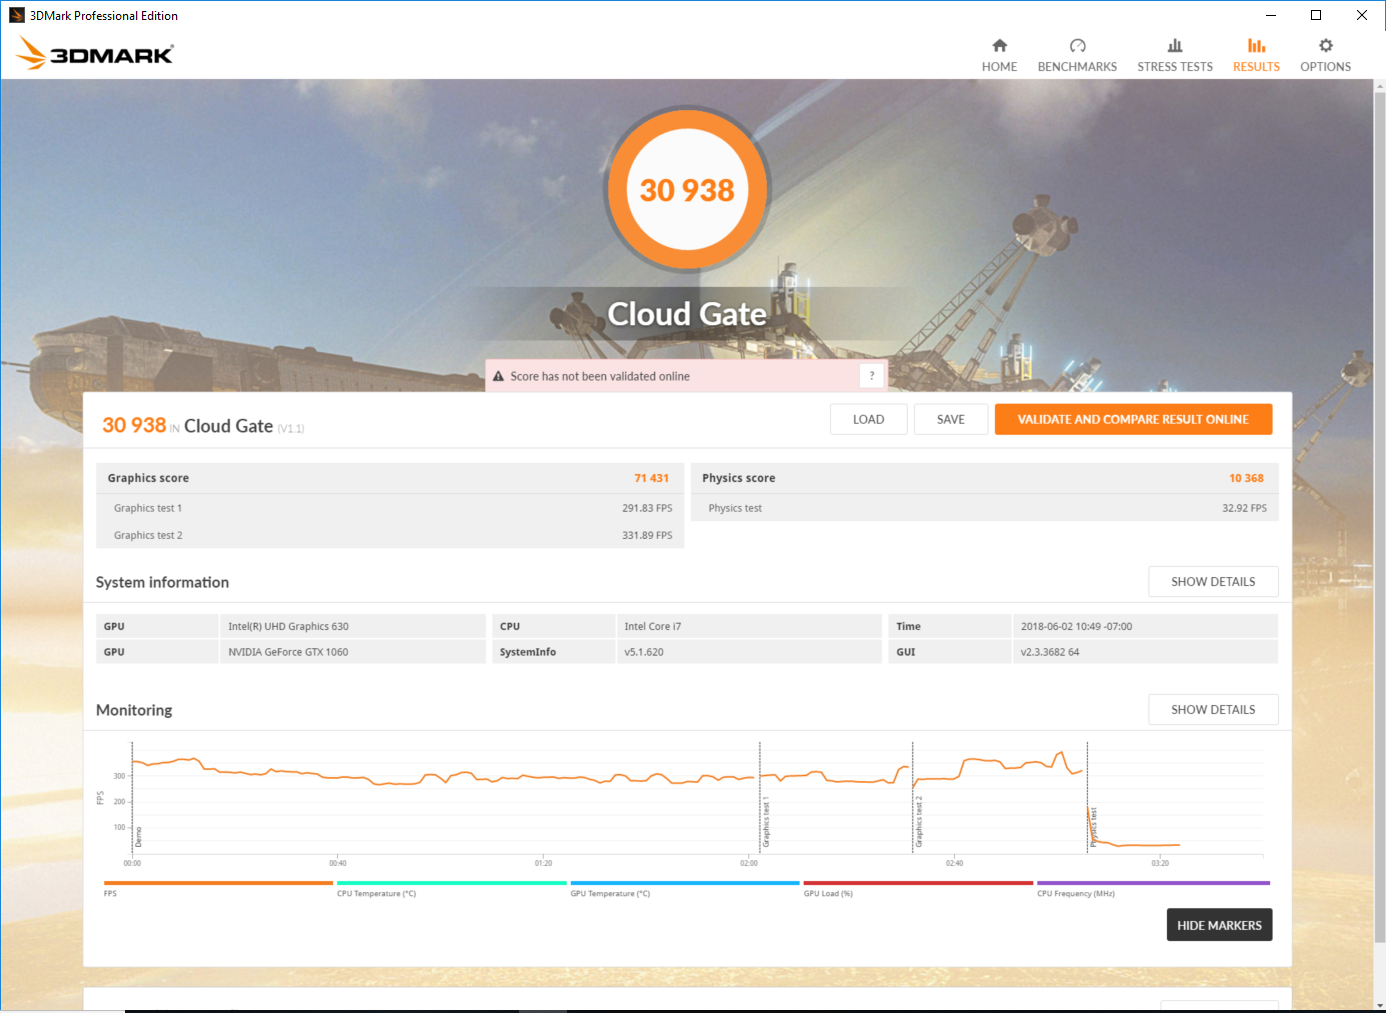
| 3DMark Cloud Gate Standard Score | 30938 points | |
| 3DMark Fire Strike Score | 10370 points | |
Help | ||
Gaming Performance
Full HD is the name of the game here. The GeForce GTX 1060, which is one of the most popular GPUs currently in use, is well-known to be able to push 60 fps at 1080p for most titles, and that story continues on with the GU501GM. Rise of the Tomb Raider, a 2016 title that is still fairly demanding, flirts with 60 fps with everything turned up. More demanding titles, like The Witcher 3, are playable at Ultra settings, but players will need to turn details down to hit the 60 fps threshold.
| Rise of the Tomb Raider - 1920x1080 Very High Preset AA:FX AF:16x (sort by value) | |
| Asus ROG GU501GM-BI7N8 | |
| Average NVIDIA GeForce GTX 1060 Mobile (51 - 68.8, n=37) | |
| The Witcher 3 - 1920x1080 Ultra Graphics & Postprocessing (HBAO+) (sort by value) | |
| Asus ROG GU501GM-BI7N8 | |
| MSI GS65 8RF-019DE Stealth Thin | |
| Asus Zephyrus M GM501 | |
| Gigabyte Aero 15X v8 | |
| Aorus X5 v8 | |
| Acer Predator Triton 700 | |
| Average NVIDIA GeForce GTX 1060 Mobile (24 - 42.3, n=60) | |
| Average of class Gaming (8.61 - 216, n=225, last 2 years) | |
| low | med. | high | ultra | |
| BioShock Infinite (2013) | 194 | 173 | 162 | 99 |
| The Witcher 3 (2015) | 166 | 120 | 66 | 39 |
| Rise of the Tomb Raider (2016) | 163 | 120 | 71 | 57 |
| Hitman 2016 (2016) | 71 | 70 | 59 | 46 |
Stress Test
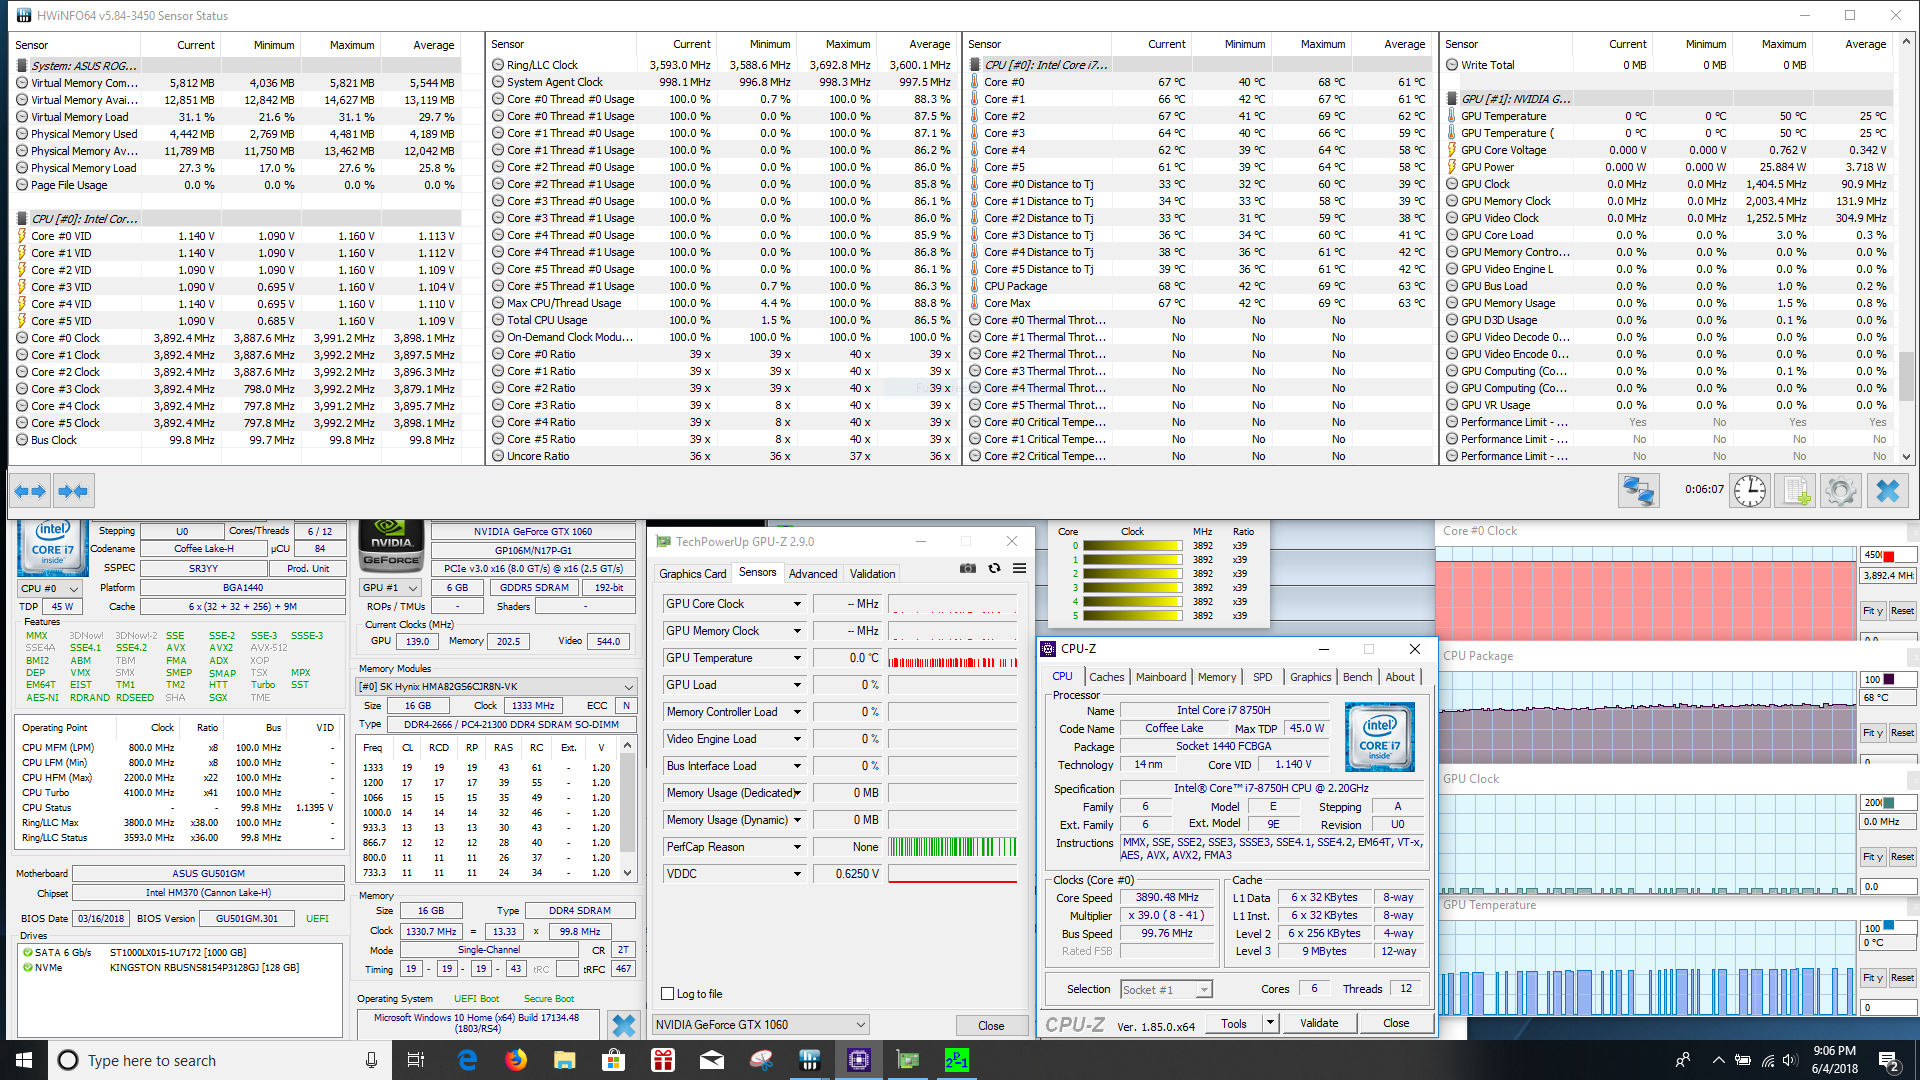
Stress testing shows us one of the ugly sides of the GU501GM. Up until this point, the story has been good to great. Unfortunately, stress testing the CPU completely crippled the system. During our testing period, we attempted to run our hour-long stress test of Prime95, which fully loads all 12 threads of the CPU, six times. Each run resulted in a crash, some merely minutes into the test. We attempted using different power profile configurations (e.g., "Power Saver," "High Performance"), but all resulted in a system crash and reboot.
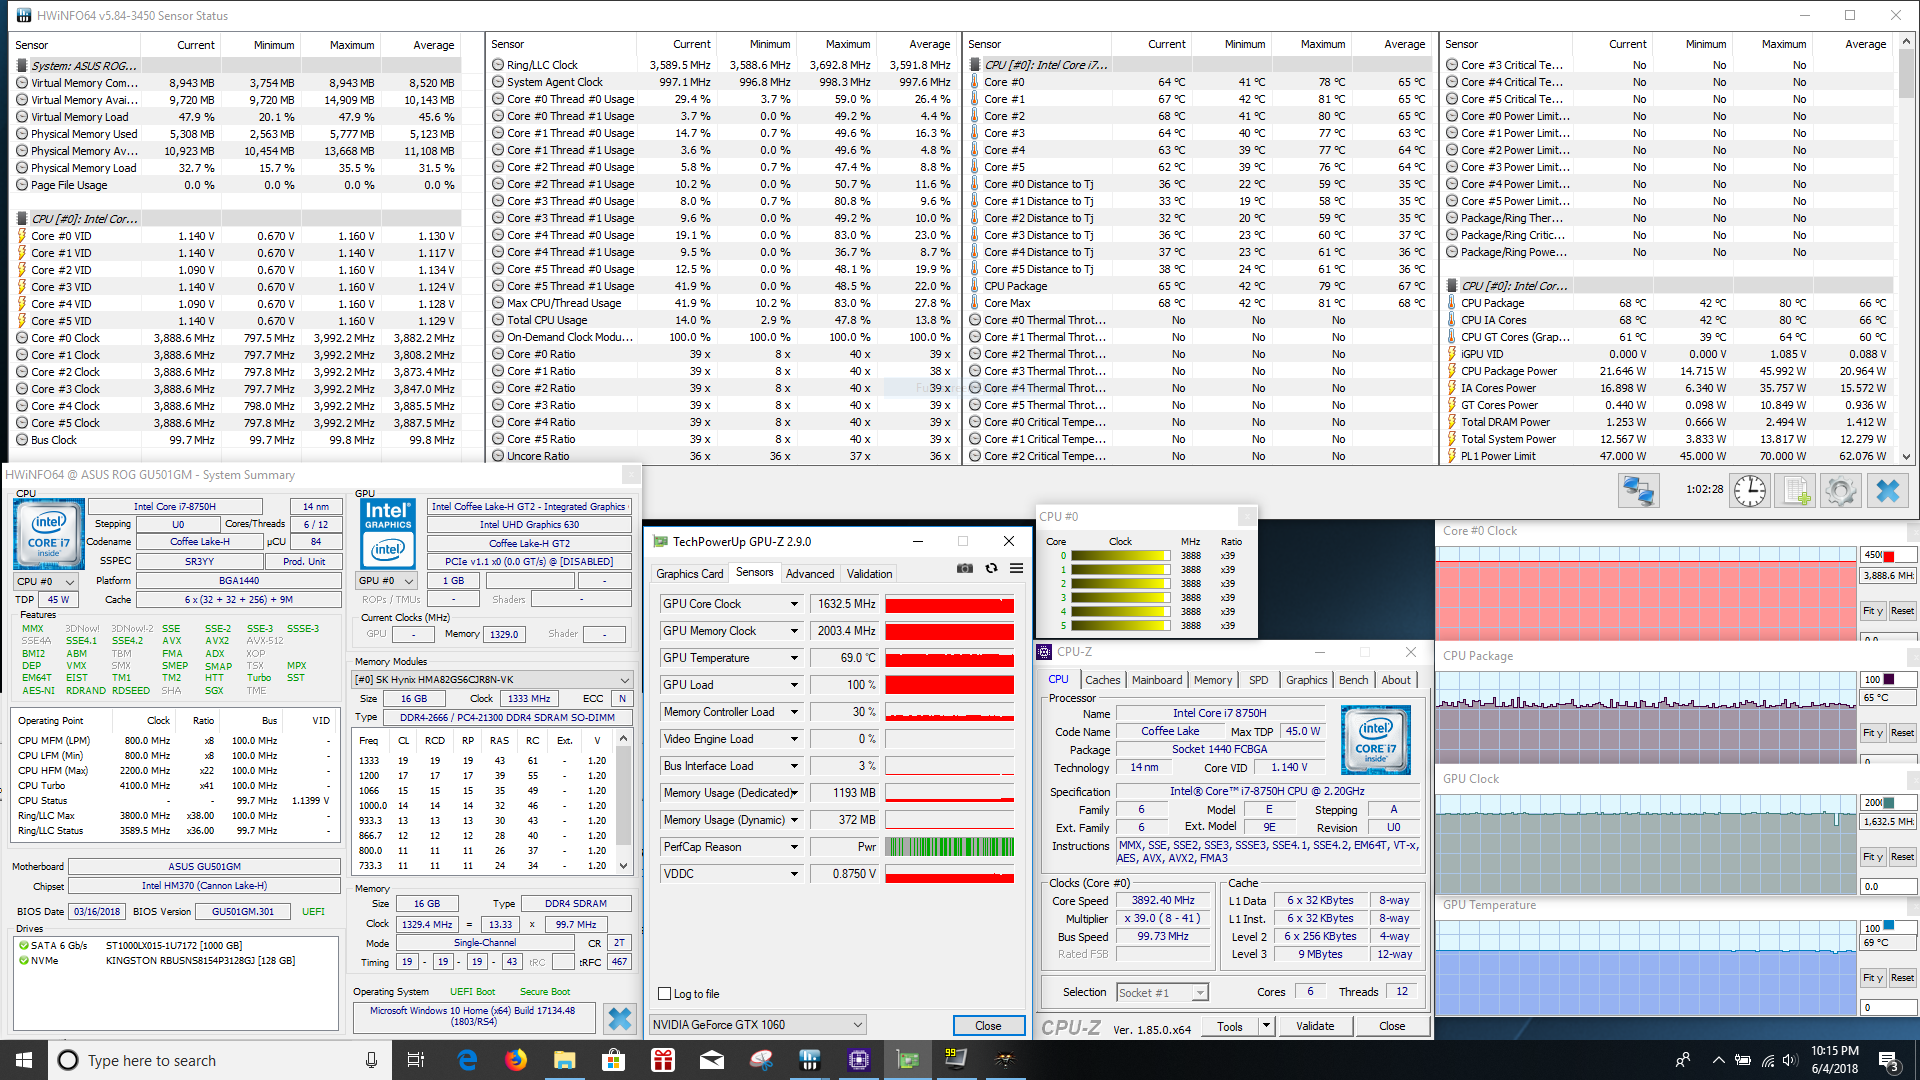
This result is extremely odd, as the CPU doesn't seem to fall victim to any undue heat stress that typically causes this kind of instability. In all runs, CPU temperatures steadily climbed to about 70° C and plateaued at this level. Clock speeds also stayed steady between 3.8-3.9 GHz, which is the CPU's rated boost. Still, the CPU cannot seem to hold this kind of load for more than about a half hour. System crashes do not happen under any other strain; the system remains stable while gaming and when FurMark is run (with or without Prime95).
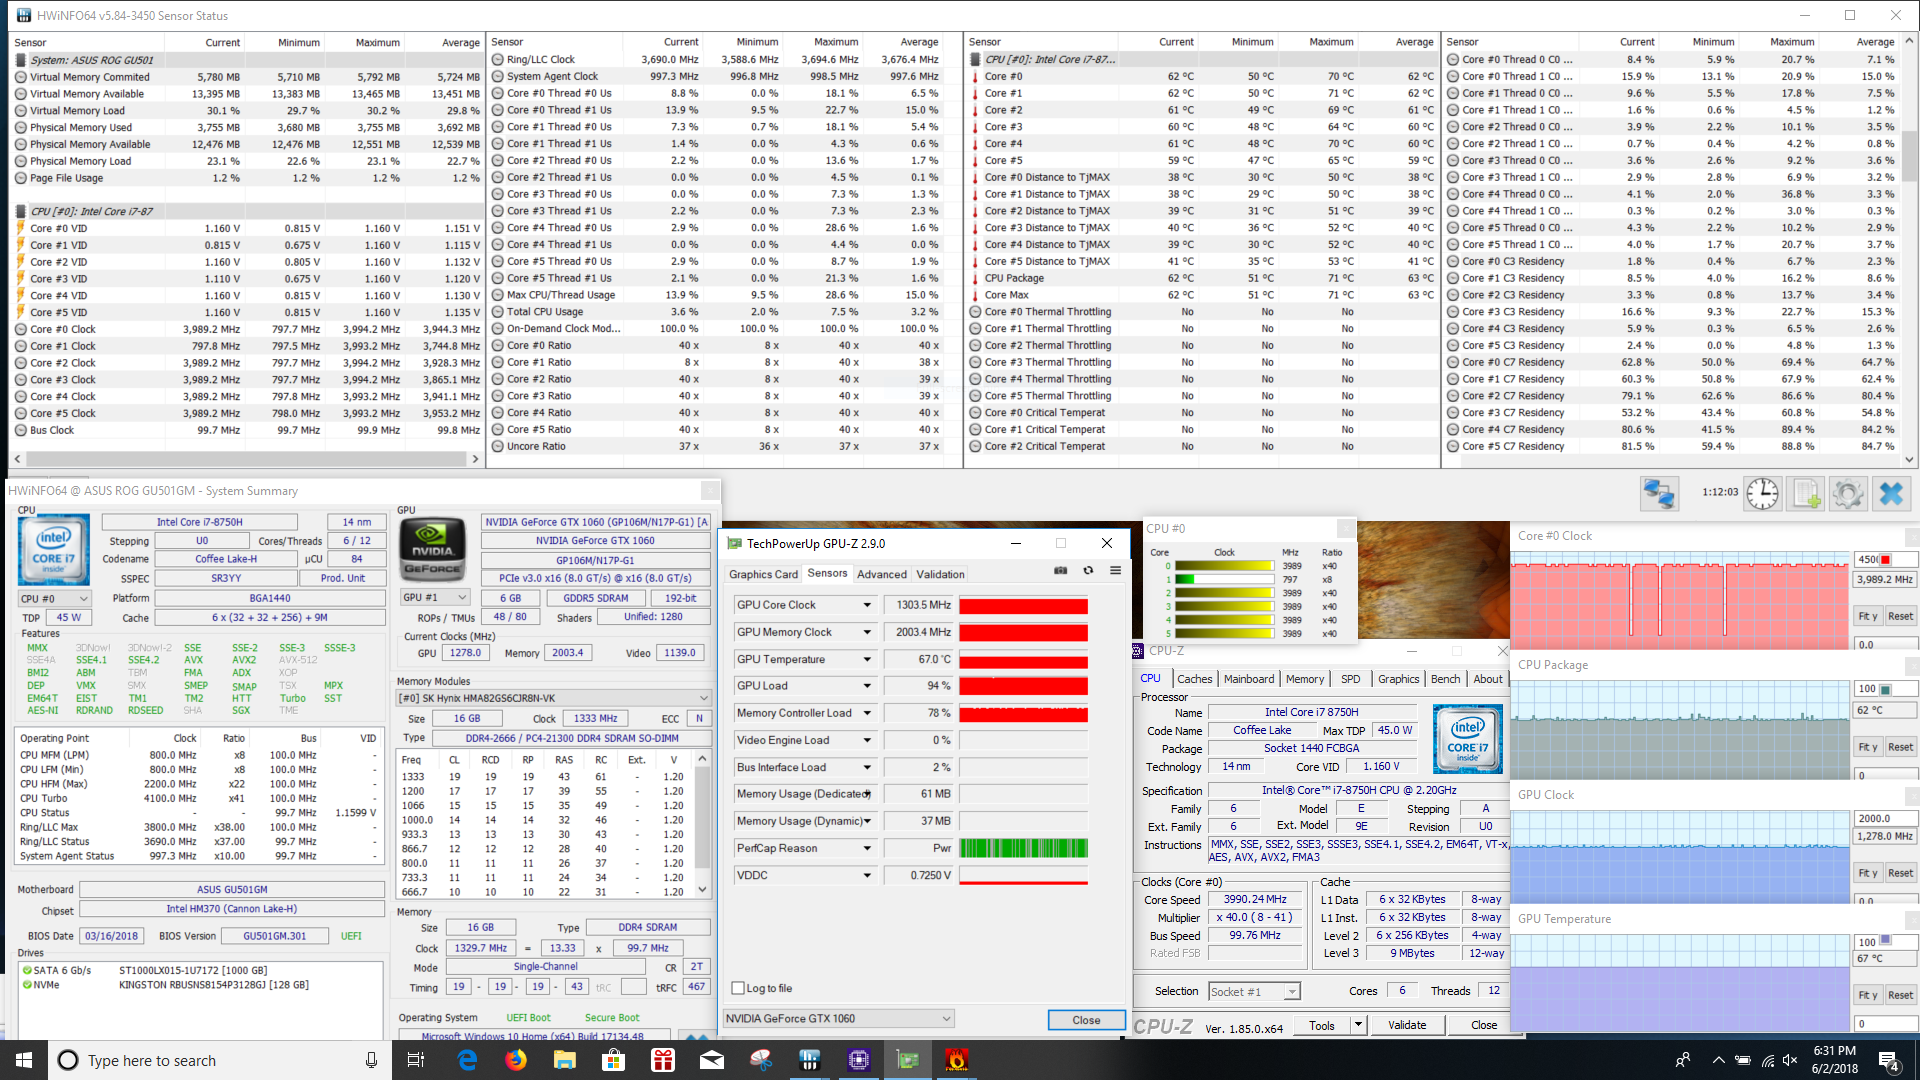
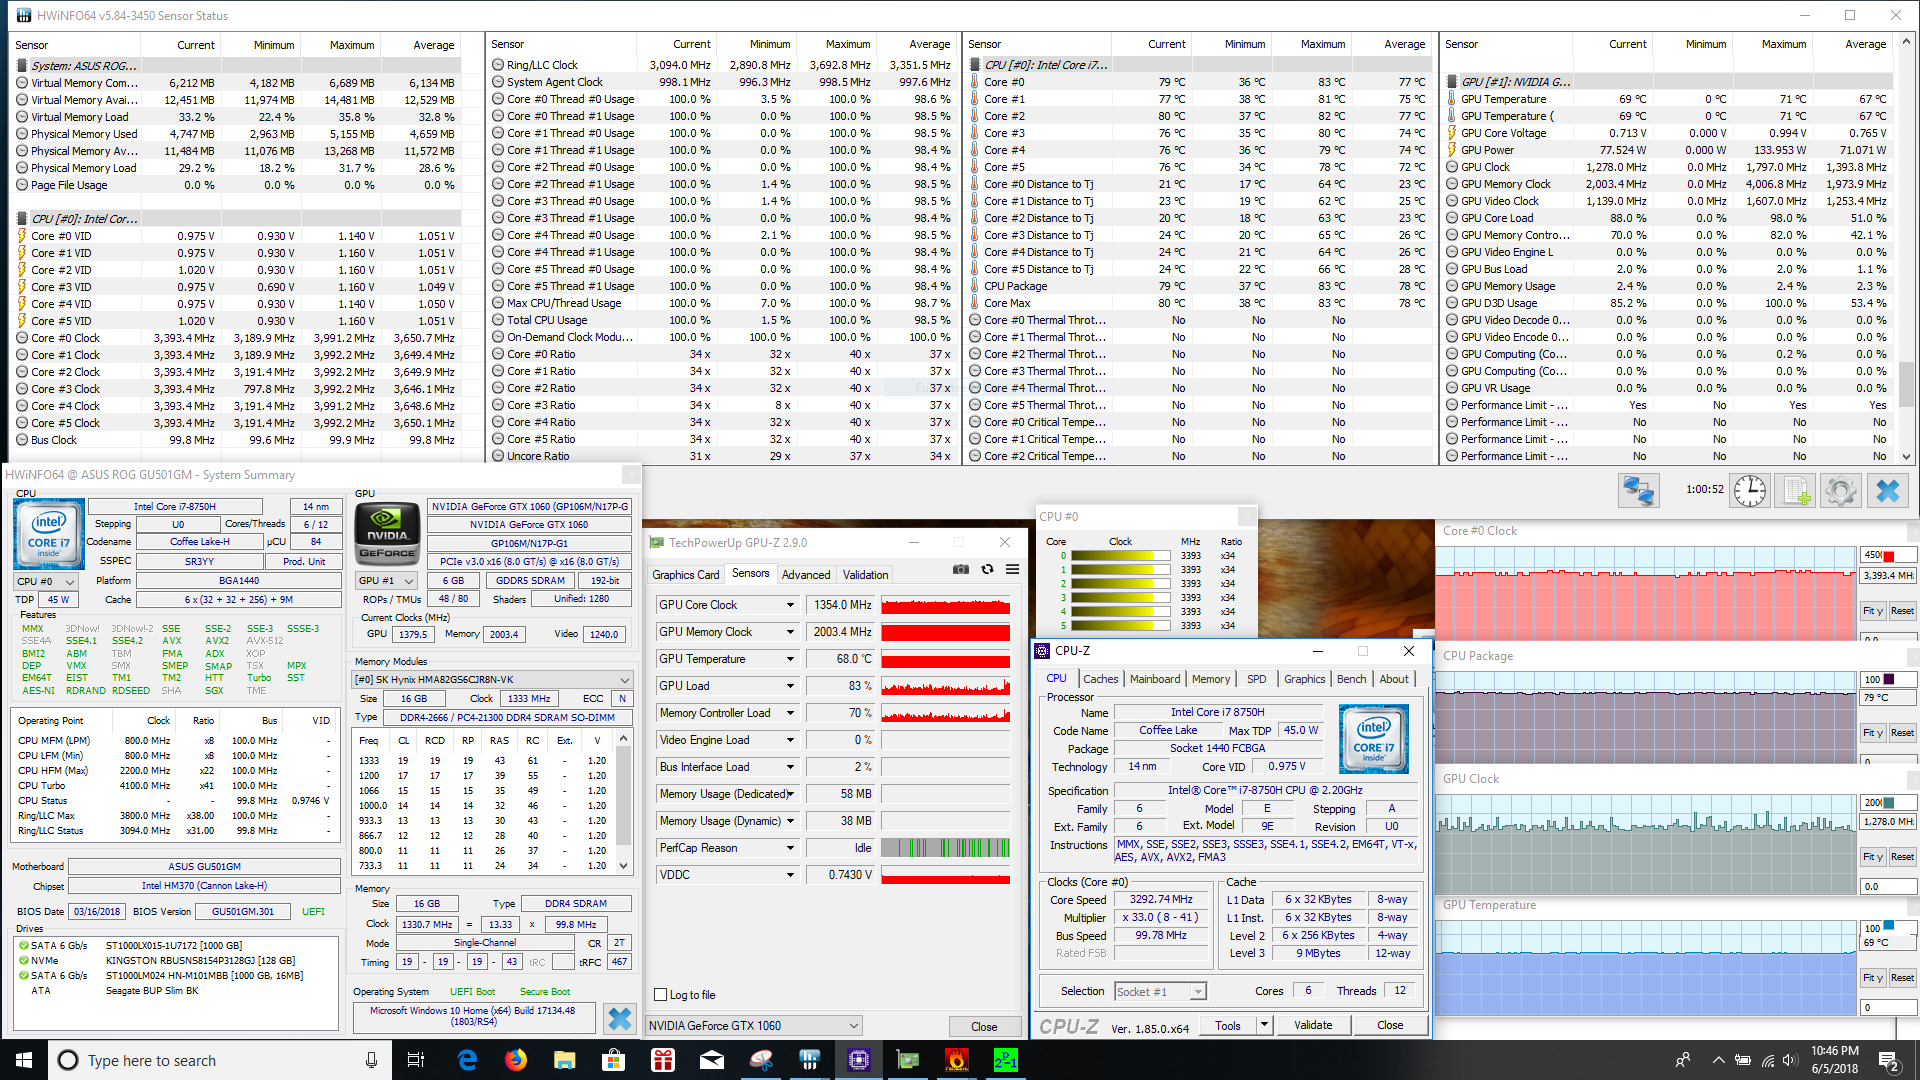
GPU stress is a better story to hear. Running FurMark for an hour, the GPU stays rock solid at 67° C with a clock hovering around 1278 MHz. Adding Prime95, the system surprisingly remains fully stable; the CPU runs near its rated boost at 3.6 GHz, and the GPU hovers around 1400 MHz. Under gaming load, the system truly shines; the CPU unwavering stays at 3.9 GHz while the GPU rockets past 1600 MHz. Internal temperatures under gaming load stay below 70° C. While these results are impressive, they come at the cost of annoying fan noise, as we'll examine below.
| CPU Clock (GHz) | GPU Clock (MHz) | Average CPU Temperature (°C) | Average GPU Temperature (°C) | |
| Prime95 Stress | crash | - | - | - |
| FurMark Stress | 4.0 | 1280 | 62 | 67 |
| Prime95 + FurMark Stress | 3.6 | 1394 | 78 | 67 |
| Witcher 3 Stress (if applicable) | 3.9 | 1632 | 67 | 69 |
Emissions
System Noise
One of the weaker points of the GU501GM is its fan system. Under full load, the fans hit about 51 dB(A). Though this is high, the GU501GM is not the loudest gaming system we've tested. Rather, the problem comes in the fans' high pitch. The fans on similar thin-and-lights, like the Zephyrus M GM501 and MSI GS65, are loud but are more evenly pitched than our review system. The GU501GM's fans are more akin to a whistle than a whir, and under full load, the system will screech.
There is a silver lining; Asus includes three fan profiles available at the push of a button. Under the lower two settings ("Silent" and "Balanced"), the fans are more reasonable. The "Silent" mode sees the fans ramp only under duress, and even then barely so. The "Balanced" profile keeps the fans at bay, but system noise is just as loud when gaming or under strain as the "Overboost" mode. During normal tasks (web browsing, word processing), the fans pulse when using the "Balanced" or "Overboost" modes.
During light tasks when the fans are off, the SSHD can barely be heard, although some gentle clicks will tease users' ears when the drive is accessed. There is some faint coil whine that can be heard at a normal distance from the machine.
Noise Level
| Idle |
| 31.4 / 31.4 / 34.2 dB(A) |
| Load |
| 42.8 / 50.9 dB(A) |
 | ||
30 dB silent 40 dB(A) audible 50 dB(A) loud |
||
min: | ||
| Asus ROG GU501GM-BI7N8 GeForce GTX 1060 Mobile, i7-8750H, Kingston RBUSNS8154P3128GJ | MSI GS65 8RF-019DE Stealth Thin GeForce GTX 1070 Max-Q, i7-8750H, Samsung SSD PM981 MZVLB512HAJQ | Asus Zephyrus M GM501 GeForce GTX 1070 Mobile, i7-8750H, Samsung SM961 MZVKW512HMJP m.2 PCI-e | Gigabyte Aero 15X v8 GeForce GTX 1070 Max-Q, i7-8750H, Toshiba NVMe THNSN5512GPU7 | Aorus X5 v8 GeForce GTX 1070 Mobile, i7-8850H, Toshiba NVMe THNSN5512GPU7 | Acer Predator Triton 700 GeForce GTX 1080 Max-Q, i7-7700HQ, 2x SK Hynix Canvas SC300 512GB M.2 (HFS512G39MND) (RAID 0) | |
|---|---|---|---|---|---|---|
| Noise | 5% | -1% | -3% | -7% | -2% | |
| off / environment * | 28.6 | 30 -5% | 29 -1% | 29 -1% | 30 -5% | 31 -8% |
| Idle Minimum * | 31.4 | 30 4% | 30 4% | 30 4% | 33 -5% | 33 -5% |
| Idle Average * | 31.4 | 31 1% | 31 1% | 31 1% | 35 -11% | 34 -8% |
| Idle Maximum * | 34.2 | 34 1% | 33 4% | 35 -2% | 40 -17% | 40 -17% |
| Load Average * | 42.8 | 43 -0% | 49 -14% | 49 -14% | 45 -5% | 41 4% |
| Witcher 3 ultra * | 50.9 | 42 17% | 50 2% | 51 -0% | 50 2% | 43 16% |
| Load Maximum * | 50.9 | 44 14% | 52 -2% | 54 -6% | 55 -8% | 48 6% |
* ... smaller is better
Temperature
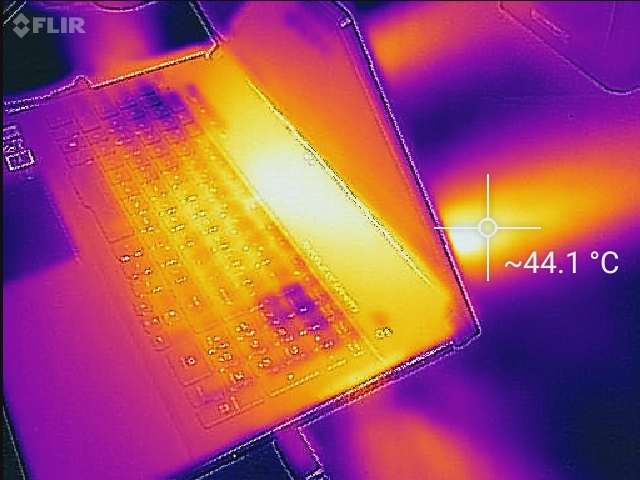
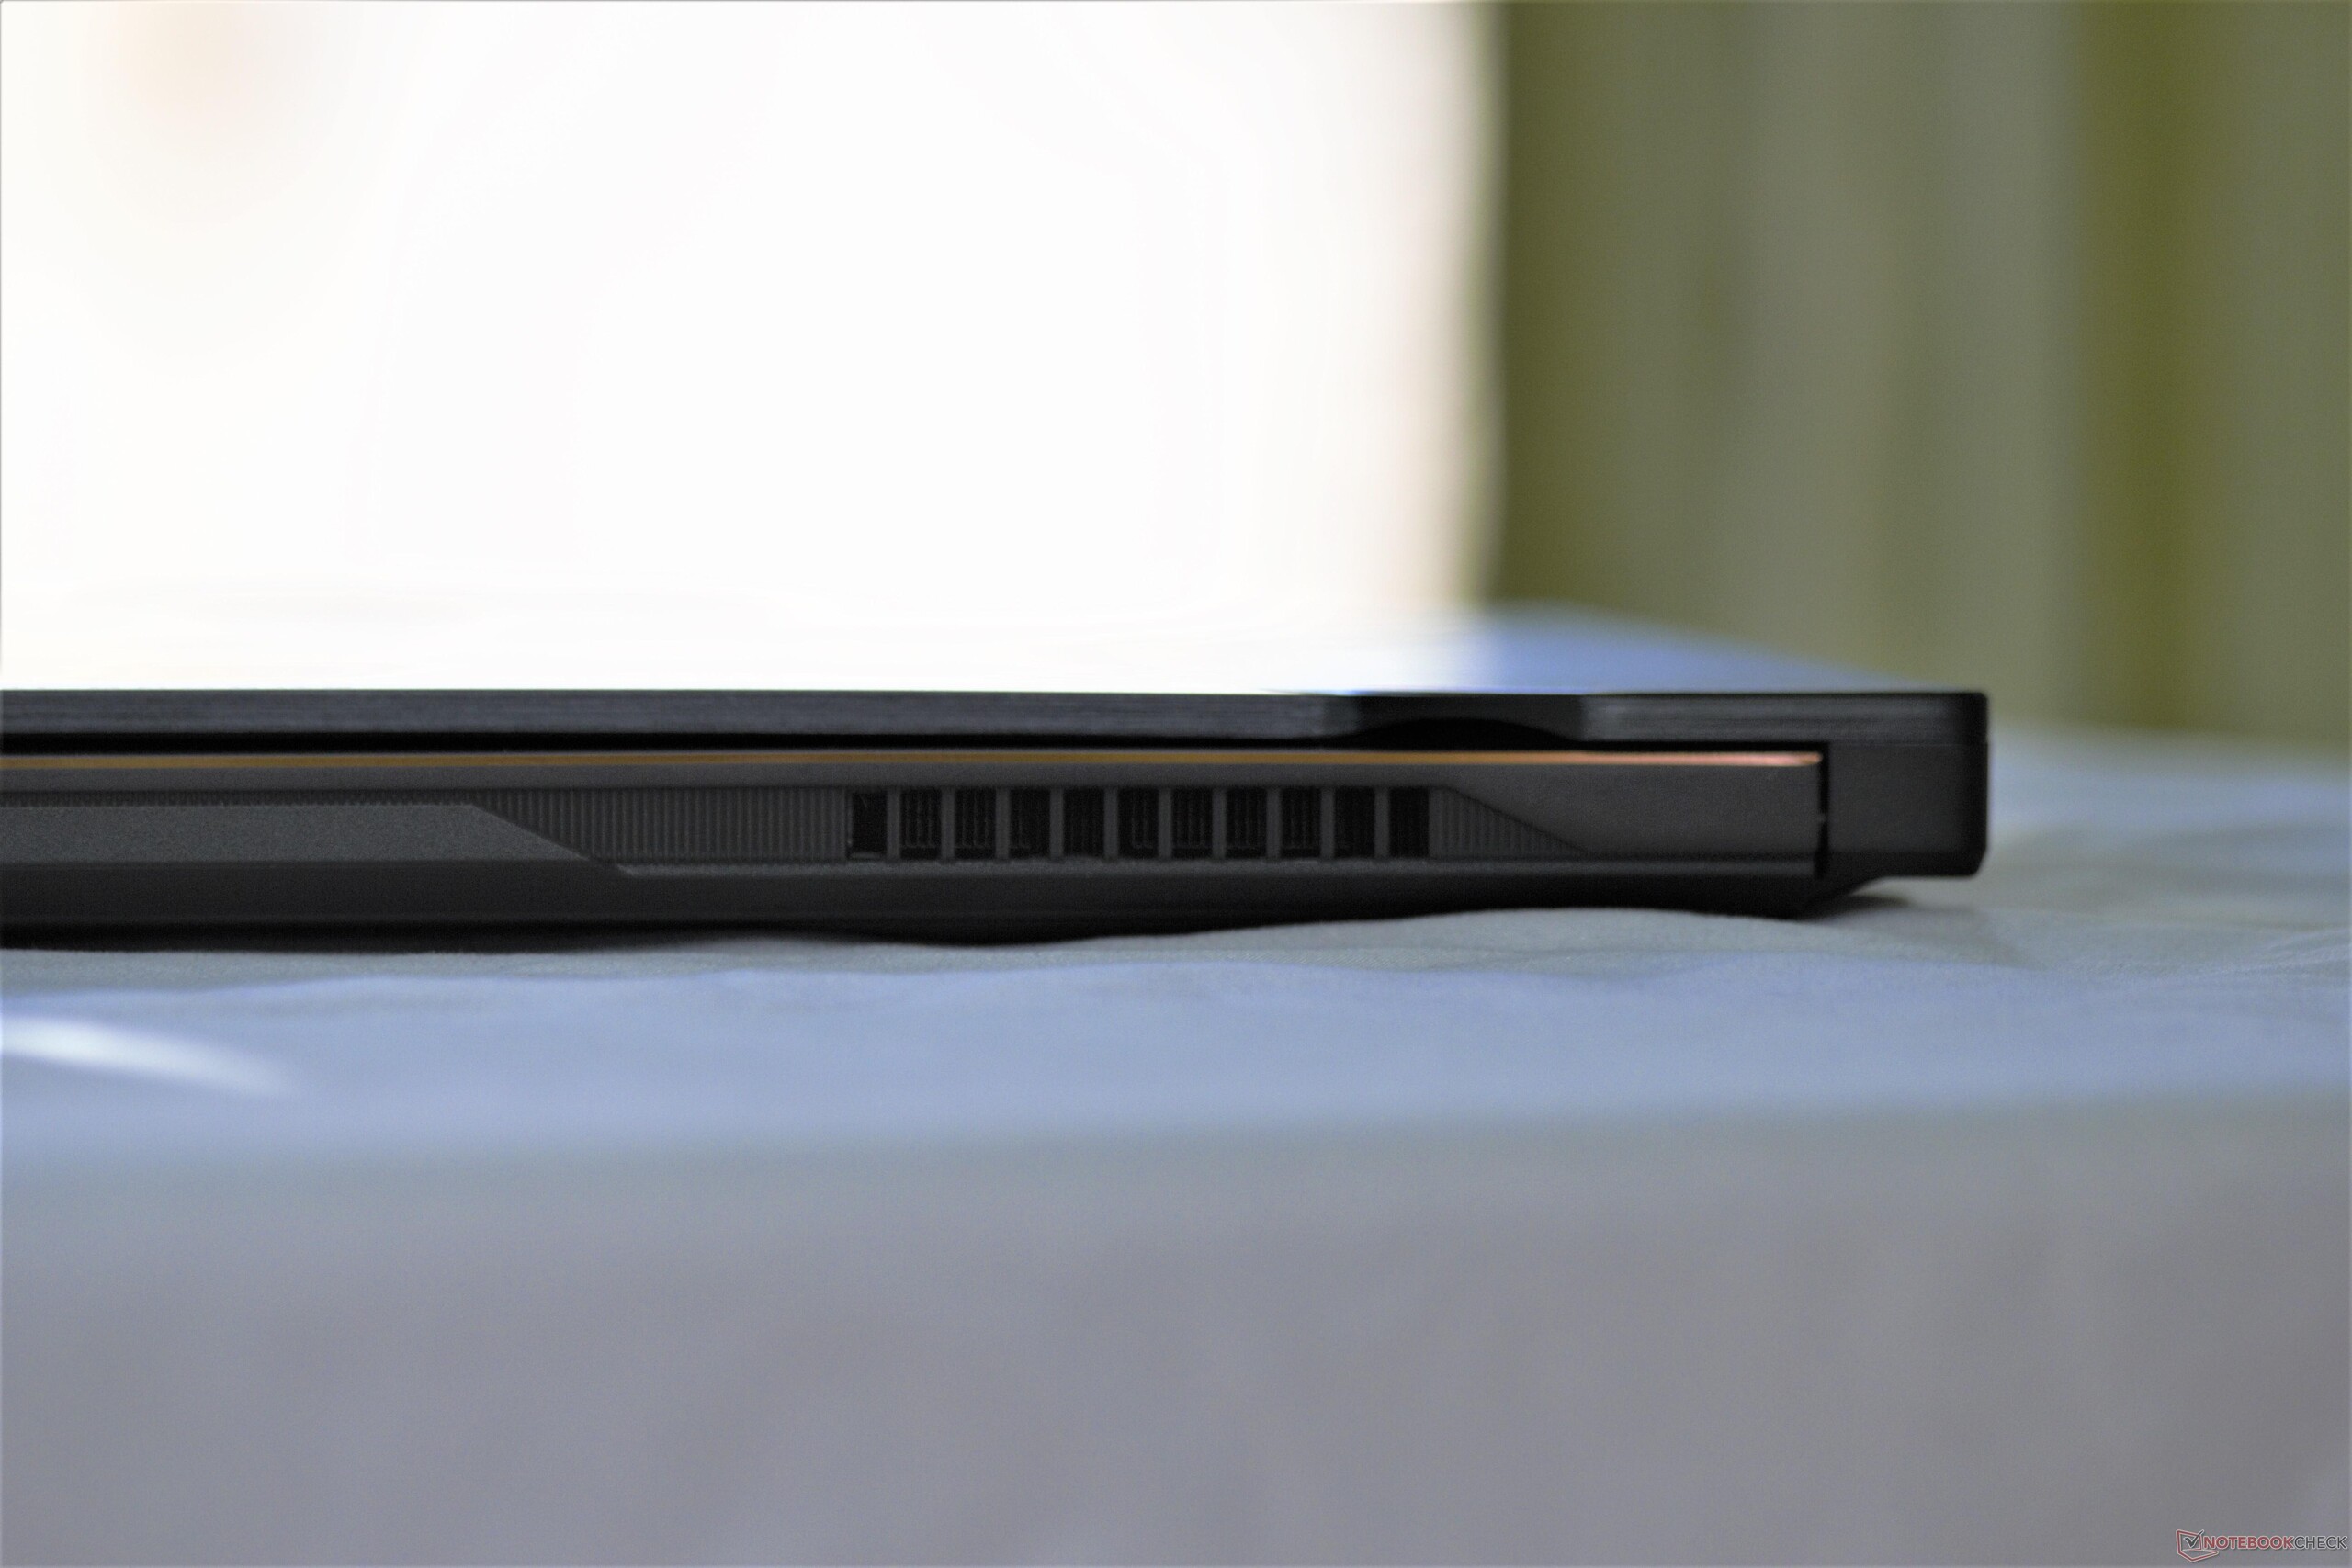
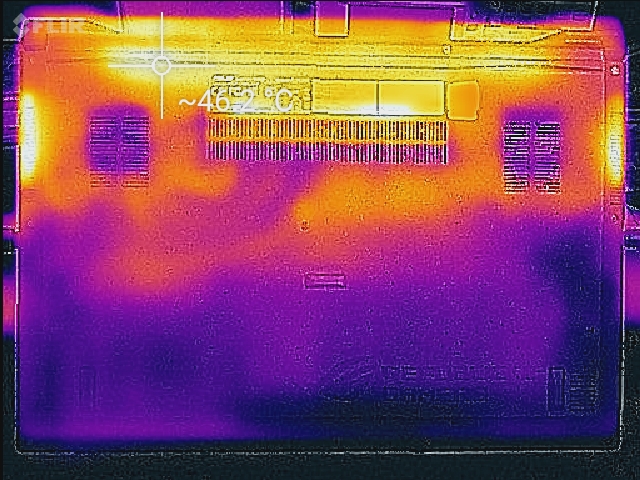
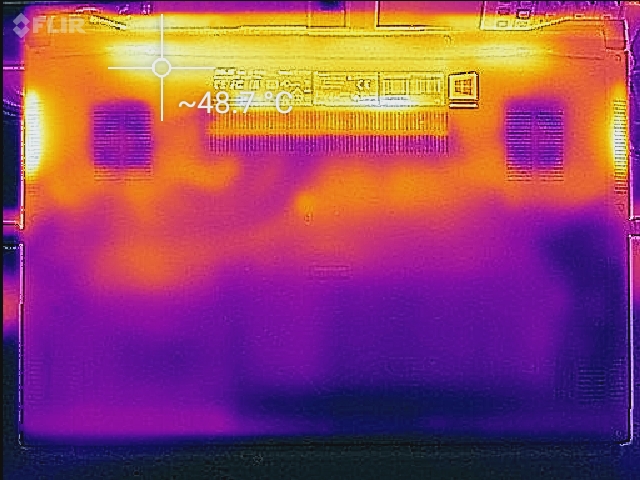
The benefit of the overzealous fans is seen in external temperatures, which are good for a thin gaming notebook. Under gaming or synthetic loads, the top side stays at or below 43° C. Even then, these temperatures only occur at the spacious vents situated directly under the display, which is far enough away from the keyboard that users should hardly notice the increase in temperature. Asus has done a good job of engineering the thermal pipes to draw heat away from where a gamer's hands normally rest (the WASD keys and spacebar), which makes for a comfortable gaming experience. Just be sure to game on a desk and not a lap; temperatures along the rear exhaust vents approach 50° C.
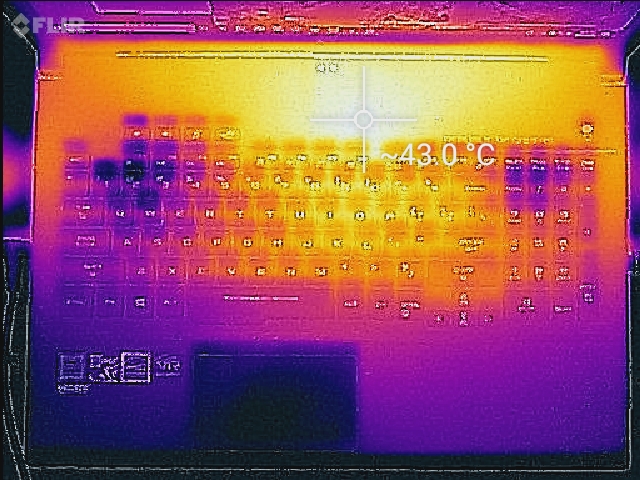
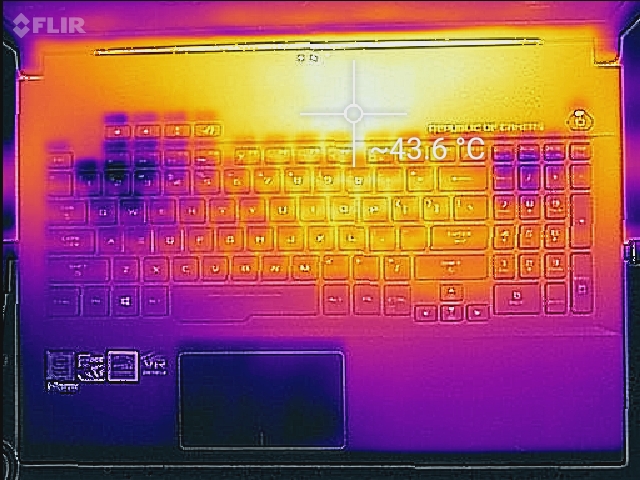
(±) The maximum temperature on the upper side is 43 °C / 109 F, compared to the average of 40.4 °C / 105 F, ranging from 21.2 to 68.8 °C for the class Gaming.
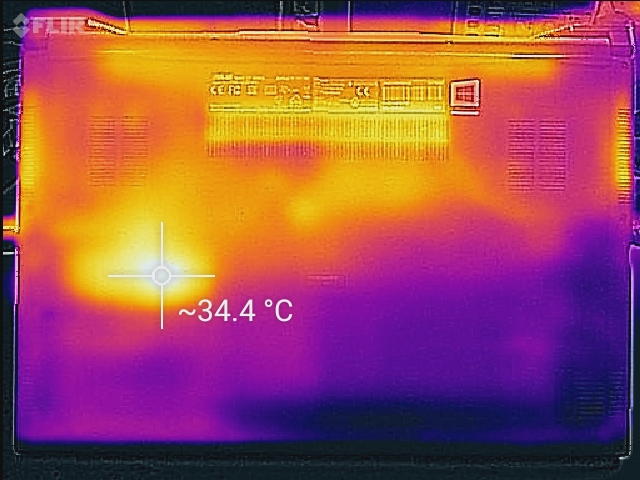
(-) The bottom heats up to a maximum of 46.6 °C / 116 F, compared to the average of 43.2 °C / 110 F
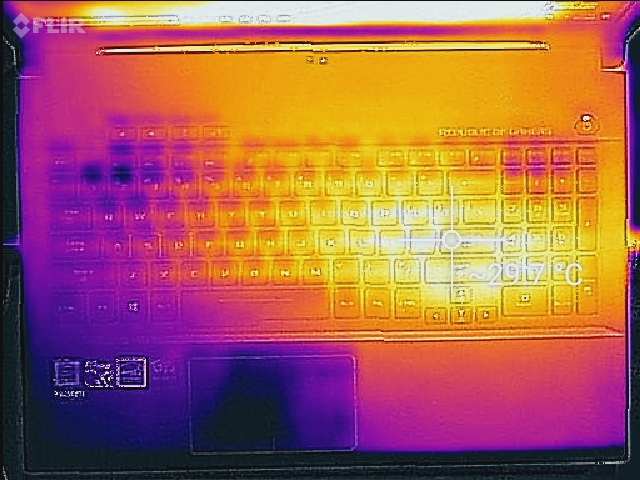
(+) In idle usage, the average temperature for the upper side is 26.3 °C / 79 F, compared to the device average of 33.8 °C / 93 F.
(±) Playing The Witcher 3, the average temperature for the upper side is 34.6 °C / 94 F, compared to the device average of 33.8 °C / 93 F.
(+) The palmrests and touchpad are cooler than skin temperature with a maximum of 30.2 °C / 86.4 F and are therefore cool to the touch.
(±) The average temperature of the palmrest area of similar devices was 28.9 °C / 84 F (-1.3 °C / -2.4 F).
| Asus ROG GU501GM-BI7N8 GeForce GTX 1060 Mobile, i7-8750H, Kingston RBUSNS8154P3128GJ | MSI GS65 8RF-019DE Stealth Thin GeForce GTX 1070 Max-Q, i7-8750H, Samsung SSD PM981 MZVLB512HAJQ | Asus Zephyrus M GM501 GeForce GTX 1070 Mobile, i7-8750H, Samsung SM961 MZVKW512HMJP m.2 PCI-e | Gigabyte Aero 15X v8 GeForce GTX 1070 Max-Q, i7-8750H, Toshiba NVMe THNSN5512GPU7 | Aorus X5 v8 GeForce GTX 1070 Mobile, i7-8850H, Toshiba NVMe THNSN5512GPU7 | Acer Predator Triton 700 GeForce GTX 1080 Max-Q, i7-7700HQ, 2x SK Hynix Canvas SC300 512GB M.2 (HFS512G39MND) (RAID 0) | |
|---|---|---|---|---|---|---|
| Heat | -1% | -6% | -10% | -7% | -21% | |
| Maximum Upper Side * | 43 | 49 -14% | 52 -21% | 53 -23% | 50 -16% | 61 -42% |
| Maximum Bottom * | 46.6 | 63 -35% | 49 -5% | 65 -39% | 62 -33% | 69 -48% |
| Idle Upper Side * | 29.2 | 24 18% | 31 -6% | 26 11% | 27 8% | 29 1% |
| Idle Bottom * | 34 | 25 26% | 31 9% | 30 12% | 29 15% | 32 6% |
* ... smaller is better
Speakers

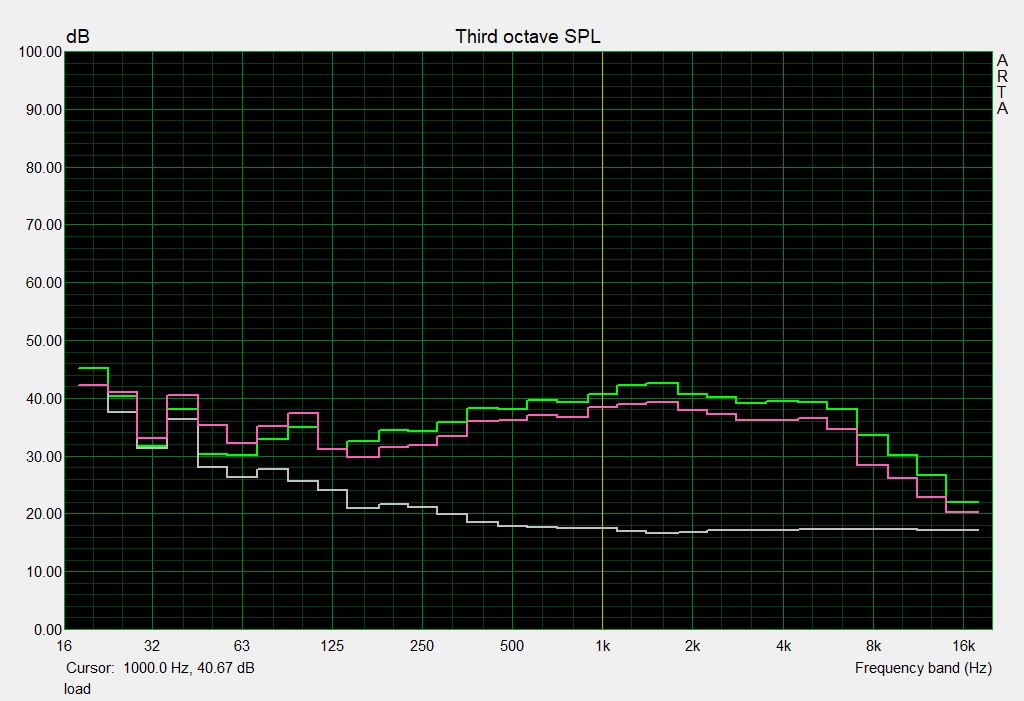
The speakers are surprisingly good. Asus has recently surprised us in this regard. While the absence of a subwoofer results in anemic bass, the speakers are more evenly tuned than previous devices from the company. This creates a more level aural experience. Mids are well-balanced against highs, and the resultant sound is fuller and packs more body. Unfortunately, the whining fans will still necessitate headphones while gaming (or other heavy loads), but music will sound better on these speakers than other gaming devices.
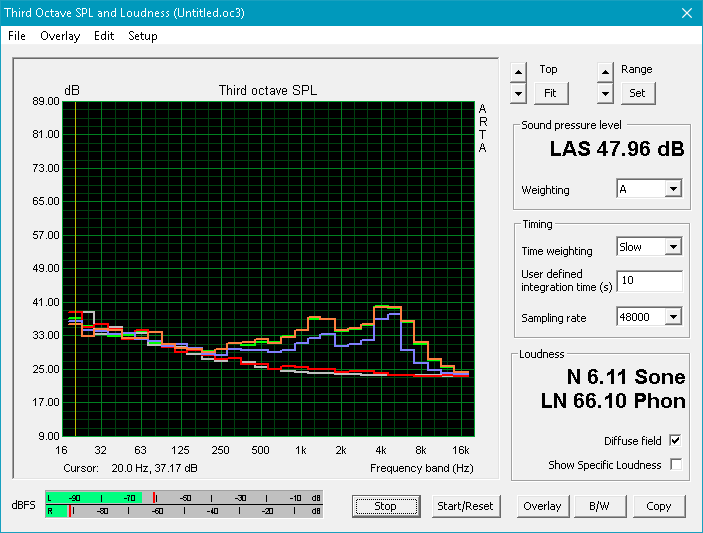
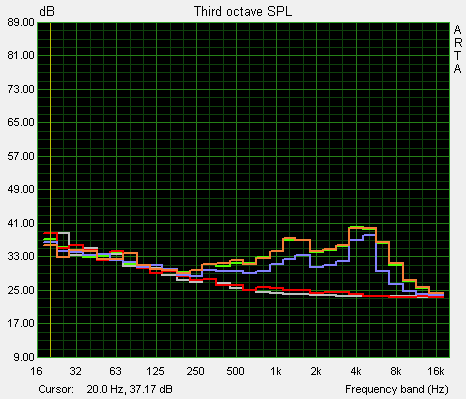
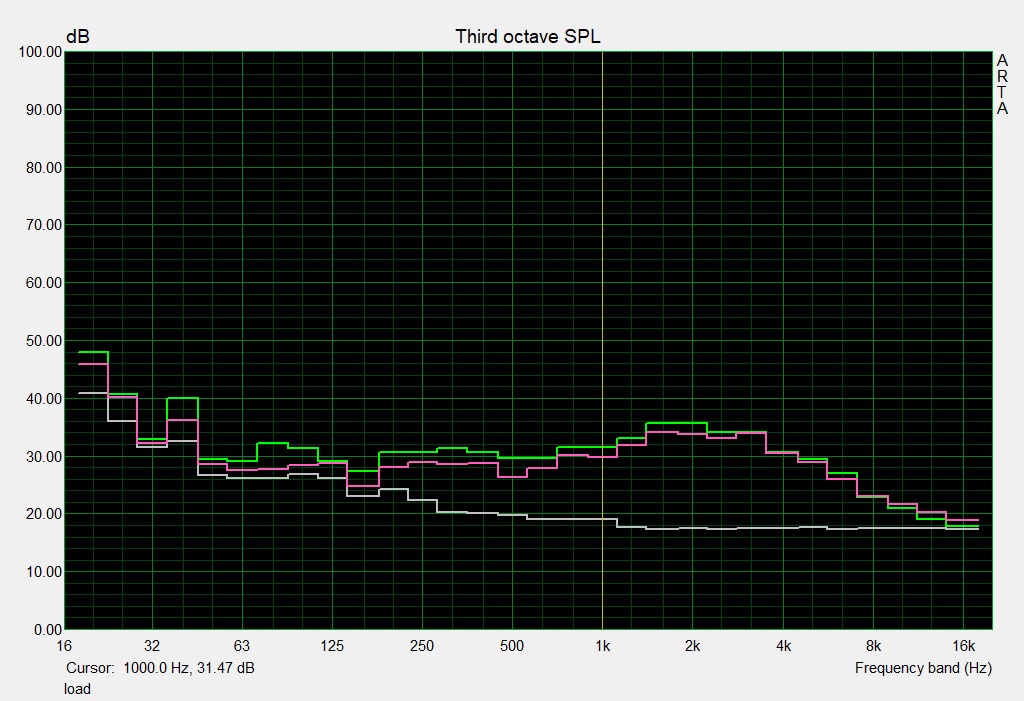
Asus ROG GU501GM-BI7N8 audio analysis
(±) | speaker loudness is average but good (74.3 dB)
Bass 100 - 315 Hz
(+) | good bass - only 3.8% away from median
(±) | linearity of bass is average (10.3% delta to prev. frequency)
Mids 400 - 2000 Hz
(+) | balanced mids - only 2.3% away from median
(+) | mids are linear (5.1% delta to prev. frequency)
Highs 2 - 16 kHz
(+) | balanced highs - only 4.6% away from median
(+) | highs are linear (6.8% delta to prev. frequency)
Overall 100 - 16.000 Hz
(+) | overall sound is linear (12.6% difference to median)
Compared to same class
» 14% of all tested devices in this class were better, 3% similar, 83% worse
» The best had a delta of 6%, average was 18%, worst was 132%
Compared to all devices tested
» 8% of all tested devices were better, 2% similar, 89% worse
» The best had a delta of 4%, average was 25%, worst was 134%
MSI GS65 8RF-019DE Stealth Thin audio analysis
(±) | speaker loudness is average but good (76 dB)
Bass 100 - 315 Hz
(-) | nearly no bass - on average 16.4% lower than median
(±) | linearity of bass is average (9.7% delta to prev. frequency)
Mids 400 - 2000 Hz
(+) | balanced mids - only 4.9% away from median
(+) | mids are linear (5.6% delta to prev. frequency)
Highs 2 - 16 kHz
(+) | balanced highs - only 2.5% away from median
(±) | linearity of highs is average (7.1% delta to prev. frequency)
Overall 100 - 16.000 Hz
(±) | linearity of overall sound is average (18.5% difference to median)
Compared to same class
» 57% of all tested devices in this class were better, 9% similar, 35% worse
» The best had a delta of 6%, average was 18%, worst was 132%
Compared to all devices tested
» 36% of all tested devices were better, 8% similar, 56% worse
» The best had a delta of 4%, average was 25%, worst was 134%
Energy Management
Power Consumption
Power draw is about average. Under full load, the machine pulls 140 Watts, which is comparable to a 2017 mid-tier device (for example, the Asus FX503VM). Under gaming load, the GU501GM needs about 133 Watts, which is about a 25% bump over last year's mid-range gaming laptops. The included 180 Watt power supply is more than enough to power the machine; peak power draw stays below 80% of what the adapter can supply.
| Off / Standby | |
| Idle | |
| Load |
|
| Asus ROG GU501GM-BI7N8 i7-8750H, GeForce GTX 1060 Mobile, Kingston RBUSNS8154P3128GJ, IPS, 1920x1080, 15.60 | Asus FX503VM-EH73 i7-7700HQ, GeForce GTX 1060 Mobile, SanDisk SD8SN8U128G1002, IPS, 1920x1080, 15.60 | MSI GS65 8RF-019DE Stealth Thin i7-8750H, GeForce GTX 1070 Max-Q, Samsung SSD PM981 MZVLB512HAJQ, IPS, 1920x1080, 15.60 | Asus Zephyrus M GM501 i7-8750H, GeForce GTX 1070 Mobile, Samsung SM961 MZVKW512HMJP m.2 PCI-e, IPS, 1920x1080, 15.60 | Gigabyte Aero 15X v8 i7-8750H, GeForce GTX 1070 Max-Q, Toshiba NVMe THNSN5512GPU7, IPS, 1920x1080, 15.60 | Aorus X5 v8 i7-8850H, GeForce GTX 1070 Mobile, Toshiba NVMe THNSN5512GPU7, IPS, 1920x1080, 15.60 | Acer Predator Triton 700 i7-7700HQ, GeForce GTX 1080 Max-Q, 2x SK Hynix Canvas SC300 512GB M.2 (HFS512G39MND) (RAID 0), IPS, 1920x1080, 15.60 | |
|---|---|---|---|---|---|---|---|
| Power Consumption | 15% | 13% | -20% | -3% | -52% | -55% | |
| Idle Minimum * | 12.35 | 12.8 -4% | 7 43% | 16 -30% | 14 -13% | 25 -102% | 28 -127% |
| Idle Average * | 19.98 | 15.4 23% | 11 45% | 19 5% | 18 10% | 31 -55% | 33 -65% |
| Idle Maximum * | 25.44 | 15.9 37% | 20 21% | 26 -2% | 22 14% | 33 -30% | 41 -61% |
| Load Average * | 94.28 | 78 17% | 98 -4% | 103 -9% | 91 3% | 102 -8% | 94 -0% |
| Witcher 3 ultra * | 132.9 | 107.3 19% | 132 1% | 164 -23% | 142 -7% | 194 -46% | 160 -20% |
| Load Maximum * | 140.63 | 143.4 -2% | 182 -29% | 223 -59% | 173 -23% | 239 -70% | 222 -58% |
* ... smaller is better
Battery Life
Battery life is a weak spot. We would chalk this up to the device being gaming-centric in the past, but recent devices like the Aero 15x and GS65 have shown us that competent thin-and-light gaming laptops can still be marathon runners. The GU501GM lasts only 4 hours in our WiFi v1.3 test, which is a far cry from the GS65's 6 hours and the Aero 15x's 8.5 hours. This is partly due to the smaller battery in the GU501GM, which is only 55 Watt-hours. That said, the GU501GM does beat the Zephyrus M by a healthy 76 minute lead in the same test. Under load, the GU501GM only lasts 45 minutes. All said, you'll need to bring the power brick when working/gaming away from home. The device uses Nvidia's Optimus to disable the GTX 1060 under lighter loads.
| Asus ROG GU501GM-BI7N8 i7-8750H, GeForce GTX 1060 Mobile, 55 Wh | MSI GS65 8RF-019DE Stealth Thin i7-8750H, GeForce GTX 1070 Max-Q, 82 Wh | Asus Zephyrus M GM501 i7-8750H, GeForce GTX 1070 Mobile, 55 Wh | Gigabyte Aero 15X v8 i7-8750H, GeForce GTX 1070 Max-Q, 94.24 Wh | Aorus X5 v8 i7-8850H, GeForce GTX 1070 Mobile, 92.24 Wh | Acer Predator Triton 700 i7-7700HQ, GeForce GTX 1080 Max-Q, 54 Wh | |
|---|---|---|---|---|---|---|
| Battery Runtime | 73% | 4% | 181% | 51% | -10% | |
| Reader / Idle | 271 | 507 87% | 237 -13% | 762 181% | 294 8% | 150 -45% |
| WiFi v1.3 | 240 | 362 51% | 164 -32% | 513 114% | 144 -40% | |
| Load | 45 | 81 80% | 70 56% | 156 247% | 87 93% | 70 56% |
Pros
Cons
Verdict
The GU501GM aims to bring the best of the Zephyrus M into a lower price bracket. For the most part, it succeeds. The same sleek, premium case (sans the elegant hinge mechanism on the bottom panel) makes the transition, as do the keyboard, speakers, and top-of-the-line Corei7-8750H.
Unfortunately, this CPU proves to be somewhat of a mixed bag. The improved performance is greatly appreciated in most tasks, although the CPU cannot seem to hold steady under computational stress. The fans are another point of annoyance; their high-pitch grates on the ears when gaming. On the plus side, there are mitigations for these issues. Though the system crashes under CPU strain, all other workloads are well handled. The different fan modes help to control fan noise at the cost of higher heat and lower performance.
All said, there is little to dislike about the GU501GM, but considering the price, there's little reason beyond aesthetics to consider a purchase. At its MSRP of $1900, the GU501GM is simply too expensive to be feasible; there are other beautifully crafted devices with similar specifications for less (Asus' own Strix line comes to mind). For the same price or a bit more, users could upgrade to more powerful hardware and a better overall package, like those offered by Gigabyte's Aero 15x or the MSI GS65 Stealth Thin. Even at the current sales price of $1500, it's hard to recommend the GU501GM over other like machines.
The GU501GM is simply a luxury item. While the case is beautiful and the machine is a competent mid-range gaming laptop, it is overpriced. Only those that put design above all other factors should consider purchasing the GU501GM; even then, there are better options out there.
Asus ROG GU501GM-BI7N8
-
07/07/2018 v6(old)
Sam Medley
Pricecompare
