 Deutsch
 English
 Español
 Français
 Italiano
 Nederlands
 Polski
 Português
 Русский
 Türkçe
 Svenska
 Chinese
 Magyar
Aorus 7 KB in review: Well-rounded gaming laptop with upgrade options
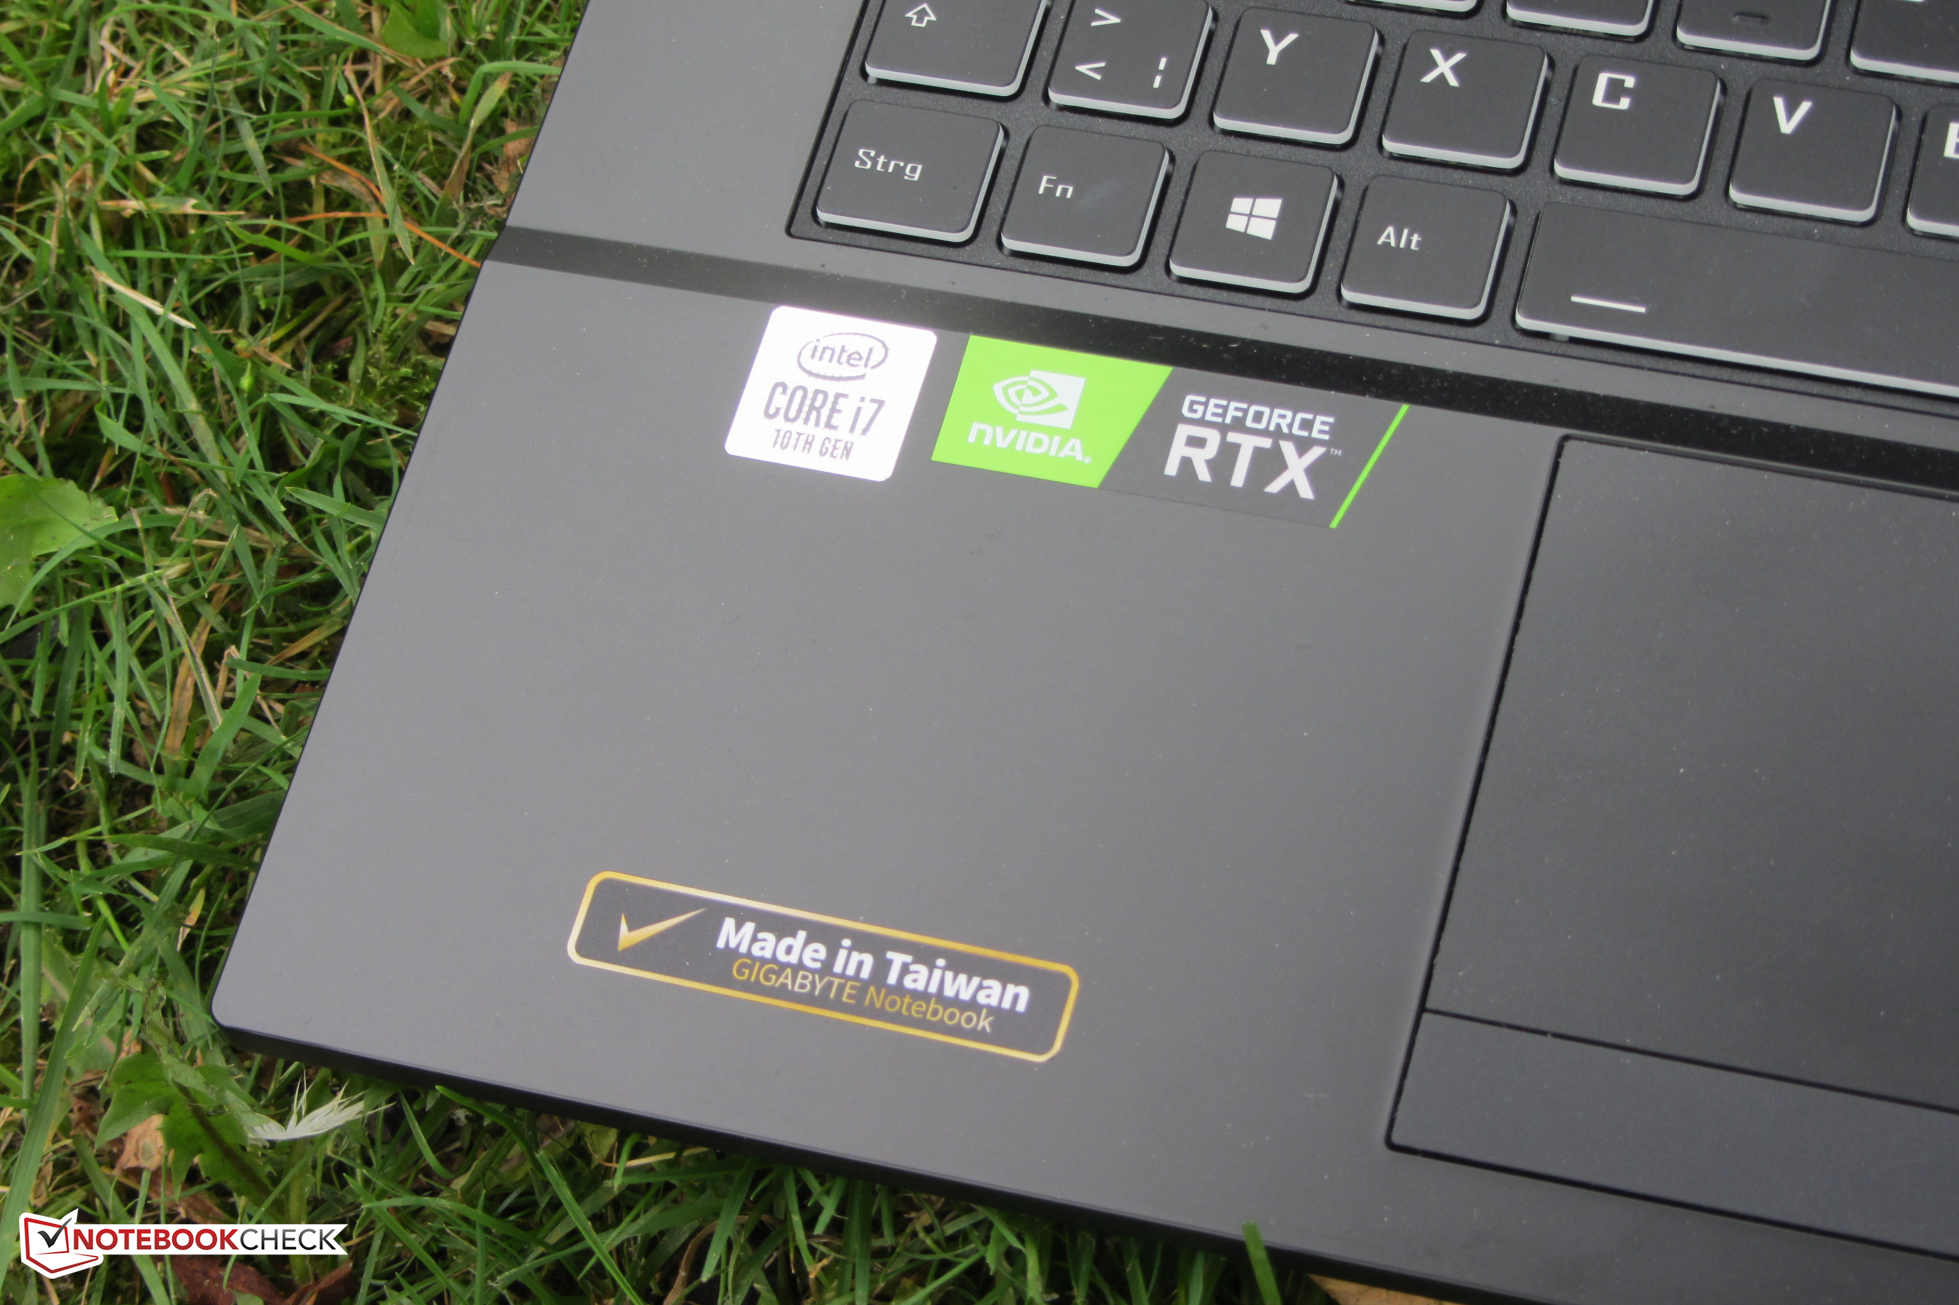
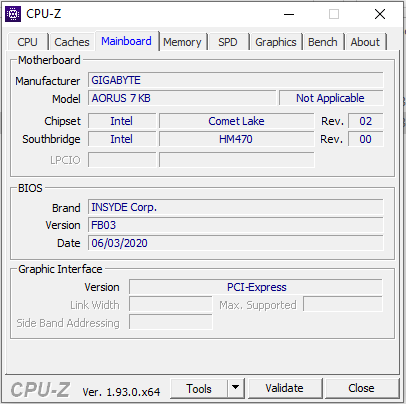
The Aorus 7 KB is a gaming laptop in the 17.3-inch format. A Core i7-10750H processor and a GeForce RTX 2060 GPU are on board. The device isn't an in-house development made by Gigabyte but is based on a barebone from Clevo instead. Compared to the 7 KB, the Nexoc GH7 716IG features an identical construction. Furthermore, competitors include devices like the MSI GE75 Raider 10SE, the Nexoc GH7 716IG, the MSI Bravo 17 A4DDR, the Asus TUF A17 FA706IU, the Lenovo Legion Y740-17IRH, and the Acer Nitro 5 AN517-52.
Rating | Date | Model | Weight | Height | Size | Resolution | Best Price |
|---|---|---|---|---|---|---|---|
| 81.6 % | 10/2020 | Aorus 7 KB i7-10750H, GeForce RTX 2060 Mobile | 2.5 kg | 29 mm | 17.30" | 1920x1080 | |
| 85.1 % | 07/2020 | MSI GE75 Raider 10SE-008US i7-10750H, GeForce RTX 2060 Mobile | 2.6 kg | 27.5 mm | 17.30" | 1920x1080 | |
| 81.5 % | 09/2020 | Nexoc GH7 716IG i7-10750H, GeForce GTX 1660 Ti Mobile | 2.5 kg | 29.5 mm | 17.30" | 1920x1080 | |
| 80.9 % | 07/2020 | MSI Bravo 17 A4DDR R7 4800H, Radeon RX 5500M | 2.2 kg | 23 mm | 17.30" | 1920x1080 | |
| 82.9 % | 05/2020 | Asus TUF A17 FA706IU-AS76 R7 4800H, GeForce GTX 1660 Ti Mobile | 2.6 kg | 26 mm | 17.30" | 1920x1080 | |
| 83.2 % | 10/2019 | Lenovo Legion Y740-17IRH i7-9750H, GeForce RTX 2060 Mobile | 3 kg | 23 mm | 17.30" | 1920x1080 | |
| 80.6 % | 06/2020 | Acer Nitro 5 AN517-52-77DS i7-10750H, GeForce RTX 2060 Mobile | 2.2 kg | 24.9 mm | 17.30" | 1920x1080 |
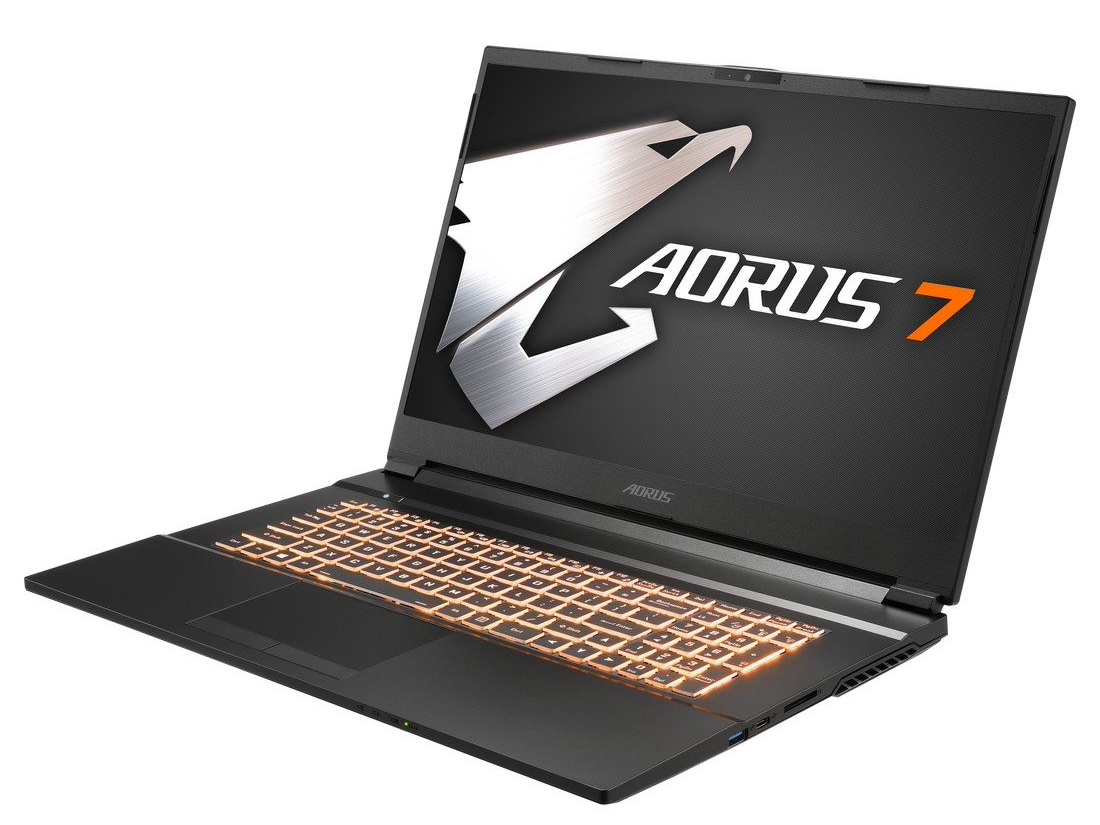
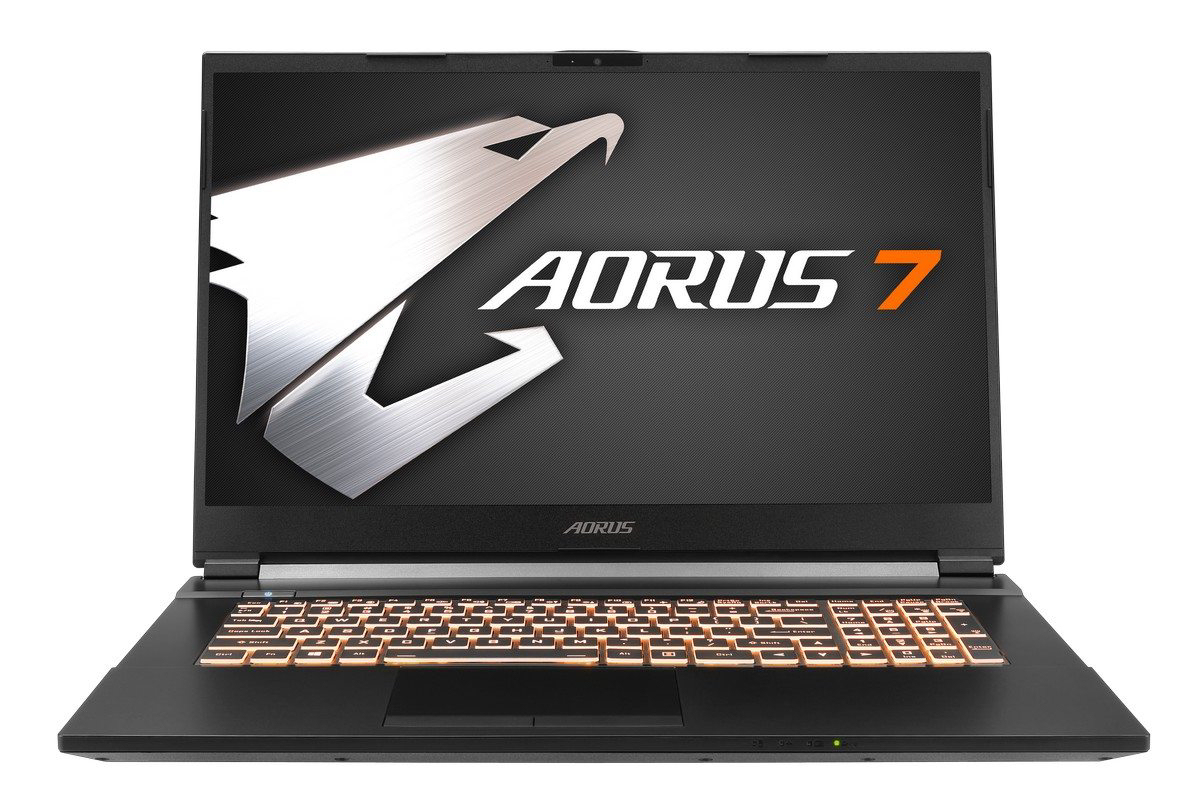
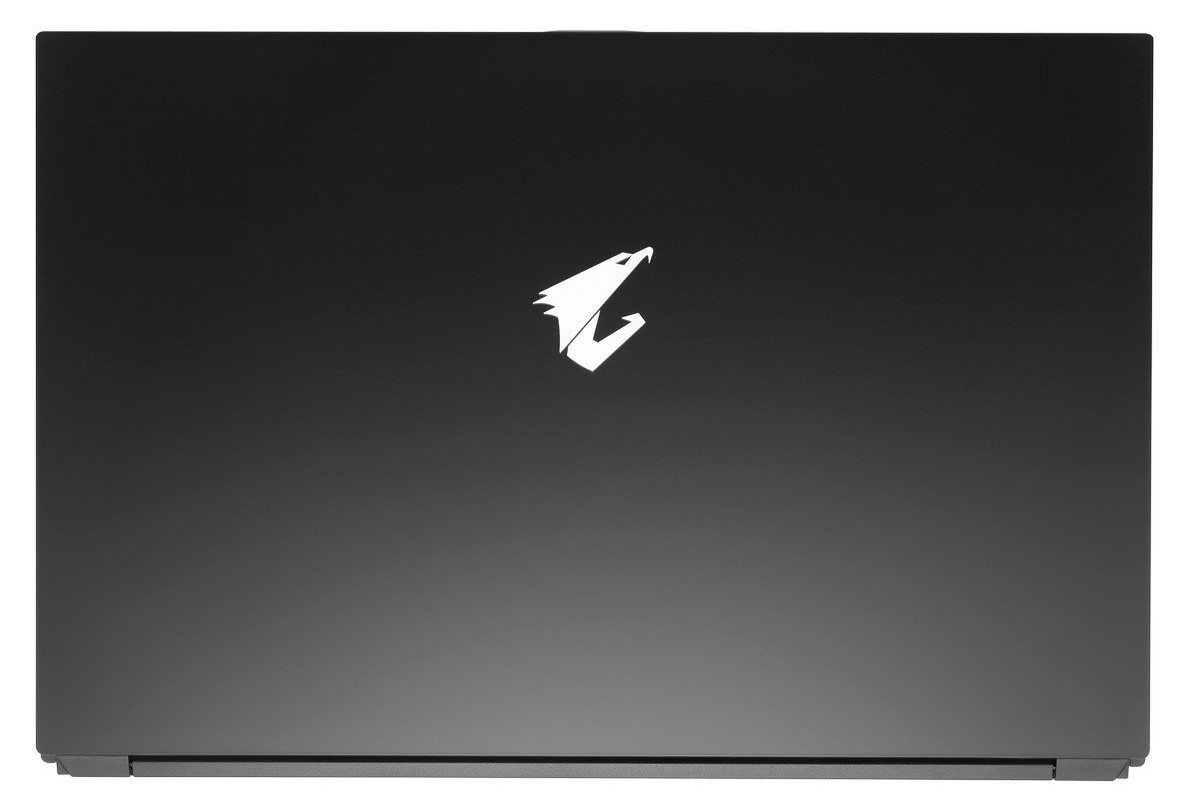
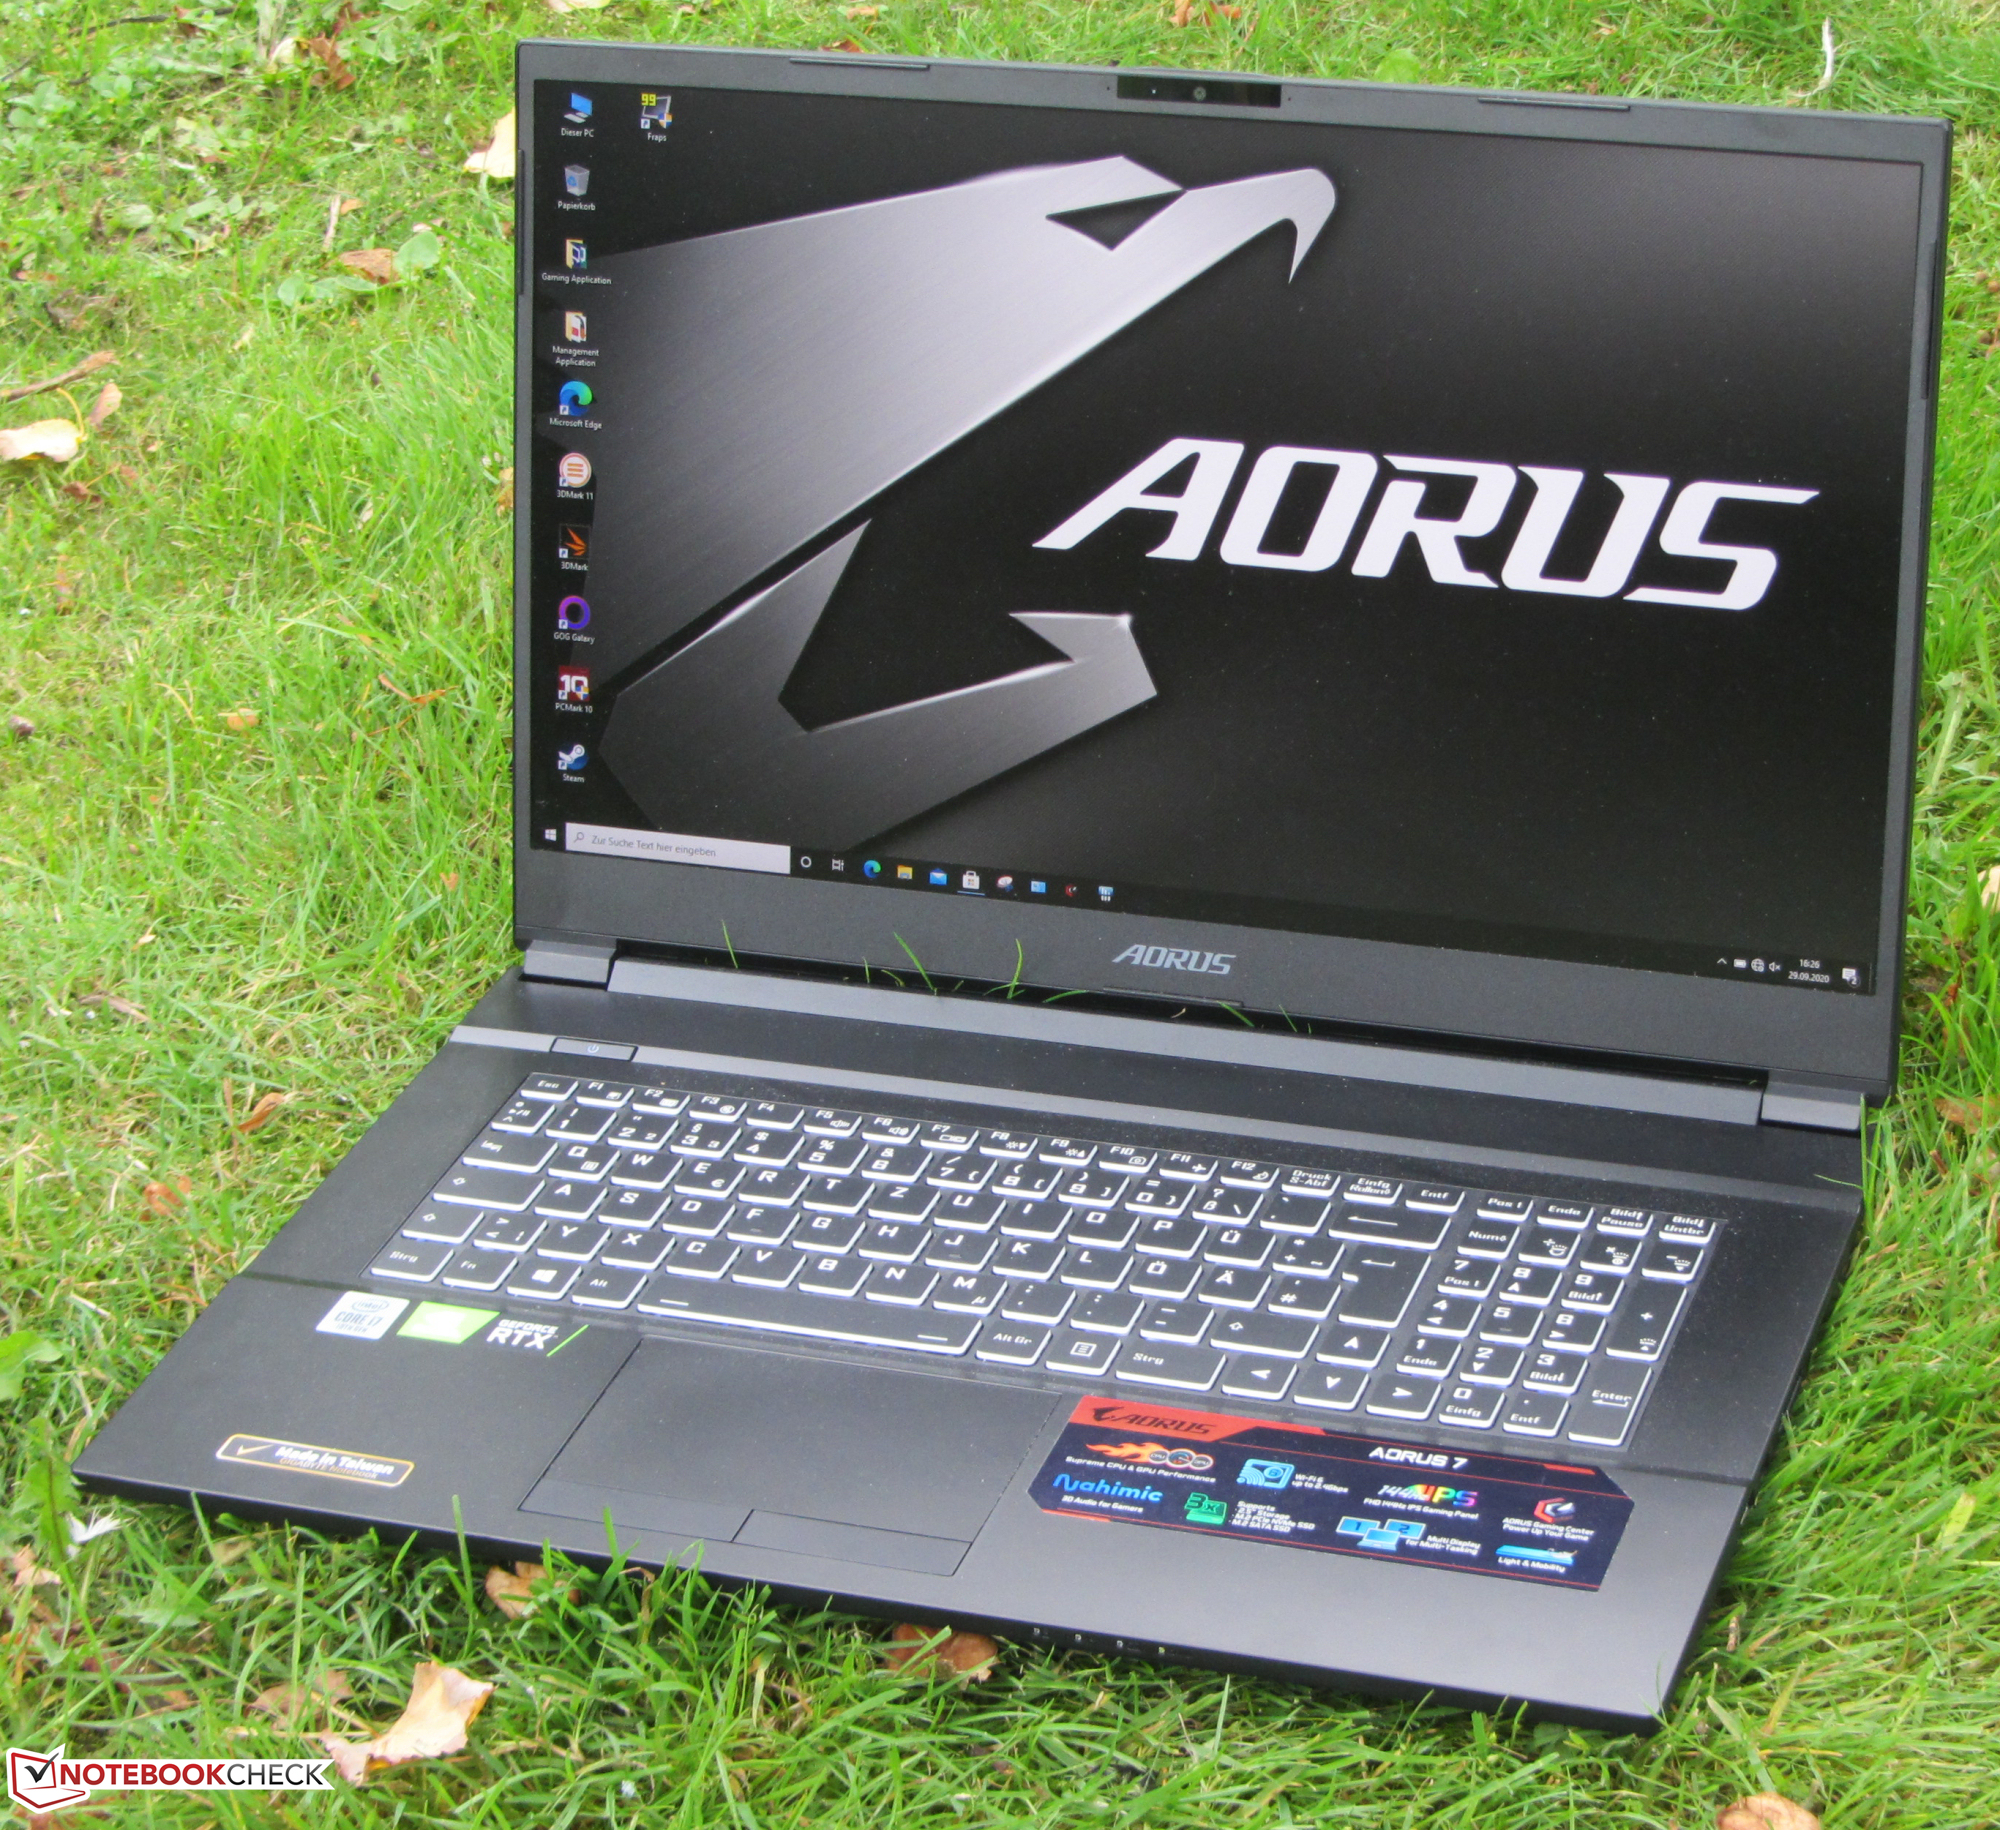
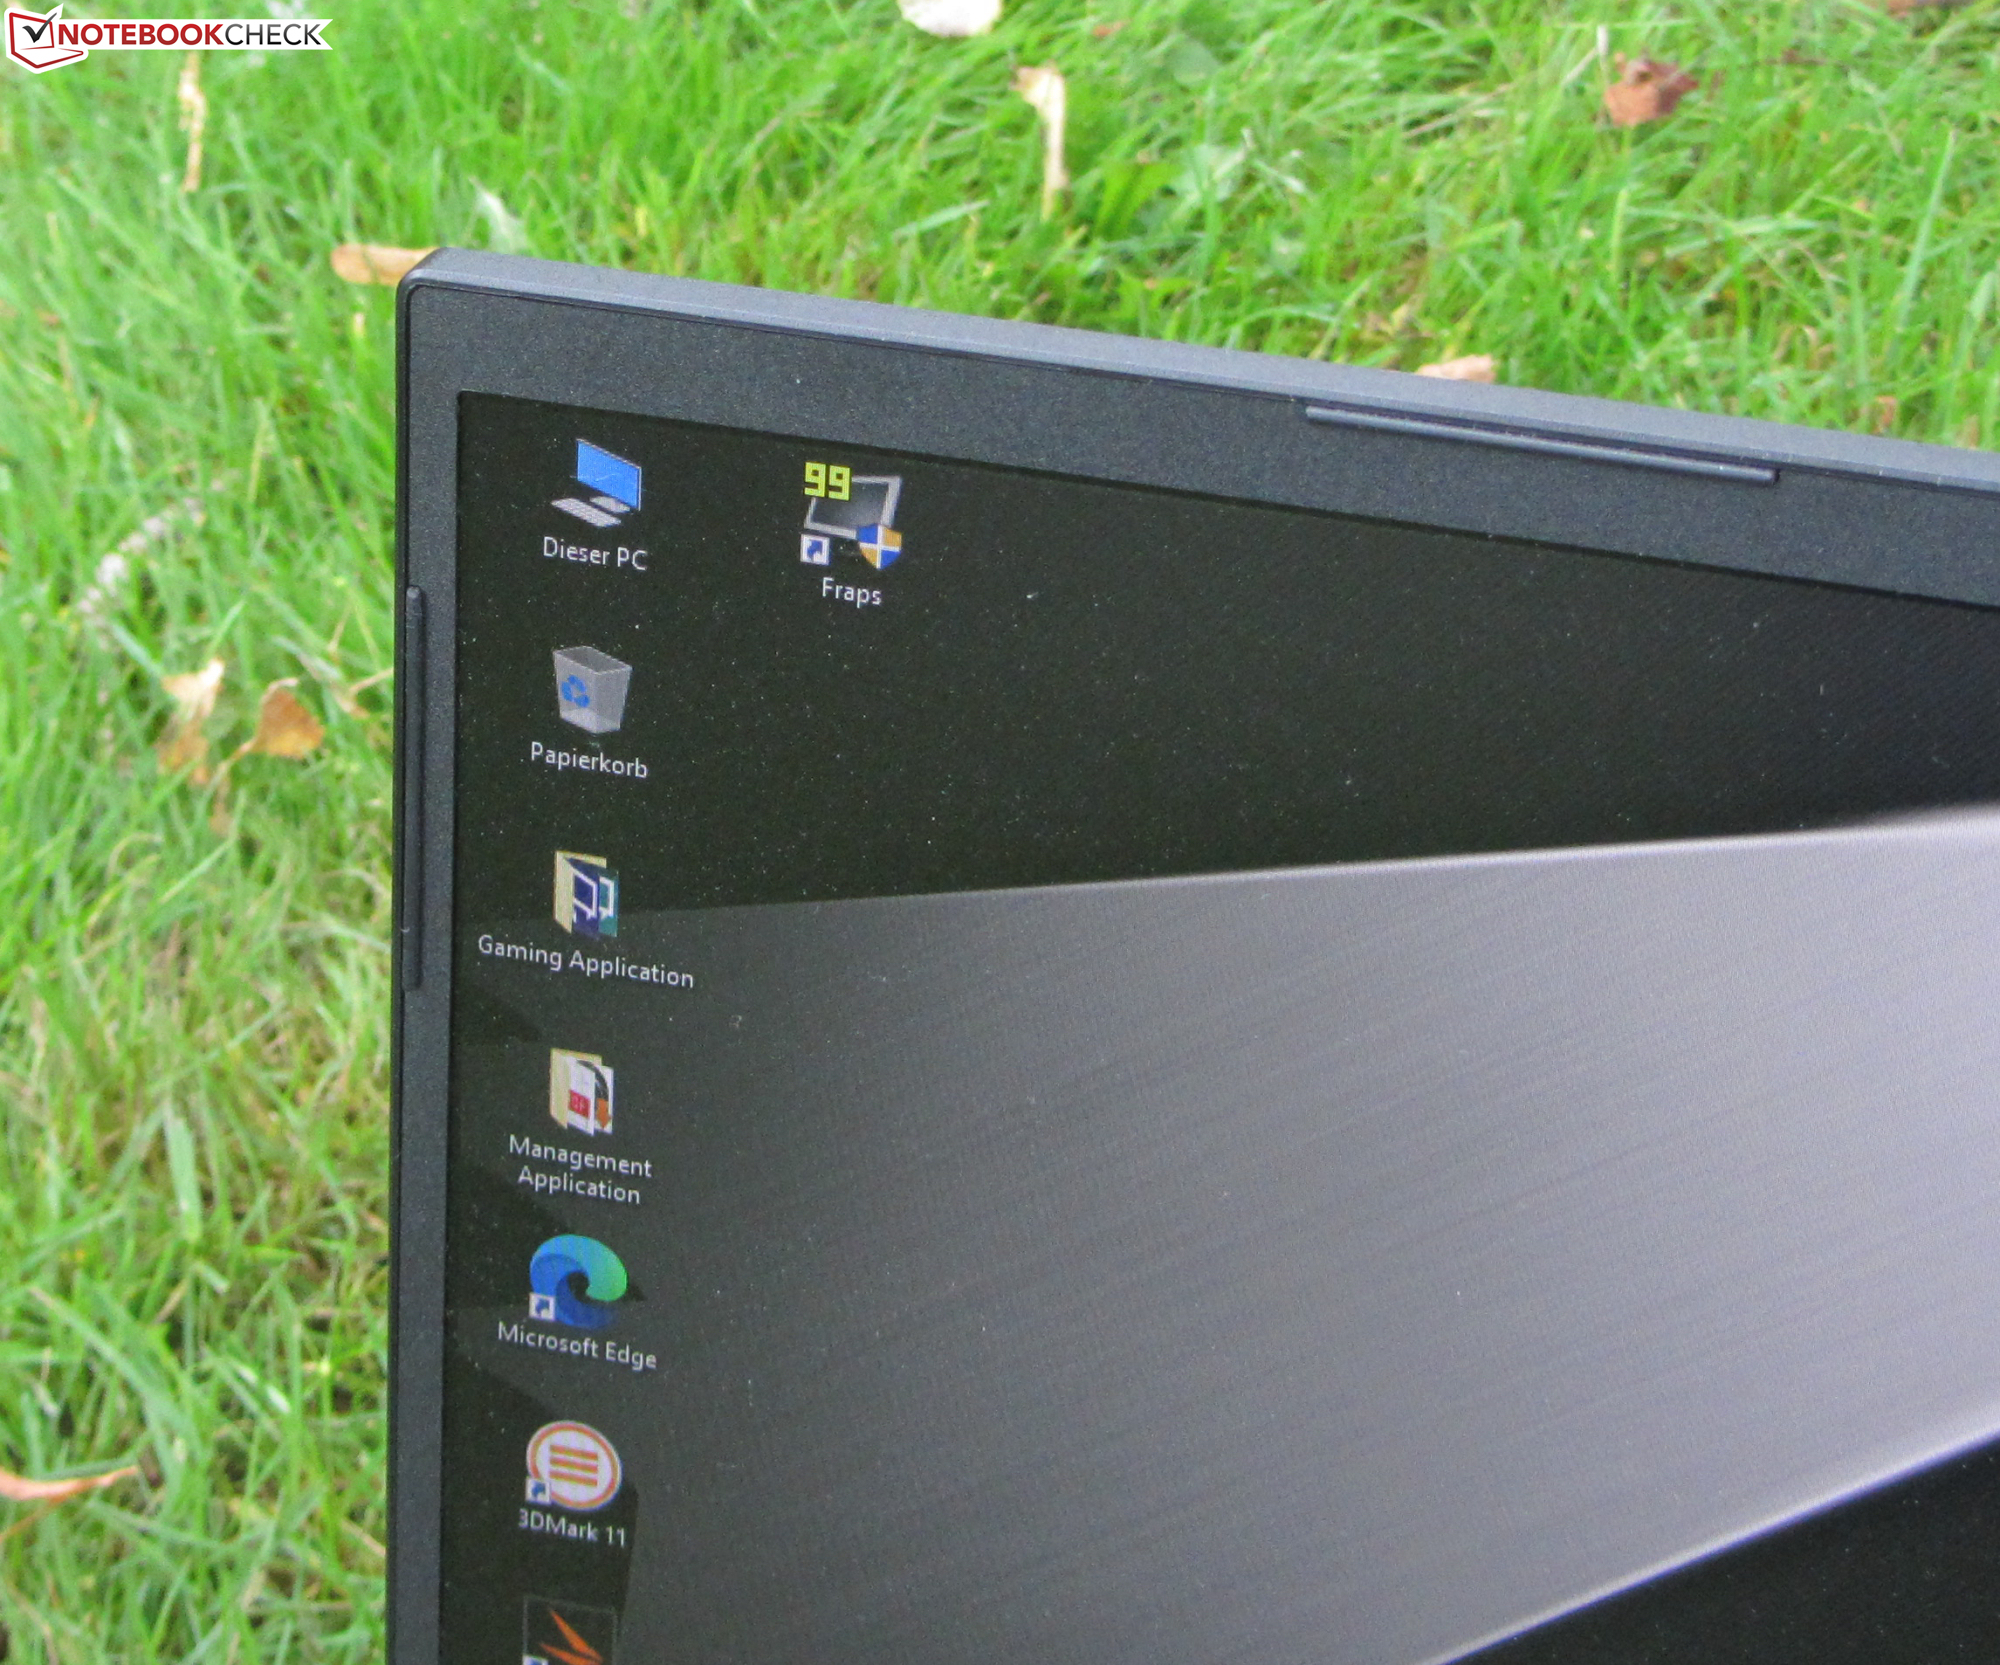
Case - Gigabyte chooses black plastic
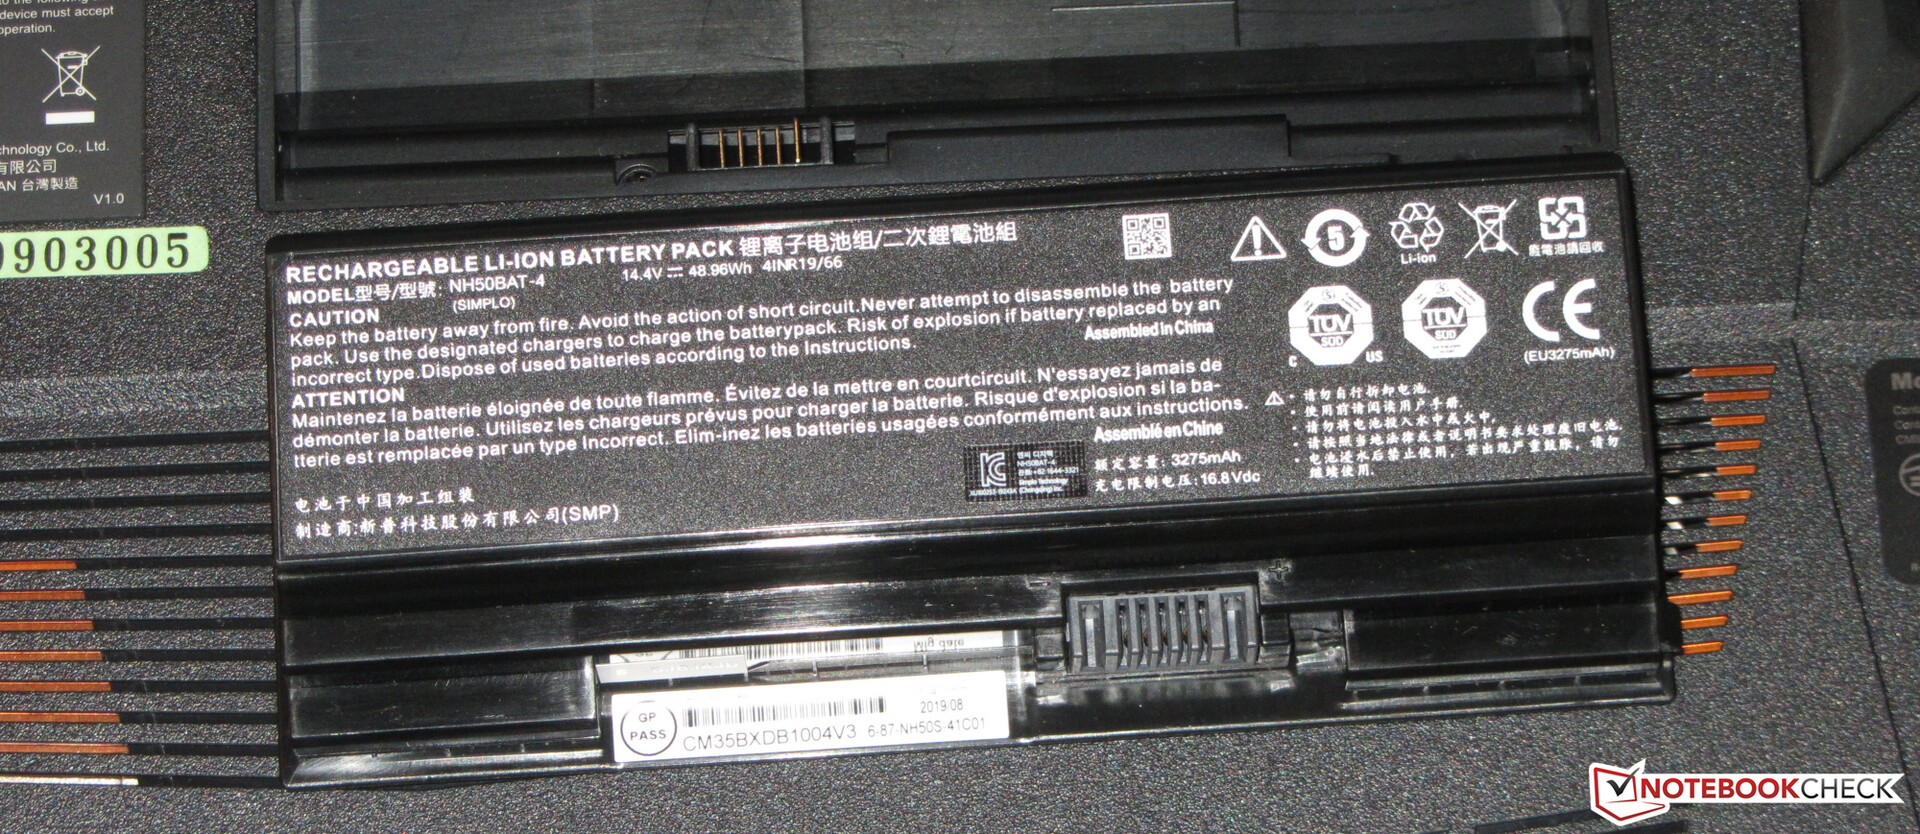
With the Aorus 7 KB, Gigabyte has gone with a black plastic case featuring an external appearance that can be described as sober and boring. The back of the lid and the top of the base unit have smooth, matte-gloss surfaces. In addition, the surfaces of the bottom cover and the display frame are roughened. The battery is not firmly installed and can be removed at any time without issues. The gaming laptop doesn't have a maintenance hatch. In order to get to the inside, the bottom cover needs to be removed. More about this later.
The case is well made. The gap dimensions are in order, and sharp edges are not noticeable. The base unit can only be twisted a bit, but the lid can be twisted much more. Pressure on the back of the lid doesn't cause any changes in the image. Moreover, the hinges hold the lid firmly in position and hardly allow it to wobble. The maximum aperture angle is about 135°, and opening the lid with one hand is possible.
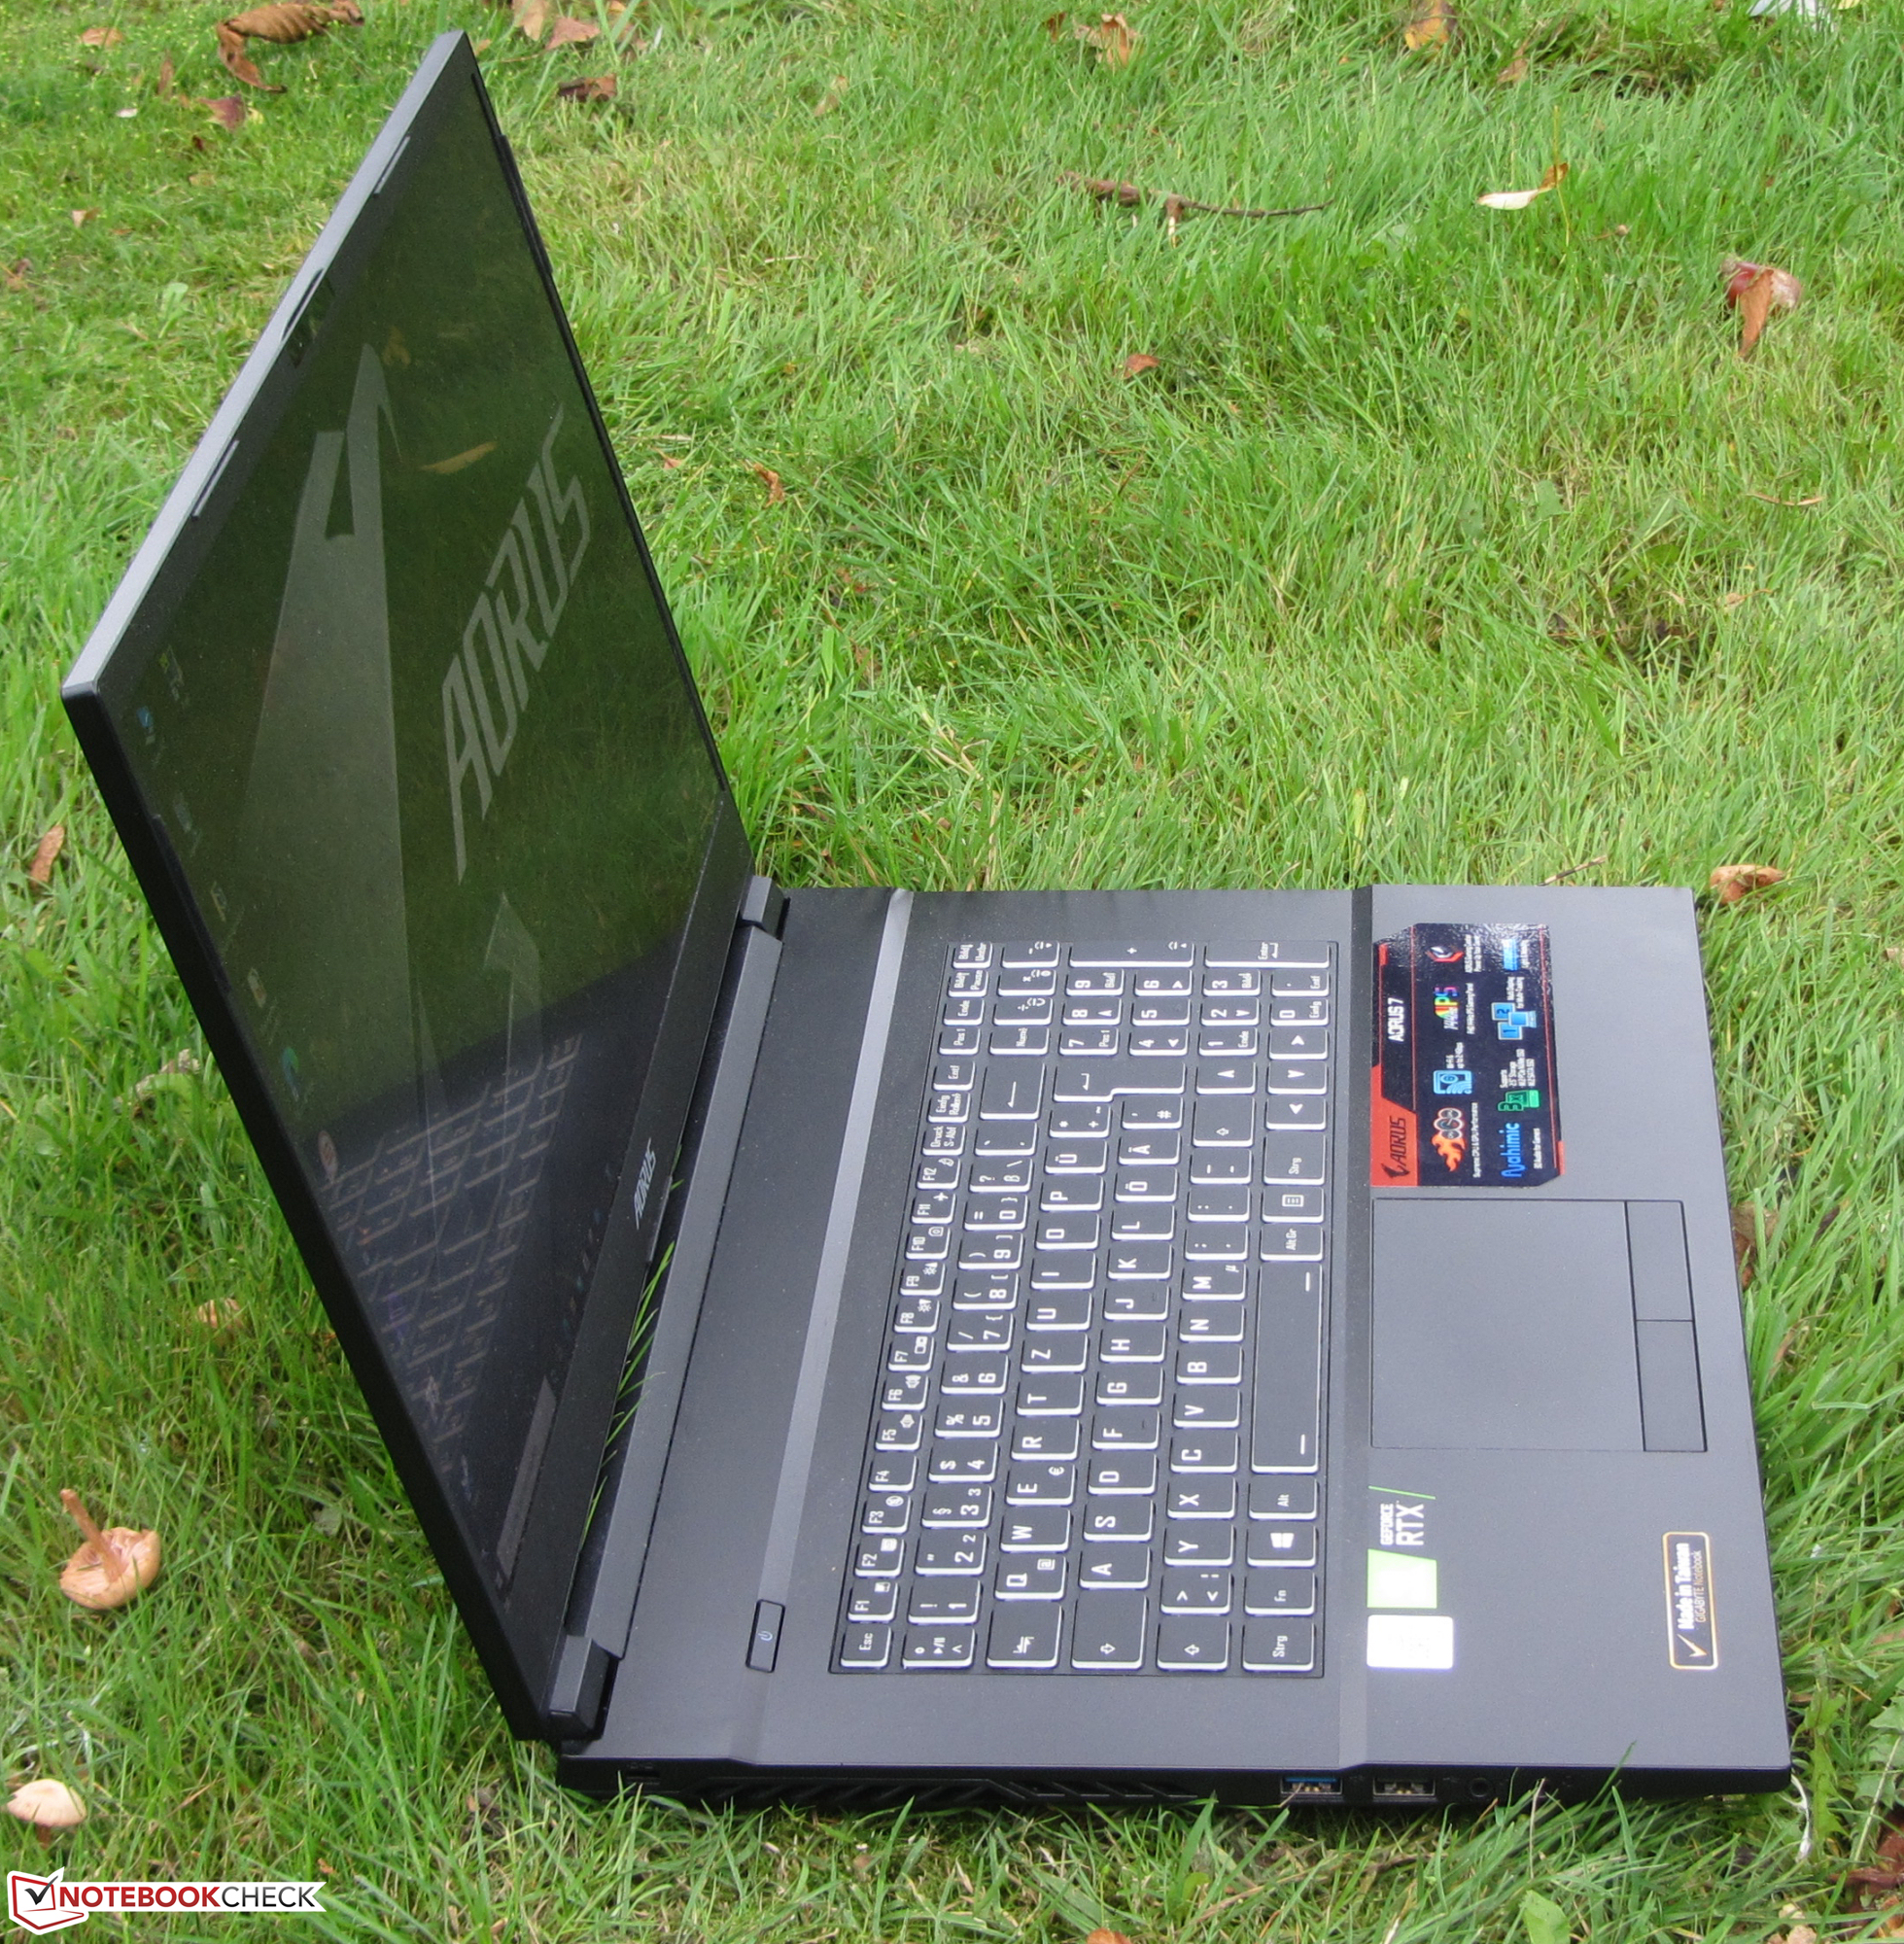
In terms of weight and footprint, the 7 KB is largely on par with most competitors.
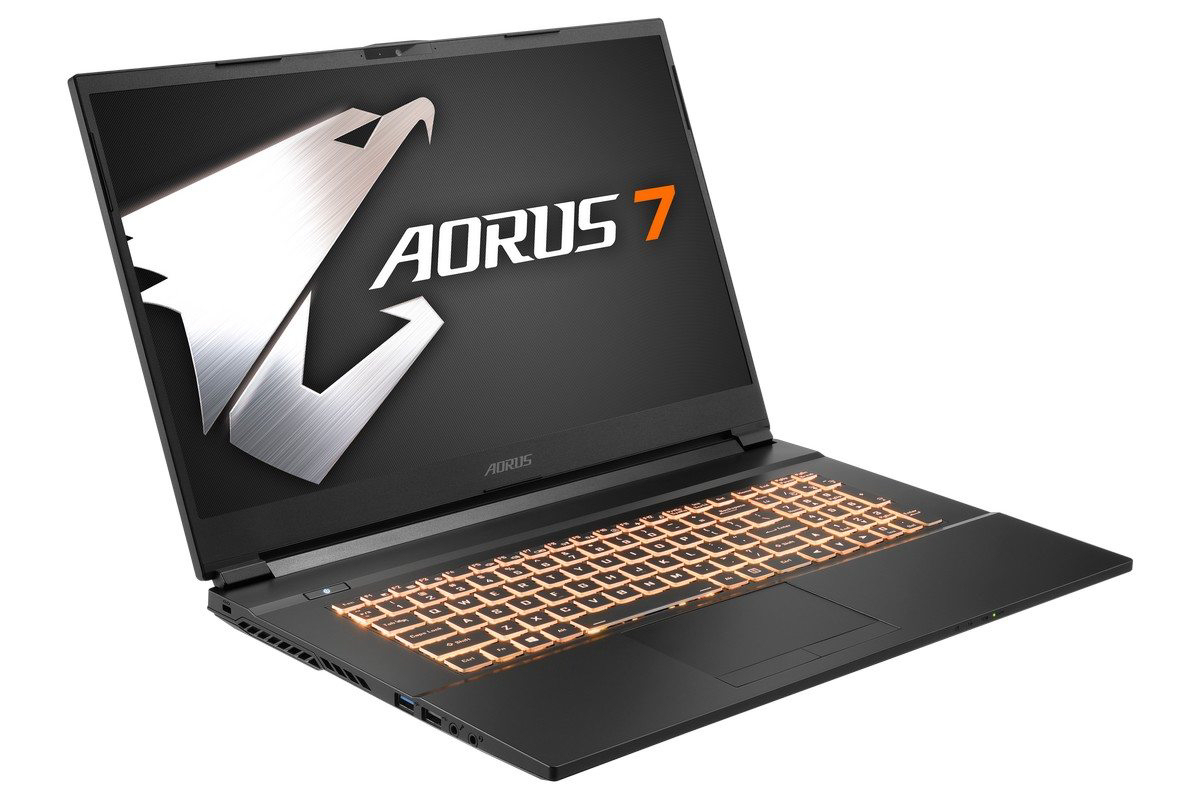
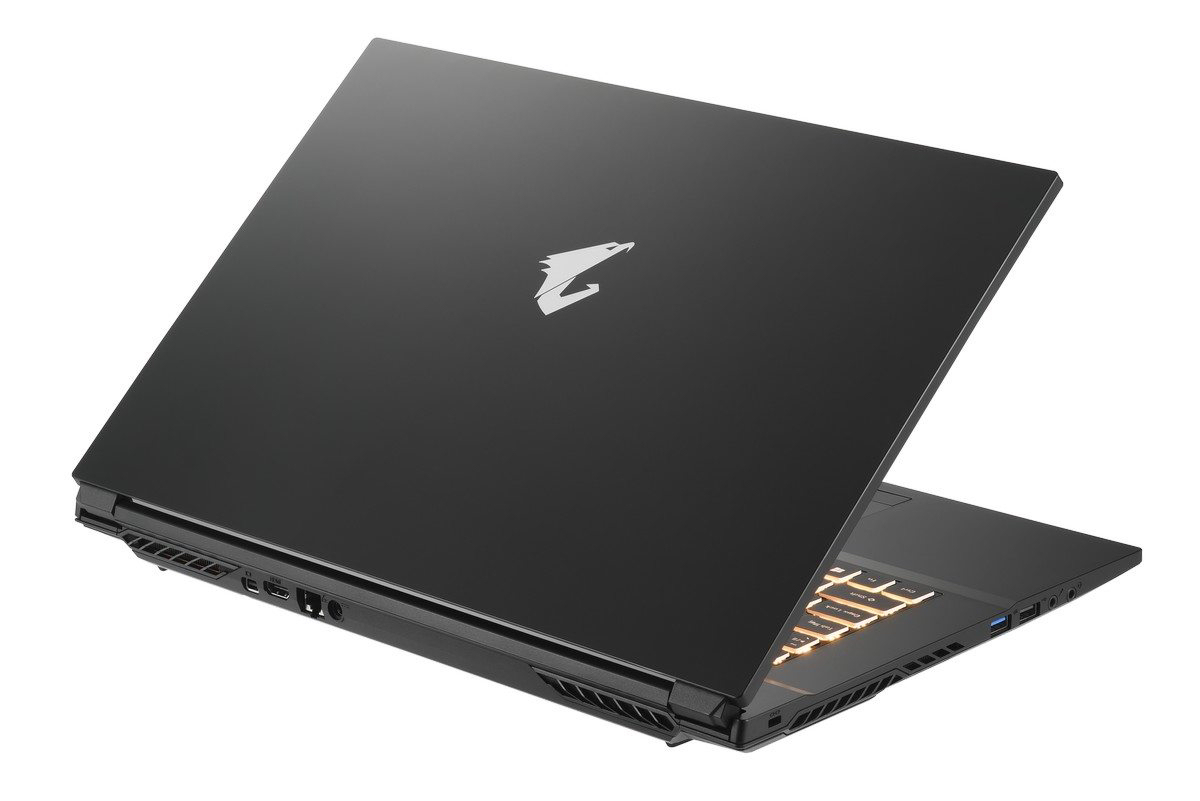
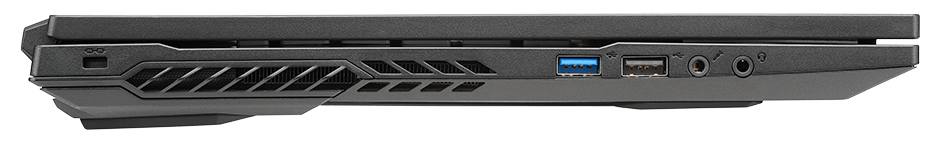
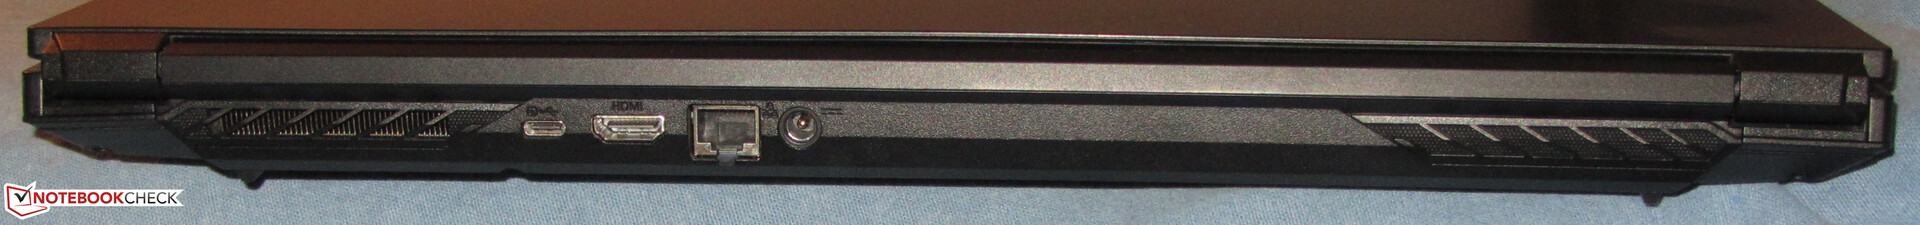
Connectivity - The 7 KB offers three video outputs
The connections of the Aorus laptop are distributed on three sides. The device comes with a total of three USB Type-A USB ports (1x USB 2.0, 1x USB 3.2 Gen 1, 1x USB 3.2 Gen 2). The USB Type-C port (USB 3.2 Gen 2) supports the DisplayPort function. As a result, the laptop has three video outputs together with the HDMI connection and the Mini DisplayPort. In addition, there's a Gigabit Ethernet port and two audio connections (combo audio, microphone input).
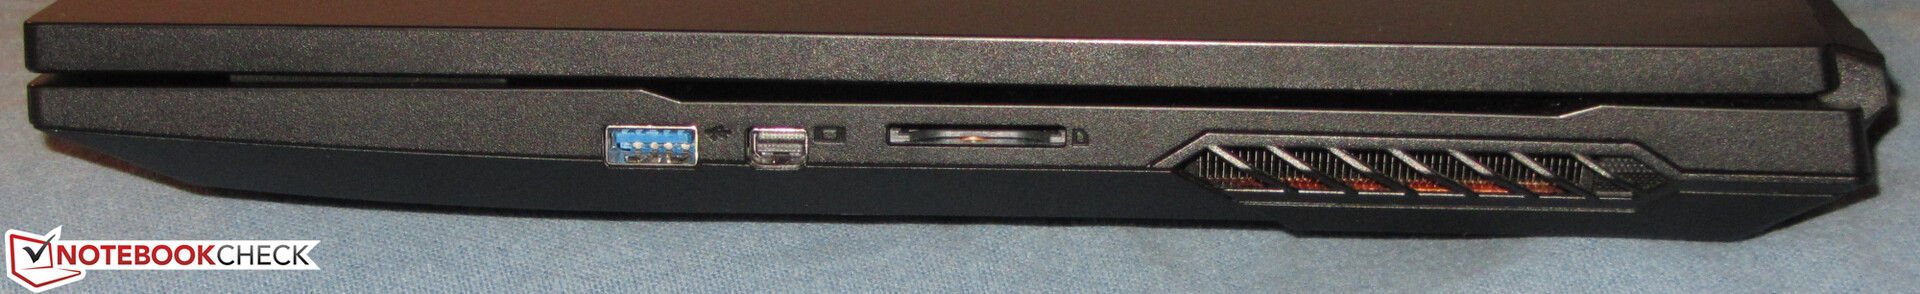
SD card reader
SD cards fit completely into the memory card reader. With transfer rates of 86 MB/s (copying of large data blocks) and 81 MB/s (transferring 250 jpg image files of about 5 MB each), the model installed here is one of the faster representatives of its kind. We test memory card readers using a reference card (Toshiba Exceria Pro SDXC 64 GB UHS-II).
| SD Card Reader | |
| average JPG Copy Test (av. of 3 runs) | |
| Average of class Gaming (19 - 202, n=100, last 2 years) | |
| Nexoc GH7 716IG (Toshiba Exceria Pro SDXC 64 GB UHS-II) | |
| Aorus 7 KB (Toshiba Exceria Pro SDXC 64 GB UHS-II) | |
| MSI GE75 Raider 10SE-008US (Toshiba Exceria Pro SDXC 64 GB UHS-II) | |
| maximum AS SSD Seq Read Test (1GB) | |
| Average of class Gaming (26 - 269, n=93, last 2 years) | |
| Nexoc GH7 716IG (Toshiba Exceria Pro SDXC 64 GB UHS-II) | |
| Aorus 7 KB (Toshiba Exceria Pro SDXC 64 GB UHS-II) | |
| MSI GE75 Raider 10SE-008US (Toshiba Exceria Pro SDXC 64 GB UHS-II) | |
Communication
The WLAN chip (Intel Wi-Fi 6 AX200) supports the WLAN 802.11a/b/g/n/ac/ax standards. The transmission speeds determined under optimal conditions (no other WLAN devices nearby, short distance between laptop and server PC) are excellent. Wired network connections are handled by a member of Realtek's well-known RTL8168/8111 family, and it carries out its tasks smoothly.
Webcam
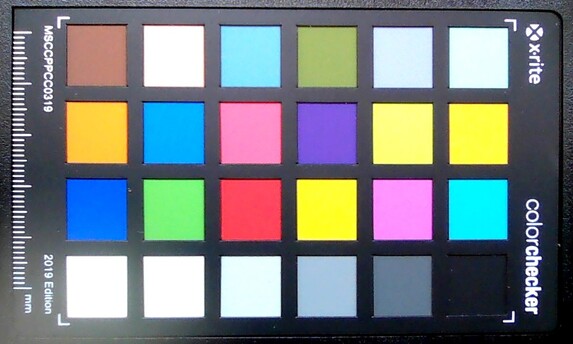
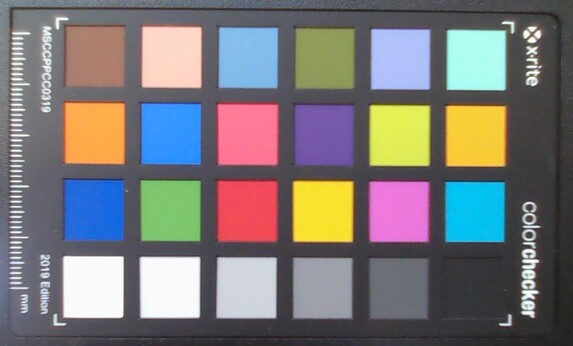
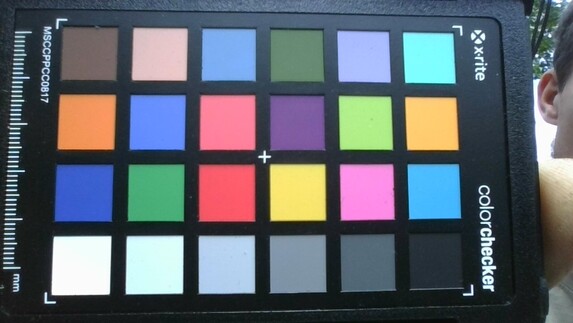
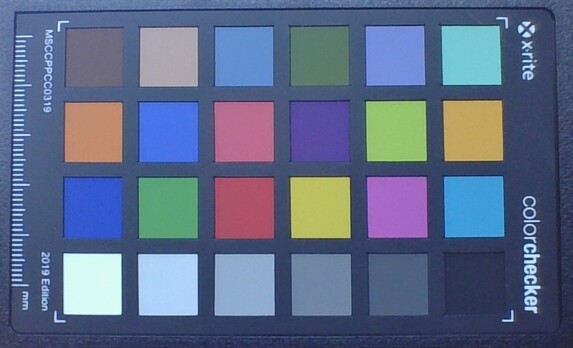
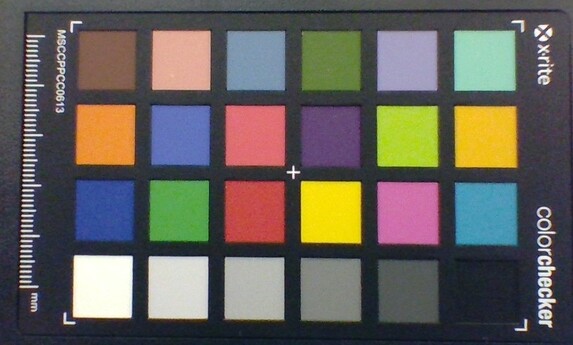
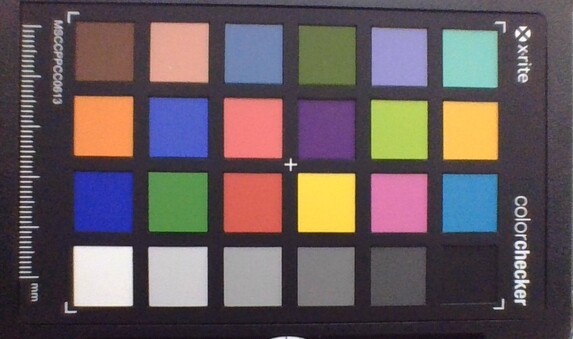
The webcam (0.9 MP) of the Aorus laptop produces images with a maximum resolution of 1280x720 pixels. The color accuracy is not convincing. With a color deviation of almost 23, the target (Delta E less than 3) is clearly missed.


")
")
Accessories
In addition to the usual documents (quick-start guide, warranty information), the laptop comes with a thermal pad for a second M.2 SSD and two screws. The latter are intended for connecting the 2.5-inch mounting frame (found inside the laptop) to an appropriate storage drive.
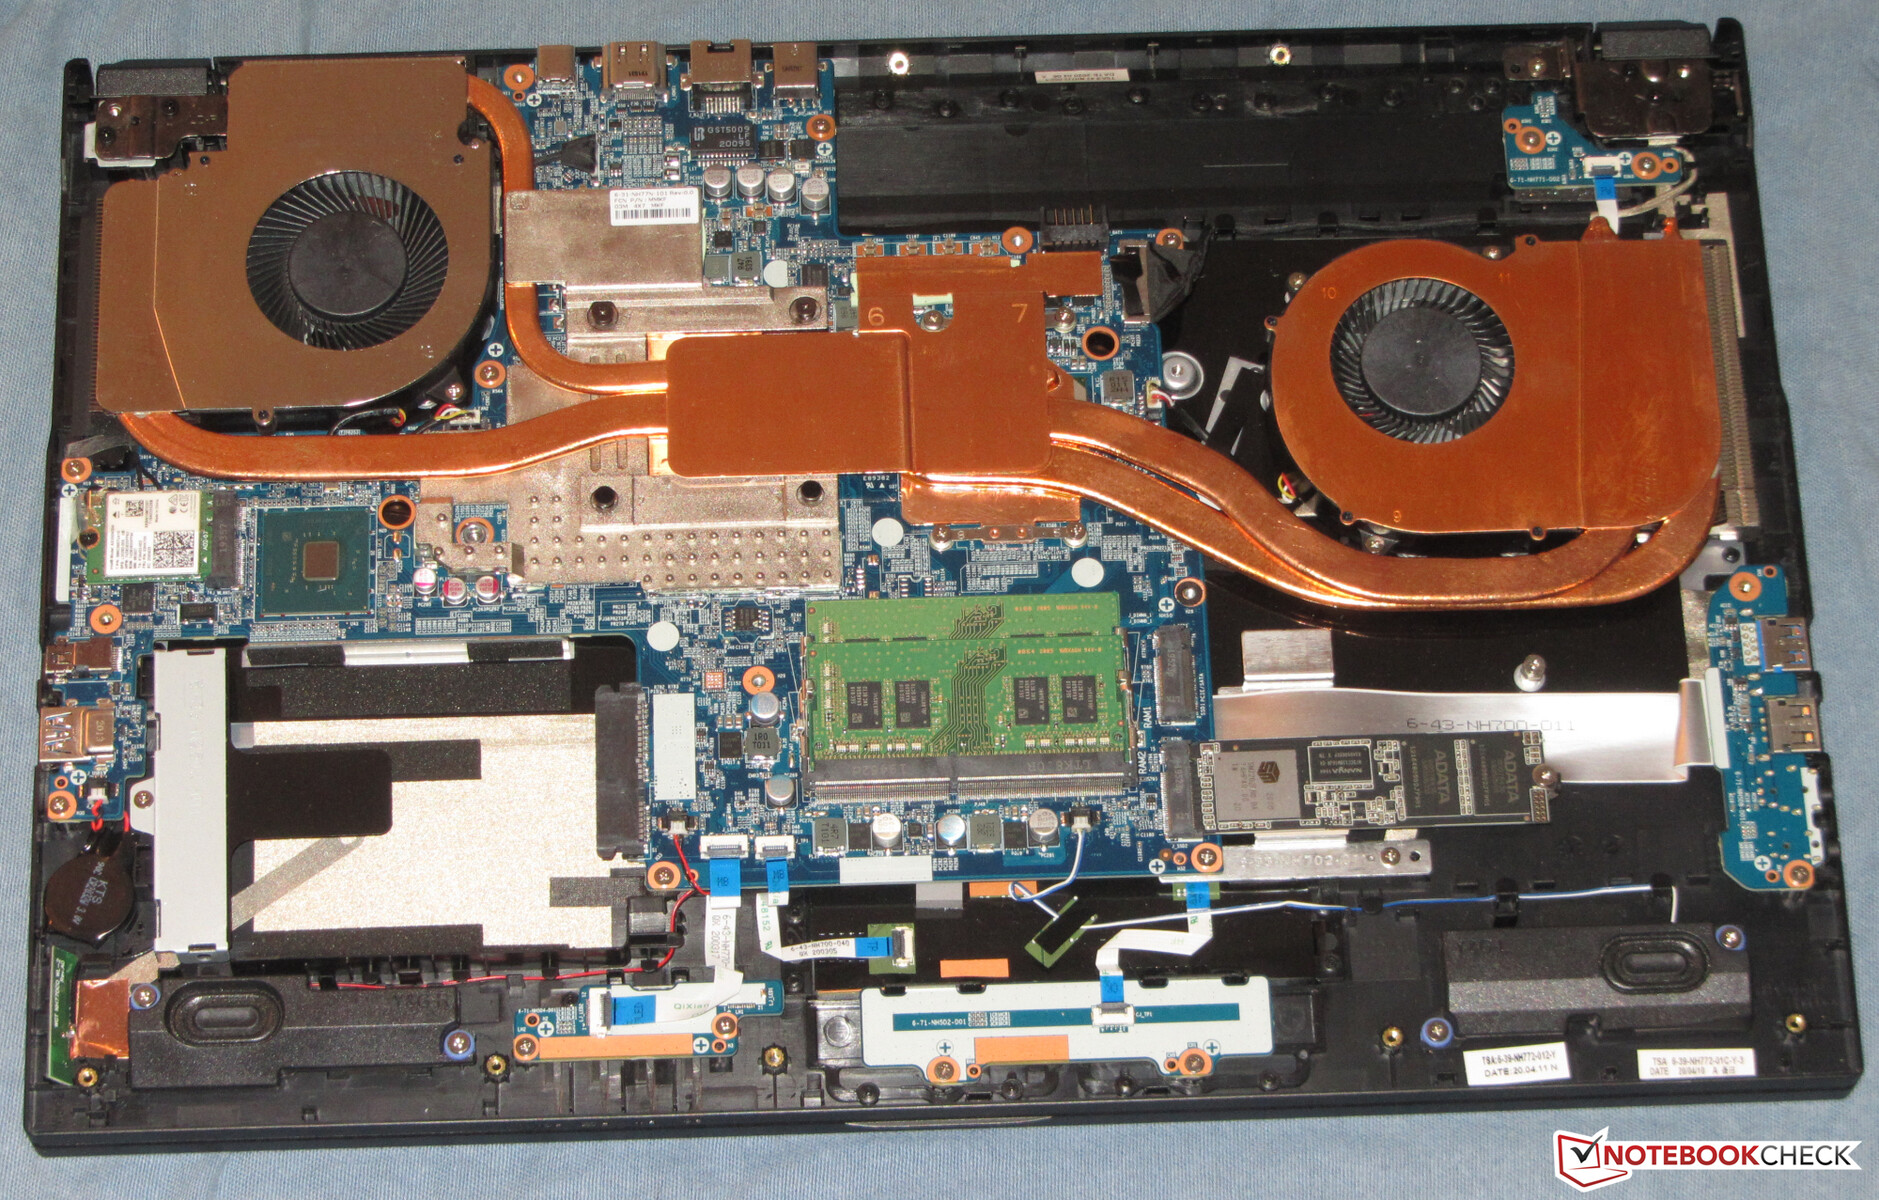
Maintenance
There is no maintenance hatch. The inside can be accessed after removing the bottom cover. For this purpose, all screws on the bottom side of the device are removed. Note: The battery compartment also contains screws that need to be removed! Afterwards, the bottom cover can be lifted with the help of a flat spatula. It sits quite tightly in its place.
Warranty
Gigabyte grants the laptop a two-year warranty. We couldn't find any warranty extensions.
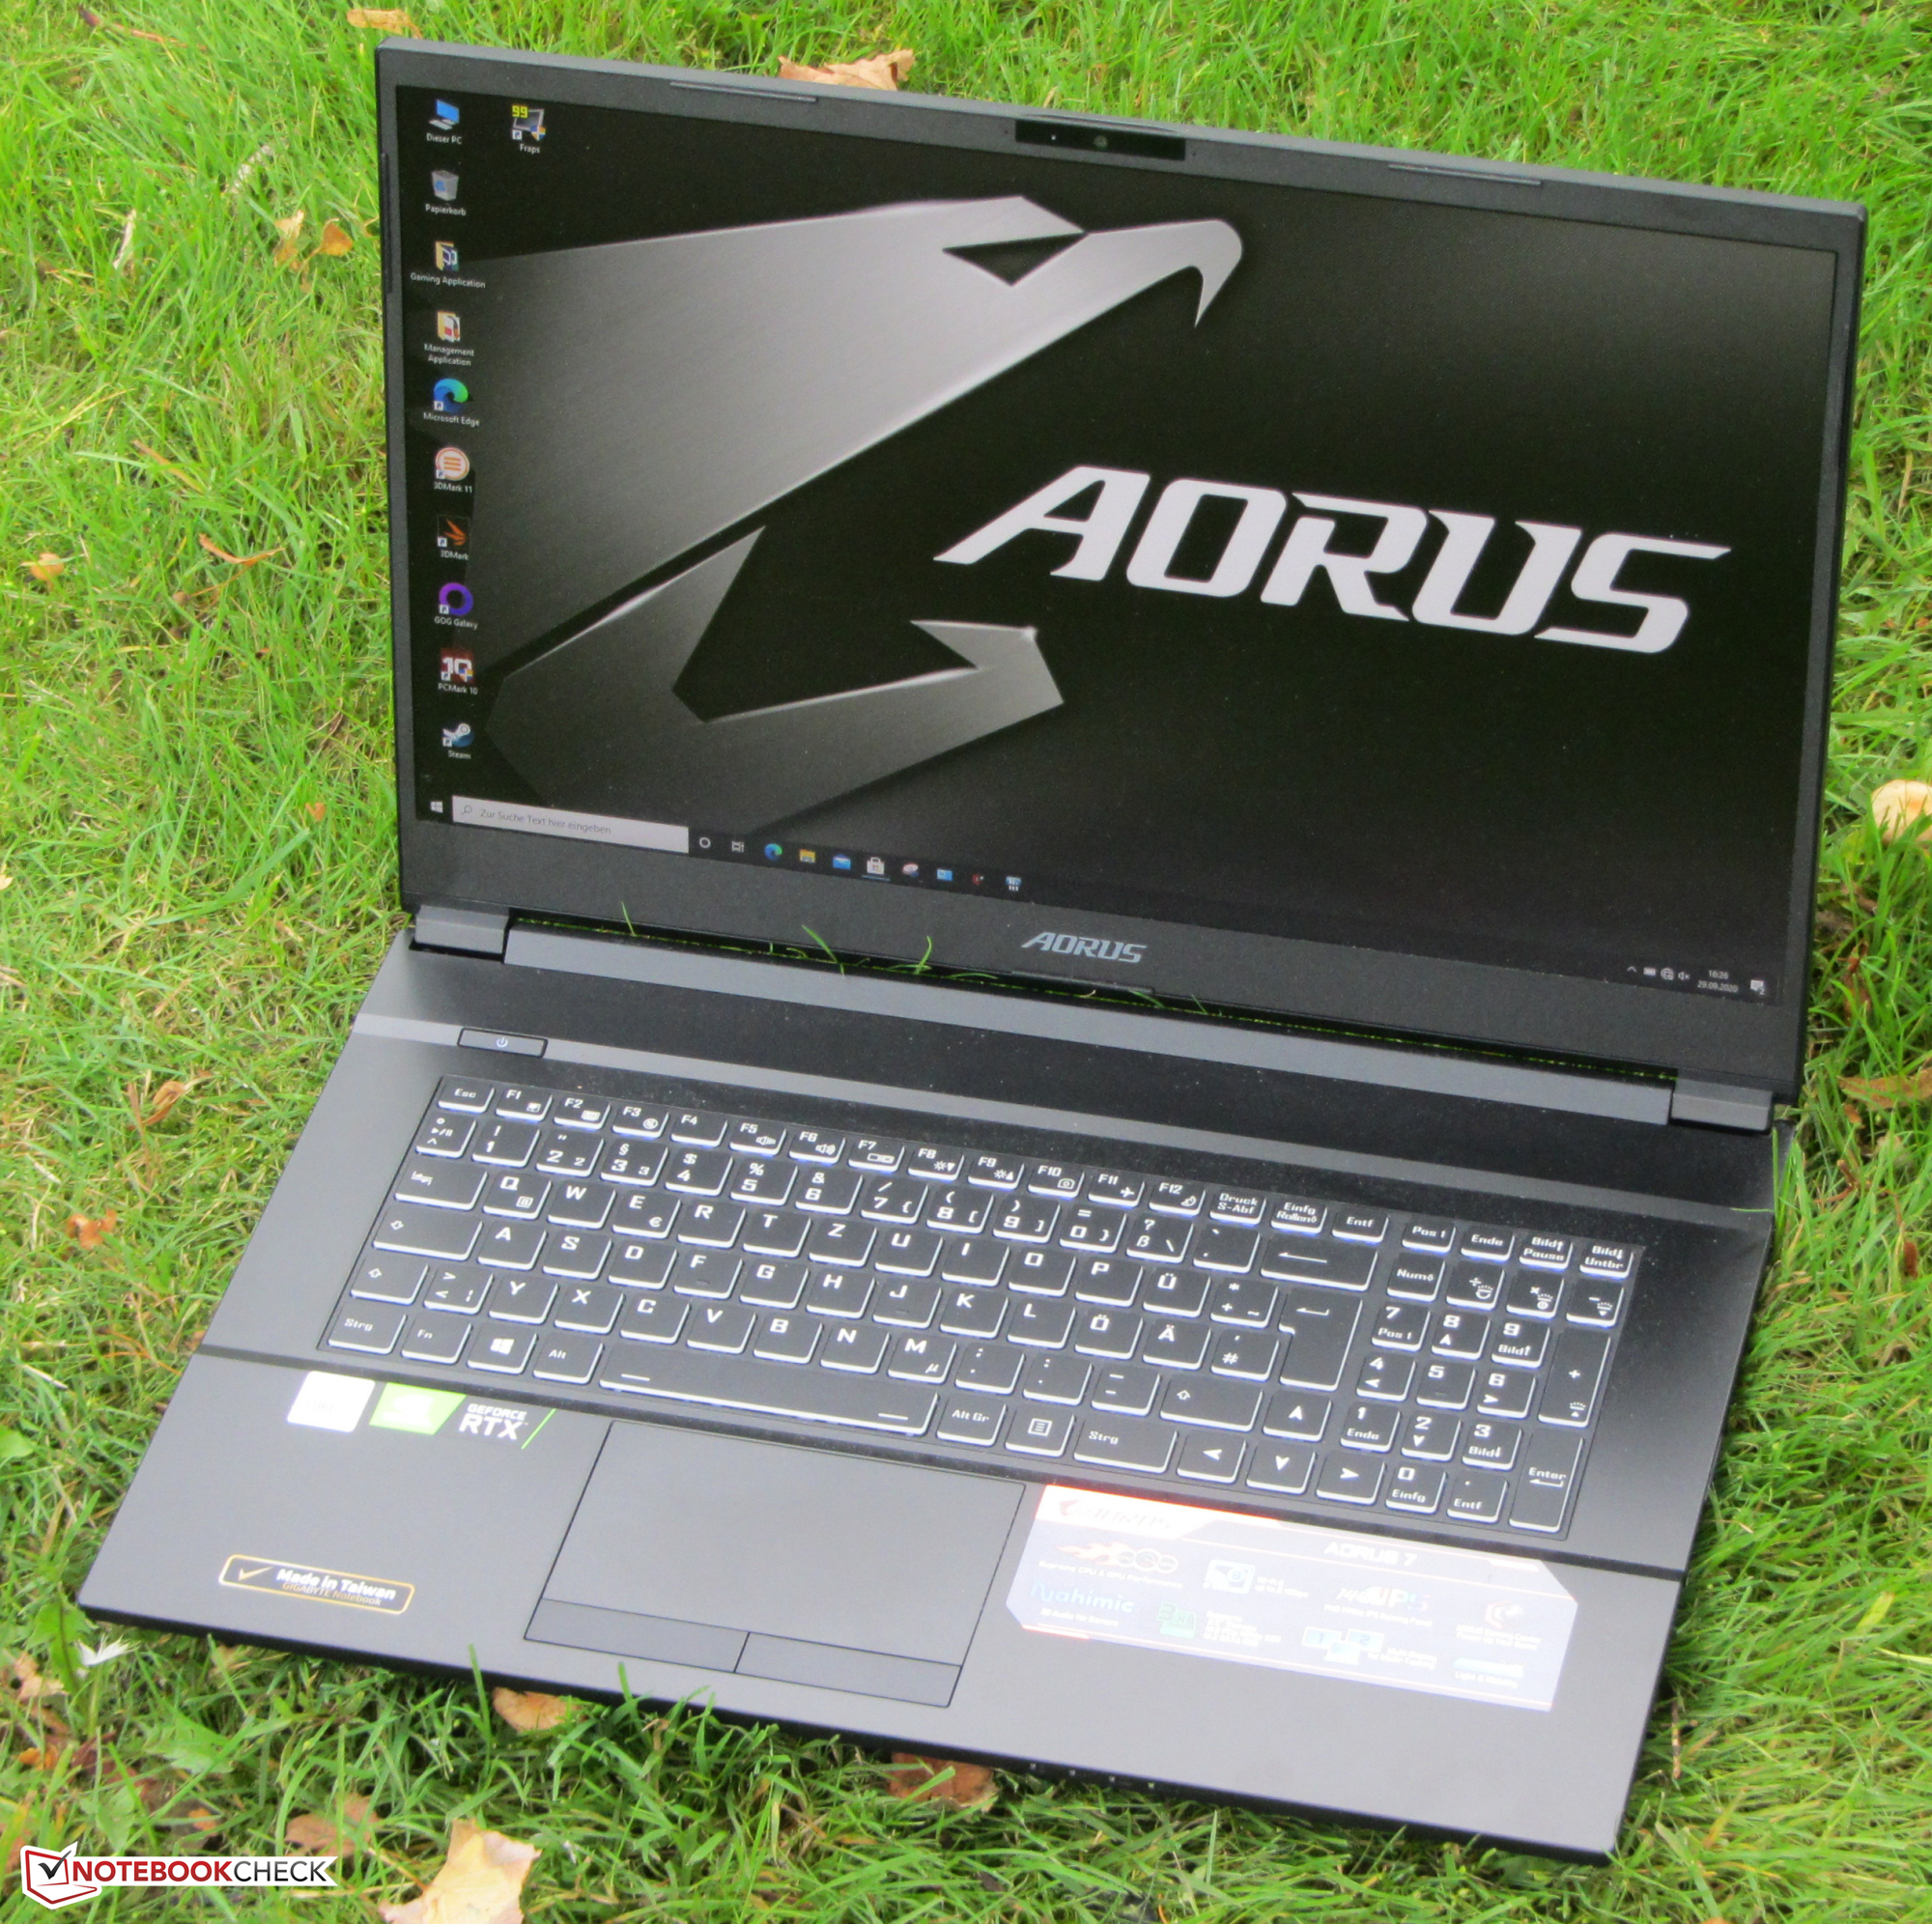
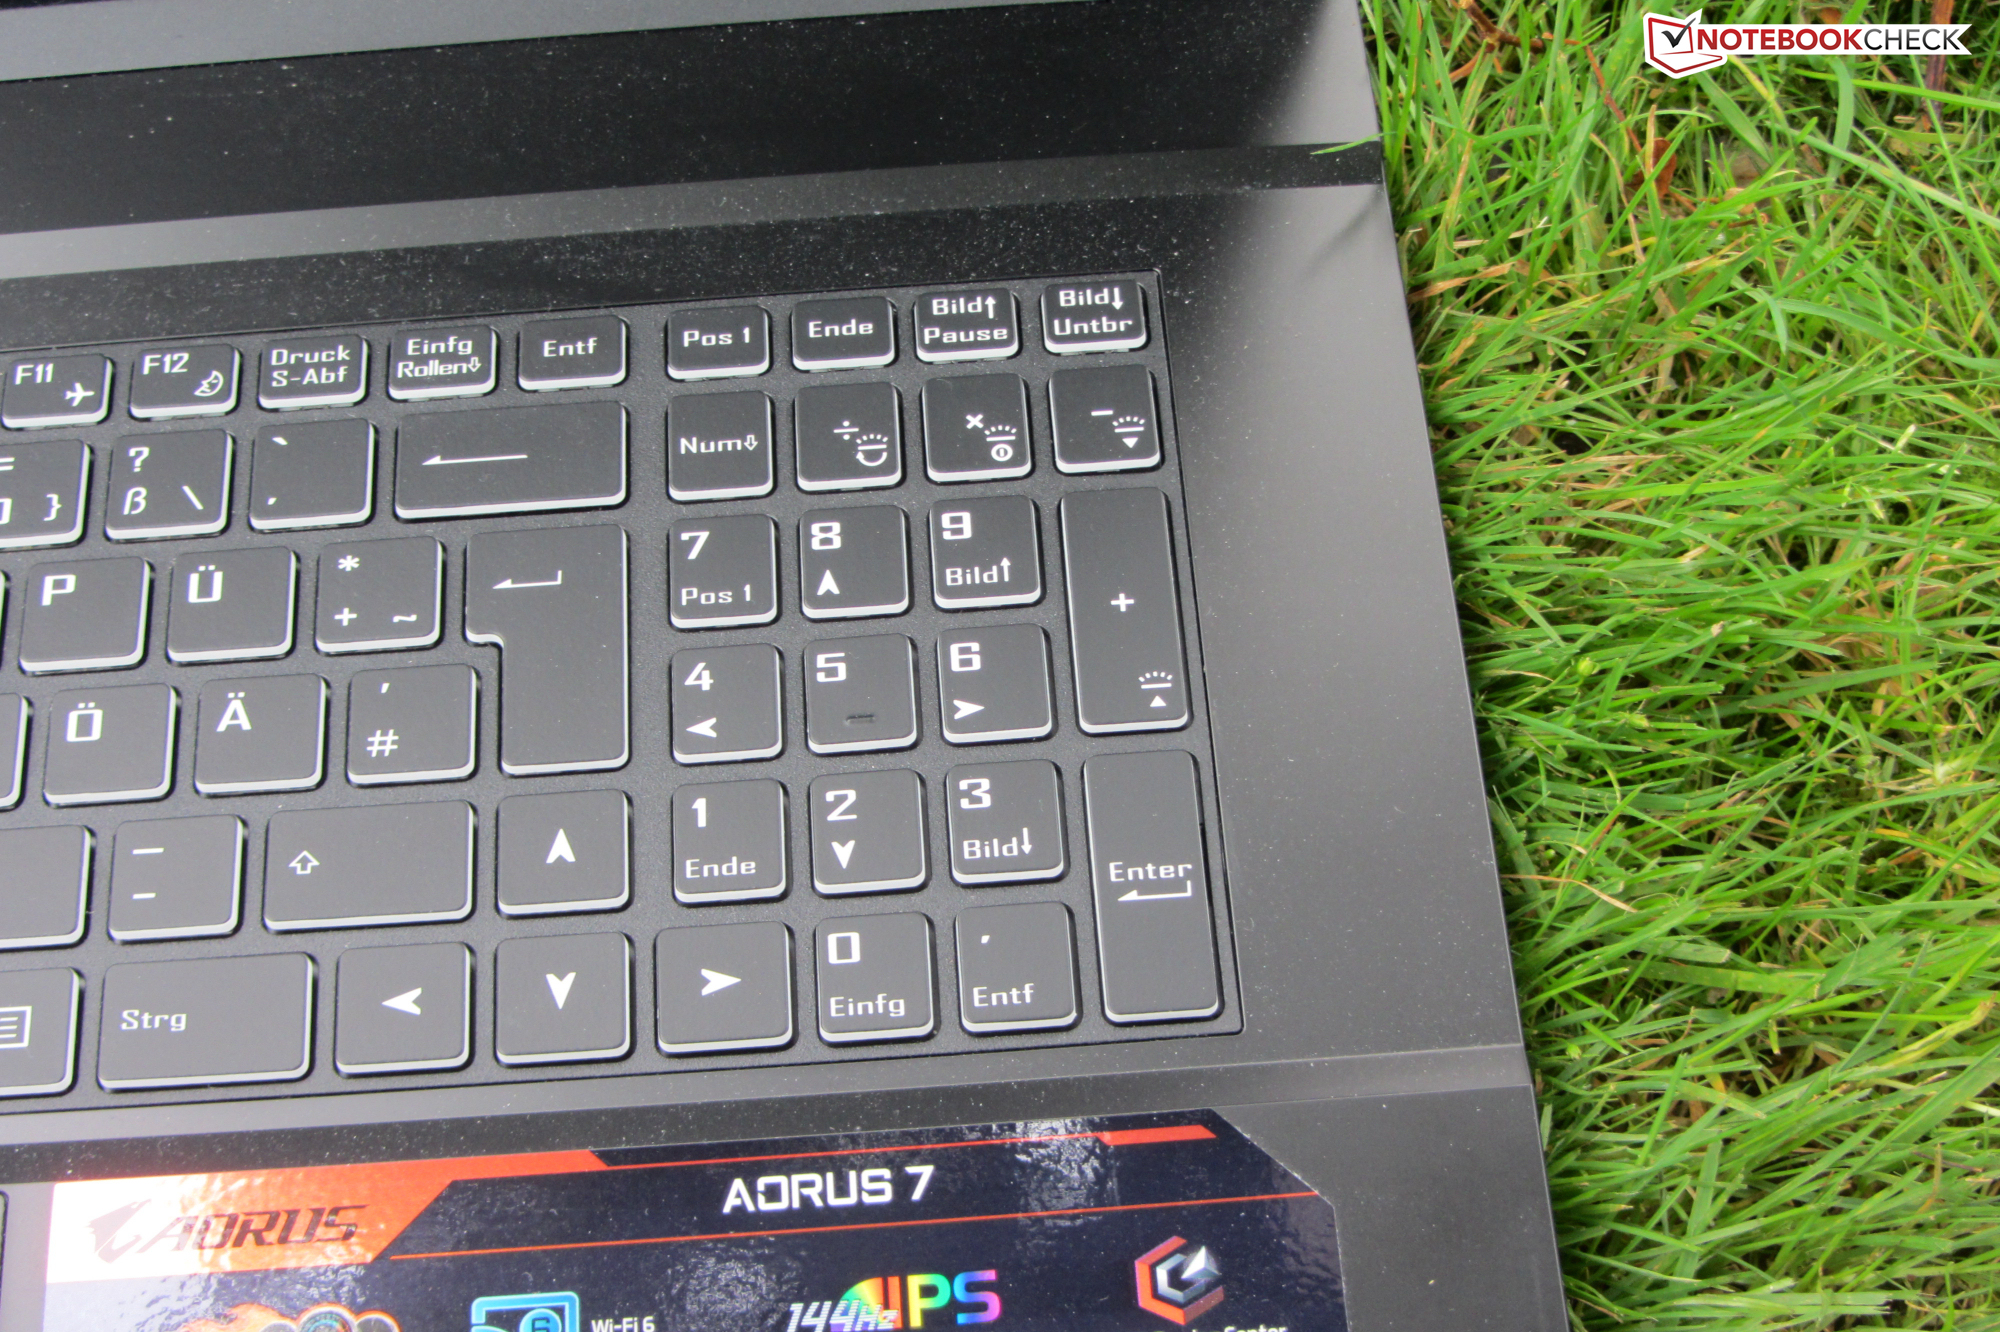
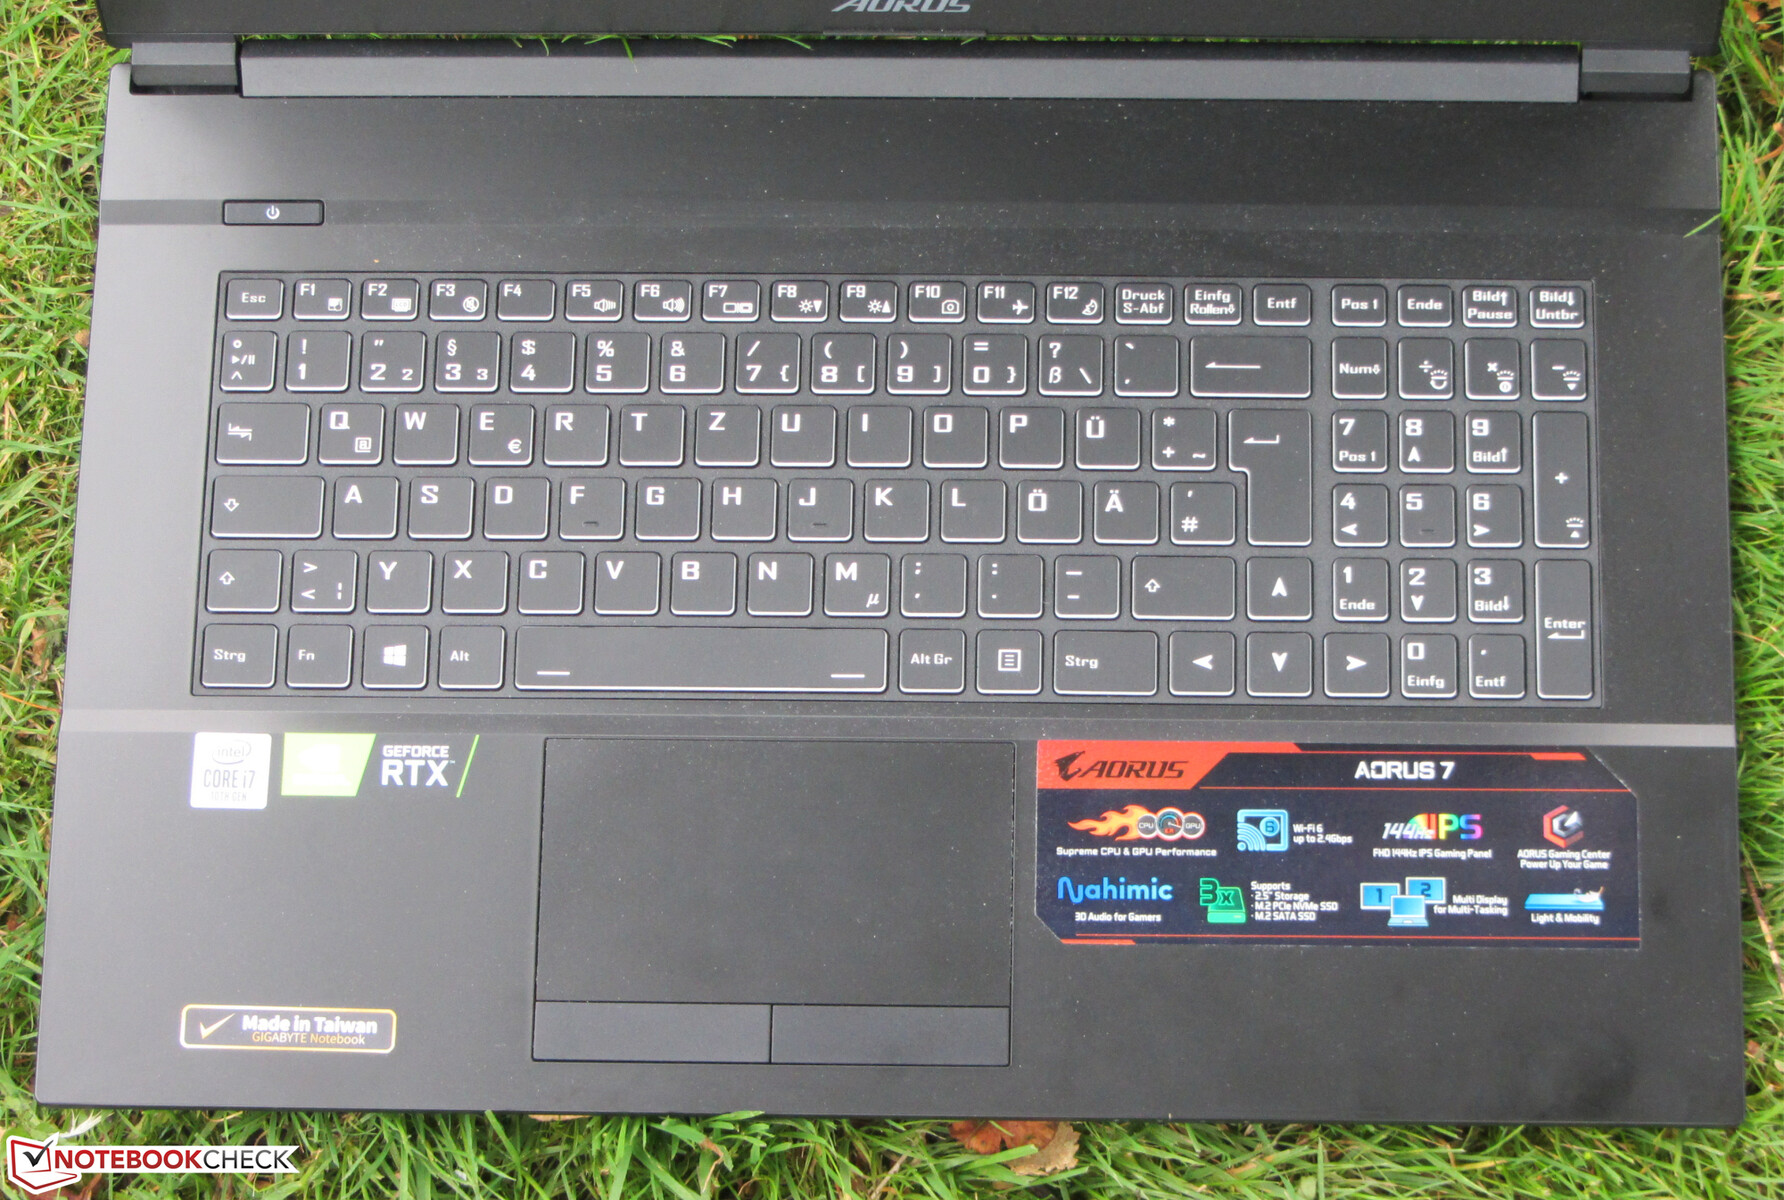
Input devices - Backlit keyboard on board
Keyboard
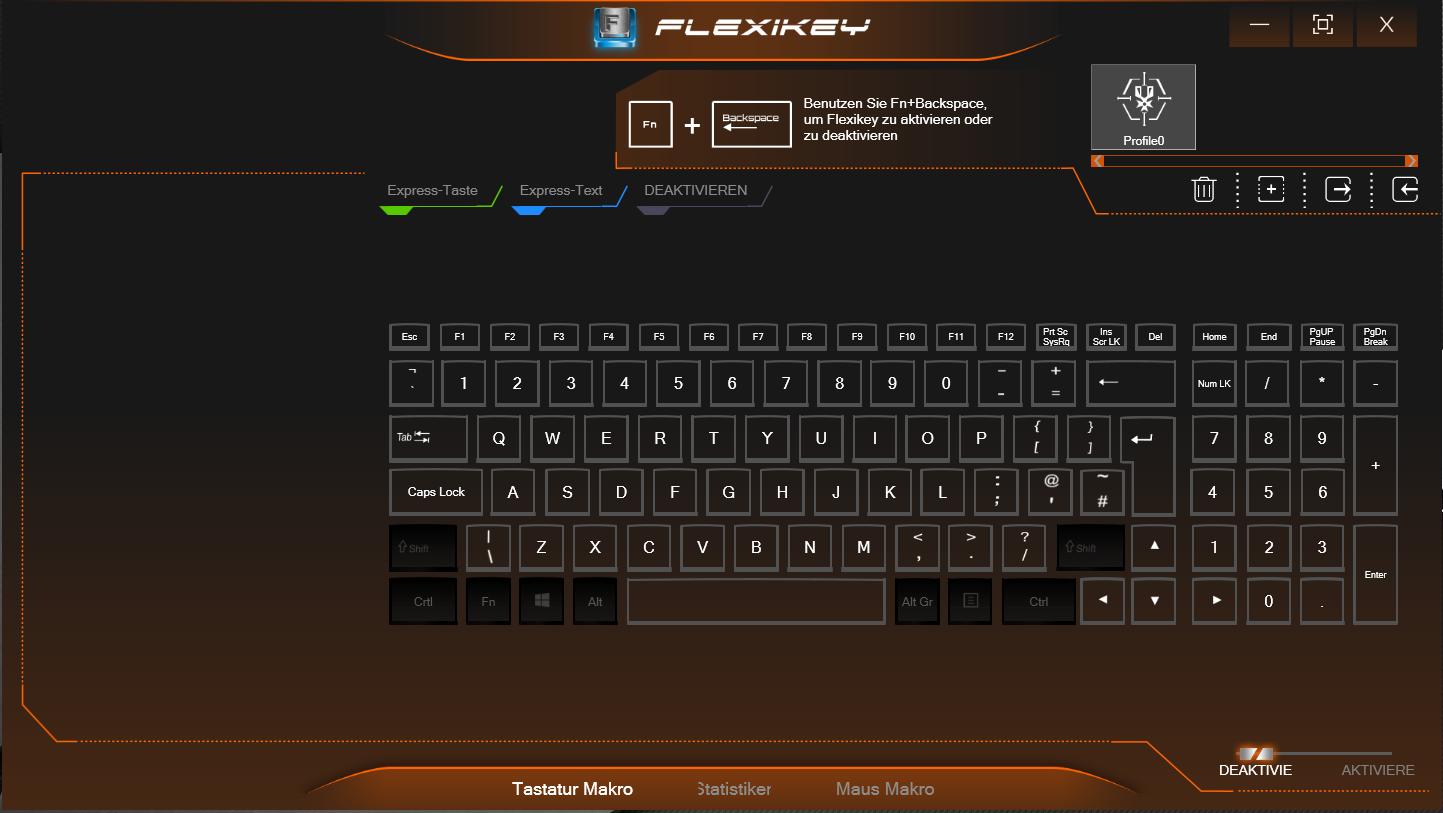
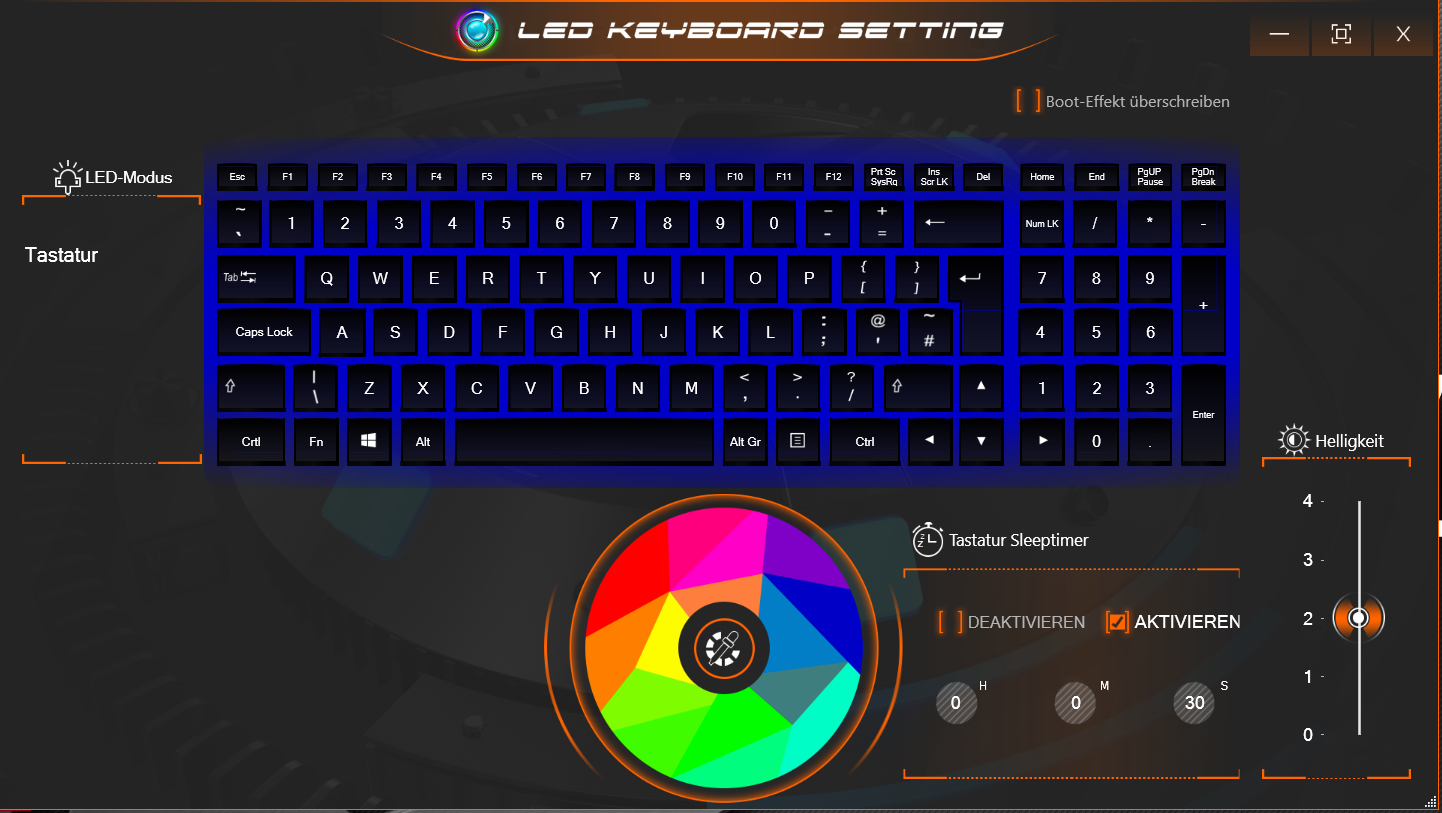
The 17.3-incher is equipped with a backlit chiclet keyboard that includes a number pad. The flat, smooth keys offer a medium travel and a clear pressure point. The resistance provided by the keys is fundamentally alright, but it should be crisper for our taste. The keyboard doesn't yield during typing. Overall, Gigabyte delivers a keyboard suitable for everyday use here.
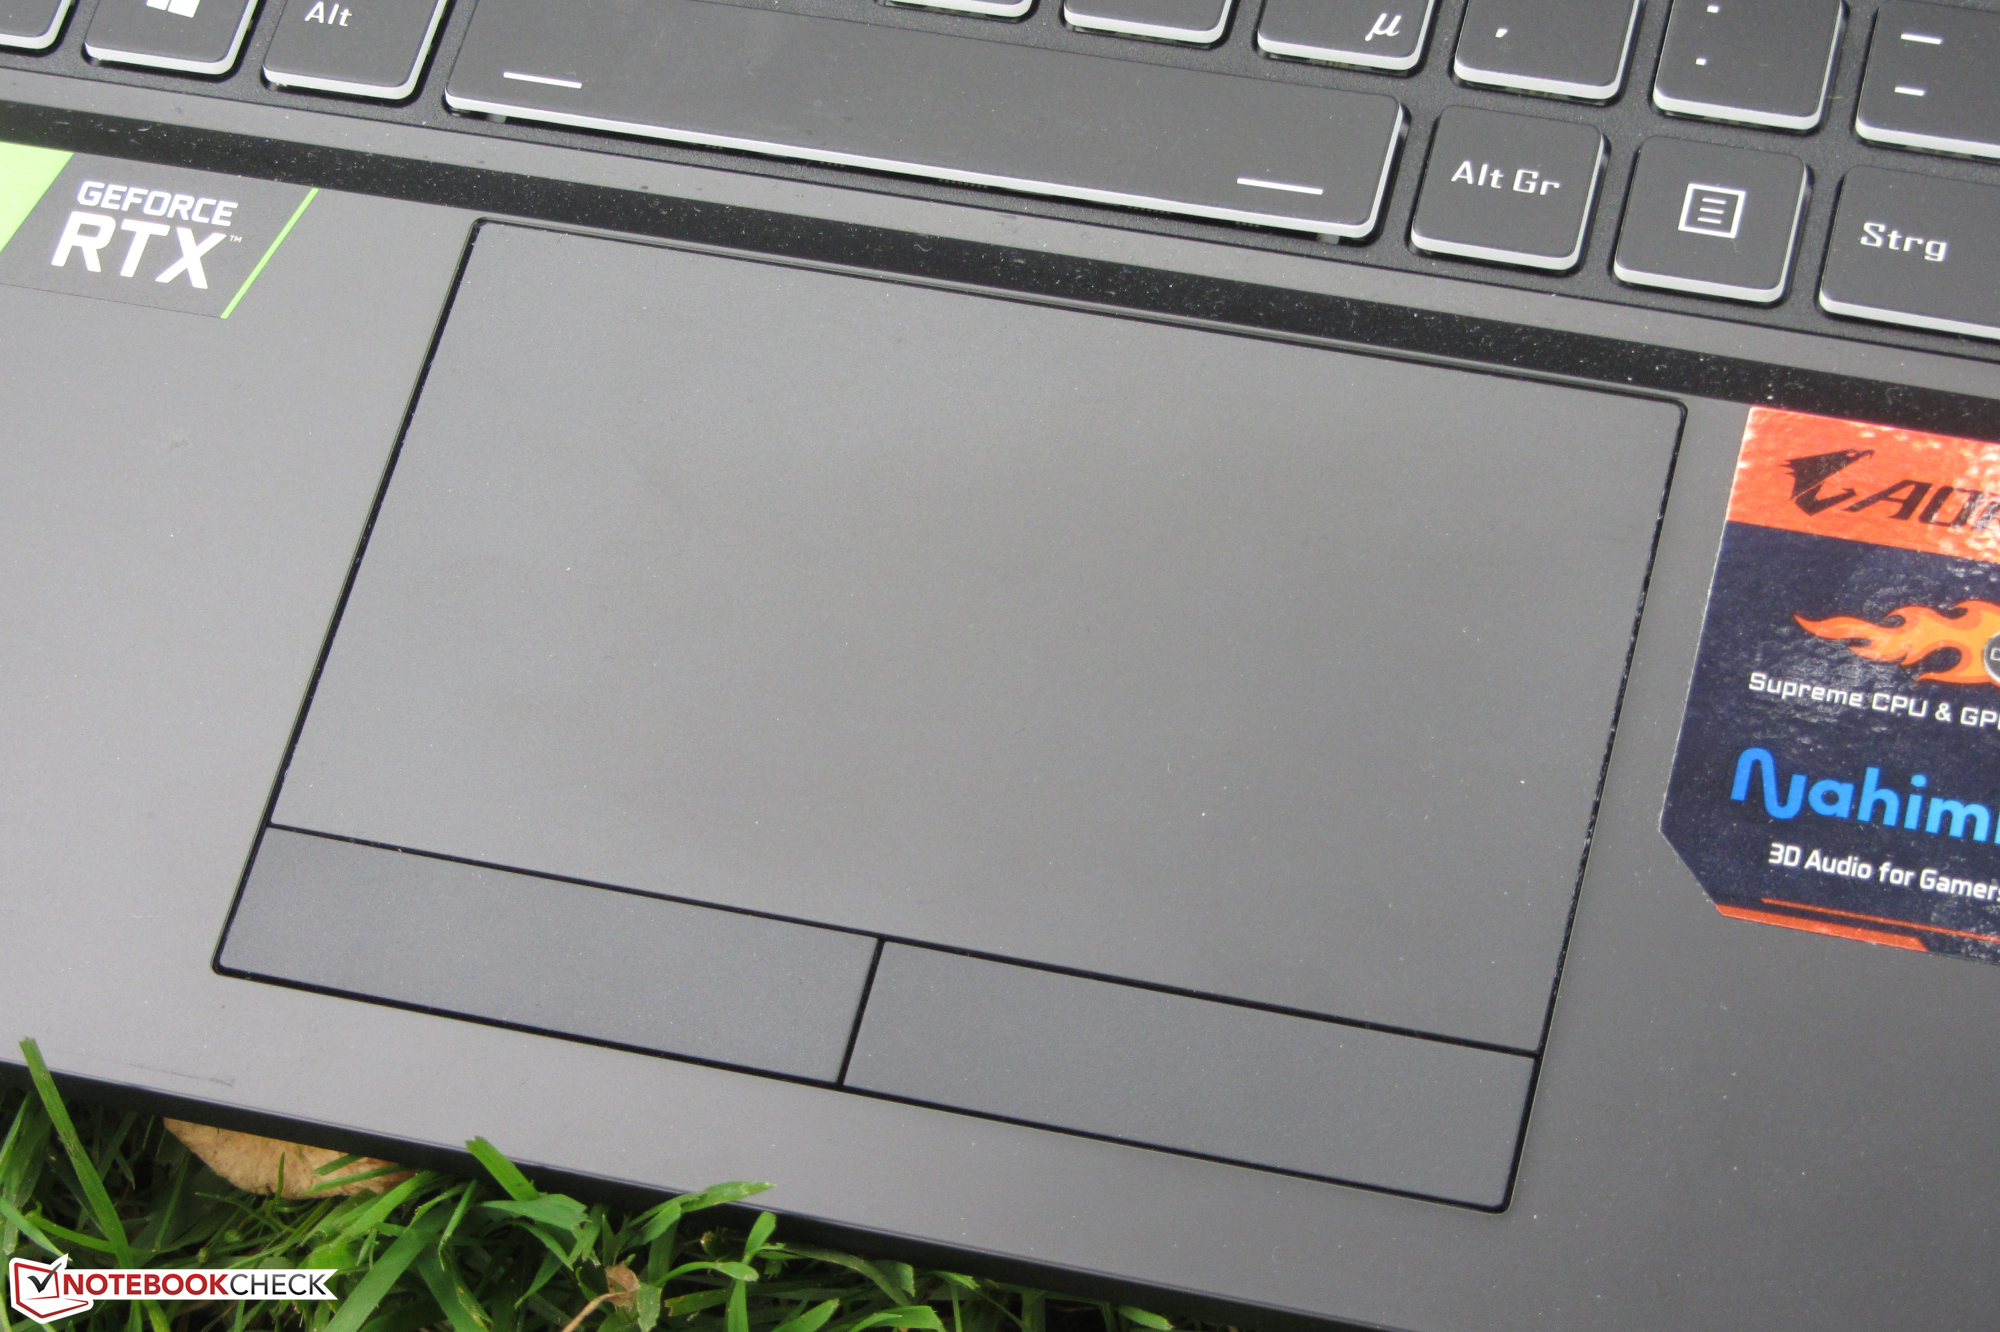
Touchpad
The multi-touch capable touchpad occupies an area of approximately 11 x 6.3 cm. This provides plenty of space for the use of gesture controls. The pad also reacts to input in the corners. The smooth surface makes it easy for the fingers to glide on it. In addition, the two separate mouse buttons offer a short travel and a clear pressure point.
Display - Aorus laptop with fast 144 Hz IPS panel
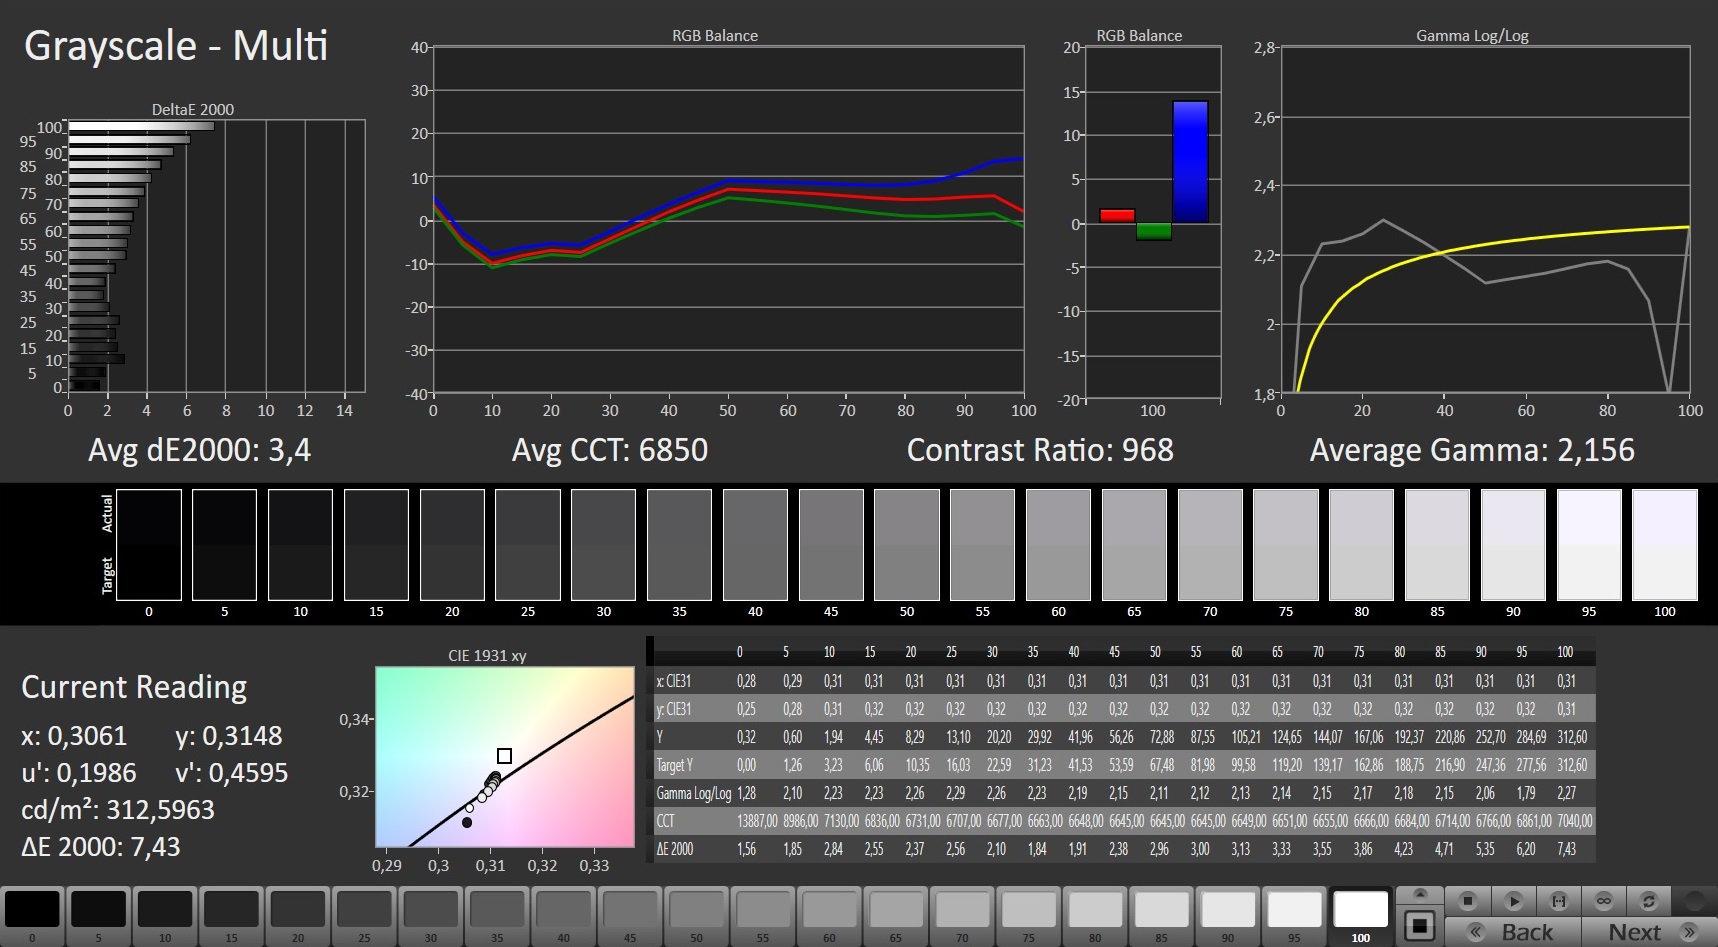
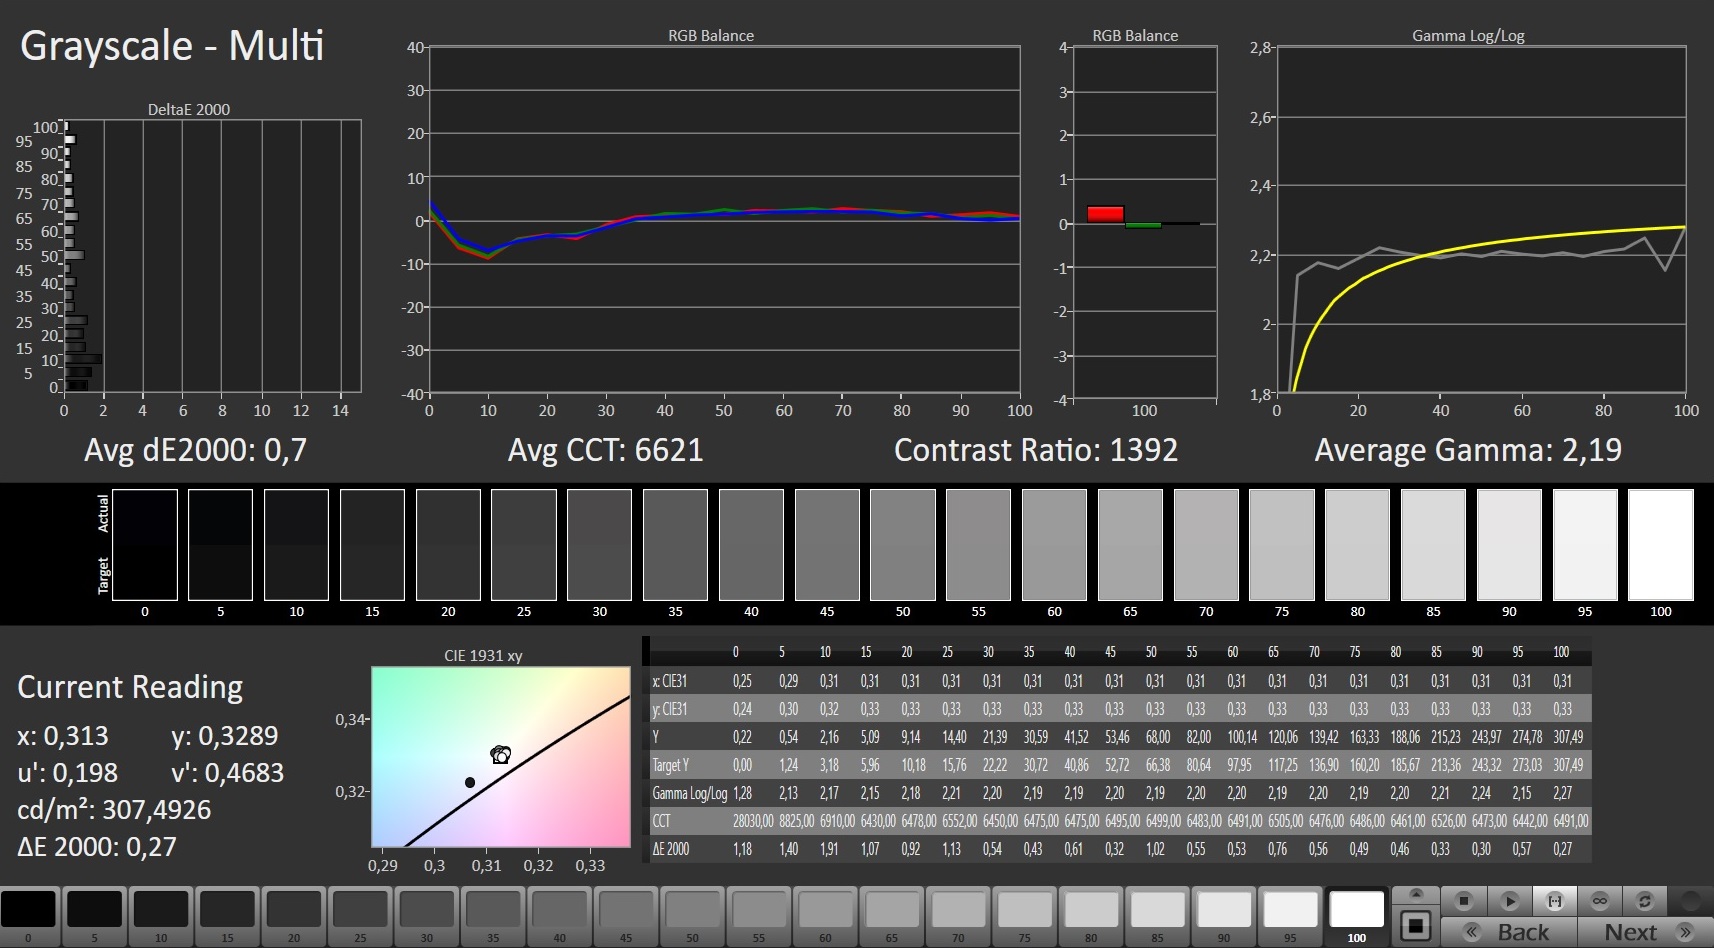
The matte 17.3-inch display has a native resolution of 1920x1080 pixels. The contrast (977:1) and brightness (278 cd/m²) are slightly too low. We consider values beyond 1,000:1 and 300 cd/m², respectively, to be good. The 144 Hz panel used here offers fast response times. Positive: We couldn't detect any PWM flickering.
| |||||||||||||||||||||||||
Brightness Distribution: 87 %
Center on Battery: 303 cd/m²
Contrast: 977:1 (Black: 0.31 cd/m²)
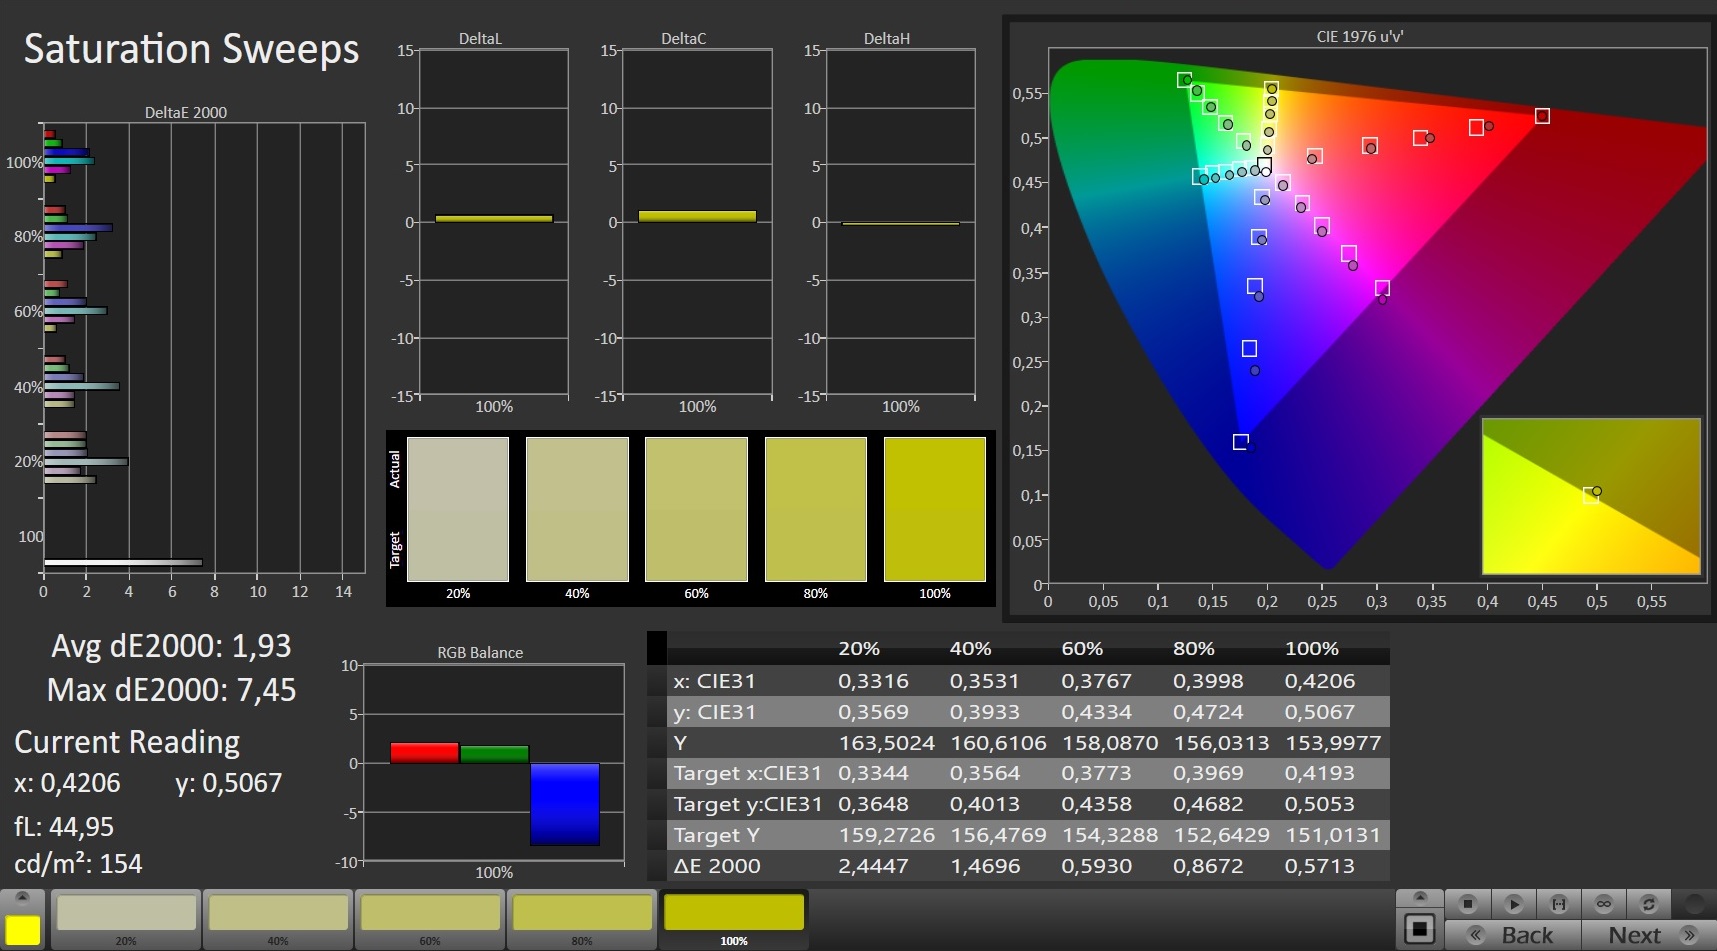
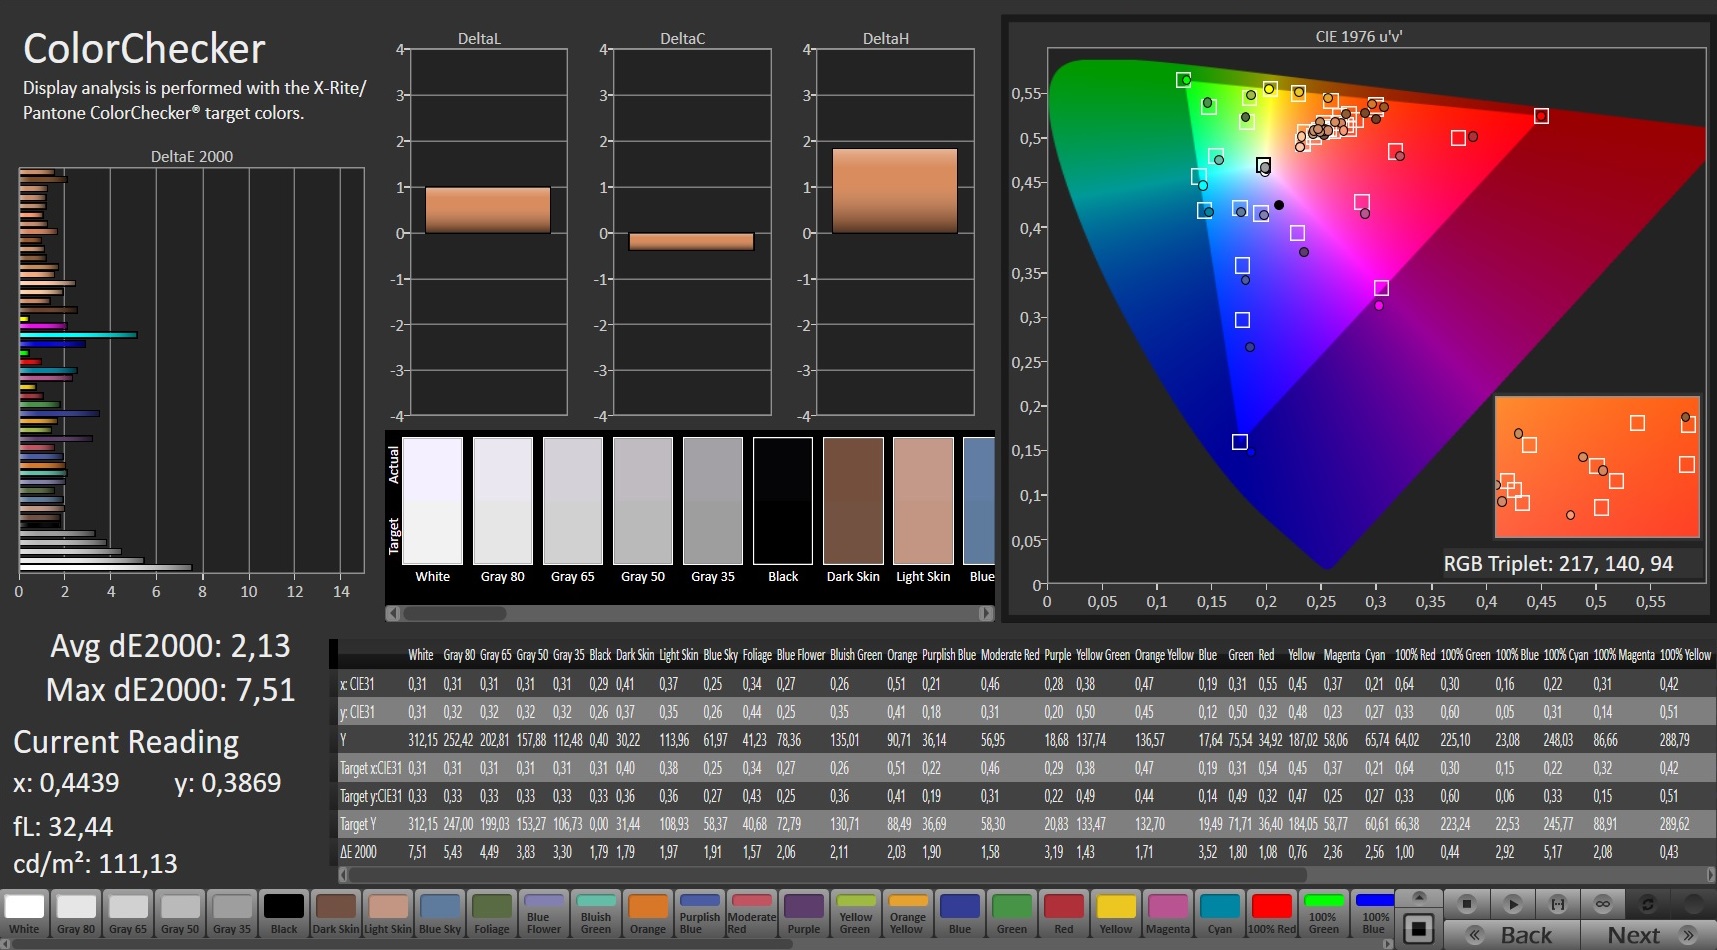
ΔE Color 2.13 | 0.5-29.43 Ø5, calibrated: 0.7
ΔE Greyscale 3.4 | 0.57-98 Ø5.3
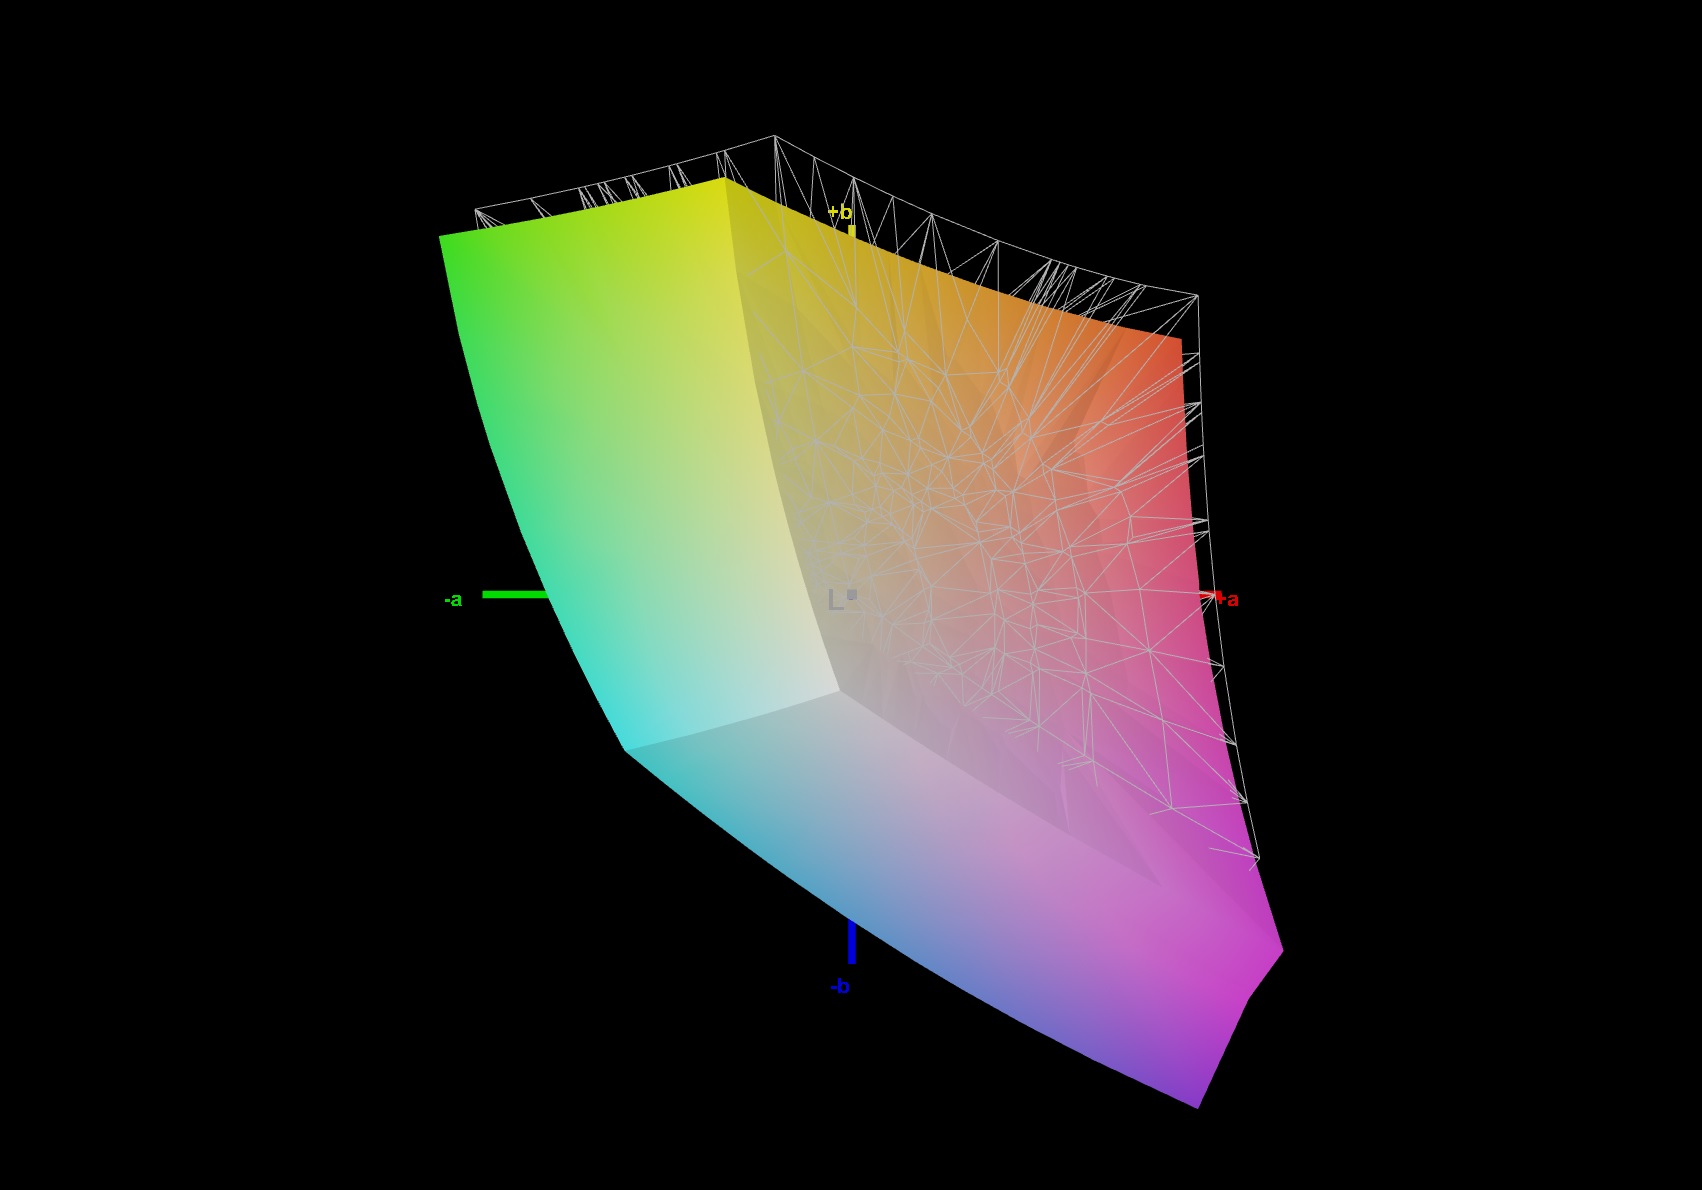
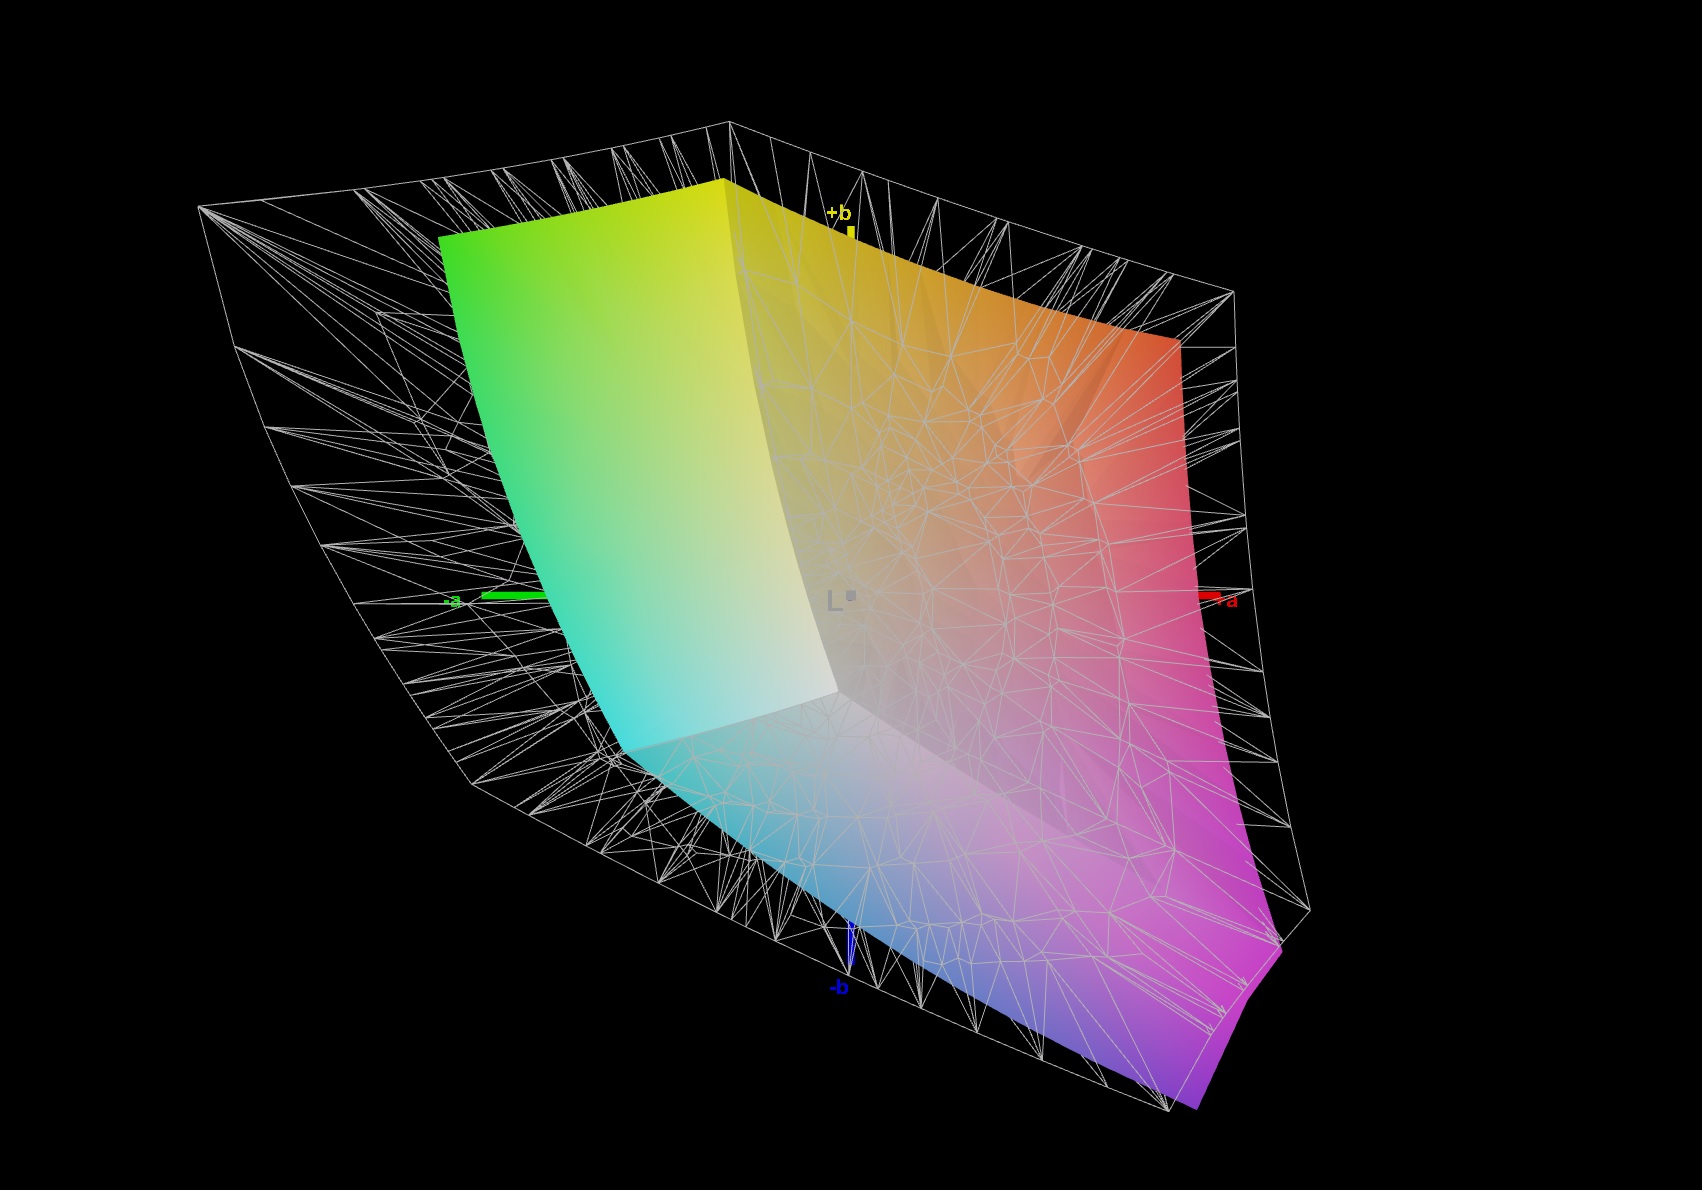
90% sRGB (Argyll 1.6.3 3D)
66% AdobeRGB 1998 (Argyll 1.6.3 3D)
65.7% AdobeRGB 1998 (Argyll 2.2.0 3D)
95.6% sRGB (Argyll 2.2.0 3D)
64.7% Display P3 (Argyll 2.2.0 3D)
Gamma: 2.156
| Aorus 7 KB LG Philips LP173WFG-SPB1, IPS, 1920x1080, 17.30 | MSI GE75 Raider 10SE-008US Chi Mei N173HCE-G33, IPS, 1920x1080, 17.30 | Nexoc GH7 716IG LG Philips LGD0615, IPS, 1920x1080, 17.30 | MSI Bravo 17 A4DDR AU Optronics B173HAN04.7 (AUO479D), IPS, 1920x1080, 17.30 | Asus TUF A17 FA706IU-AS76 BOE NV173FHM-NX1, IPS, 1920x1080, 17.30 | Lenovo Legion Y740-17IRH LG Philips LP173WFG-SPD2 (LGD05E0), IPS, 1920x1080, 17.30 | Acer Nitro 5 AN517-52-77DS AU Optronics B173HAN04.7, IPS, 1920x1080, 17.30 | |
|---|---|---|---|---|---|---|---|
| Display | 2% | 0% | -37% | -37% | 0% | -38% | |
| Display P3 Coverage | 64.7 | 65.6 1% | 64.6 0% | 40.54 -37% | 40.55 -37% | 64.8 0% | 39.47 -39% |
| sRGB Coverage | 95.6 | 98.1 3% | 95.8 0% | 60.1 -37% | 59.7 -38% | 96 0% | 58.9 -38% |
| AdobeRGB 1998 Coverage | 65.7 | 67.8 3% | 65.7 0% | 41.88 -36% | 41.89 -36% | 65.8 0% | 40.77 -38% |
| Response Times | 29% | -1% | -201% | -83% | -13% | -164% | |
| Response Time Grey 50% / Grey 80% * | 13.6 ? | 6.8 ? 50% | 15.2 ? -12% | 40 ? -194% | 22.4 ? -65% | 14.8 ? -9% | 35 ? -157% |
| Response Time Black / White * | 9.6 ? | 8.8 ? 8% | 8.6 ? 10% | 29.6 ? -208% | 19.2 ? -100% | 11.2 ? -17% | 26 ? -171% |
| PWM Frequency | 25000 ? | ||||||
| Screen | 9% | -16% | -45% | -81% | -10% | -99% | |
| Brightness middle | 303 | 337.9 12% | 303 0% | 264 -13% | 264.8 -13% | 282 -7% | 263 -13% |
| Brightness | 278 | 305 10% | 277 0% | 244 -12% | 253 -9% | 261 -6% | 246 -12% |
| Brightness Distribution | 87 | 81 -7% | 86 -1% | 88 1% | 90 3% | 87 0% | 85 -2% |
| Black Level * | 0.31 | 0.29 6% | 0.25 19% | 0.23 26% | 0.31 -0% | 0.27 13% | 0.47 -52% |
| Contrast | 977 | 1165 19% | 1212 24% | 1148 18% | 854 -13% | 1044 7% | 560 -43% |
| Colorchecker dE 2000 * | 2.13 | 2.18 -2% | 4.15 -95% | 3.85 -81% | 4.73 -122% | 3.18 -49% | 5.07 -138% |
| Colorchecker dE 2000 max. * | 7.51 | 3.9 48% | 10.52 -40% | 9.13 -22% | 18.89 -152% | 8.39 -12% | 20.5 -173% |
| Colorchecker dE 2000 calibrated * | 0.7 | 0.69 1% | 0.9 -29% | 3.4 -386% | 4.64 -563% | 0.95 -36% | 4.9 -600% |
| Greyscale dE 2000 * | 3.4 | 3.1 9% | 5.38 -58% | 1.95 43% | 1.4 59% | 4.1 -21% | 2.55 25% |
| Gamma | 2.156 102% | 2.07 106% | 2.35 94% | 2.52 87% | 2.16 102% | 2.55 86% | 2.37 93% |
| CCT | 6850 95% | 6882 94% | 7680 85% | 6371 102% | 6641 98% | 7260 90% | 6446 101% |
| Color Space (Percent of AdobeRGB 1998) | 66 | 62 -6% | 61 -8% | 42 -36% | 38.4 -42% | 61 -8% | 37 -44% |
| Color Space (Percent of sRGB) | 90 | 98.2 9% | 96 7% | 60 -33% | 59.3 -34% | 96 7% | 59 -34% |
| Total Average (Program / Settings) | 13% /
10% | -6% /
-11% | -94% /
-63% | -67% /
-73% | -8% /
-9% | -100% /
-96% |
* ... smaller is better
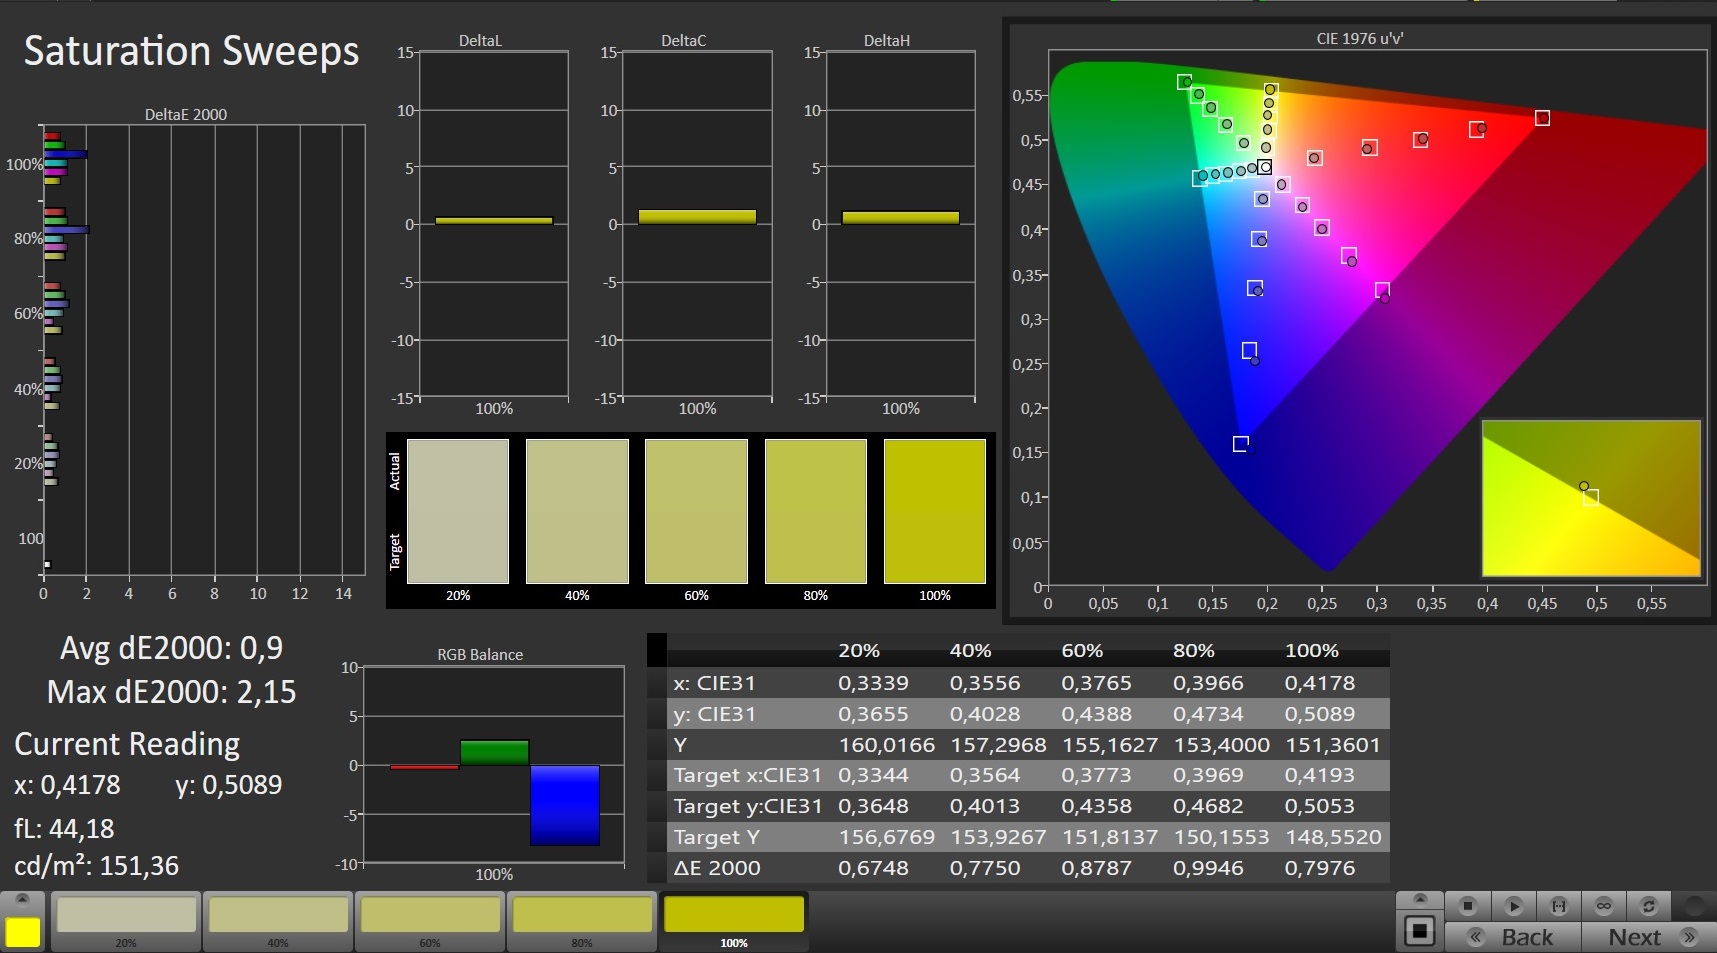
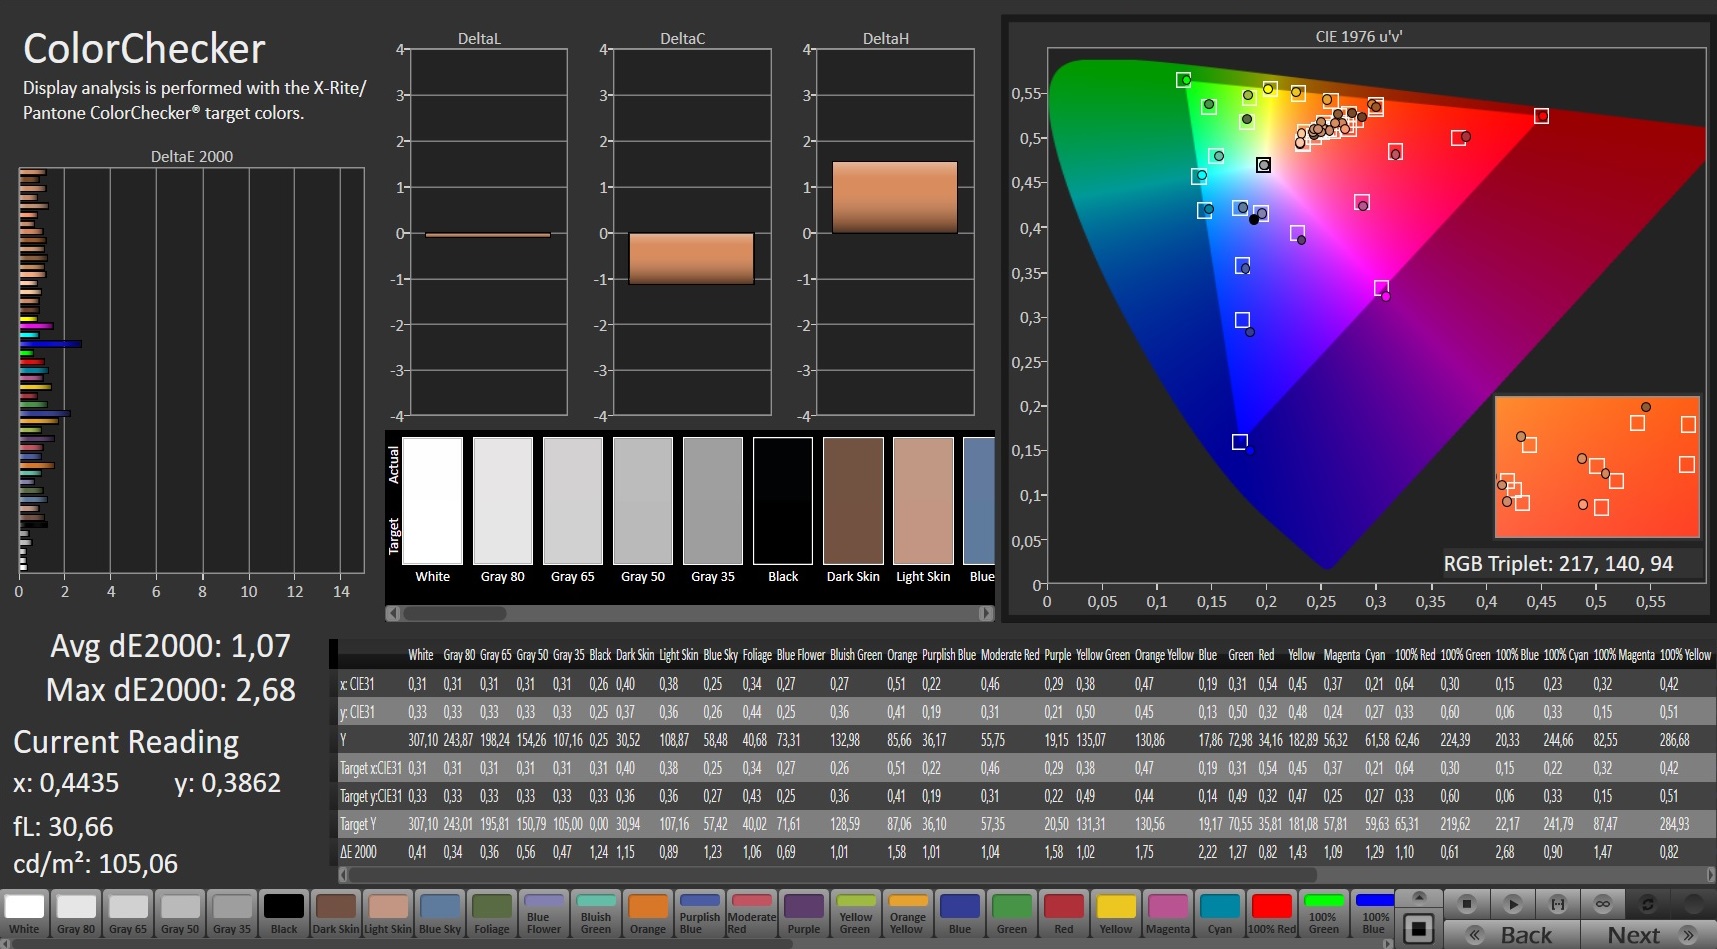
Color reproduction is pleasing out of the box. With a Delta E 2000 color deviation of just under 2.1, the target (Delta E less than 3) is met. The display doesn't suffer from a blue tint. Moreover, calibration provides for improvements: The color deviation drops to 1, and the grayscales are displayed in a more balanced way. The AdobeRGB (66%) and sRGB (90%) color spaces aren't fully reproduced.
Display Response Times
| ↔ Response Time Black to White | ||
|---|---|---|
| 9.6 ms ... rise ↗ and fall ↘ combined | ↗ 5.2 ms rise | 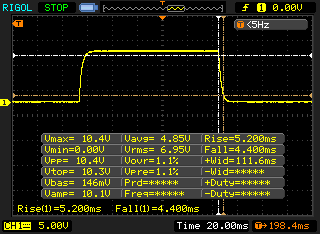 |
| ↘ 4.4 ms fall | ||
| The screen shows fast response rates in our tests and should be suited for gaming. In comparison, all tested devices range from 0.1 (minimum) to 240 (maximum) ms. » 21 % of all devices are better. This means that the measured response time is better than the average of all tested devices (21.5 ms). | ||
| ↔ Response Time 50% Grey to 80% Grey | ||
| 13.6 ms ... rise ↗ and fall ↘ combined | ↗ 6.8 ms rise | 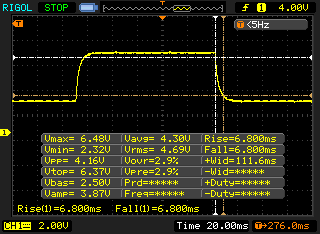 |
| ↘ 6.8 ms fall | ||
| The screen shows good response rates in our tests, but may be too slow for competitive gamers. In comparison, all tested devices range from 0.2 (minimum) to 636 (maximum) ms. » 22 % of all devices are better. This means that the measured response time is better than the average of all tested devices (33.7 ms). | ||
Screen Flickering / PWM (Pulse-Width Modulation)
| Screen flickering / PWM not detected | 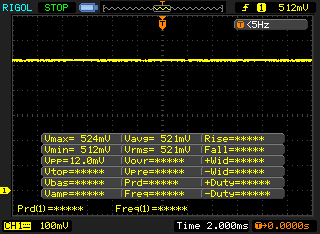 | ||
In comparison: 53 % of all tested devices do not use PWM to dim the display. If PWM was detected, an average of 17924 (minimum: 5 - maximum: 3846000) Hz was measured. | |||
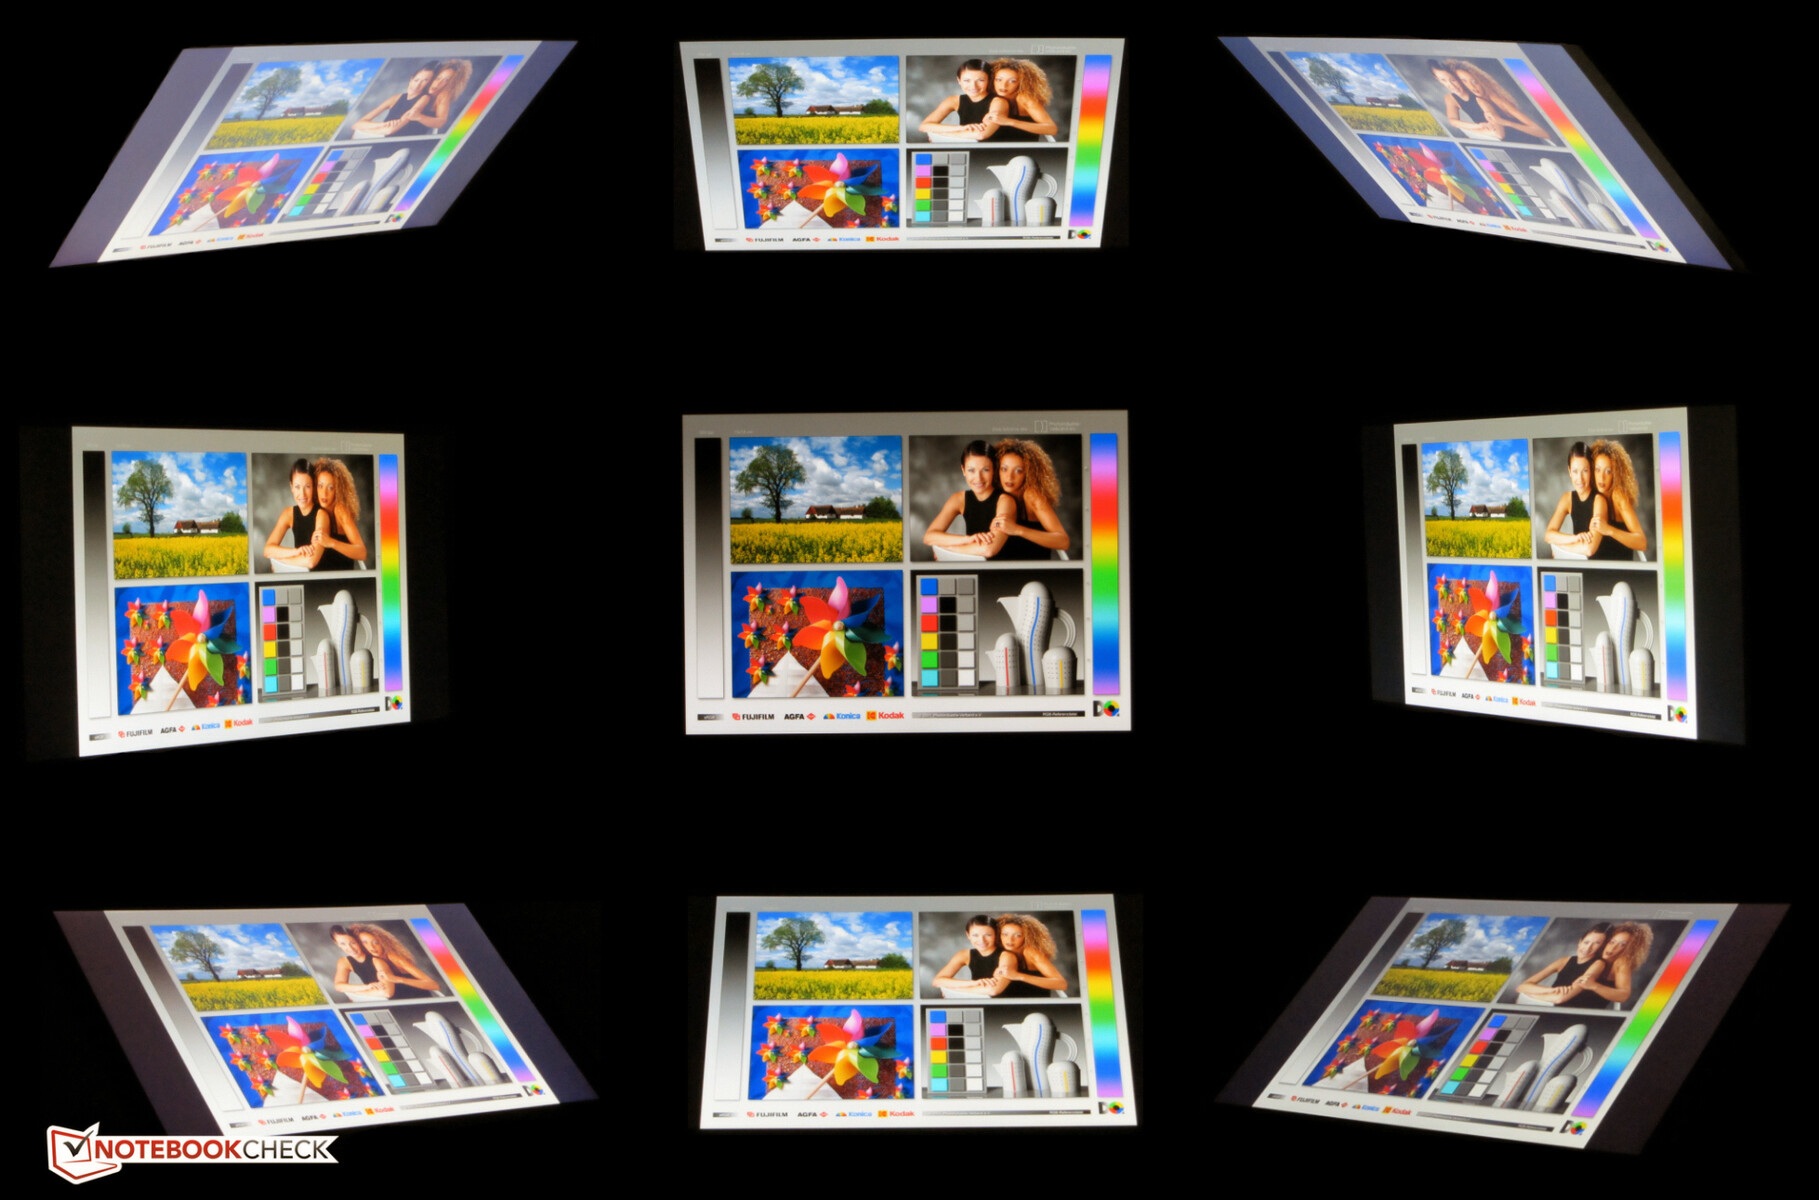
The laptop is equipped with a viewing-angle-stable IPS panel. Consequently, the screen can be read from any position. Outdoors, the display can only be read when the sun is not too bright.
Performance - Enough for the coming years
With the Aorus 7 KB, Gigabyte has a 17.3-inch gaming laptop in its product range that brings every modern game smoothly onto the screen and also cuts a fine figure in all other application areas. Our test device will set you back about 1,500 Euros (~$1,760).
Test conditions
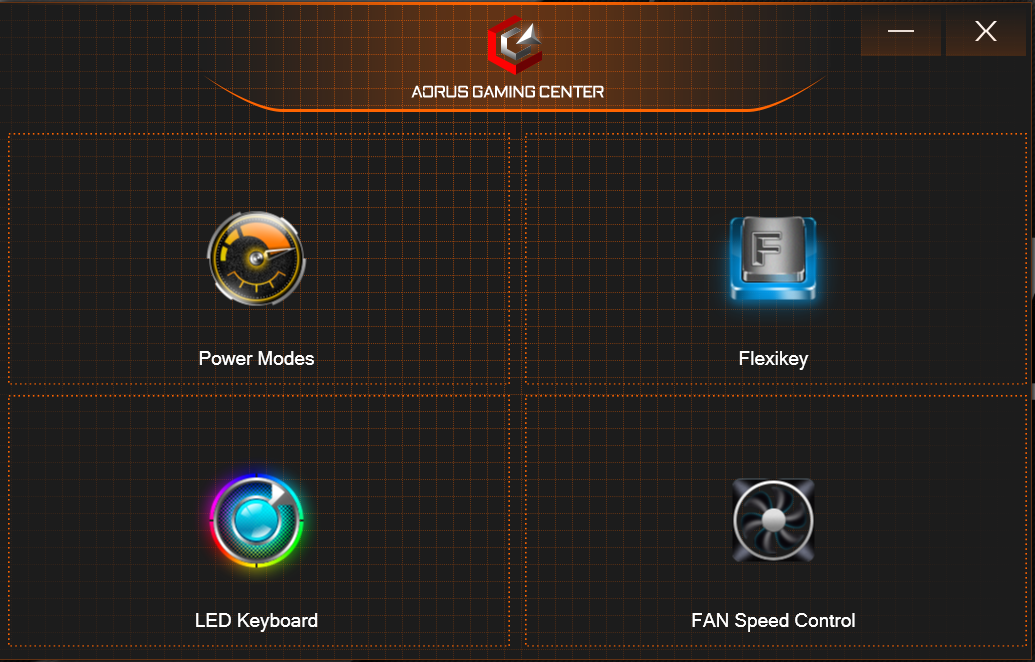
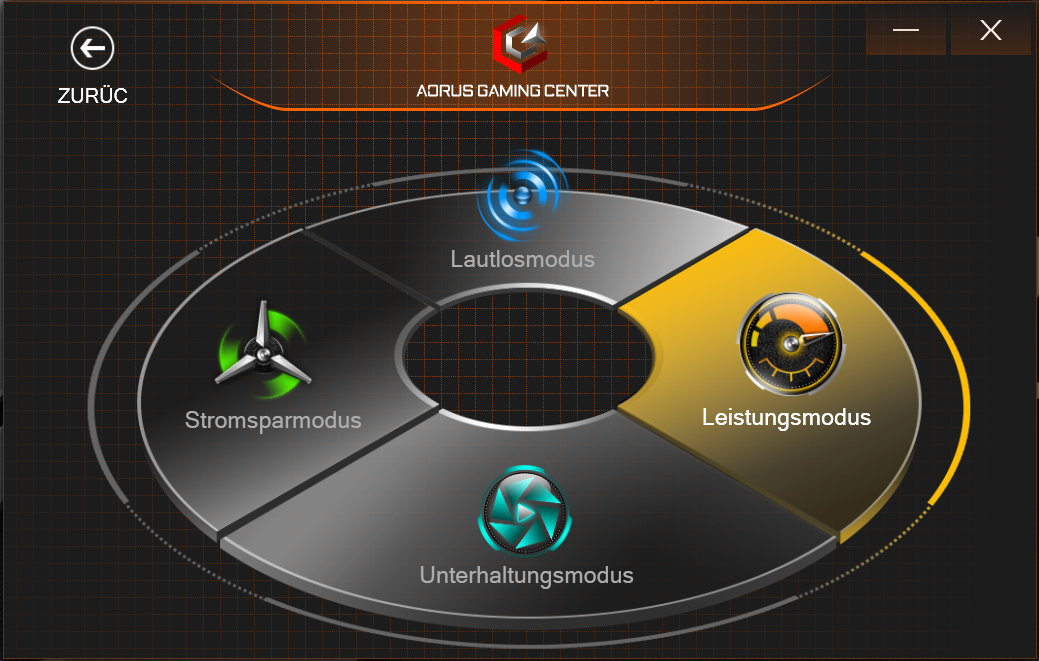
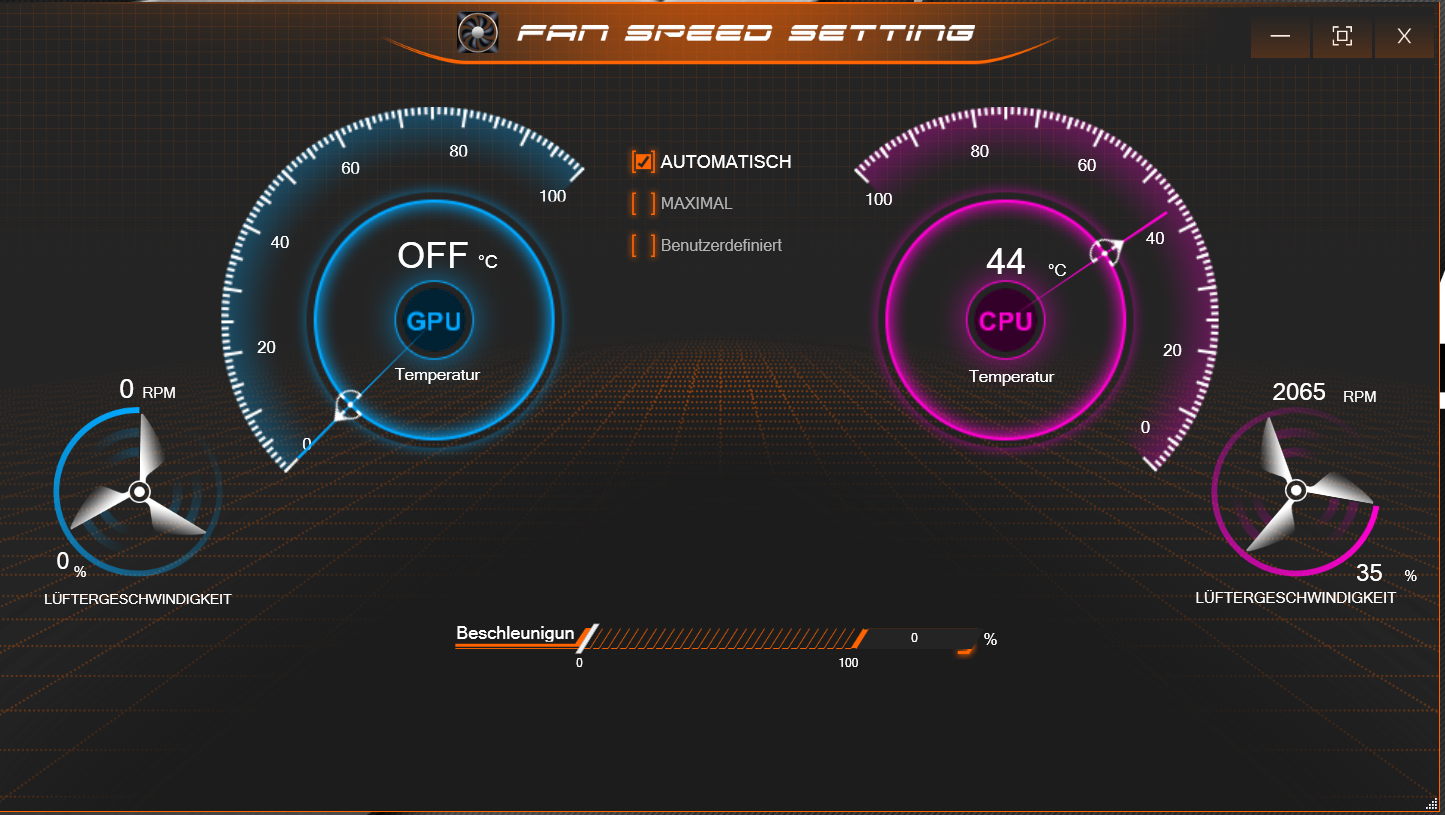
The preinstalled Aorus Gaming Center software allows, among other things, the adjustment of the fan control and the selection of an energy profile. We conducted all tests with automatic fan control and the "Performance Mode" energy profile. To perform the battery tests, we switched to the "Entertainment Mode" profile.
Processor
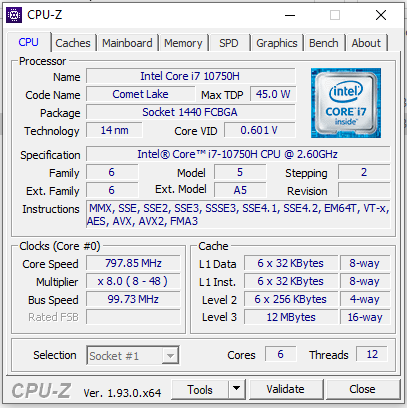
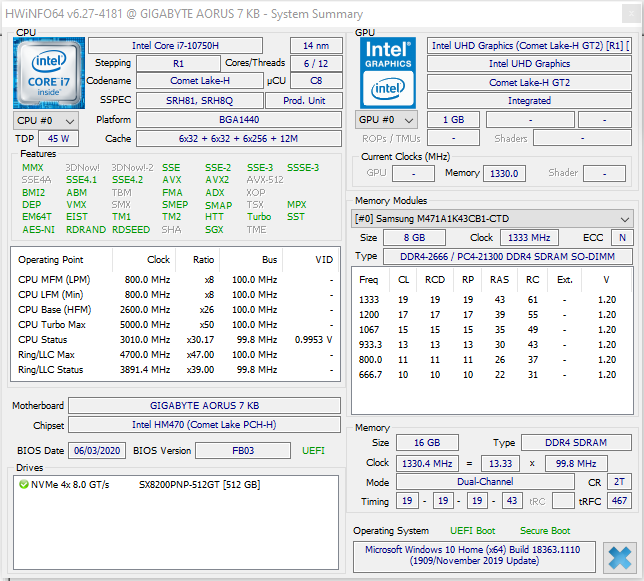
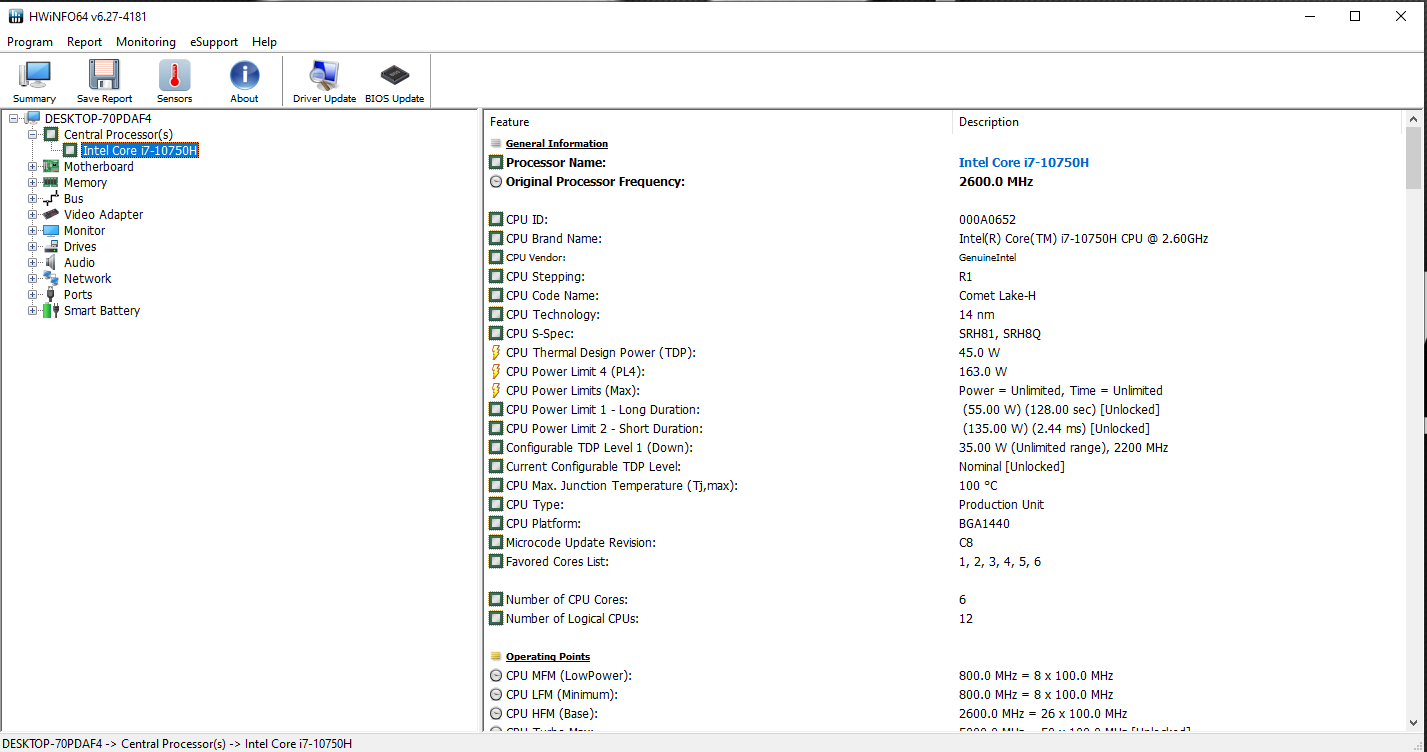
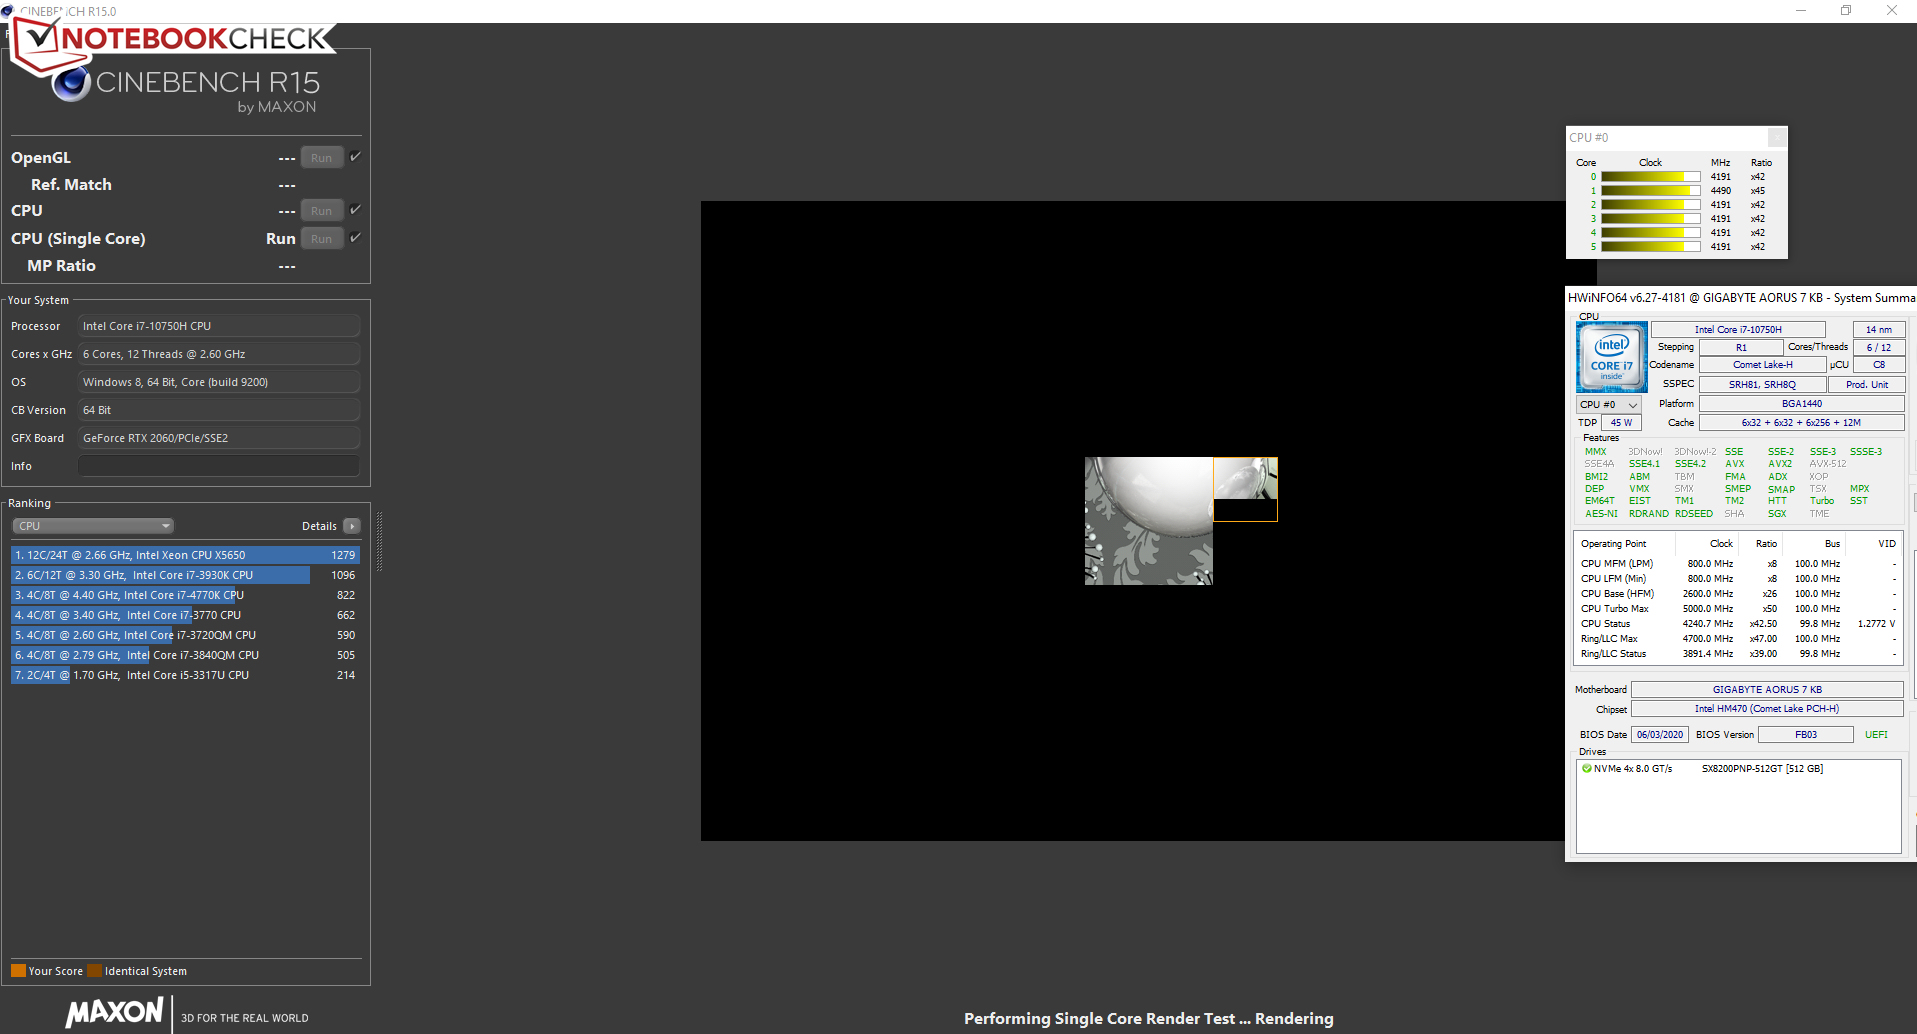
The Core i7-10750H hexa-core processor (Comet Lake) represents a good compromise between performance, power consumption, and price. Consequently, it's found in quite a lot of gaming laptops - just like its predecessor. The CPU runs at a base speed of 2.6 GHz. The clock speed can be increased to 4.3 GHz (six cores) and up to 5 GHz (one core) via Turbo. Hyper-Threading (two threads per core) is supported.
The processor briefly works through the multithread test of the Cinebench R15 benchmark at 3.8 to 4 GHz. The clock rate then drops to 3.6 to 3.9 GHz. On battery power, the speeds are 2.3 to 2.4 GHz. The single-thread test is run at 4.2 to 5 GHz - both plugged in and on battery power.
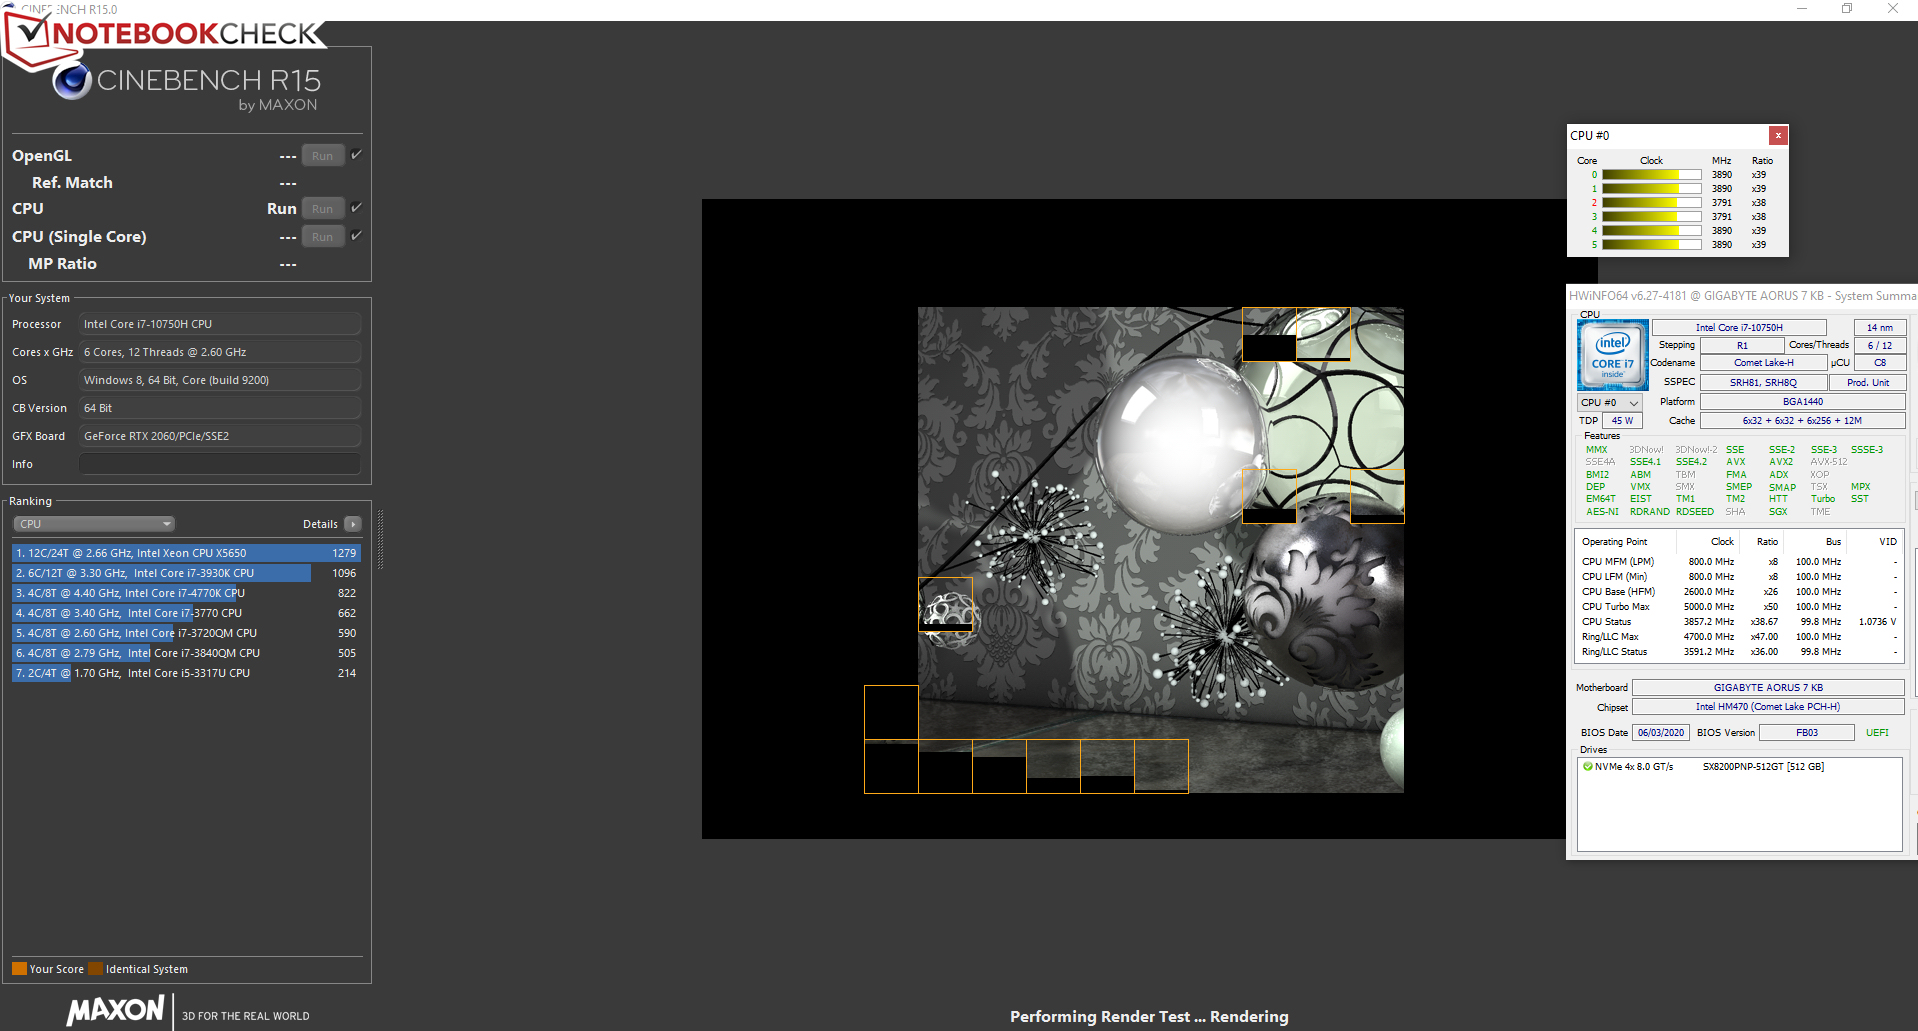
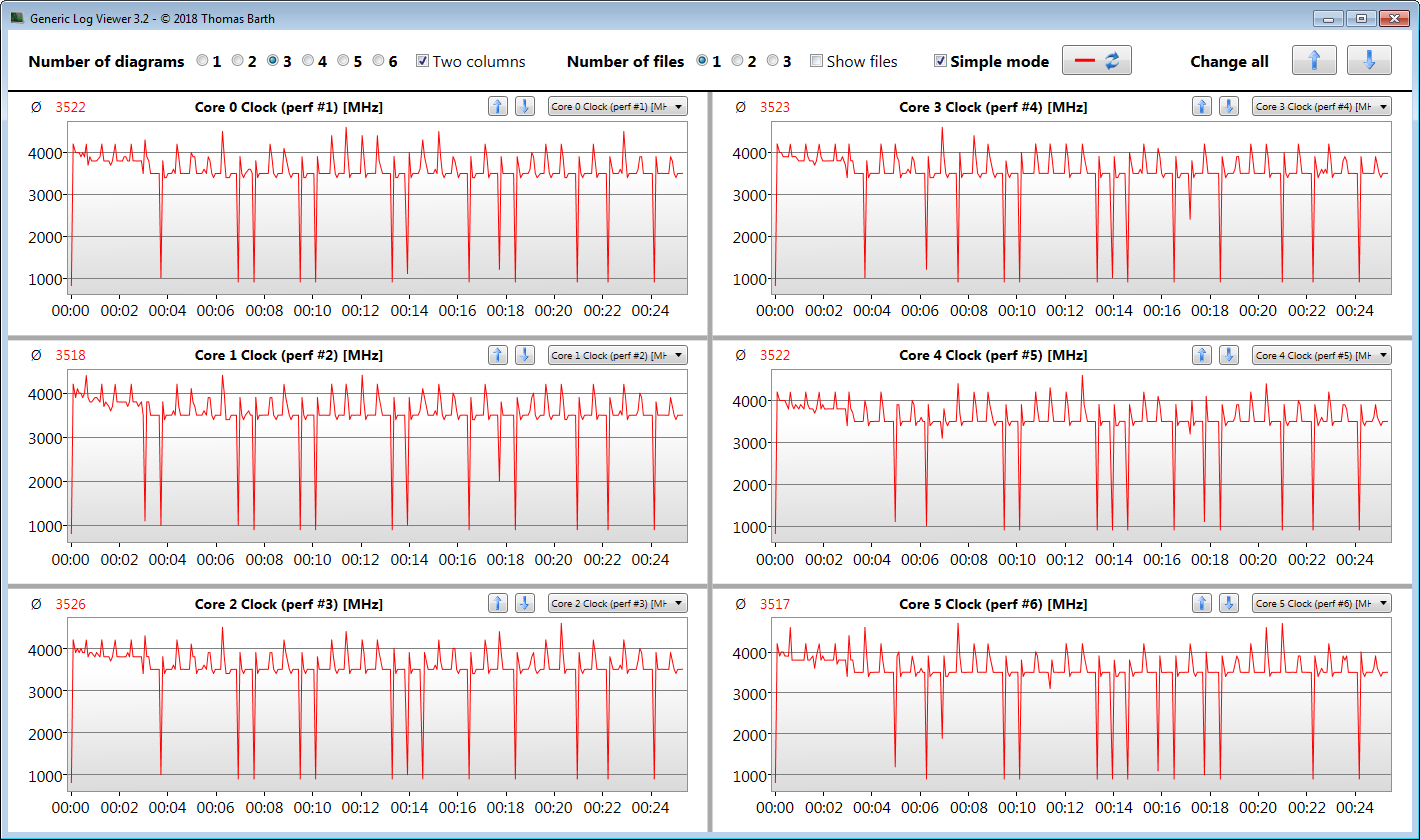
We verify if the CPU Turbo is consistently used when plugged in by running the Cinebench R15 benchmark's multithread test in a continuous loop for at least 30 minutes. The results drop from the first to the sixth run and then remain at a fairly constant level. Turbo is used. The same processor reaches slightly higher Turbo speeds in the MSI GE75 Raider 10SE.
* ... smaller is better
System performance
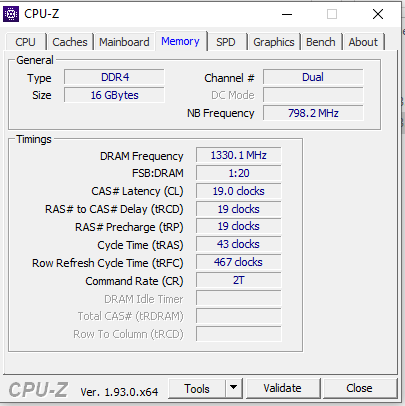
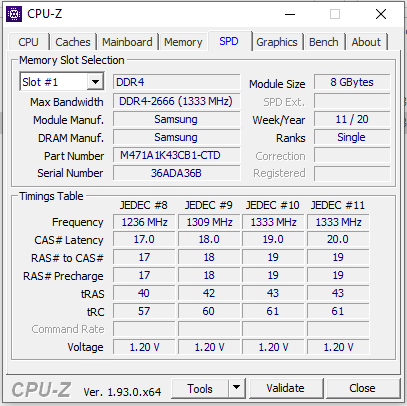
Owners of the Aorus 7 KB are well equipped for the coming years. A powerful hexa-core processor, memory running in dual-channel mode, and a fast NVMe SSD ensure a fast and smooth system. The dedicated GPU brings all modern computer games smoothly onto the screen. This is accompanied by good results in the PCMark benchmarks.
| PCMark 8 Home Score Accelerated v2 | 4183 points | |
| PCMark 8 Creative Score Accelerated v2 | 4052 points | |
| PCMark 8 Work Score Accelerated v2 | 5746 points | |
| PCMark 10 Score | 5091 points | |
Help | ||
DPC latencies
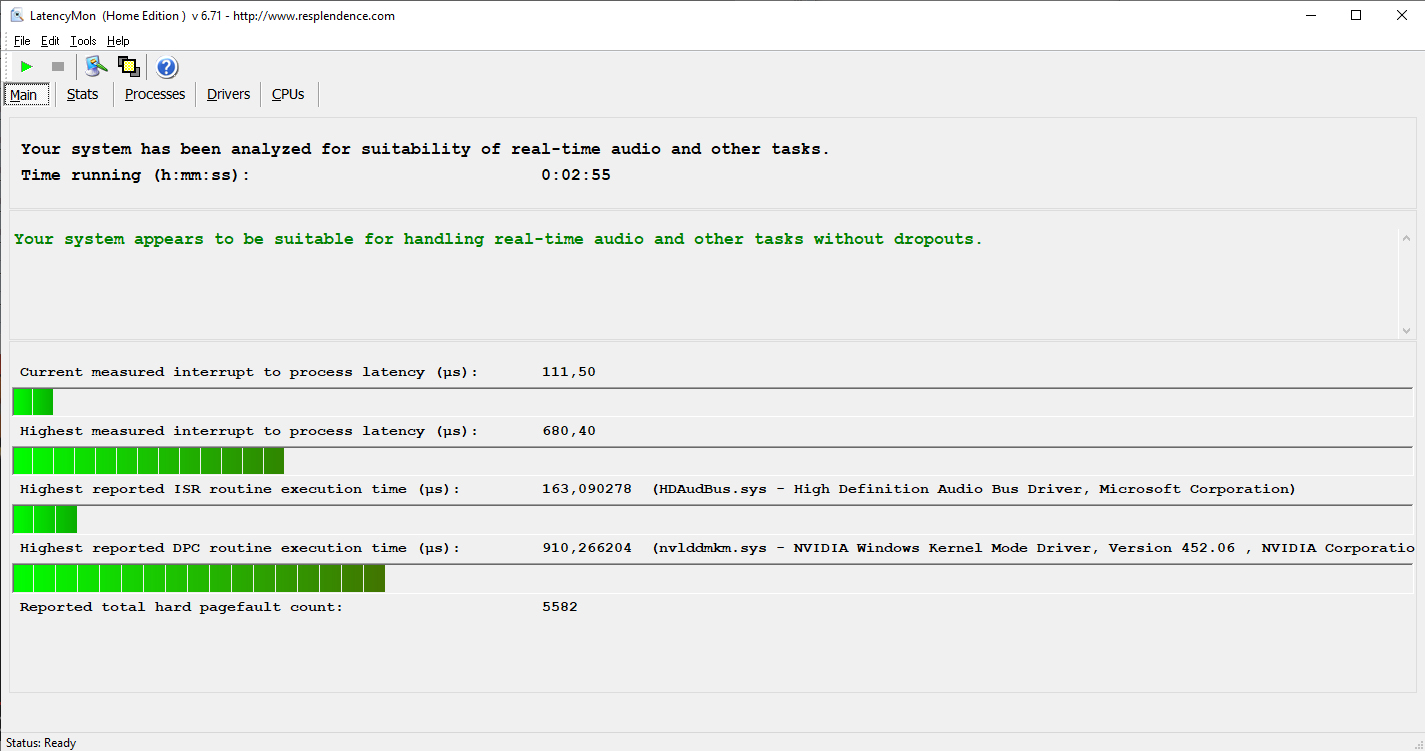
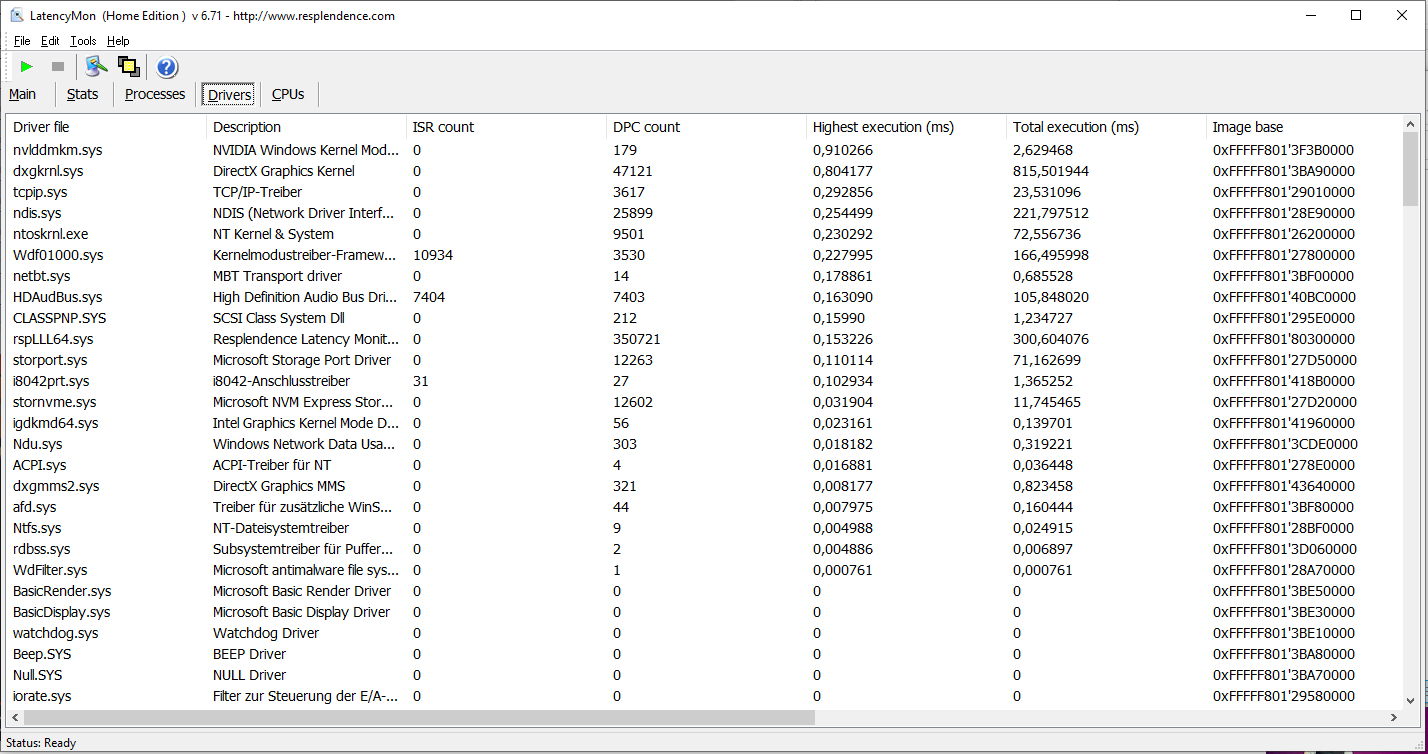
In our standardized latency monitor test (web surfing, 4K video playback, high-load Prime95), we couldn't observe any issues with the DPC latencies. The system seems to be suitable for real-time video and audio-editing.
| DPC Latencies / LatencyMon - interrupt to process latency (max), Web, Youtube, Prime95 | |
| Asus TUF A17 FA706IU-AS76 | |
| MSI GE75 Raider 10SE-008US | |
| MSI Bravo 17 A4DDR | |
| Aorus 7 KB | |
| Acer Nitro 5 AN517-52-77DS | |
| Nexoc GH7 716IG | |
* ... smaller is better
Storage
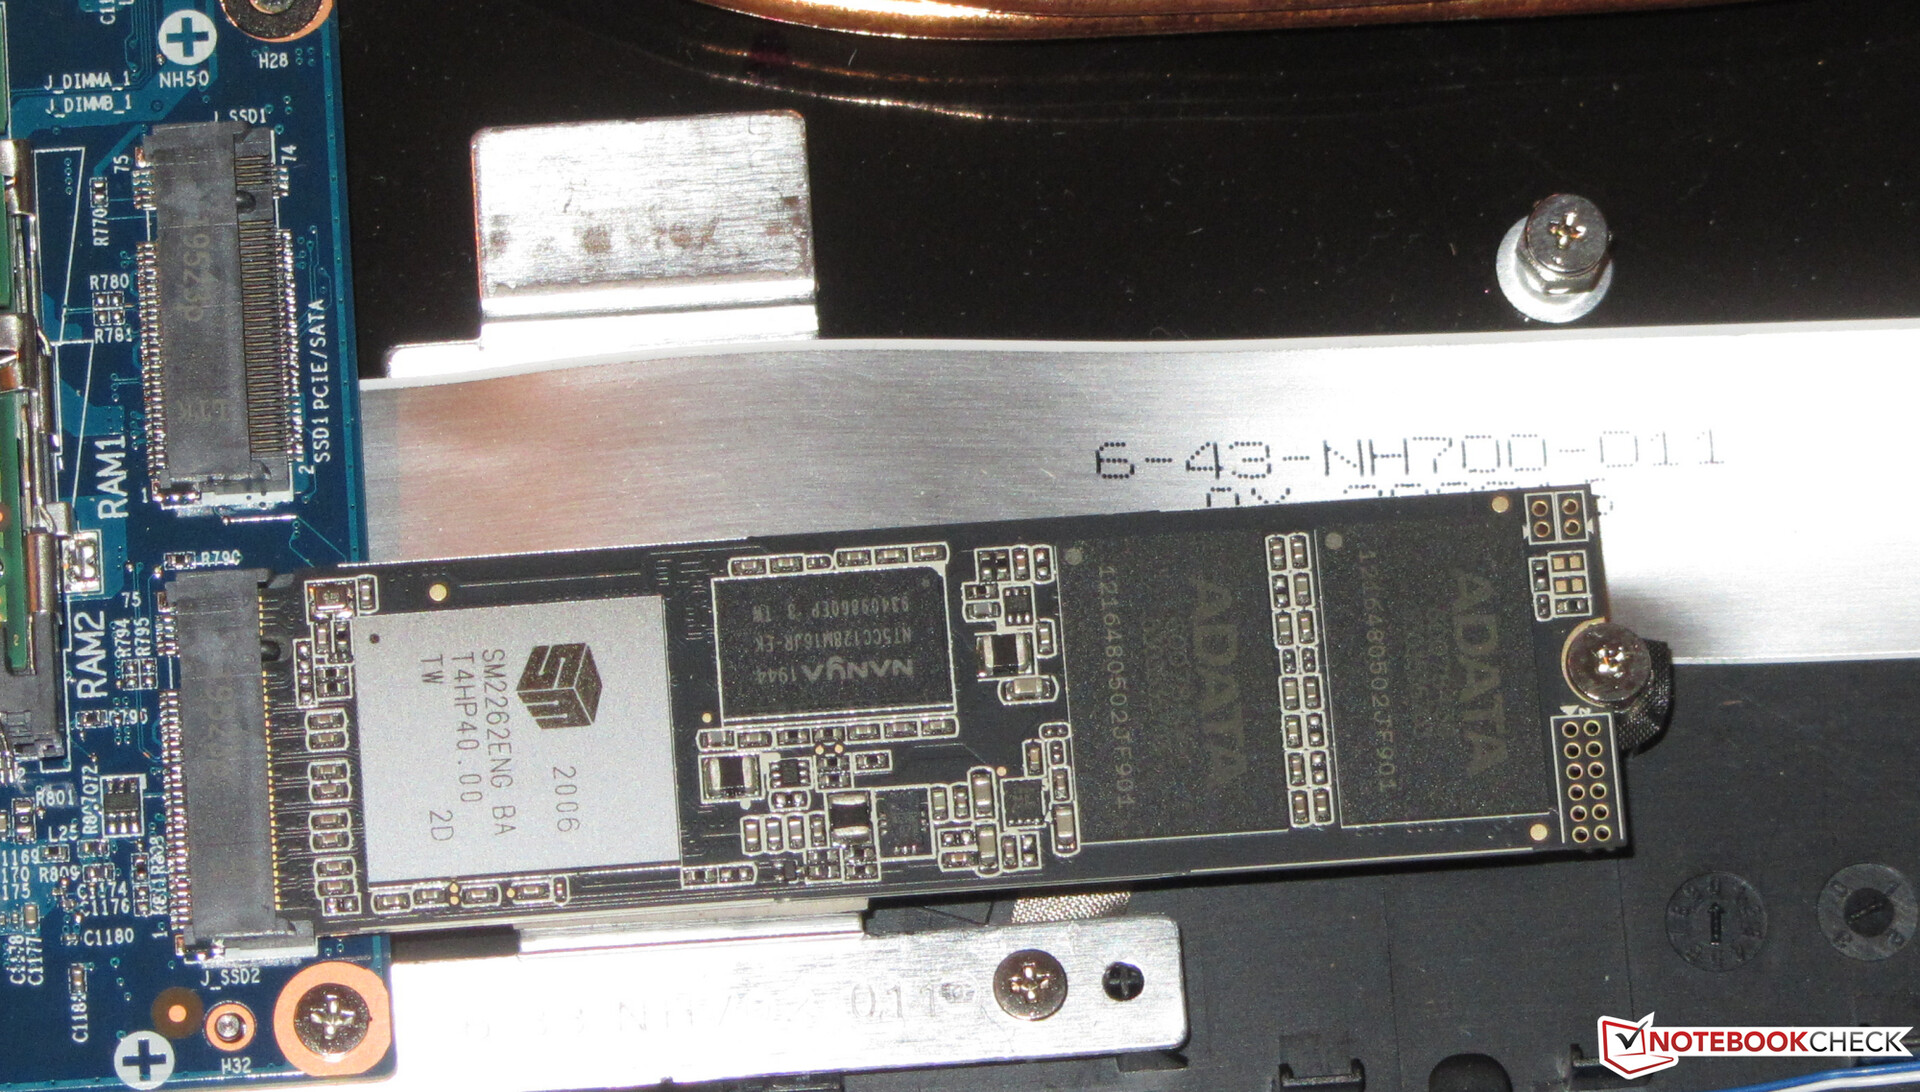
The system drive is an NVMe SSD (M.2 2280) from ADATA that provides 512 GB of storage space. The transfer rates of the SSD are very good.
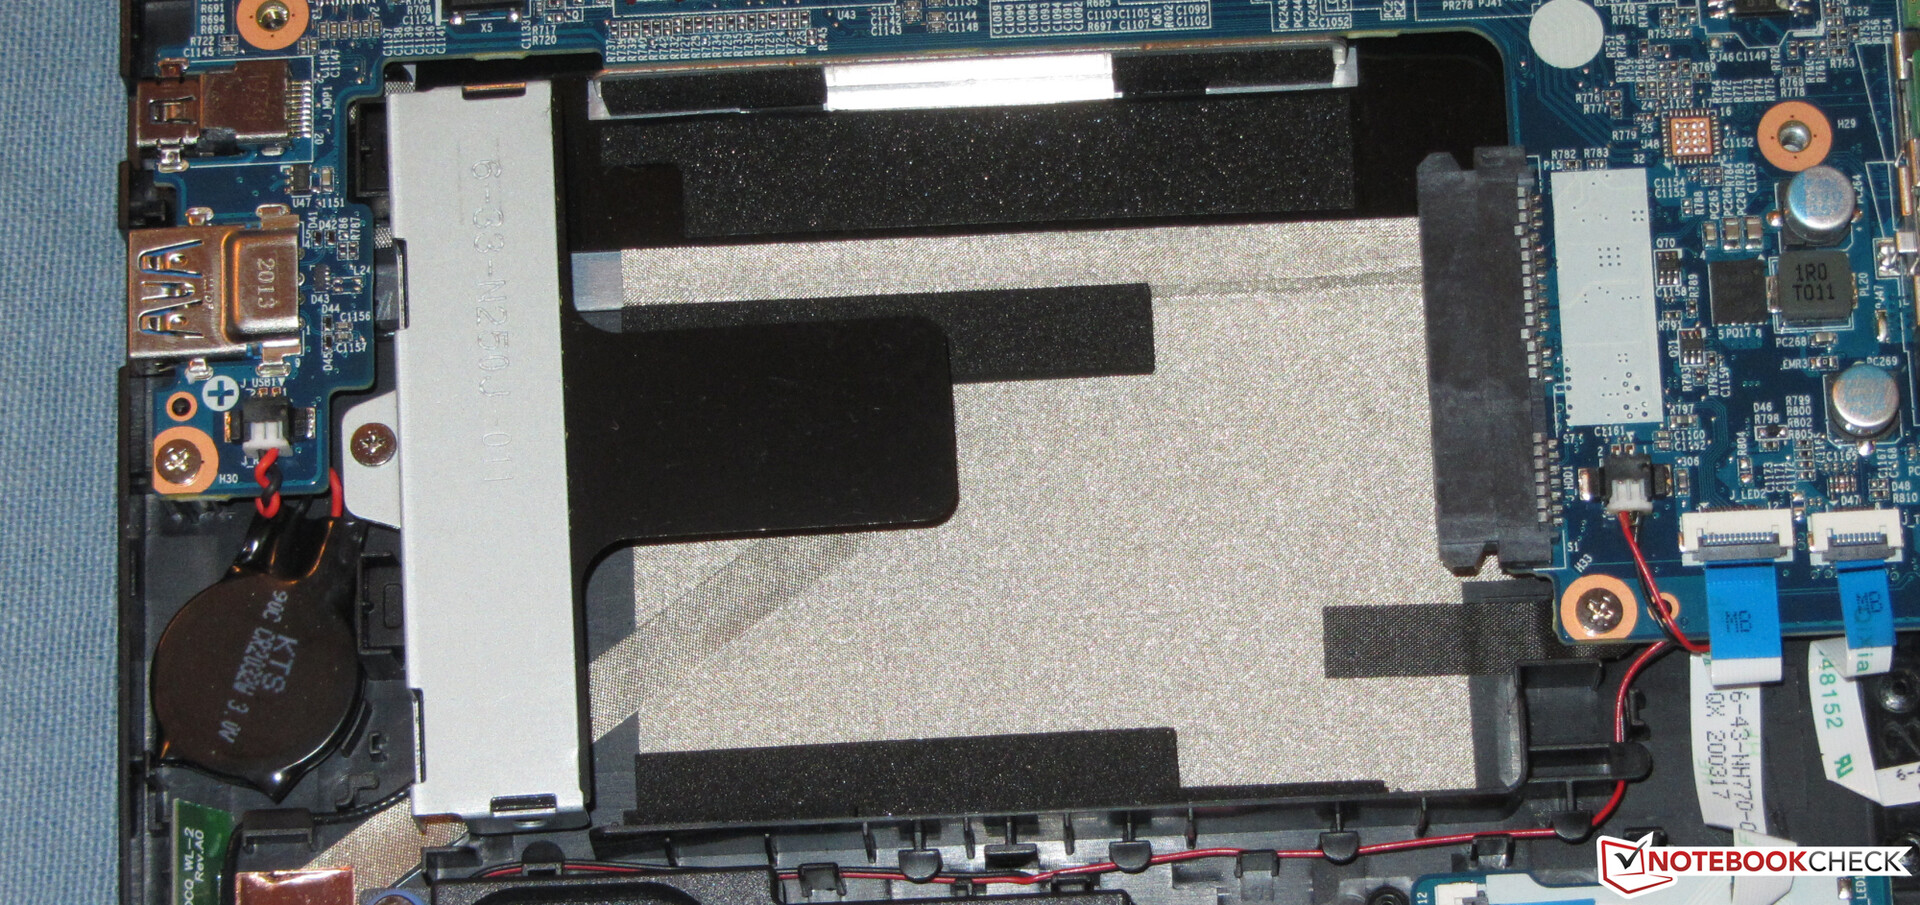
The laptop contains a total of two M.2 2280 slots (1x NVMe/SATA, 1x NVMe). If both slots are equipped with NVMe SSDs, they could form a RAID 0 or RAID 1 array if required. In addition, there's also room for a 2.5-inch storage drive. The mounting frame and SATA slot are available.

| Aorus 7 KB ADATA XPG SX8200 Pro (ASX8200PNP-512GT) | MSI GE75 Raider 10SE-008US Samsung SSD PM981 MZVLB512HAJQ | Nexoc GH7 716IG Samsung SSD 970 EVO Plus 500GB | MSI Bravo 17 A4DDR Toshiba KBG30ZMV512G | Asus TUF A17 FA706IU-AS76 Intel SSD 660p 1TB SSDPEKNW010T8 | Lenovo Legion Y740-17IRH WDC PC SN520 SDAPMUW-128G | Acer Nitro 5 AN517-52-77DS WDC PC SN530 SDBPNPZ-1T00 | |
|---|---|---|---|---|---|---|---|
| CrystalDiskMark 5.2 / 6 | -9% | 18% | -41% | -13% | -53% | -22% | |
| Write 4K | 158.7 | 139.2 -12% | 201.6 27% | 94.6 -40% | 189.7 20% | 102.7 -35% | 140 -12% |
| Read 4K | 60.5 | 53 -12% | 54.8 -9% | 47.12 -22% | 62.3 3% | 29.12 -52% | 49.04 -19% |
| Write Seq | 2365 | 1950 -18% | 2999 27% | 850 -64% | 1681 -29% | 362.2 -85% | 1963 -17% |
| Read Seq | 2696 | 2328 -14% | 3023 12% | 1157 -57% | 1608 -40% | 1010 -63% | 1455 -46% |
| Write 4K Q32T1 | 418.4 | 408.9 -2% | 545 30% | 277.7 -34% | 468.6 12% | 298.1 -29% | 398.2 -5% |
| Read 4K Q32T1 | 546 | 551 1% | 636 16% | 546 0% | 541 -1% | 349.6 -36% | 461.9 -15% |
| Write Seq Q32T1 | 2471 | 1938 -22% | 3262 32% | 908 -63% | 1770 -28% | 788 -68% | 1969 -20% |
| Read Seq Q32T1 | 3242 | 3467 7% | 3550 10% | 1632 -50% | 1898 -41% | 1490 -54% | 1927 -41% |
| AS SSD | 9% | 51% | -79% | -41% | -80% | -7% | |
| Seq Read | 2844 | 2036 -28% | 3008 6% | 1420 -50% | 1320 -54% | 1339 -53% | 1804 -37% |
| Seq Write | 2240 | 1835 -18% | 2521 13% | 922 -59% | 1539 -31% | 688 -69% | 1922 -14% |
| 4K Read | 53.5 | 60.6 13% | 64.3 20% | 48.51 -9% | 56.3 5% | 23.23 -57% | 38.21 -29% |
| 4K Write | 121.6 | 127.2 5% | 142.5 17% | 116.8 -4% | 158.5 30% | 98.8 -19% | 105 -14% |
| 4K-64 Read | 714 | 1601 124% | 1664 133% | 928 30% | 586 -18% | 300.9 -58% | 976 37% |
| 4K-64 Write | 1221 | 1734 42% | 2447 100% | 345.4 -72% | 820 -33% | 204.6 -83% | 1150 -6% |
| Access Time Read * | 0.043 | 0.049 -14% | 0.047 -9% | 0.089 -107% | 0.043 -0% | 0.184 -328% | |
| Access Time Write * | 0.031 | 0.09 -190% | 0.026 16% | 0.189 -510% | 0.113 -265% | 0.037 -19% | 0.045 -45% |
| Score Read | 1052 | 1865 77% | 2029 93% | 1119 6% | 775 -26% | 458 -56% | 1194 13% |
| Score Write | 1567 | 2045 31% | 2842 81% | 554 -65% | 1132 -28% | 372 -76% | 1747 11% |
| Score Total | 3141 | 4863 55% | 5893 88% | 2232 -29% | 2333 -26% | 1038 -67% | 3563 13% |
| Total Average (Program / Settings) | 0% /
1% | 35% /
37% | -60% /
-63% | -27% /
-29% | -67% /
-69% | -15% /
-14% |
* ... smaller is better
Continuous load read: DiskSpd Read Loop, Queue Depth 8
Graphics card
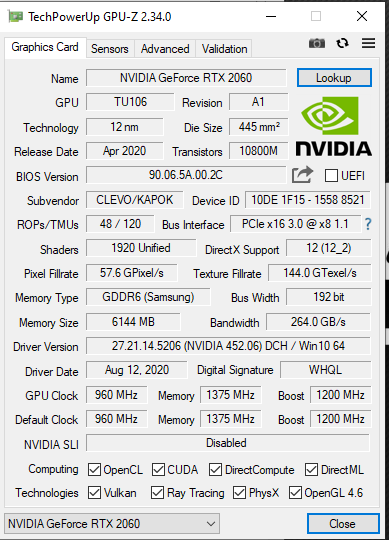
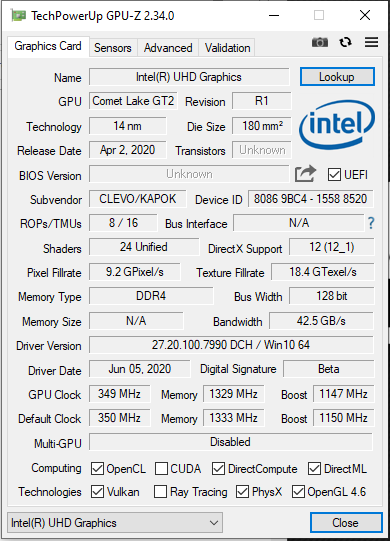
The dedicated high-end GeForce RTX 2060 (Turing) GPU delivers 3DMark results at the expected level. However, the results are slightly behind those of the MSI GE75 Raider 10SE equipped with the same CPU-GPU combination. The RTX 2060 can access fast GDDR6 graphics memory (6,144 MB). Furthermore, the UHD Graphics 630 chip that's integrated into the processor is active, and the laptop works with Nvidia's Optimus graphics-switching solution.
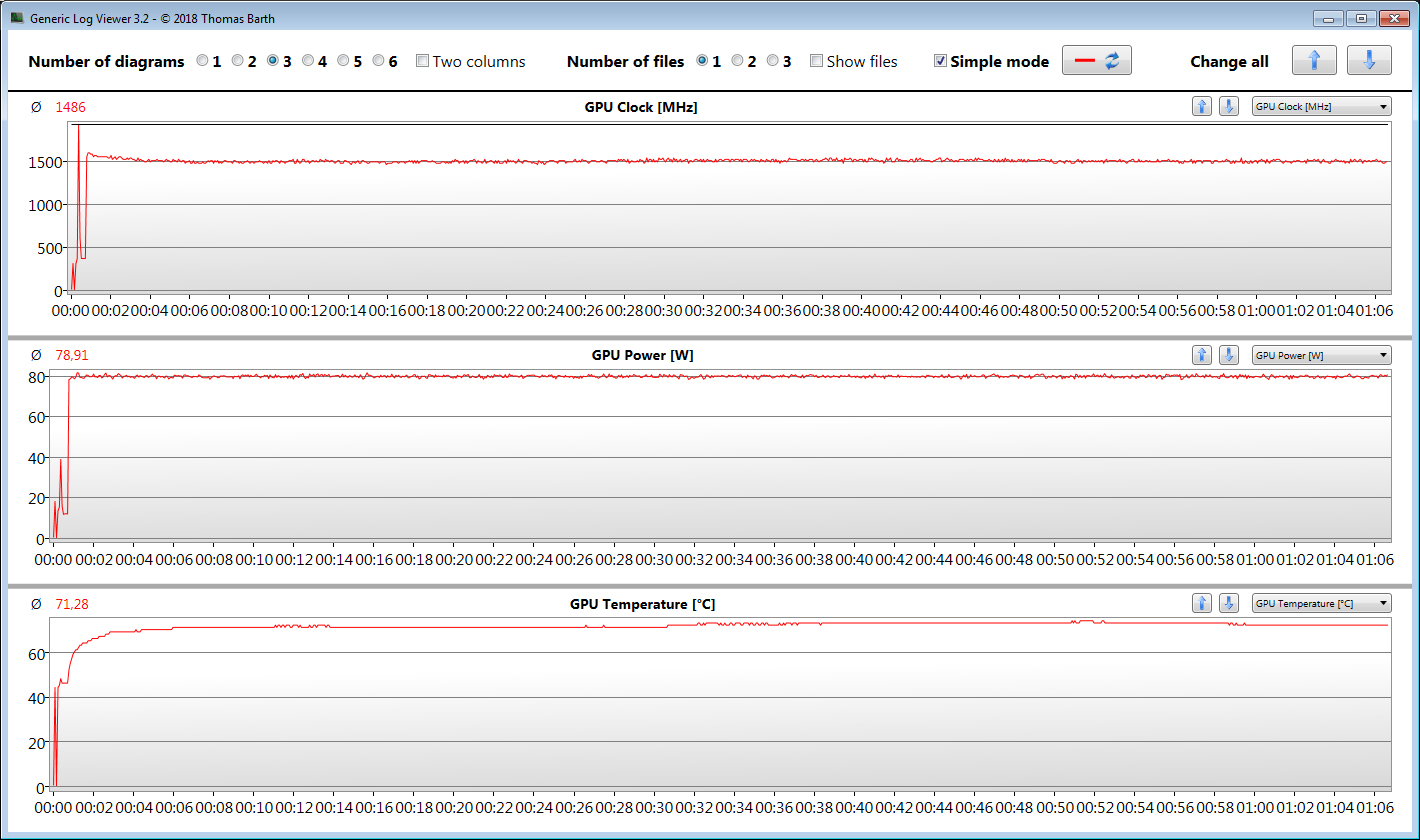
Nvidia specifies a speed level between 960 MHz (base) and 1,200 MHz (boost) for this DirectX 12 GPU. Higher speeds are feasible if the GPU doesn't reach a specified temperature and/or energy threshold. In this way, we register a maximum of 1,908 MHz. In addition, our The Witcher 3 test is run at an average speed of 1,486 MHz.
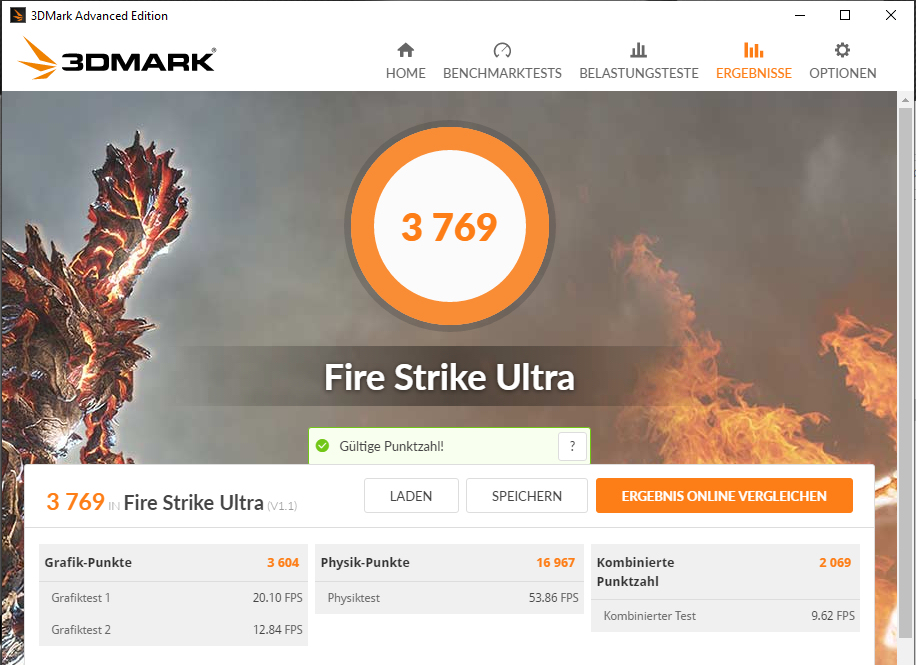
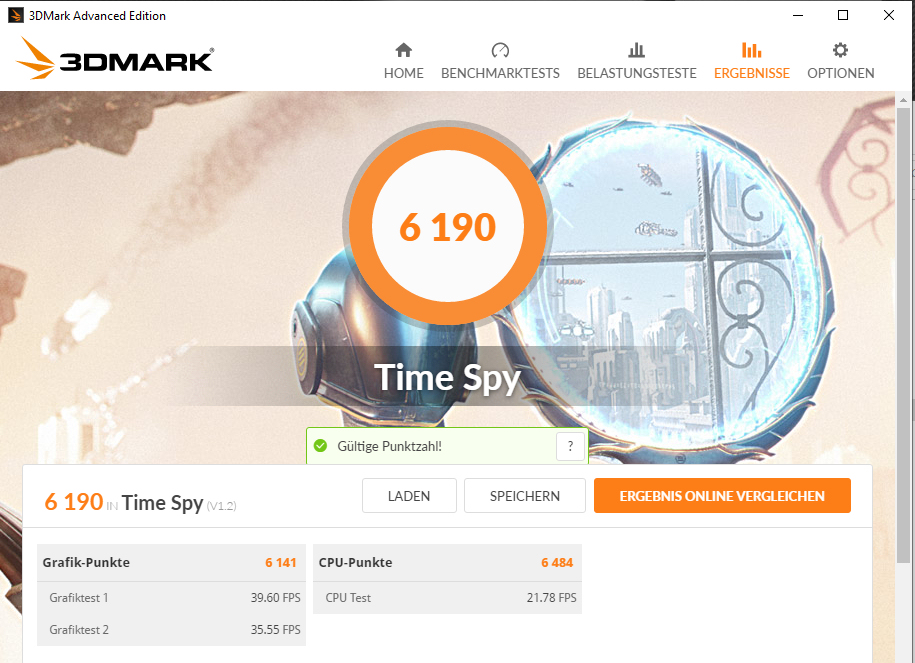
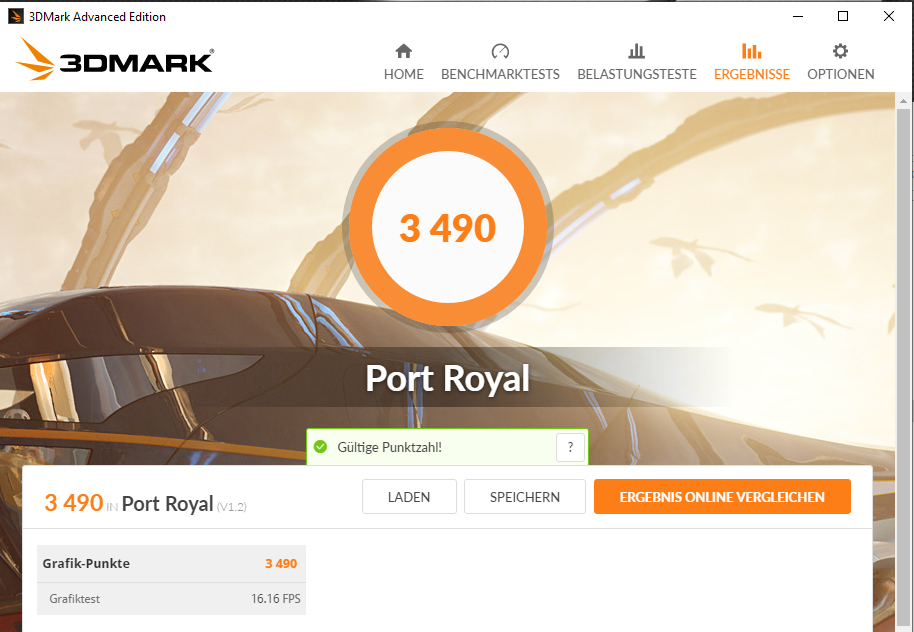
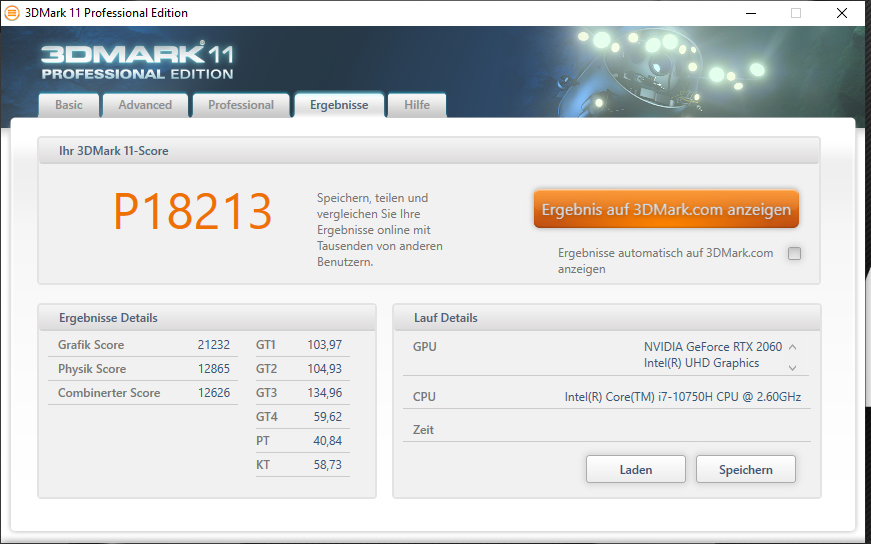
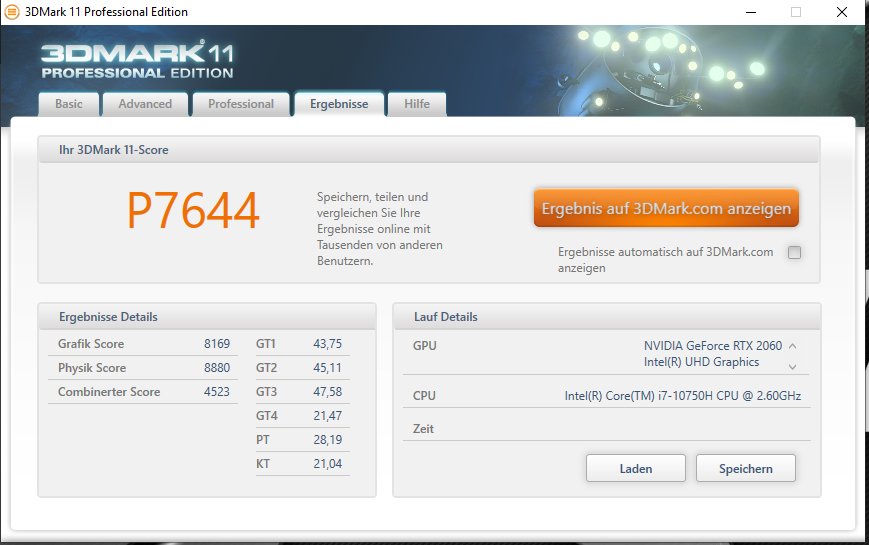
| 3DMark 11 Performance | 18213 points | |
| 3DMark Cloud Gate Standard Score | 36217 points | |
| 3DMark Fire Strike Score | 14690 points | |
| 3DMark Time Spy Score | 6190 points | |
Help | ||
Gaming performance
The Aorus laptop can bring all the latest games smoothly onto the screen - at Full HD resolution and high to maximum quality settings. The GPU can also handle resolutions beyond Full HD (an appropriate monitor would have to be plugged in for this) - at reduced quality levels.
| The Witcher 3 - 1920x1080 Ultra Graphics & Postprocessing (HBAO+) | |
| Average of class Gaming (8.61 - 216, n=225, last 2 years) | |
| MSI GE75 Raider 10SE-008US | |
| Acer Nitro 5 AN517-52-77DS | |
| Aorus 7 KB | |
| Average NVIDIA GeForce RTX 2060 Mobile (50.6 - 74, n=40) | |
| Lenovo Legion Y740-17IRH | |
| Asus TUF A17 FA706IU-AS76 | |
| Nexoc GH7 716IG | |
| MSI Bravo 17 A4DDR | |
| Shadow of the Tomb Raider - 1920x1080 Highest Preset AA:T | |
| Average of class Gaming (27 - 271, n=30, last 2 years) | |
| MSI GE75 Raider 10SE-008US | |
| Lenovo Legion Y740-17IRH | |
| Aorus 7 KB | |
| Average NVIDIA GeForce RTX 2060 Mobile (54 - 86, n=22) | |
| Asus TUF A17 FA706IU-AS76 | |
| Acer Nitro 5 AN517-52-77DS | |
| MSI Bravo 17 A4DDR | |
| F1 2020 - 1920x1080 Ultra High Preset AA:T AF:16x | |
| Average of class Gaming (12.4 - 305, n=6, last 2 years) | |
| Average NVIDIA GeForce RTX 2060 Mobile (93 - 98, n=4) | |
| Aorus 7 KB | |
| Horizon Zero Dawn - 1920x1080 Ultimate Quality | |
| Average of class Gaming (108.3 - 163, n=5, last 2 years) | |
| Average NVIDIA GeForce RTX 2060 Mobile (54 - 67, n=6) | |
| Aorus 7 KB | |
| Serious Sam 4 - 1920x1080 Ultra (DX12) AA:2xMS | |
| Average of class Gaming (42.5 - 82.9, n=2, last 2 years) | |
| Aorus 7 KB | |
| Average NVIDIA GeForce RTX 2060 Mobile (50.3 - 63.3, n=6) | |
| Gears Tactics - 1920x1080 Ultra Preset | |
| Average of class Gaming (12.4 - 125.9, n=11, last 2 years) | |
| Average NVIDIA GeForce RTX 2060 Mobile (60.7 - 71.3, n=7) | |
| Aorus 7 KB | |
| Acer Nitro 5 AN517-52-77DS | |
| MSI Bravo 17 A4DDR | |
| Flight Simulator 2020 - 1920x1080 High-End AA:TAA AF:8x | |
| Average of class Gaming (10.4 - 82.5, n=8, last 2 years) | |
| Average NVIDIA GeForce RTX 2060 Mobile (41.8 - 44.7, n=3) | |
| Aorus 7 KB | |
In order to verify whether the frame rates remain largely constant even over a prolonged period of time, we let the game The Witcher 3 run for about 60 minutes at Full HD resolution and maximum quality settings. The character is not moved. A drop in frame rates wasn't found.
| low | med. | high | ultra | |
| BioShock Infinite (2013) | 368.7 | 308.8 | 286.3 | 143.1 |
| The Witcher 3 (2015) | 269.5 | 188.3 | 107.1 | 62.8 |
| Shadow of the Tomb Raider (2018) | 121 | 95 | 86 | 76 |
| Doom Eternal (2020) | 211.1 | 139.6 | 126.2 | 121.8 |
| Gears Tactics (2020) | 235.5 | 150.5 | 97.7 | 64.7 |
| F1 2020 (2020) | 231 | 142 | 126 | 94 |
| Death Stranding (2020) | 148.4 | 99.6 | 91.9 | 88.7 |
| Horizon Zero Dawn (2020) | 128 | 84 | 70 | 54 |
| Flight Simulator 2020 (2020) | 65.5 | 55.7 | 41.8 | 30.9 |
| Serious Sam 4 (2020) | 126 | 80.9 | 74.8 | 58.7 |
| Mafia Definitive Edition (2020) | 128.3 | 77.4 | 71.1 |
Emissions - The Aorus laptop generates a lot of noise
Noise emissions
In idle usage, the fans mainly run at low speeds and are hardly noticeable. Now and then, however, they turn up significantly in idle mode. In this way, we measure sound pressure levels of up to 48 dB(A). Under load, it gets really loud at values of 57 dB(A) (stress test) and 55 dB(A) (The Witcher 3 test), respectively. Without a headset, gaming is no fun here.
For an overall lower noise level, a different energy profile must be selected within the Aorus Gaming Center. This is at the expense of performance, though.
Noise Level
| Idle |
| 31 / 33 / 48 dB(A) |
| Load |
| 57 / 57 dB(A) |
 | ||
30 dB silent 40 dB(A) audible 50 dB(A) loud |
||
min: | ||
| Aorus 7 KB i7-10750H, GeForce RTX 2060 Mobile | MSI GE75 Raider 10SE-008US i7-10750H, GeForce RTX 2060 Mobile | Nexoc GH7 716IG i7-10750H, GeForce GTX 1660 Ti Mobile | MSI Bravo 17 A4DDR R7 4800H, Radeon RX 5500M | Asus TUF A17 FA706IU-AS76 R7 4800H, GeForce GTX 1660 Ti Mobile | Lenovo Legion Y740-17IRH i7-9750H, GeForce RTX 2060 Mobile | Acer Nitro 5 AN517-52-77DS i7-10750H, GeForce RTX 2060 Mobile | |
|---|---|---|---|---|---|---|---|
| Noise | 11% | 7% | 7% | 10% | 6% | 14% | |
| off / environment * | 25 | 28.4 -14% | 25 -0% | 30 -20% | 28.7 -15% | 30 -20% | 30.2 -21% |
| Idle Minimum * | 31 | 30.2 3% | 30 3% | 33 -6% | 28.7 7% | 33 -6% | 30.2 3% |
| Idle Average * | 33 | 30.2 8% | 31 6% | 34 -3% | 30.5 8% | 34 -3% | 30.2 8% |
| Idle Maximum * | 48 | 32 33% | 33 31% | 35 27% | 32.5 32% | 35 27% | 30.2 37% |
| Load Average * | 57 | 33.2 42% | 54 5% | 39 32% | 42.5 25% | 48 16% | 41.5 27% |
| Witcher 3 ultra * | 55 | 55 -0% | 53 4% | 48 13% | 50.1 9% | 46 16% | 44.5 19% |
| Load Maximum * | 57 | 55 4% | 57 -0% | 52 9% | 53.4 6% | 49 14% | 44.6 22% |
* ... smaller is better
Temperature
Our stress test (Prime95 and FurMark run for at least an hour) is run by the processor and graphics core at 2.5 to 2.6 GHz and 1,320 MHz, respectively. The stress test represents an extreme scenario that doesn't occur in everyday life. We use this test to check whether the system remains stable even under full load.
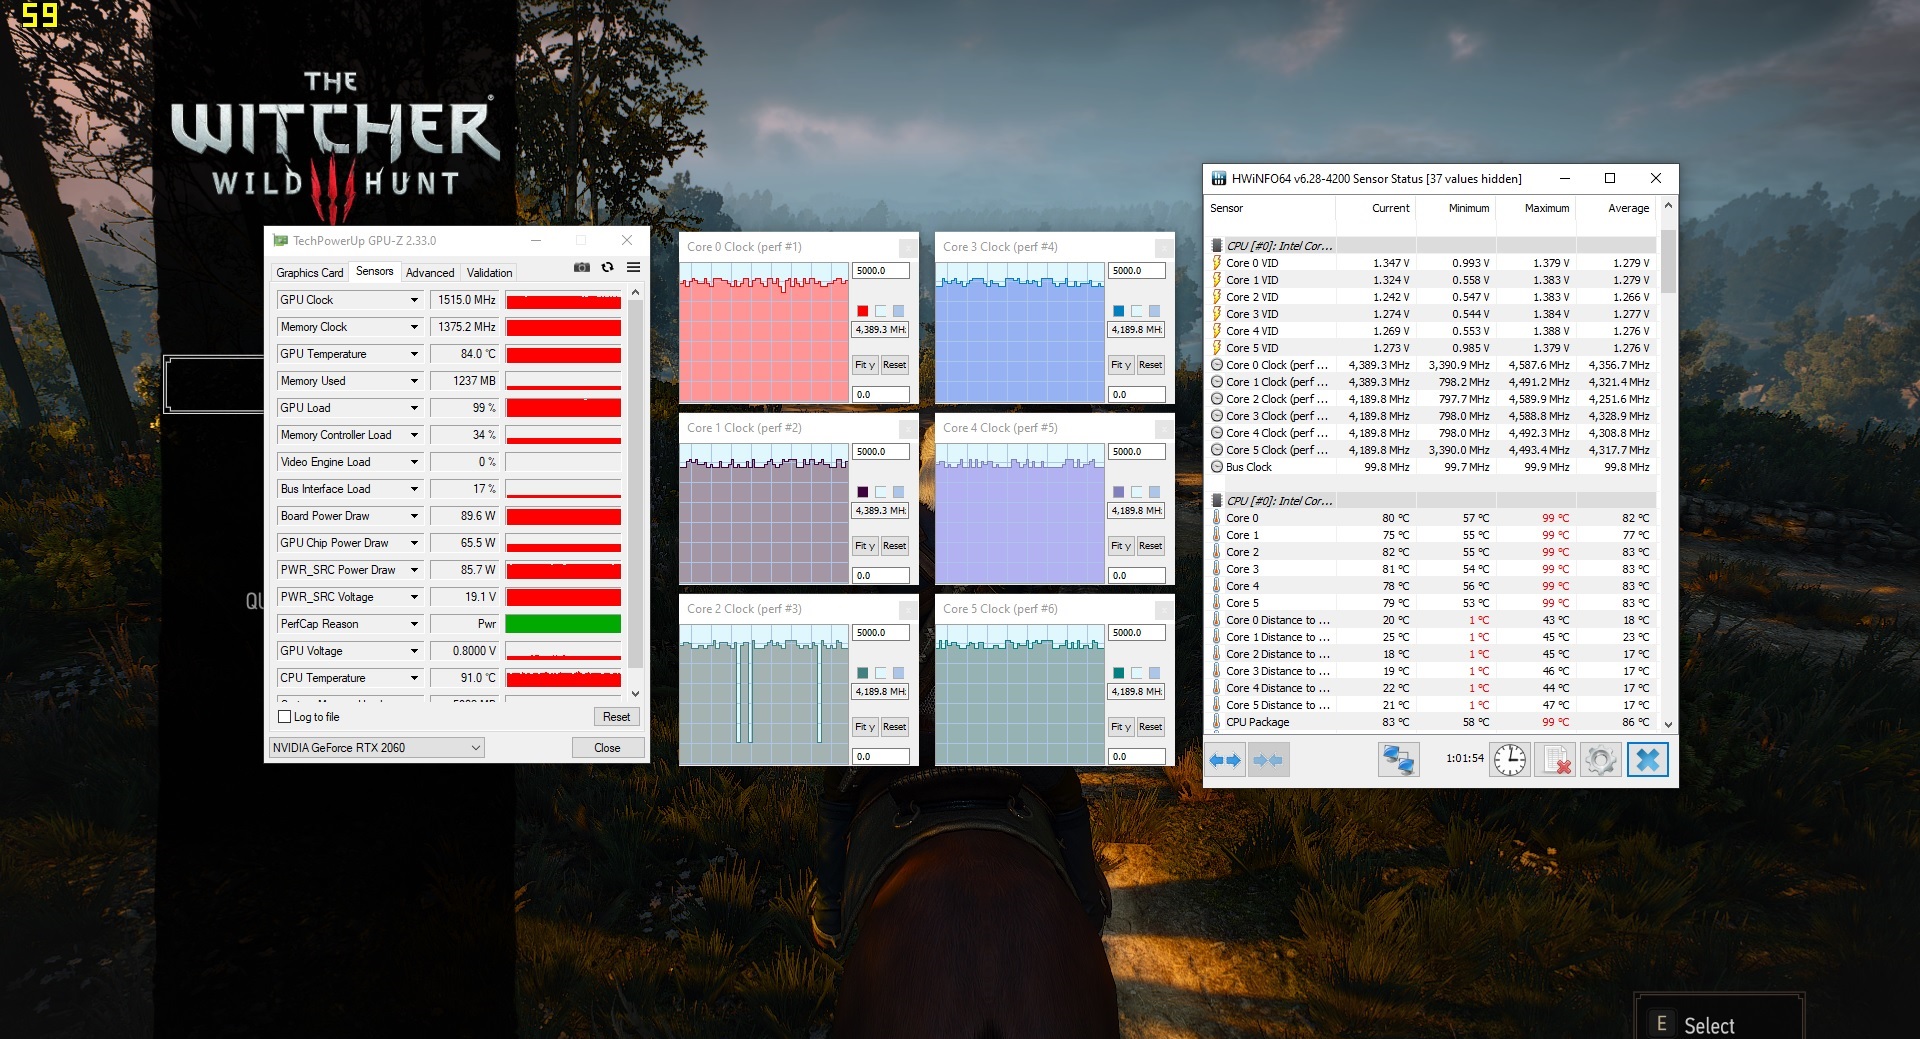
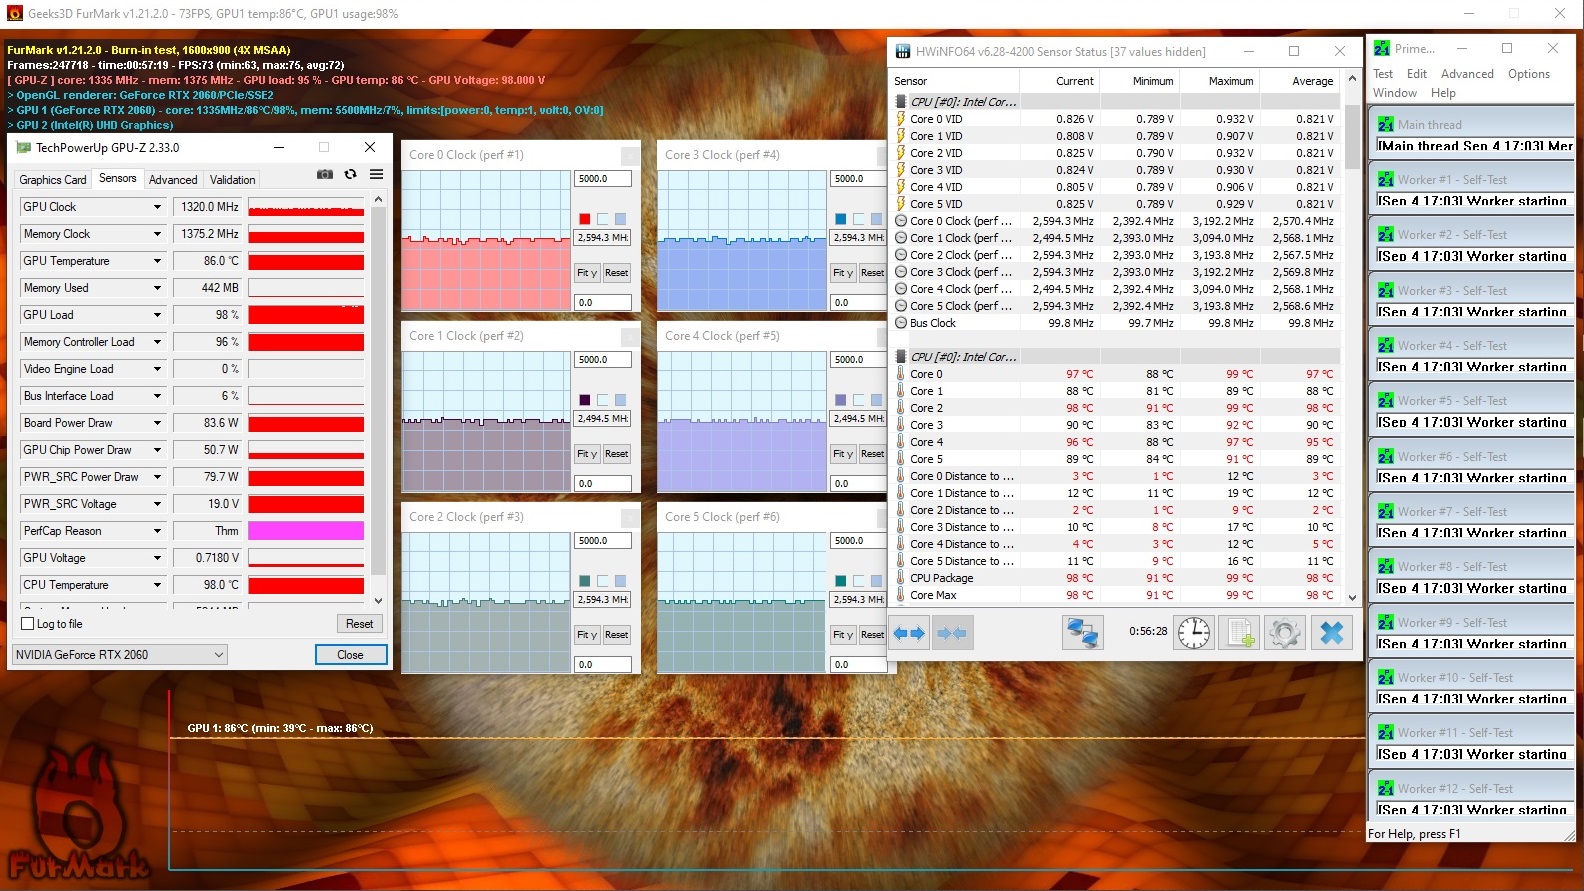
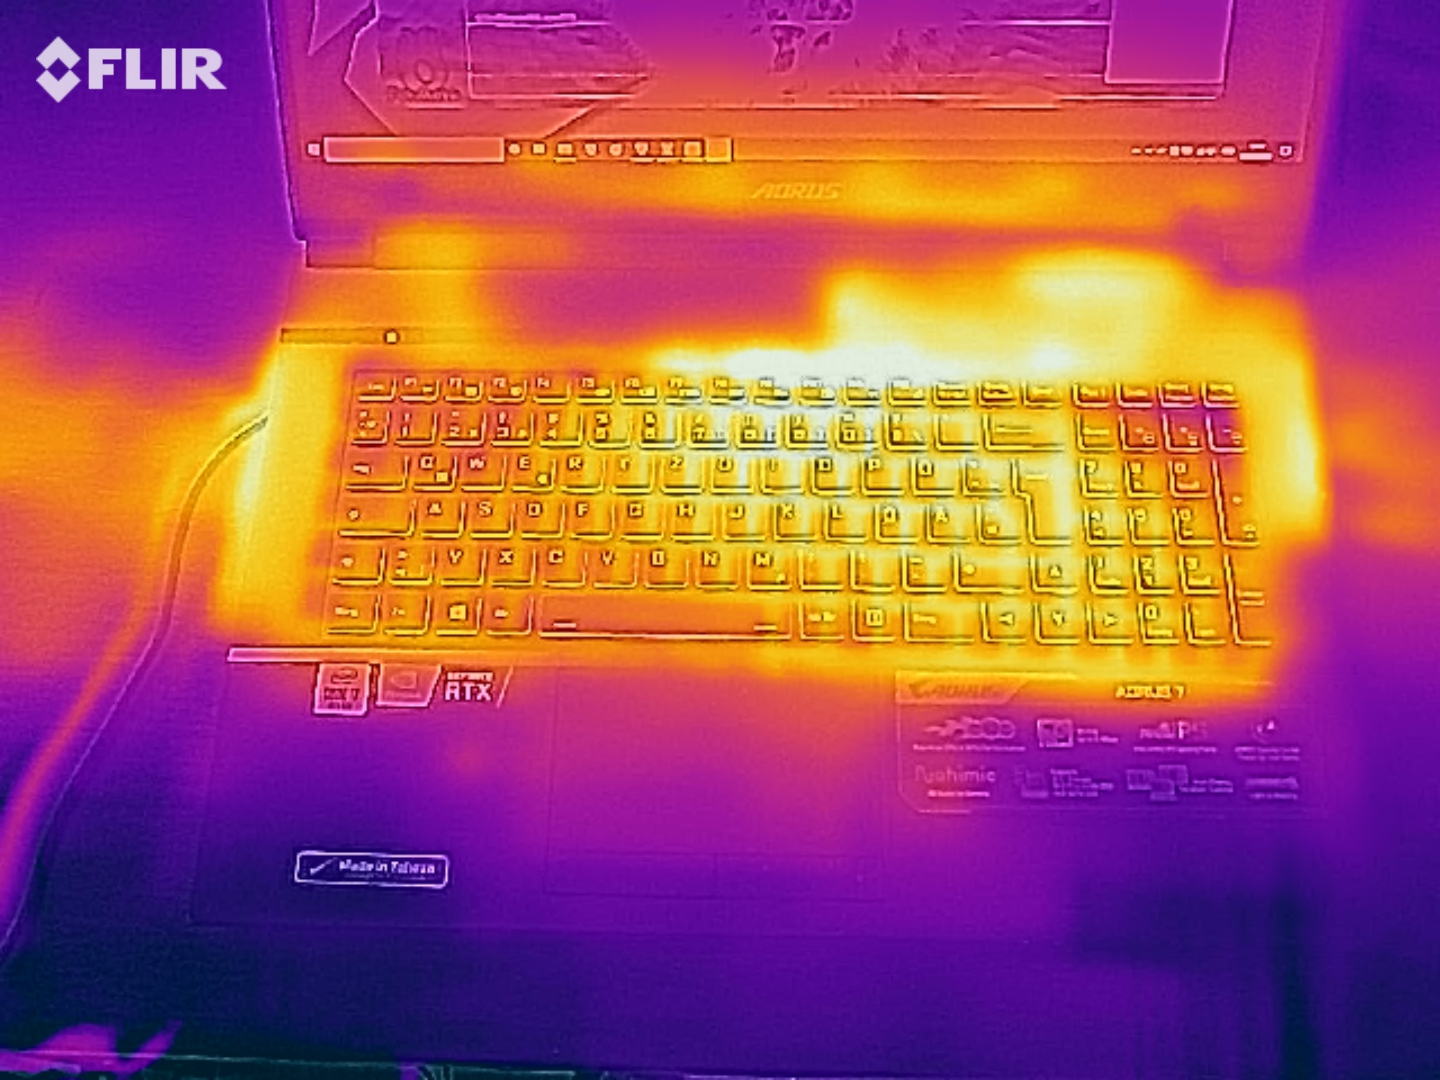
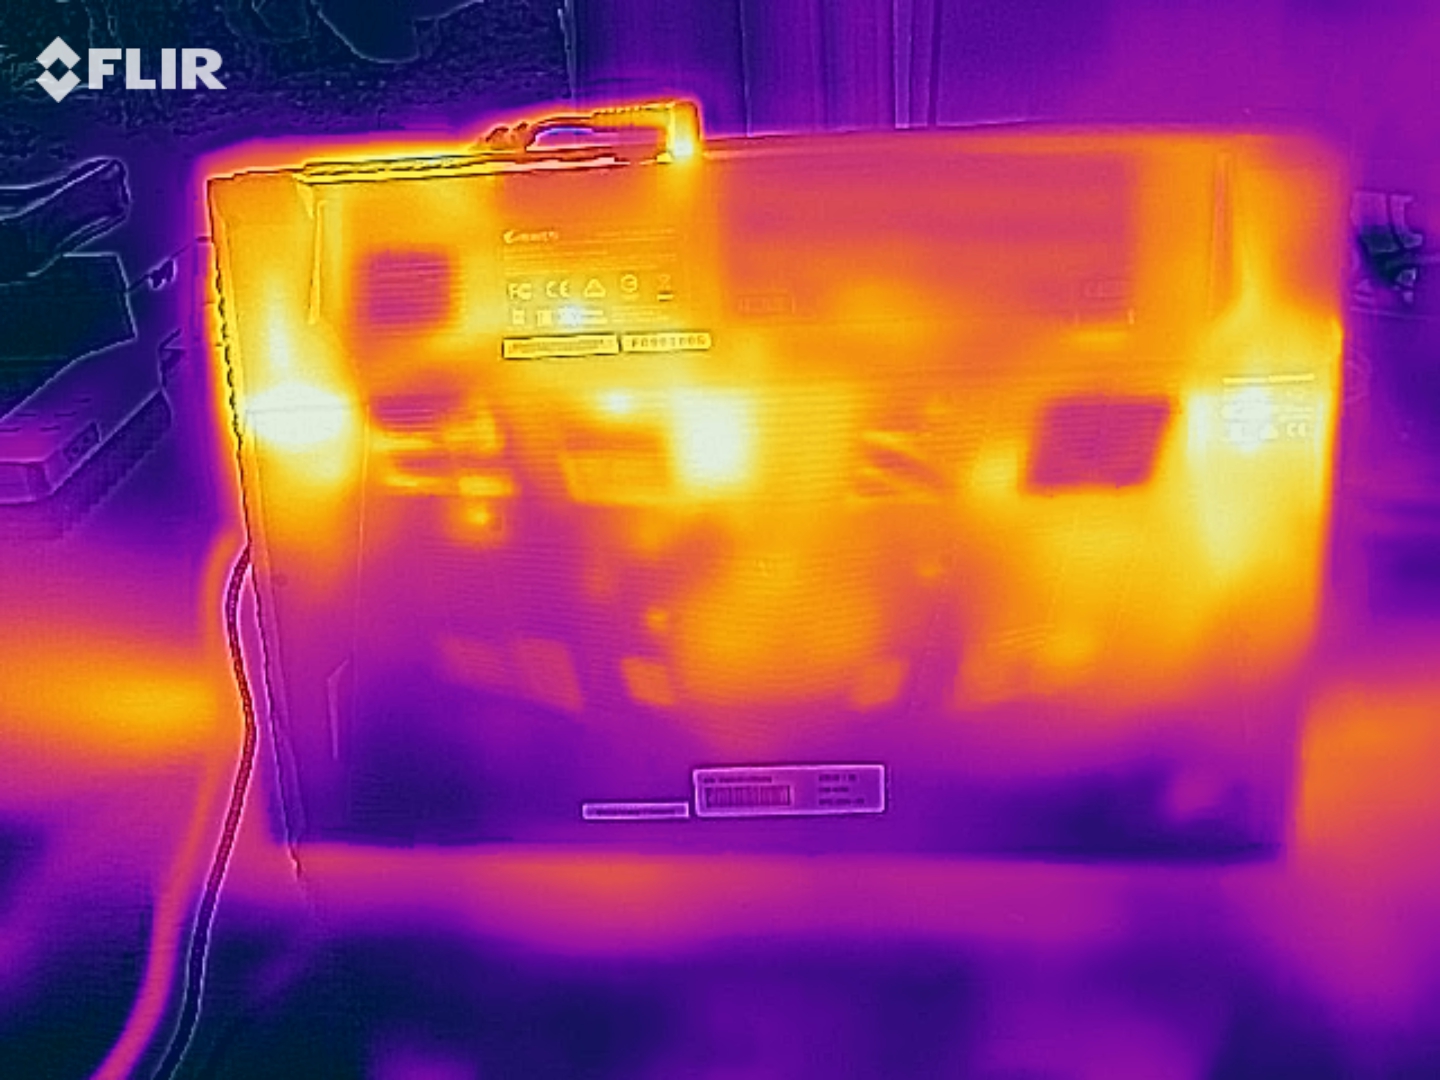
The Aorus laptop warms up noticeably under load but not excessively. During the stress test, we register temperatures just above 50 °C (~122 °F) at two measuring points. Moreover, heat development is at a similar level when performing our The Witcher 3 test. The laptop shouldn't be placed on the lap. In everyday use, heat development is lower.
(-) The maximum temperature on the upper side is 48 °C / 118 F, compared to the average of 40.4 °C / 105 F, ranging from 21.2 to 68.8 °C for the class Gaming.
(-) The bottom heats up to a maximum of 52 °C / 126 F, compared to the average of 43.2 °C / 110 F
(±) In idle usage, the average temperature for the upper side is 32.6 °C / 91 F, compared to the device average of 33.8 °C / 93 F.
(-) Playing The Witcher 3, the average temperature for the upper side is 41.1 °C / 106 F, compared to the device average of 33.8 °C / 93 F.
(±) The palmrests and touchpad can get very hot to the touch with a maximum of 36 °C / 96.8 F.
(-) The average temperature of the palmrest area of similar devices was 28.9 °C / 84 F (-7.1 °C / -12.8 F).
| Aorus 7 KB i7-10750H, GeForce RTX 2060 Mobile | MSI GE75 Raider 10SE-008US i7-10750H, GeForce RTX 2060 Mobile | Nexoc GH7 716IG i7-10750H, GeForce GTX 1660 Ti Mobile | MSI Bravo 17 A4DDR R7 4800H, Radeon RX 5500M | Asus TUF A17 FA706IU-AS76 R7 4800H, GeForce GTX 1660 Ti Mobile | Lenovo Legion Y740-17IRH i7-9750H, GeForce RTX 2060 Mobile | Acer Nitro 5 AN517-52-77DS i7-10750H, GeForce RTX 2060 Mobile | |
|---|---|---|---|---|---|---|---|
| Heat | 5% | 9% | 17% | 10% | 12% | 12% | |
| Maximum Upper Side * | 48 | 44.2 8% | 49 -2% | 48 -0% | 47.6 1% | 43 10% | 50.6 -5% |
| Maximum Bottom * | 52 | 49 6% | 54 -4% | 50 4% | 50.8 2% | 46 12% | 53.8 -3% |
| Idle Upper Side * | 37 | 33.6 9% | 29 22% | 25 32% | 33 11% | 31 16% | 26.6 28% |
| Idle Bottom * | 38 | 39.6 -4% | 30 21% | 26 32% | 29 24% | 34 11% | 27.8 27% |
* ... smaller is better
Speakers
The stereo speakers are located in the front area of the bottom of the device. They produce decent sound that hardly has any bass, though. For a better sound experience, headphones or external speakers should be used.
Aorus 7 KB audio analysis
(+) | speakers can play relatively loud (85 dB)
Bass 100 - 315 Hz
(-) | nearly no bass - on average 28.9% lower than median
(±) | linearity of bass is average (13.5% delta to prev. frequency)
Mids 400 - 2000 Hz
(+) | balanced mids - only 3.3% away from median
(+) | mids are linear (3.8% delta to prev. frequency)
Highs 2 - 16 kHz
(+) | balanced highs - only 2.9% away from median
(+) | highs are linear (4.7% delta to prev. frequency)
Overall 100 - 16.000 Hz
(±) | linearity of overall sound is average (16.9% difference to median)
Compared to same class
» 41% of all tested devices in this class were better, 11% similar, 47% worse
» The best had a delta of 6%, average was 18%, worst was 132%
Compared to all devices tested
» 25% of all tested devices were better, 7% similar, 68% worse
» The best had a delta of 4%, average was 25%, worst was 134%
Energy management - Aorus with acceptable battery life
Energy consumption
We register a maximum power consumption of 22 watts in idle usage. The stress test lets the demand increase up to 225 watts. In gaming mode (The Witcher 3 test), energy consumption is lower at an average of 161 watts. The power adapter's output is 180 watts.
| Off / Standby | |
| Idle | |
| Load |
|
| Aorus 7 KB i7-10750H, GeForce RTX 2060 Mobile | MSI GE75 Raider 10SE-008US i7-10750H, GeForce RTX 2060 Mobile | Nexoc GH7 716IG i7-10750H, GeForce GTX 1660 Ti Mobile | MSI Bravo 17 A4DDR R7 4800H, Radeon RX 5500M | Asus TUF A17 FA706IU-AS76 R7 4800H, GeForce GTX 1660 Ti Mobile | Lenovo Legion Y740-17IRH i7-9750H, GeForce RTX 2060 Mobile | Acer Nitro 5 AN517-52-77DS i7-10750H, GeForce RTX 2060 Mobile | |
|---|---|---|---|---|---|---|---|
| Power Consumption | -5% | 26% | 33% | 29% | -1% | 35% | |
| Idle Minimum * | 15 | 14.7 2% | 5 67% | 9 40% | 7.4 51% | 20 -33% | 5.4 64% |
| Idle Average * | 17 | 20.4 -20% | 10 41% | 10 41% | 10.5 38% | 21 -24% | 9.8 42% |
| Idle Maximum * | 22 | 26.9 -22% | 20 9% | 13 41% | 17 23% | 26 -18% | 10.9 50% |
| Load Average * | 137 | 93.2 32% | 113 18% | 69 50% | 103.7 24% | 97 29% | 104 24% |
| Witcher 3 ultra * | 161 | 185.4 -15% | 132 18% | 128 20% | 128.1 20% | 139 14% | 134.3 17% |
| Load Maximum * | 225 | 237.8 -6% | 225 -0% | 214 5% | 183.2 19% | 168 25% | 193 14% |
* ... smaller is better
Battery life
The battery life doesn't knock anyone's socks off, but it's okay for a gaming laptop. Our WLAN test (accessing websites using a script) and video test (the short film Big Buck Bunny (H.264 encoding, Full HD) running in a loop) are completed by the 15.6-incher after 4:44 hours and 5:33 hours, respectively.
To perform the runtime tests, we chose the "Entertainment Mode" energy profile, since the "Performance Mode" noticeably shortens the runtimes. Consequently, the latter leads to a WLAN runtime of 79 minutes.
| Aorus 7 KB i7-10750H, GeForce RTX 2060 Mobile, 49 Wh | MSI GE75 Raider 10SE-008US i7-10750H, GeForce RTX 2060 Mobile, 65 Wh | Nexoc GH7 716IG i7-10750H, GeForce GTX 1660 Ti Mobile, 48.96 Wh | MSI Bravo 17 A4DDR R7 4800H, Radeon RX 5500M, 51 Wh | Asus TUF A17 FA706IU-AS76 R7 4800H, GeForce GTX 1660 Ti Mobile, 90 Wh | Lenovo Legion Y740-17IRH i7-9750H, GeForce RTX 2060 Mobile, 76 Wh | Acer Nitro 5 AN517-52-77DS i7-10750H, GeForce RTX 2060 Mobile, 57.48 Wh | |
|---|---|---|---|---|---|---|---|
| Battery Runtime | -22% | -10% | 3% | 89% | -14% | 43% | |
| Reader / Idle | 513 | 536 4% | 464 -10% | 543 6% | 414 -19% | 661 29% | |
| H.264 | 333 | 260 -22% | 439 32% | ||||
| WiFi v1.3 | 284 | 222 -22% | 249 -12% | 314 11% | 512 80% | 256 -10% | 396 39% |
| Load | 70 | 55 -21% | 75 7% | 196 180% | 67 -4% | 120 71% |
Pros
Cons
Verdict
With the Aorus 7 KB, Gigabyte has a 17.3-inch gaming laptop in its range that does what it's supposed to do: Thanks to the Core i7-10750H processor and the GeForce RTX 2060 GPU, it brings all the latest games smoothly onto the screen. Prolonged load doesn't lead to performance drops.
With the Aorus 7 KB, Gigabyte delivers a well-rounded gaming laptop at a reasonable price.
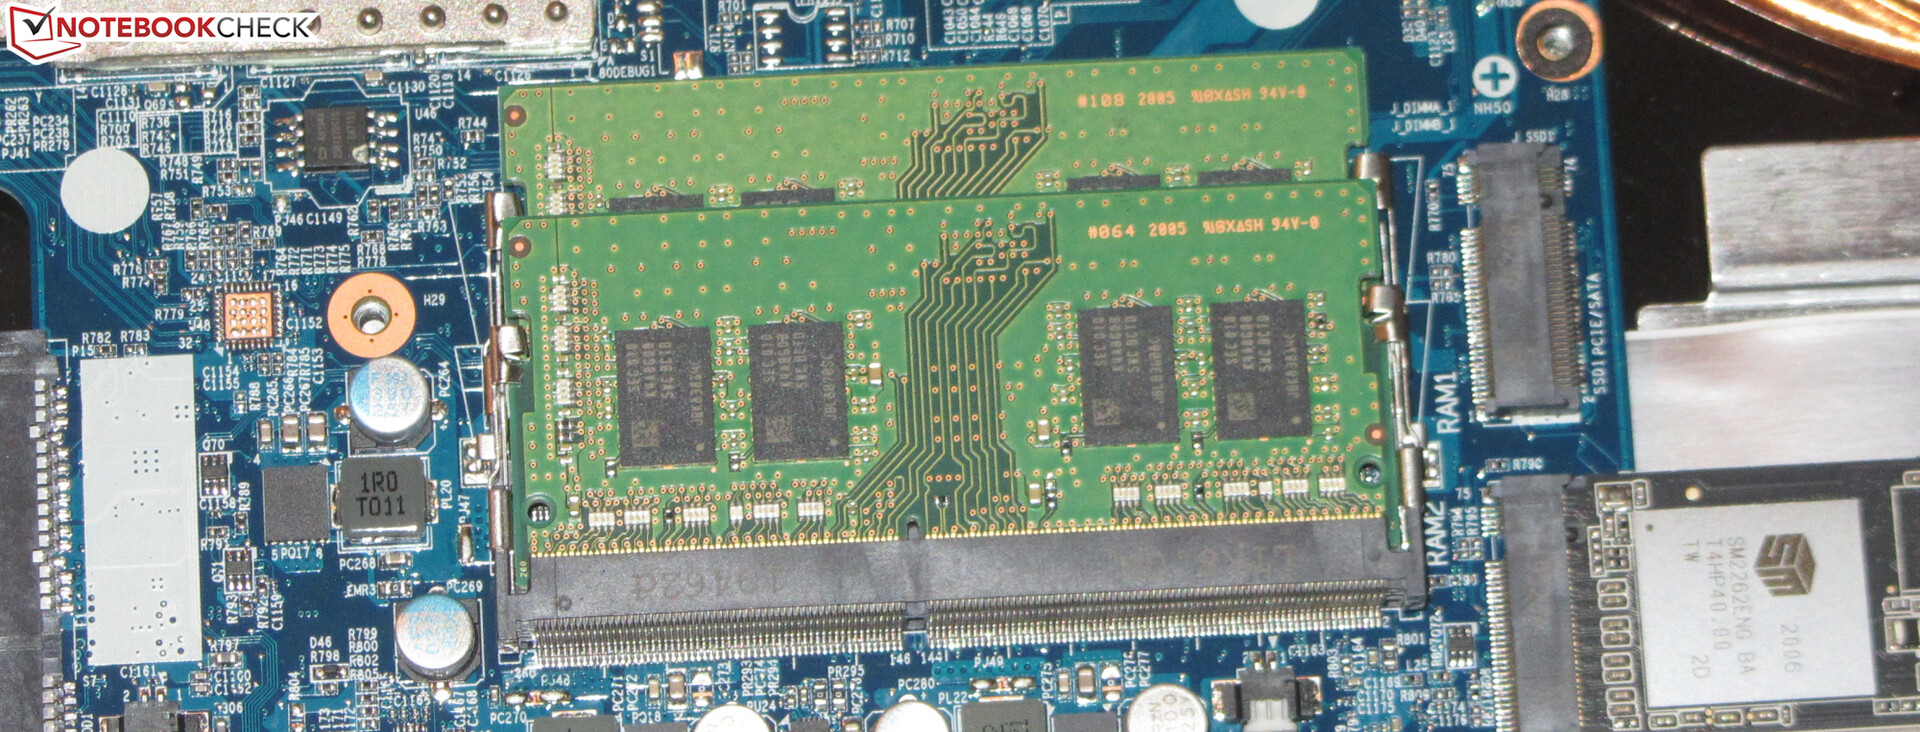
The storage space offered by the fast NVMe SSD is a bit tight for a gaming laptop at 512 GB. However, it can be expanded: The laptop offers space for two M.2 2280 SSDs (1x NVMe/SATA, 1x NVMe; RAID 0/1) and a 2.5-inch storage drive. A memory expansion (16 GB, dual-channel mode; 64 GB max.) would also be possible. Both procedures would require removing the bottom cover.
Considering the powerful hardware in the laptop, its heat development is moderate. However, the device produces a lot of noise. The battery life is alright, but it's no cause for enthusiasm. The relatively small-capacity battery (49 Wh) becomes noticeable here.
The Full HD display (IPS, 144 Hz) offers stable viewing angles, a matte surface, quick response times, decent color-space coverage, and great color reproduction. The maximum brightness and contrast should be higher, though.
Aorus 7 KB
-
10/06/2020 v7
Sascha Mölck
Pricecompare

