 Deutsch
 English
 Español
 Français
 Italiano
 Nederlands
 Polski
 Português
 Русский
 Türkçe
 Svenska
 Chinese
 Magyar
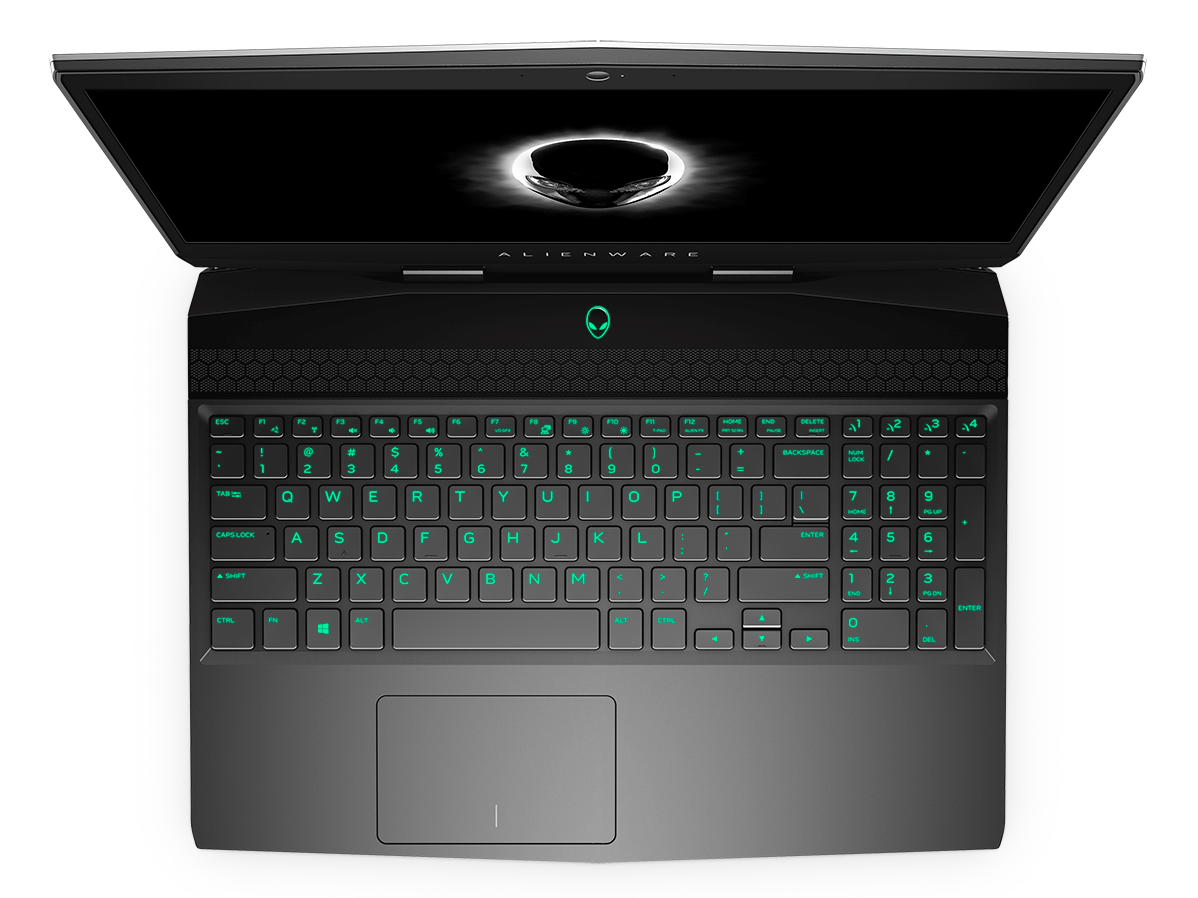
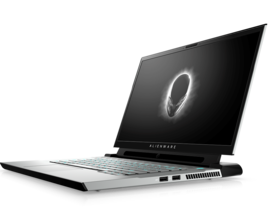
Alienware m15 P79F (i7-8750H, RTX 2070 Max-Q, OLED) Review
Just because a second generation Alienware m15 is inbound doesn't mean that the first generation Alienware m15 won't be getting anymore love. Dell has updated the original Alienware m15 with 9th gen Intel, GeForce RTX graphics, and additional display options to replace last year's 8th gen Intel and GeForce GTX graphics.
Perhaps the most notable upgrade, however, is the new 4K UHD OLED option. Unveiled at CES 2019, more and more gaming laptops are beginning to ship with 4K UHD OLED panels to complement the usual IPS options that we've all become familiar with. The older 13.3-inch Alienware 13 shipped with a similar OLED option that has since been discontinued. Our test unit today is equipped with the fancy 4K UHD OLED panel available only on select SKUs of the Alienware m15. Such a panel will add an additional $350 over the base 1080p IPS panel to make it more of an enthusiast offering for the time being.
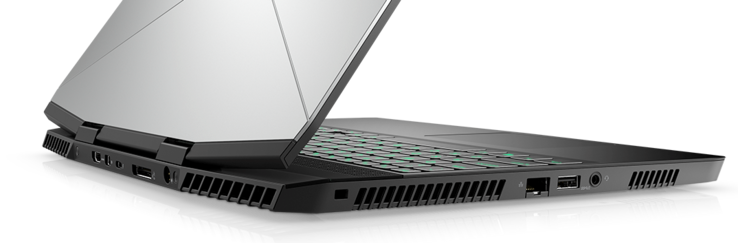
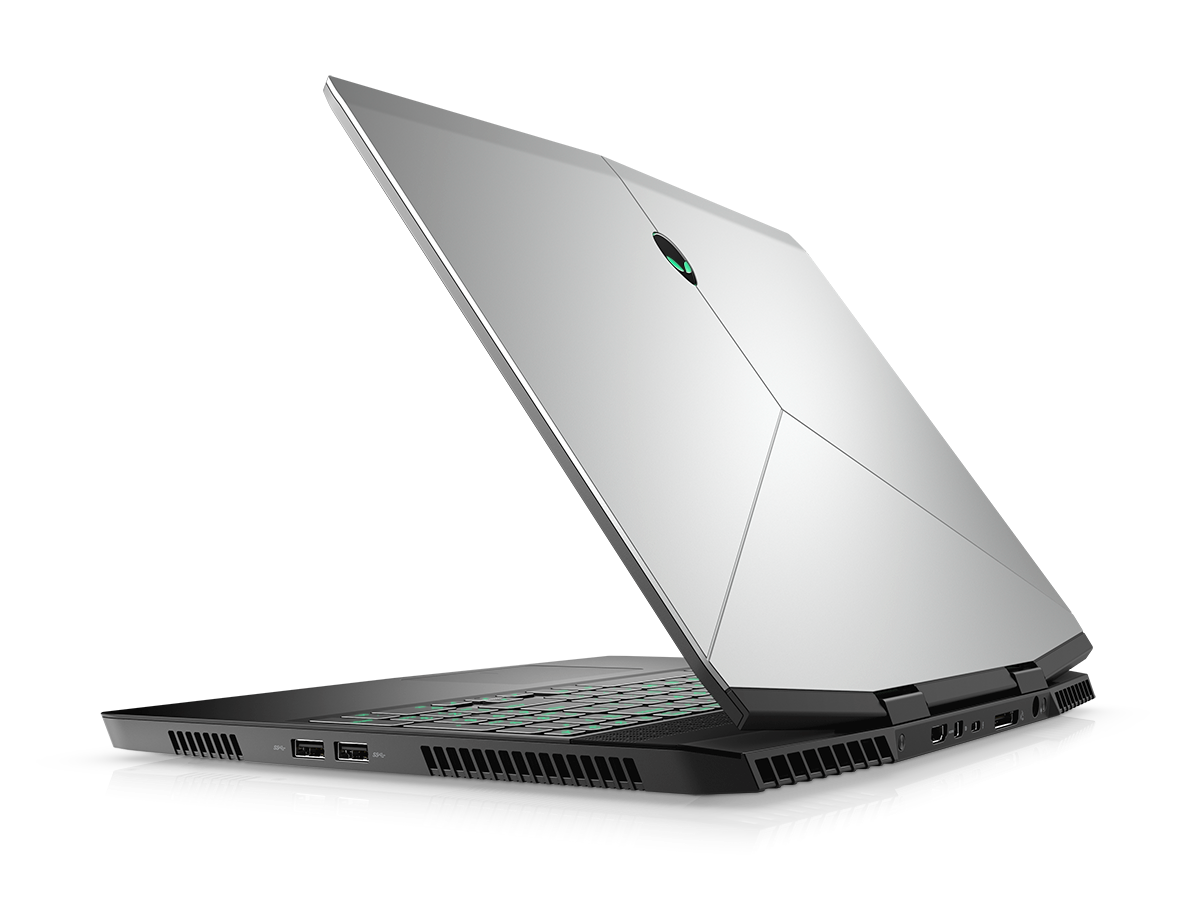
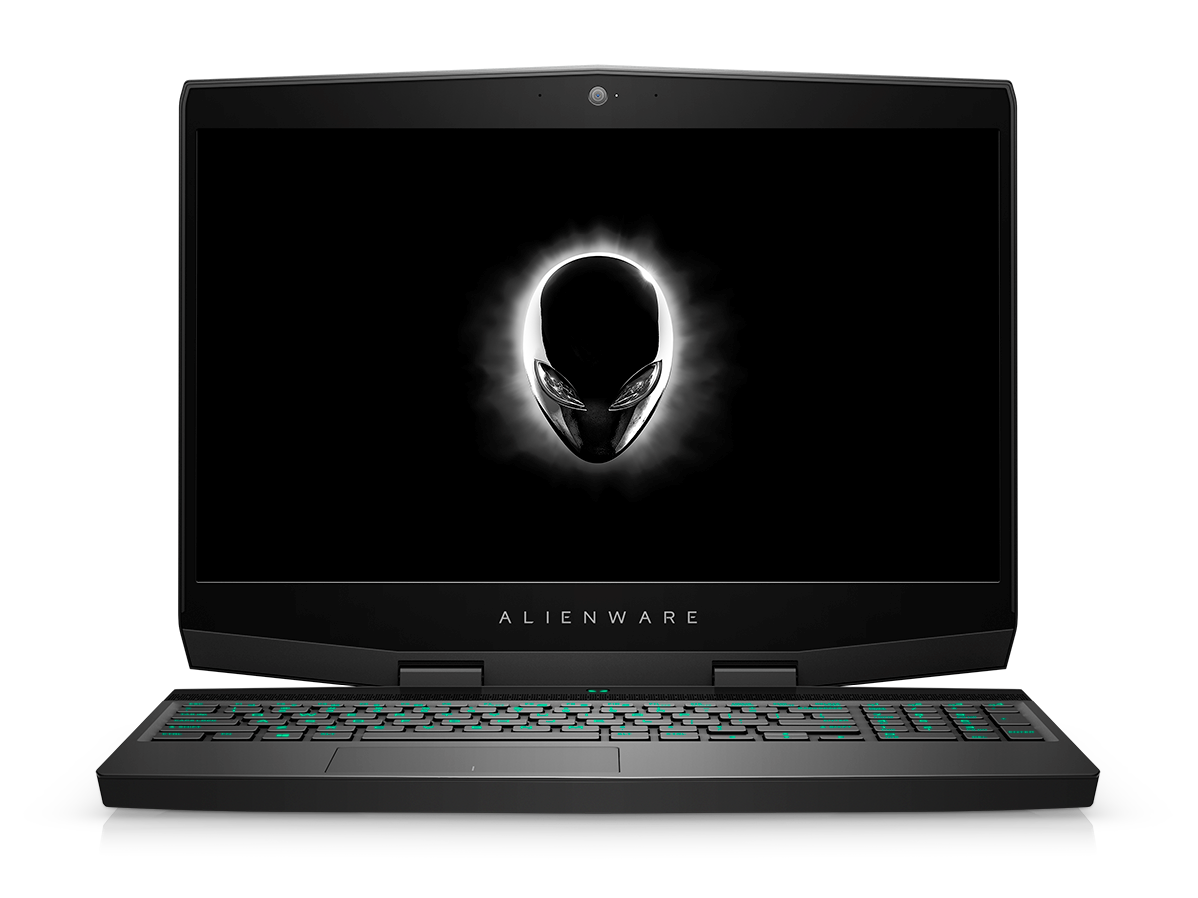
For this review, we'll be focusing on the performance and display. See our existing review on the 2018 Alienware m15 for more information about the chassis, keyboard, serviceability, speakers, and more as all our previous comments still apply here.
More Dell Alienware reviews:
Communication
| Networking | |
| iperf3 transmit AX12 | |
| Razer Blade 15 RTX 2080 Max-Q | |
| Asus Zephyrus S GX502GW | |
| Alienware m15 GTX 1070 Max-Q | |
| Alienware m15 P79F | |
| iperf3 receive AX12 | |
| Alienware m15 GTX 1070 Max-Q | |
| Razer Blade 15 RTX 2080 Max-Q | |
| Asus Zephyrus S GX502GW | |
| Alienware m15 P79F | |
Display
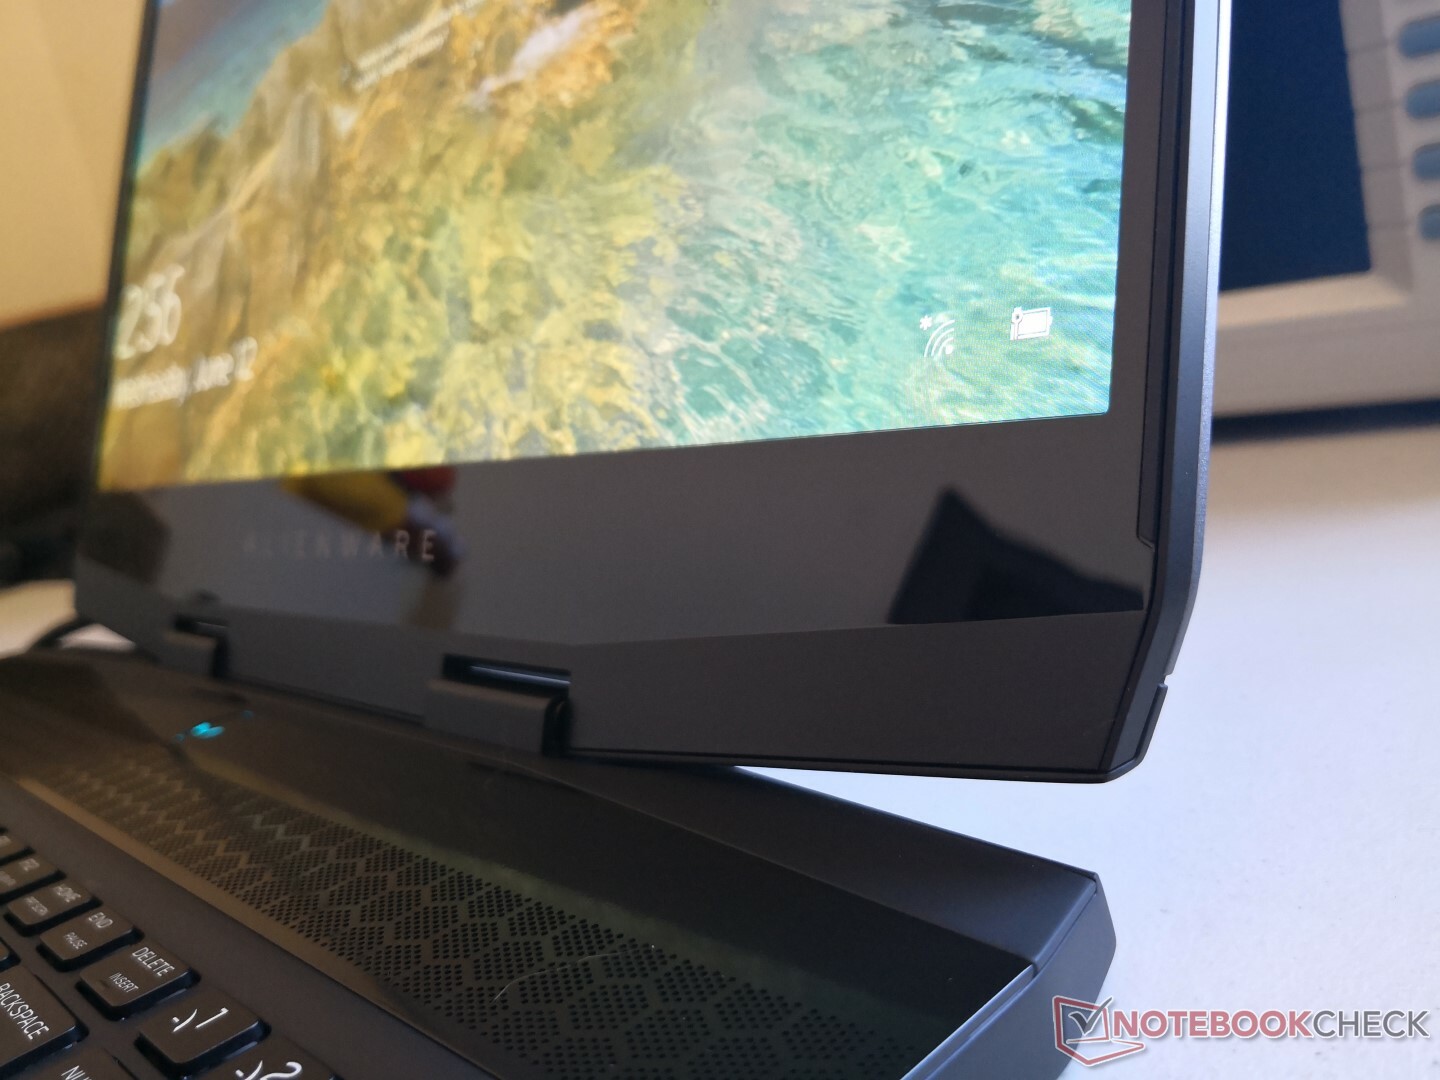
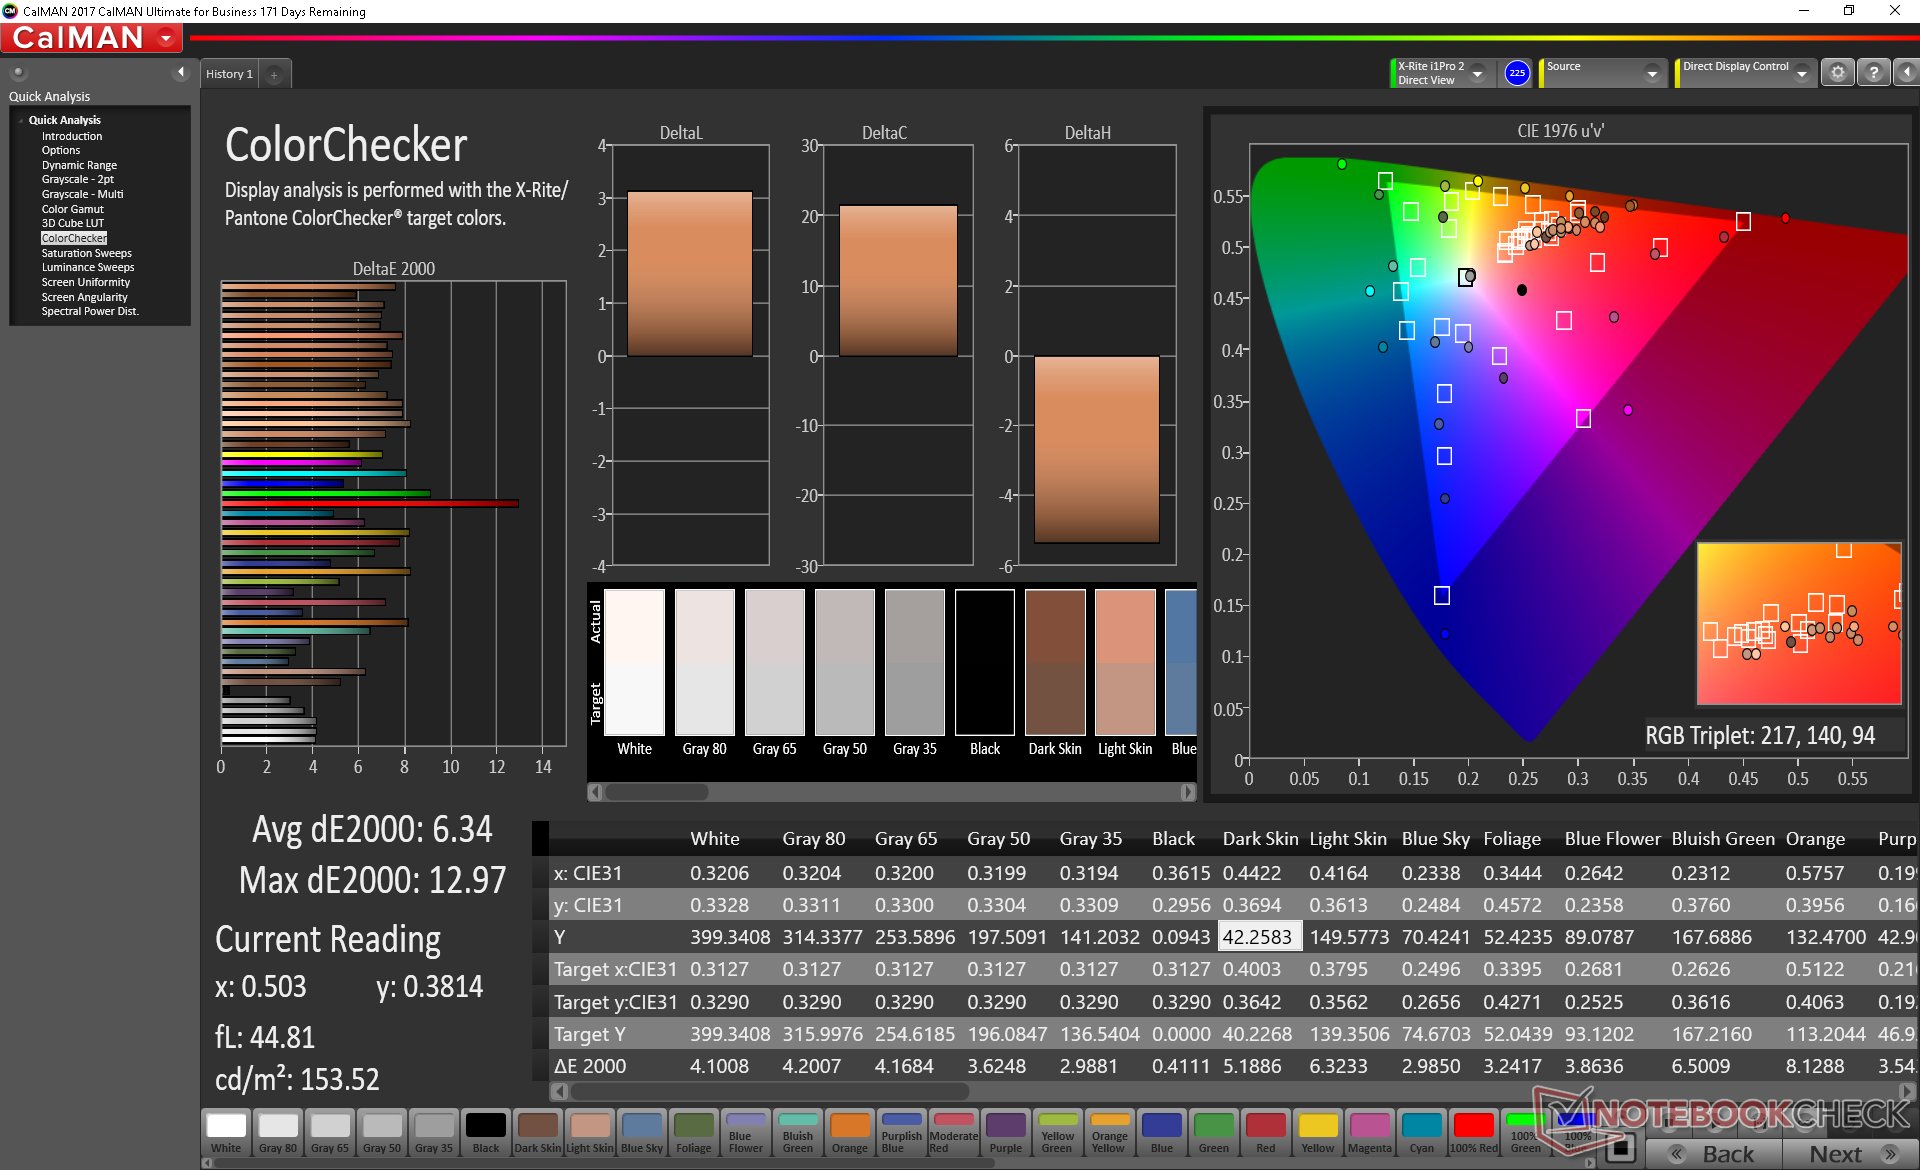
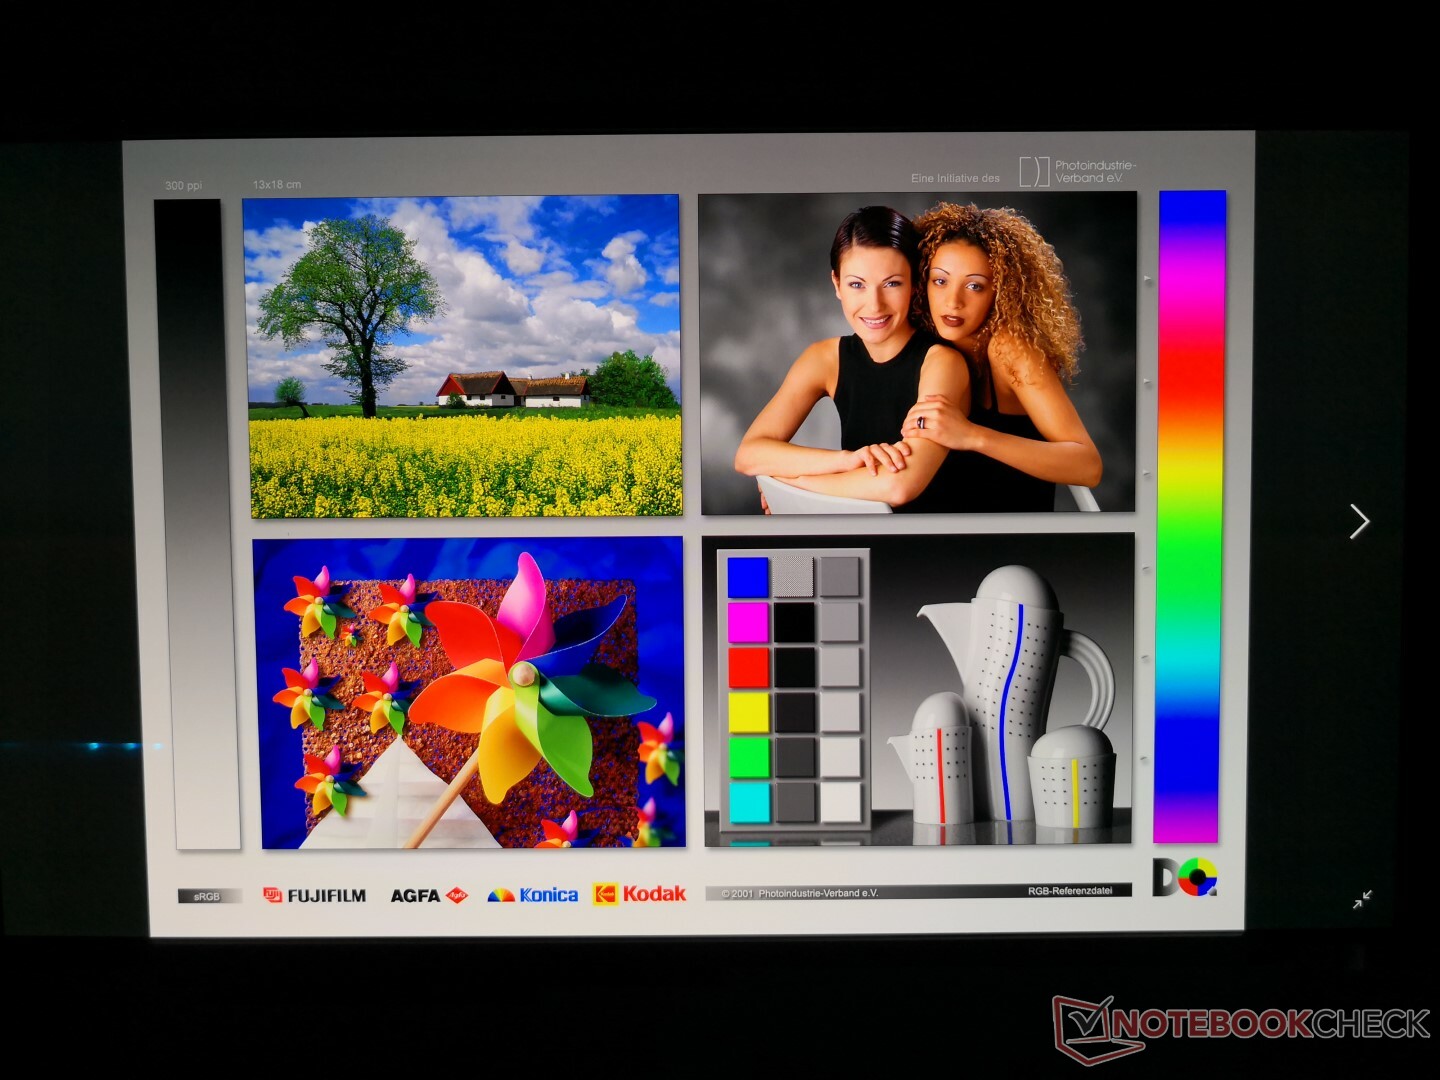
The glossy 4K UHD OLED display is the highlight of the system. Its Samsung SDCA029 panel ID appears to be a generic name for many other Samsung OLED panels as this same ID can also be found on both the Samsung Galaxy Book 12 and Alienware 13 R3. Its 156WR04 identifier, however, is unique.
The OLED panel benefits from no screen bleeding and pitch dark black levels for extremely high contrast ratios that are at least an order of magnitude greater than any IPS panel. Response times are significantly faster as well for less ghosting and color coverage is far superior than your typical IPS option. The display even manages to be 28 percent brighter than our IPS counterpart. These advantages all contribute to a visual experience that an IPS panel has no hopes of matching.
There are two key disadvantages of the OLED panel to keep in mind. Firstly, it suffers from pulse-width modulation (PWM) on all brightness levels on the Alienware m15. Users sensitive to onscreen flickering may want to avoid the OLED option as we're able to record a worryingly low flickering frequency of 60 Hz. Secondly, the panel is limited to a native refresh rate of only 60 Hz compared to 144 Hz or 240 Hz for the IPS SKUs. The OLED display may look amazing for still pictures or slow-moving videos, but it cannot yet match the smoothness of IPS especially during fast-paced games.
| |||||||||||||||||||||||||
Brightness Distribution: 90 %
Center on Battery: 452.1 cd/m²
Contrast: ∞:1 (Black: 0 cd/m²)
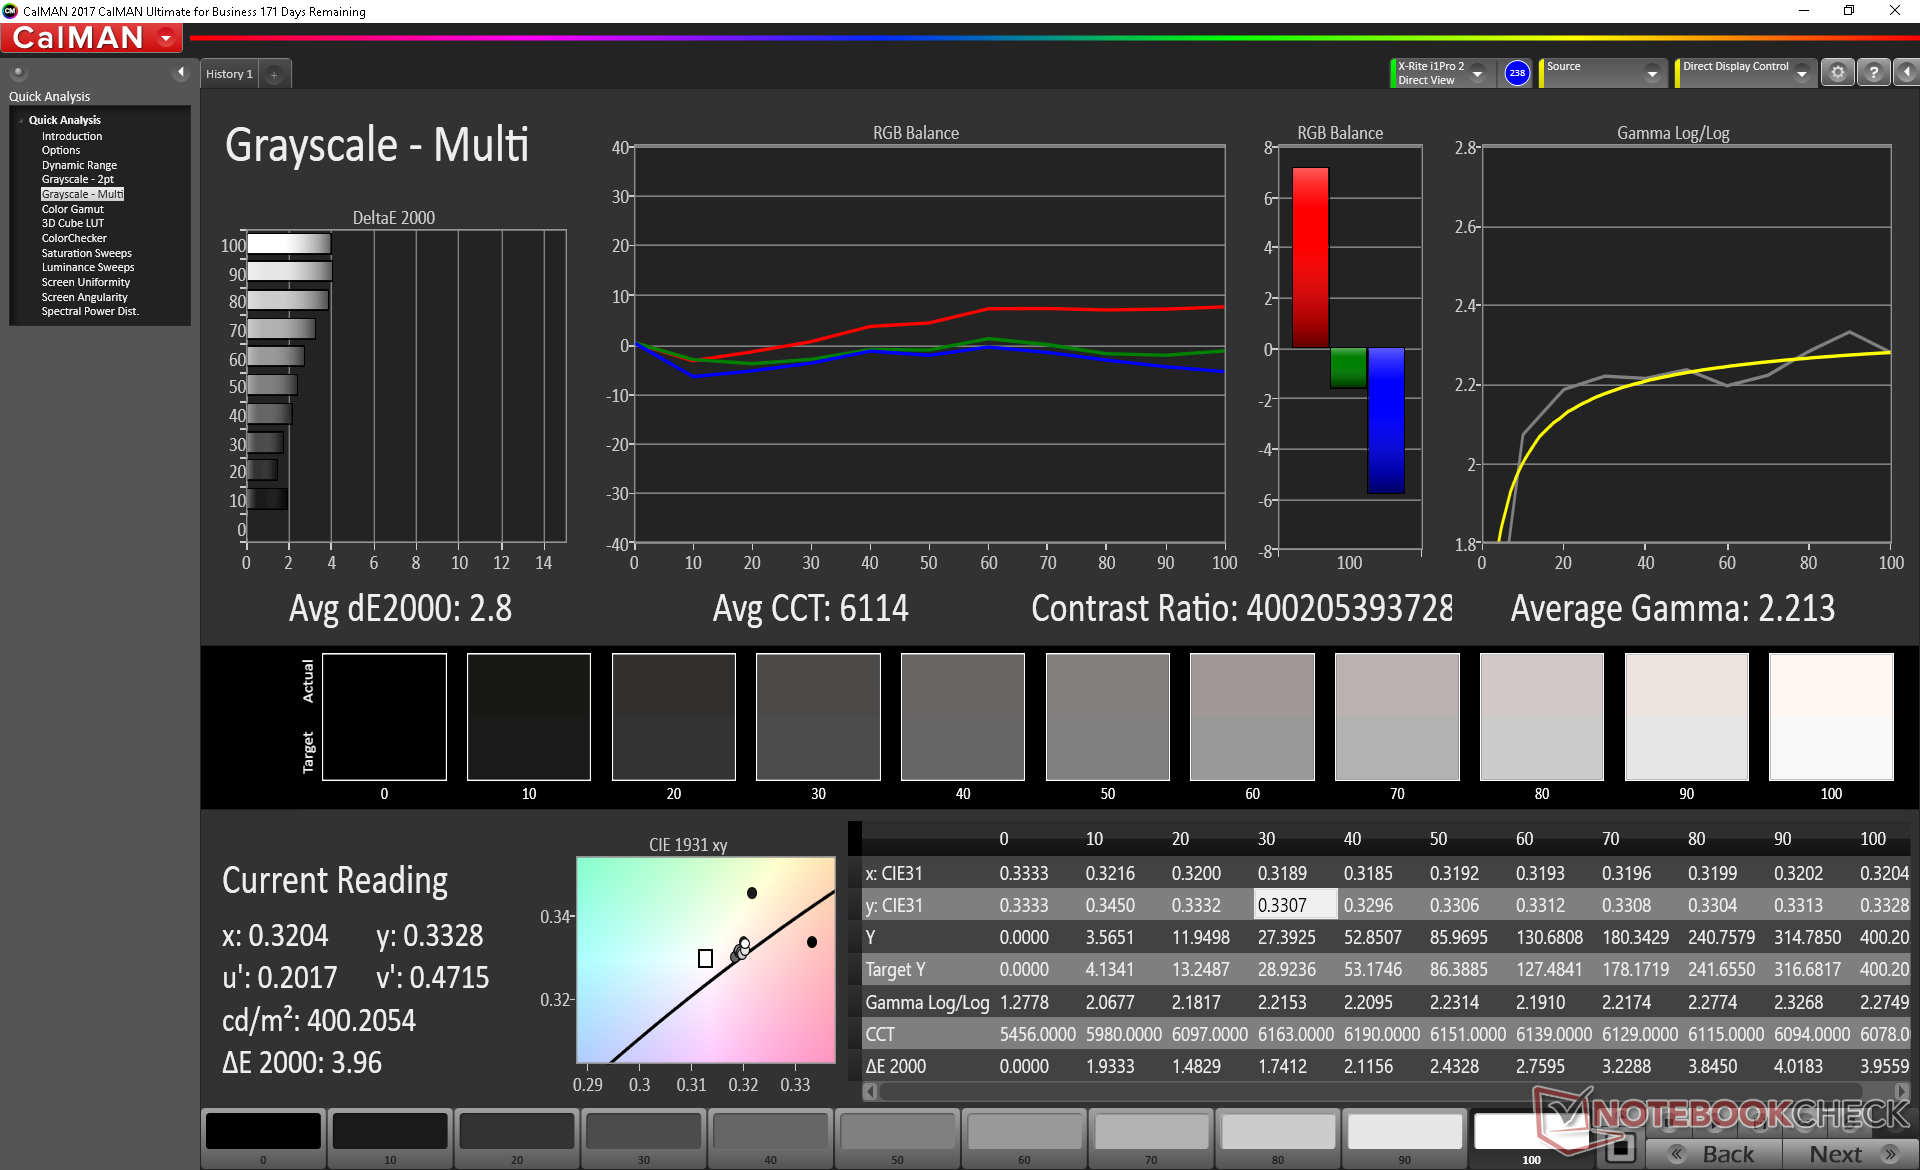
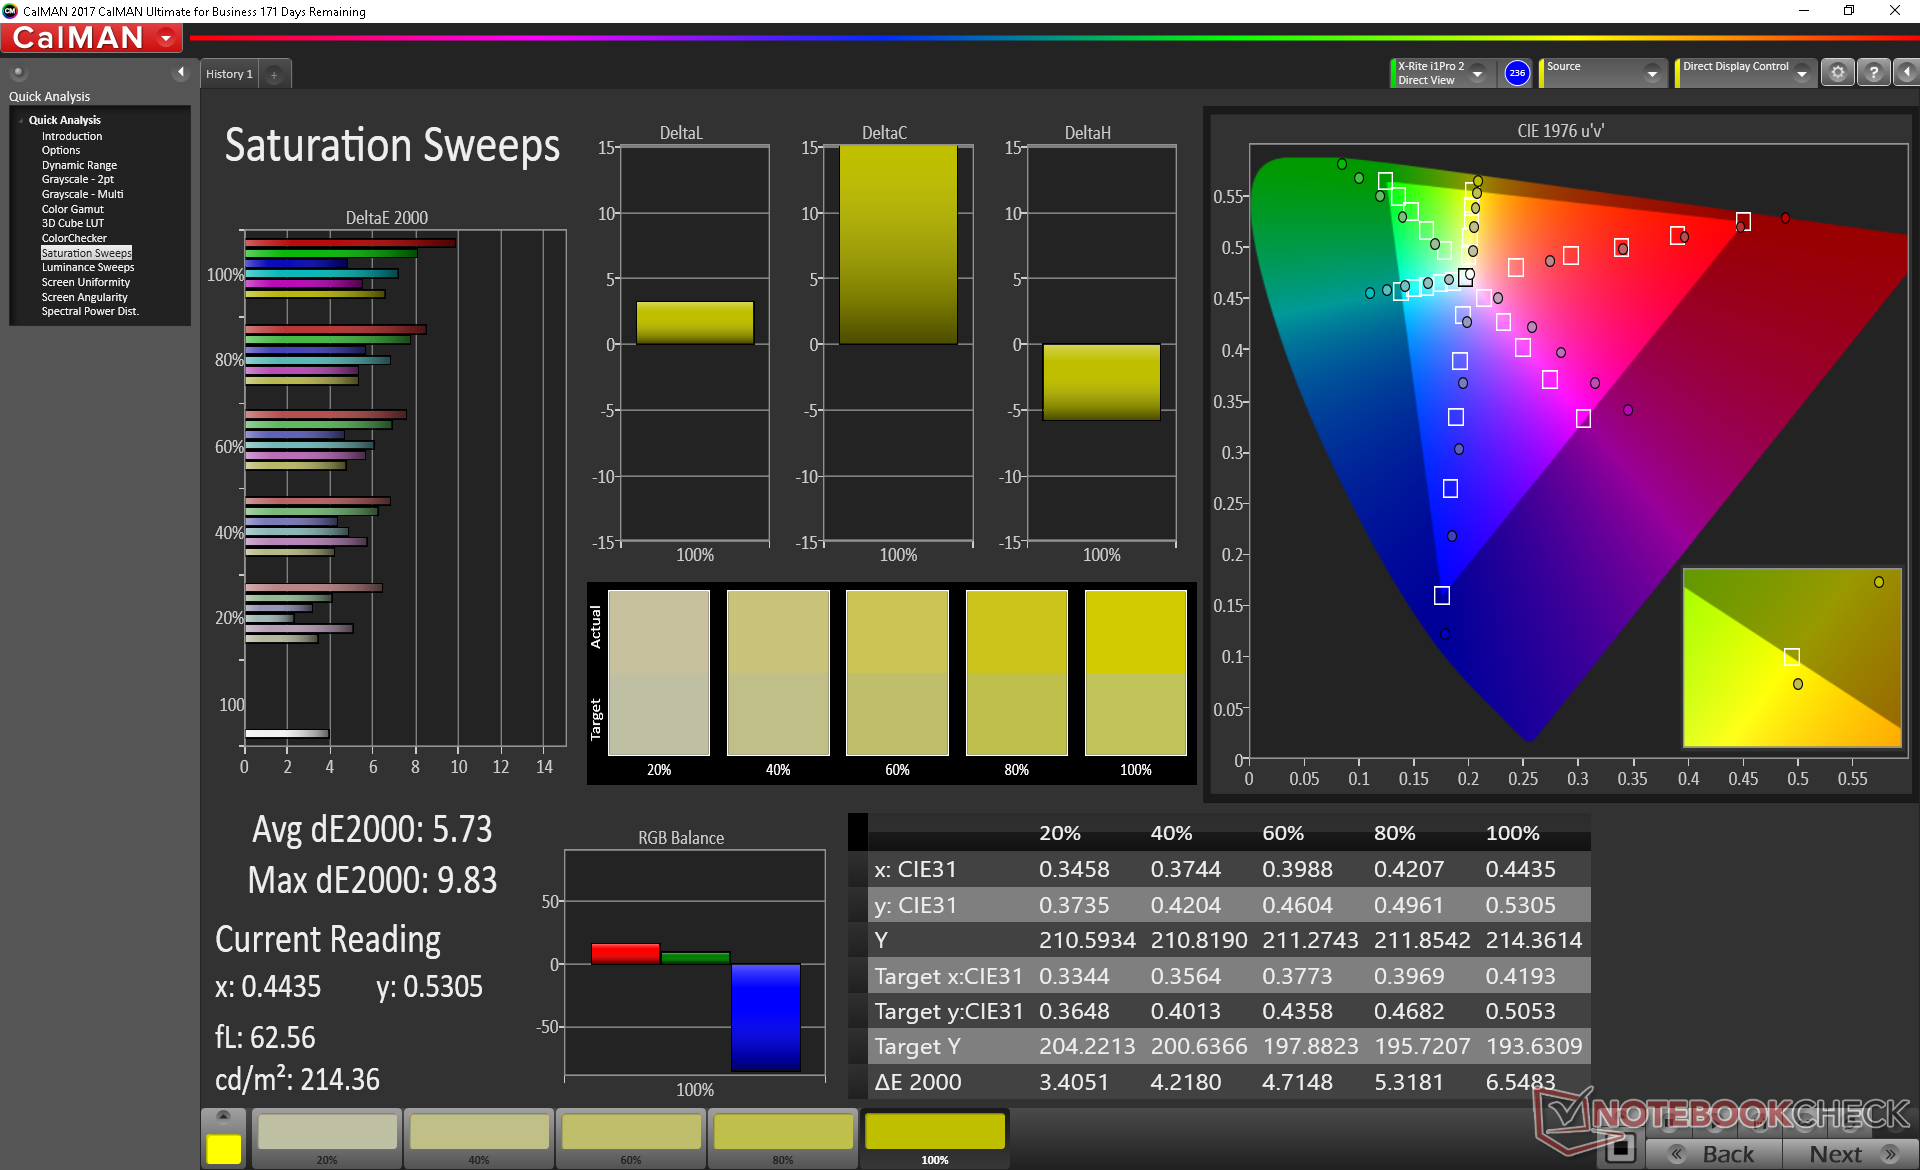
ΔE Color 6.34 | 0.5-29.43 Ø5
ΔE Greyscale 2.8 | 0.57-98 Ø5.3
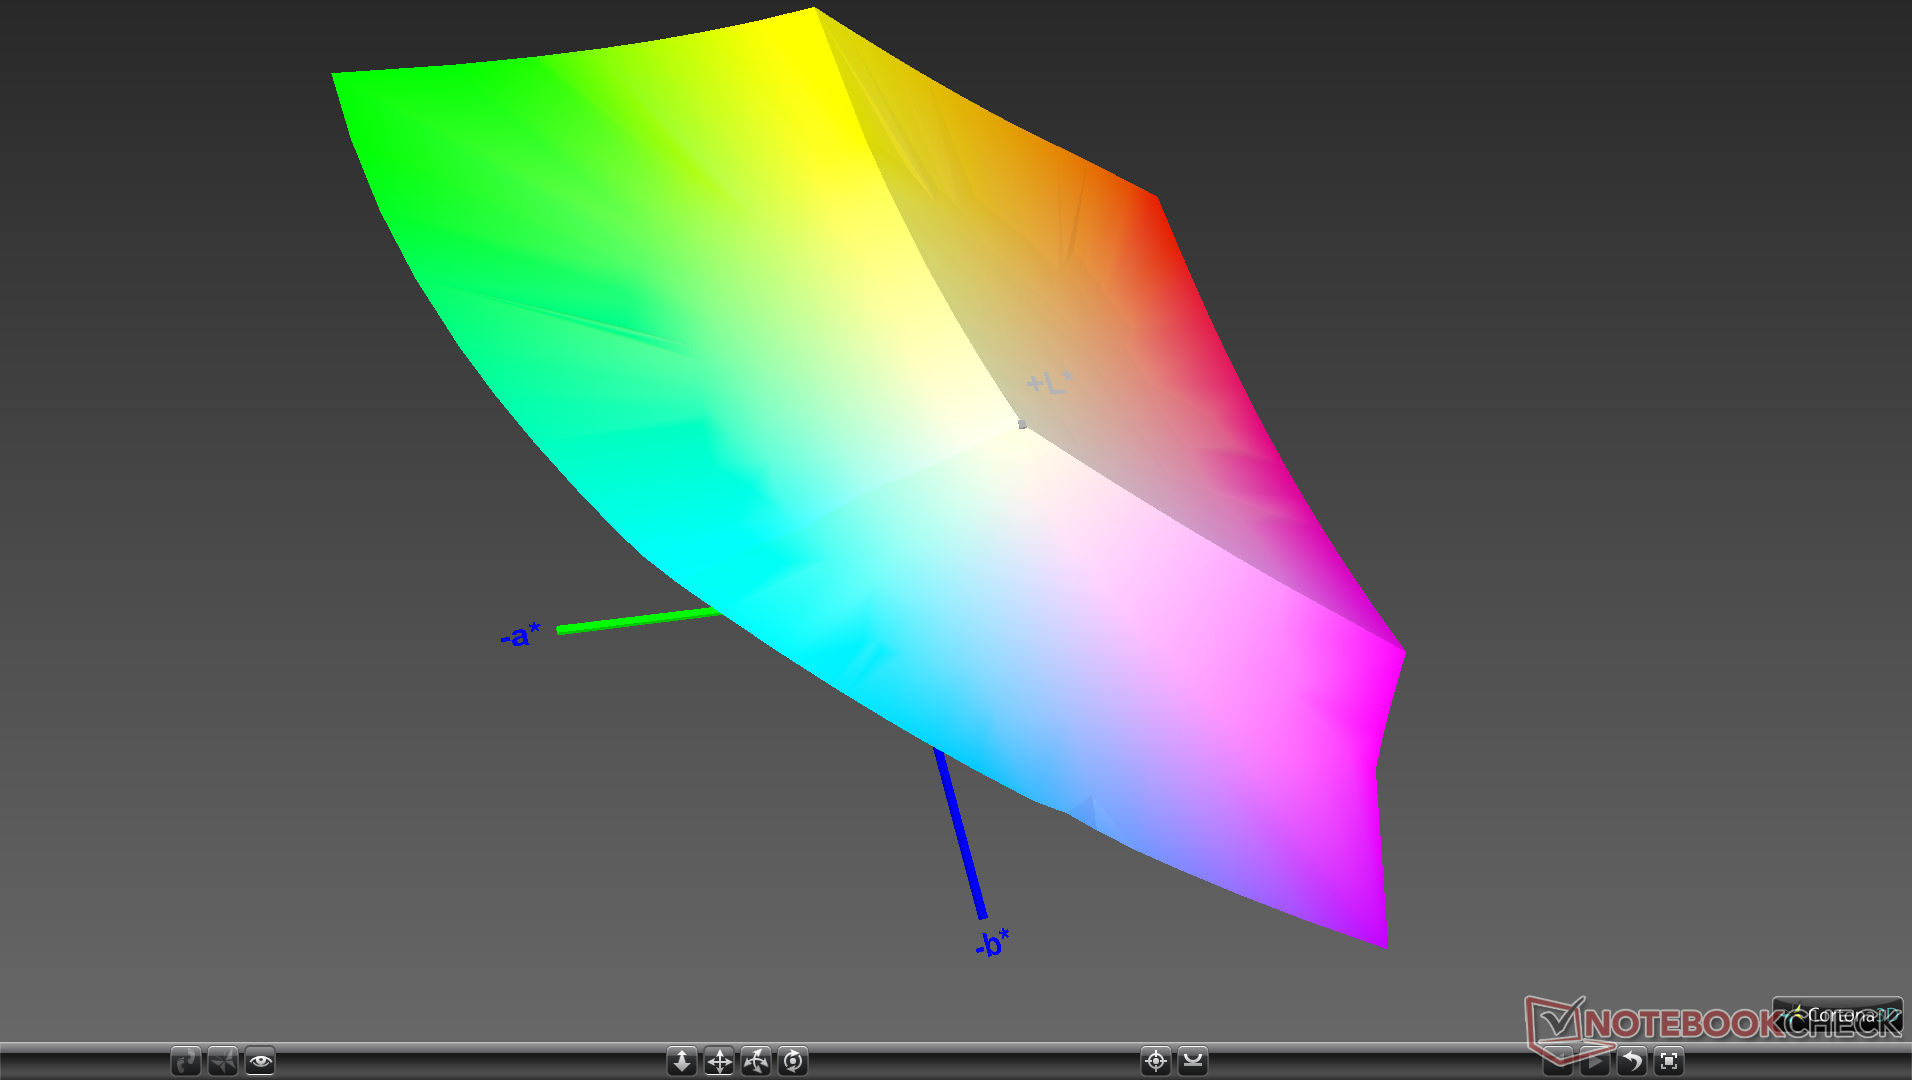
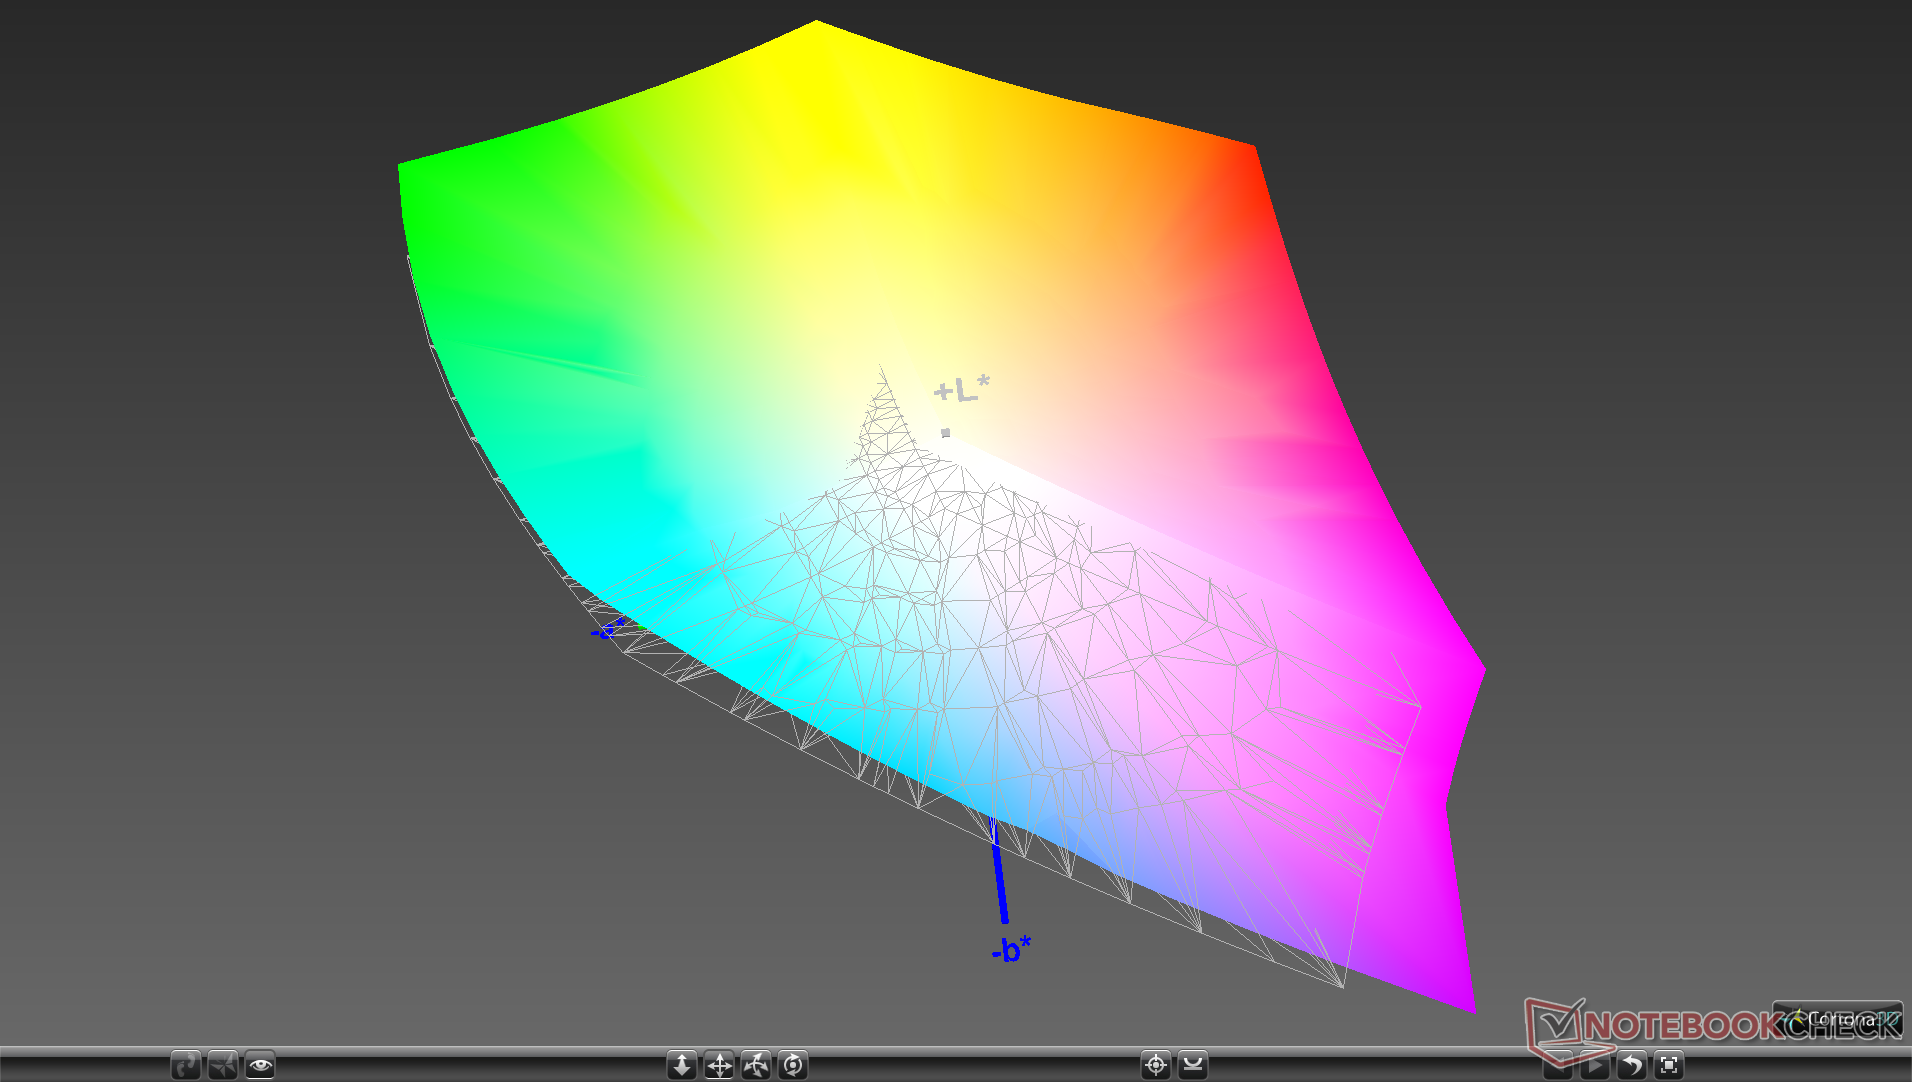
100% sRGB (Argyll 1.6.3 3D)
91% AdobeRGB 1998 (Argyll 1.6.3 3D)
100% AdobeRGB 1998 (Argyll 2.2.0 3D)
100% sRGB (Argyll 2.2.0 3D)
99.9% Display P3 (Argyll 2.2.0 3D)
Gamma: 2.21
| Alienware m15 P79F Samsung SDCA029, 156WR04, OLED, 15.60, 3840x2160 | Alienware m15 GTX 1070 Max-Q AU Optronics B156HAN, IPS, 15.60, 1920x1080 | Asus Zephyrus S GX502GW AU Optronics B156HAN08.2 (AUO82ED), IPS, 15.60, 1920x1080 | Aorus 15 W9 LG Philips LP156WFG-SPB2 (LGD05E8), IPS, 15.60, 1920x1080 | Dell XPS 15 9570 Core i9 UHD LQ156D1, IPS, 15.60, 3840x2160 | Lenovo Legion Y740-15ICHg LP156WFG-SPB2, IPS, 15.60, 1920x1080 | |
|---|---|---|---|---|---|---|
| Display | -27% | -26% | -25% | -14% | -26% | |
| Display P3 Coverage | 99.9 | 63.5 -36% | 64.9 -35% | 64.3 -36% | 79.6 -20% | 63.5 -36% |
| sRGB Coverage | 100 | 89.4 -11% | 91 -9% | 93.5 -6% | 98.4 -2% | 92.4 -8% |
| AdobeRGB 1998 Coverage | 100 | 64.5 -35% | 65.9 -34% | 65.6 -34% | 79.7 -20% | 64.7 -35% |
| Response Times | -507% | -230% | -502% | -543% | -549% | |
| Response Time Grey 50% / Grey 80% * | 2.6 ? | 18 ? -592% | 7.2 ? -177% | 16.8 ? -546% | 52.4 ? -1915% | 18.8 ? -623% |
| Response Time Black / White * | 2.3 ? | 12 ? -422% | 8.8 ? -283% | 12.8 ? -457% | 31.6 ? -1274% | 13.2 ? -474% |
| PWM Frequency | 60.2 ? | 1000 ? 1561% | ||||
| Screen | -9% | 4% | -15% | -28% | -4% | |
| Brightness middle | 452.1 | 353.6 -22% | 286 -37% | 295 -35% | 451.9 0% | 320.4 -29% |
| Brightness | 452 | 346 -23% | 275 -39% | 292 -35% | 414 -8% | 298 -34% |
| Brightness Distribution | 90 | 86 -4% | 90 0% | 80 -11% | 81 -10% | 85 -6% |
| Black Level * | 0.3 | 0.37 | 0.34 | 0.36 | 0.42 | |
| Colorchecker dE 2000 * | 6.34 | 4.55 28% | 2.19 65% | 3.89 39% | 5.62 11% | 3.21 49% |
| Colorchecker dE 2000 max. * | 12.97 | 7.91 39% | 4.4 66% | 7.28 44% | 19.1 -47% | 5.54 57% |
| Greyscale dE 2000 * | 2.8 | 4.1 -46% | 2.2 21% | 4.98 -78% | 6.9 -146% | 3.6 -29% |
| Gamma | 2.21 100% | 2.27 97% | 2.41 91% | 2.45 90% | 2.2 100% | 2.27 97% |
| CCT | 6114 106% | 7434 87% | 6405 101% | 6407 101% | 6254 104% | 6503 100% |
| Color Space (Percent of AdobeRGB 1998) | 91 | 57.9 -36% | 59 -35% | 60 -34% | 71.8 -21% | 59 -35% |
| Color Space (Percent of sRGB) | 100 | 88.9 -11% | 91 -9% | 93 -7% | 98.5 -1% | 92 -8% |
| Contrast | 1179 | 773 | 868 | 1255 | 763 | |
| Colorchecker dE 2000 calibrated * | 3.37 | 2.27 | 1.44 | 2.69 | 2.36 | |
| Total Average (Program / Settings) | -181% /
-90% | -84% /
-39% | -181% /
-92% | -195% /
-135% | -193% /
-93% |
* ... smaller is better
Color space encompasses DCI-P3 and, by extension, sRGB as its gamut is 25 percent larger. The Alienware m15 is therefore one of the few 15.6-inch laptops to support DCI-P3 alongside the MacBook Pro. This particular color standard is useful for film editors while gamers can still enable HDR if desired.
Display Response Times
| ↔ Response Time Black to White | ||
|---|---|---|
| 2.3 ms ... rise ↗ and fall ↘ combined | ↗ 1 ms rise | 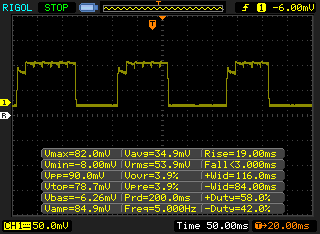 |
| ↘ 1.3 ms fall | ||
| The screen shows very fast response rates in our tests and should be very well suited for fast-paced gaming. In comparison, all tested devices range from 0.1 (minimum) to 240 (maximum) ms. » 7 % of all devices are better. This means that the measured response time is better than the average of all tested devices (21.5 ms). | ||
| ↔ Response Time 50% Grey to 80% Grey | ||
| 2.6 ms ... rise ↗ and fall ↘ combined | ↗ 1.2 ms rise | 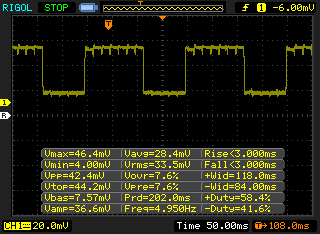 |
| ↘ 1.4 ms fall | ||
| The screen shows very fast response rates in our tests and should be very well suited for fast-paced gaming. In comparison, all tested devices range from 0.2 (minimum) to 636 (maximum) ms. » 7 % of all devices are better. This means that the measured response time is better than the average of all tested devices (33.7 ms). | ||
Screen Flickering / PWM (Pulse-Width Modulation)
| Screen flickering / PWM detected | 60.2 Hz | ≤ 100 % brightness setting | 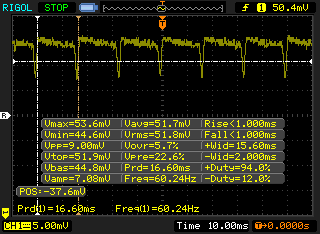 |
The display backlight flickers at 60.2 Hz (worst case, e.g., utilizing PWM) Flickering detected at a brightness setting of 100 % and below. There should be no flickering or PWM above this brightness setting. The frequency of 60.2 Hz is very low, so the flickering may cause eyestrain and headaches after extended use. In comparison: 53 % of all tested devices do not use PWM to dim the display. If PWM was detected, an average of 17909 (minimum: 5 - maximum: 3846000) Hz was measured. | |||
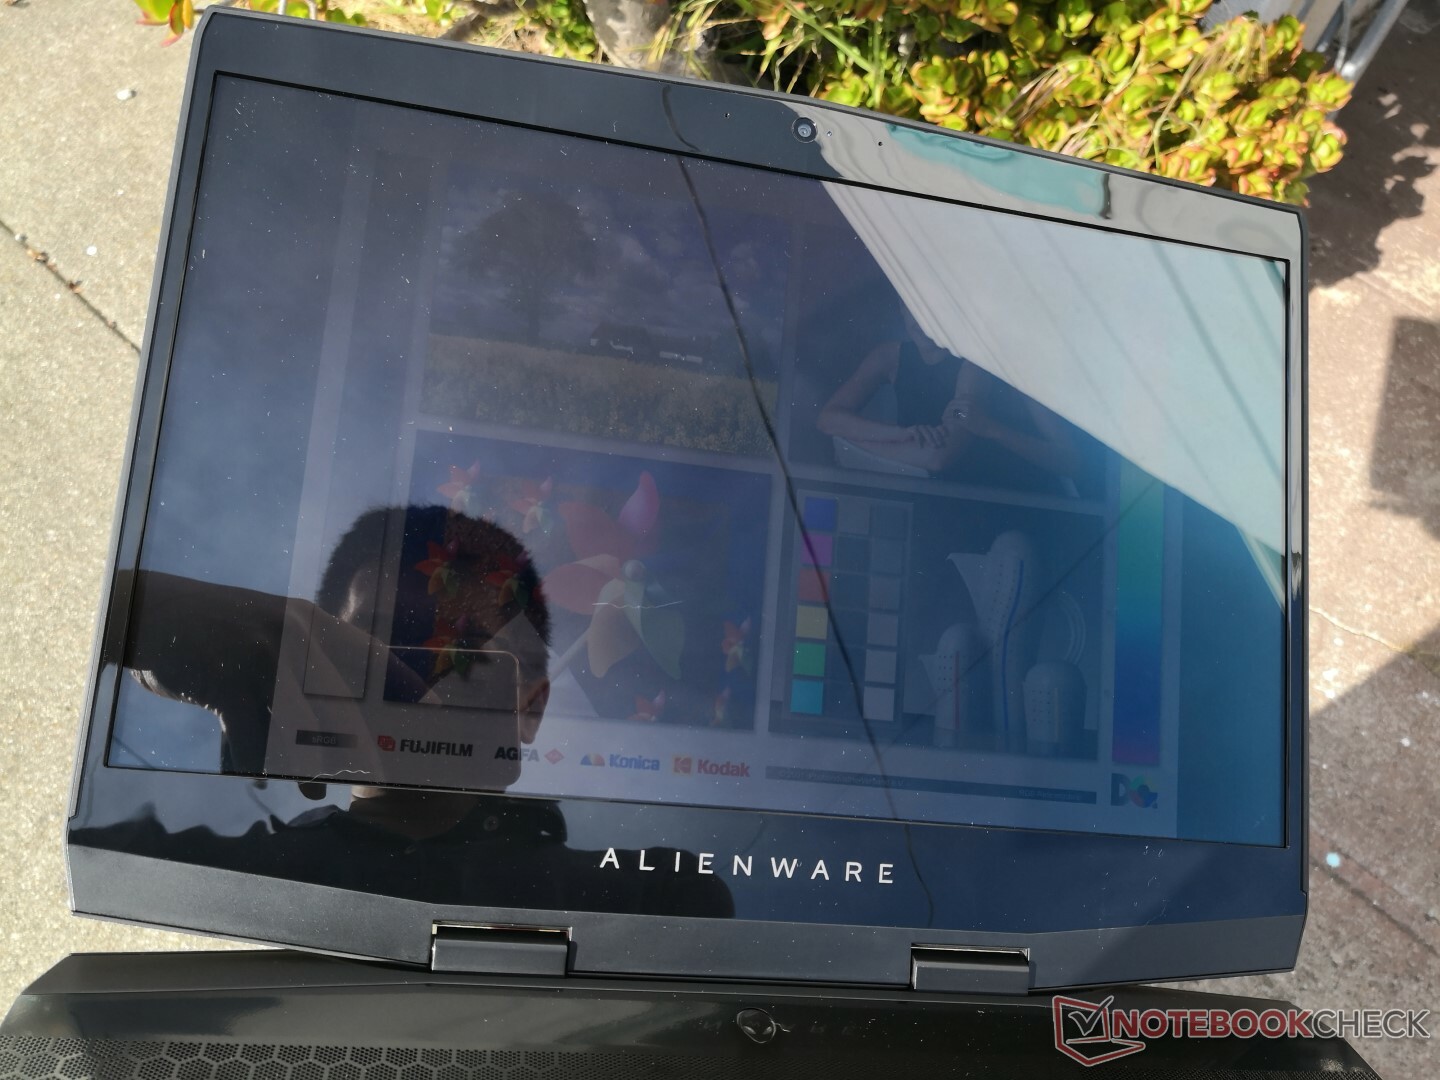
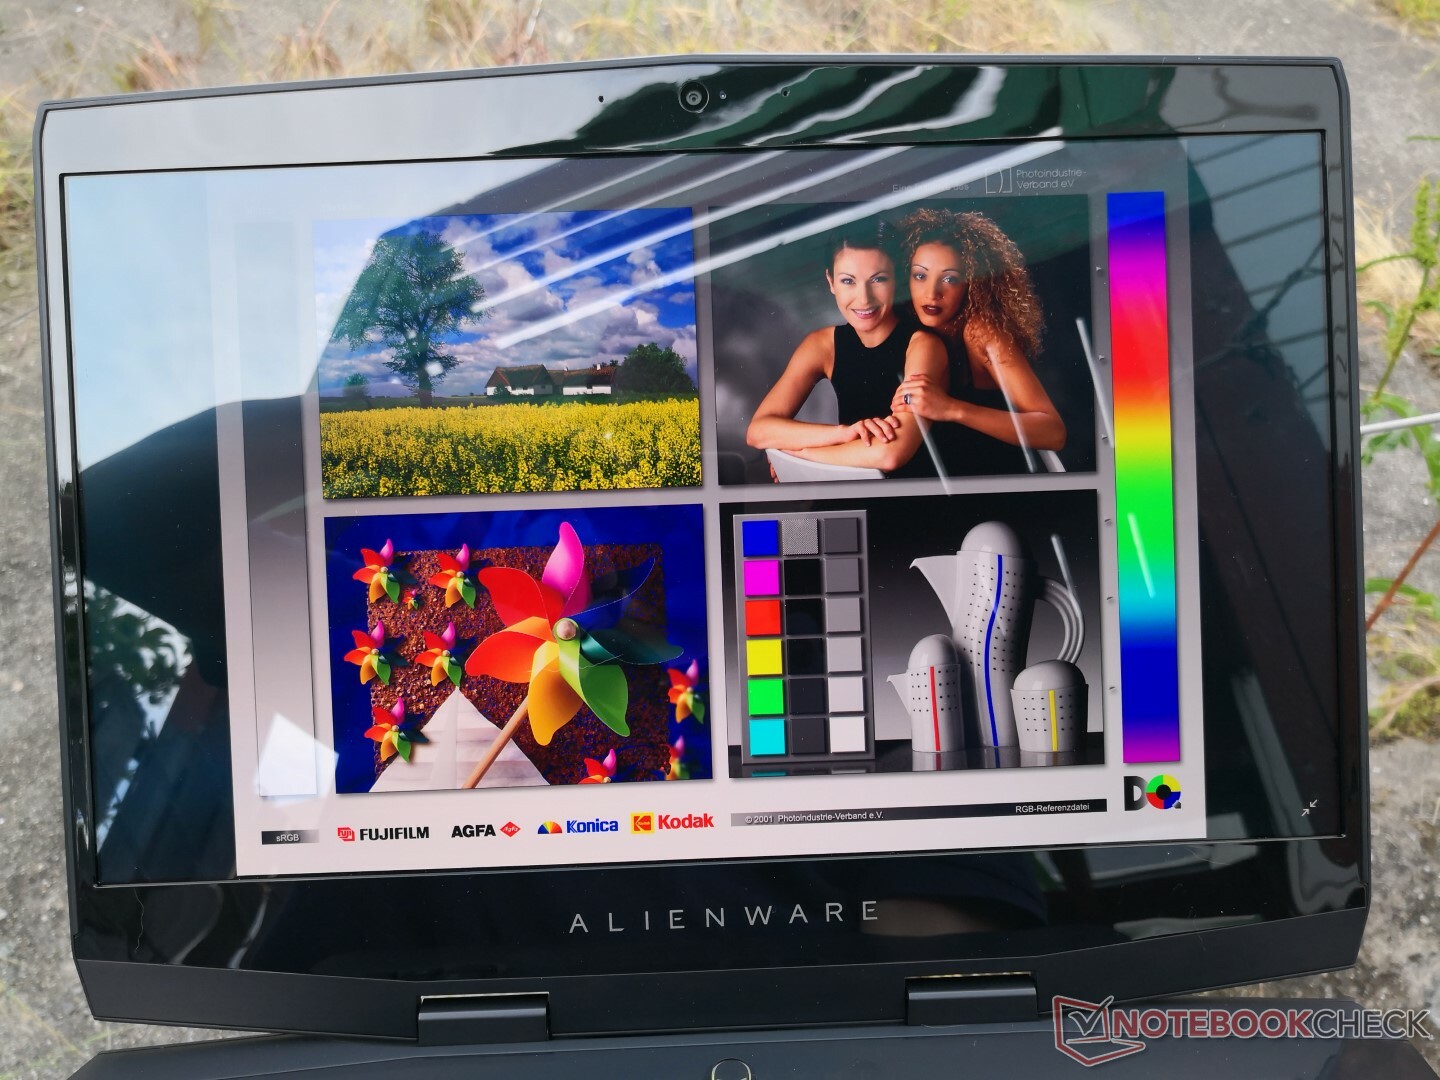
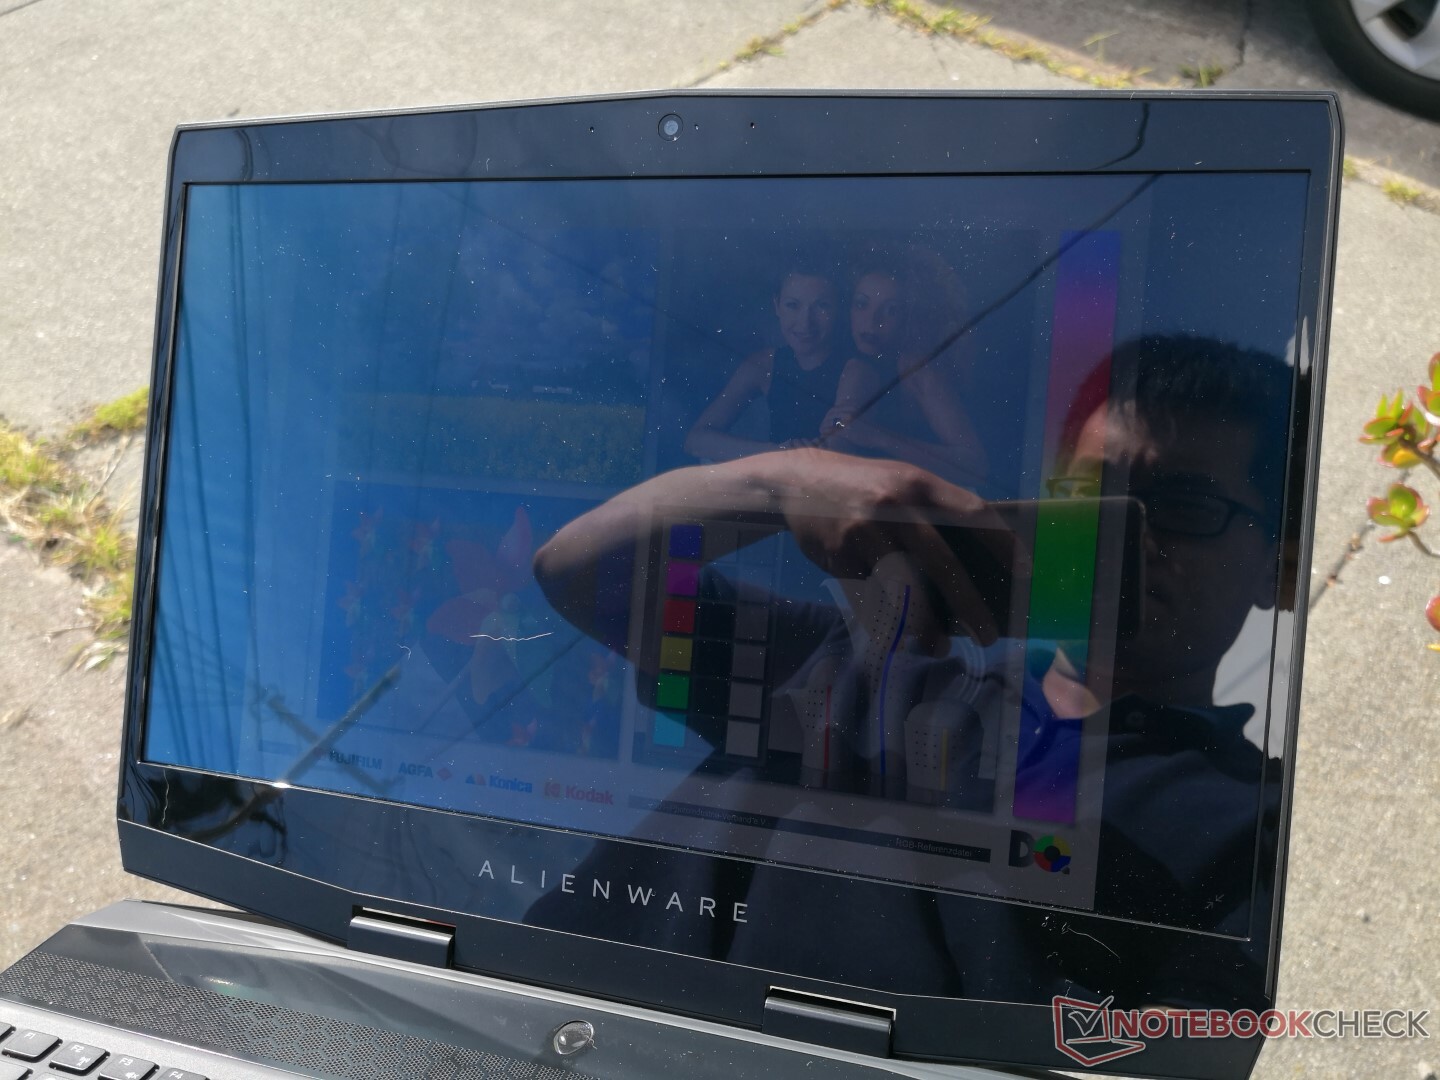
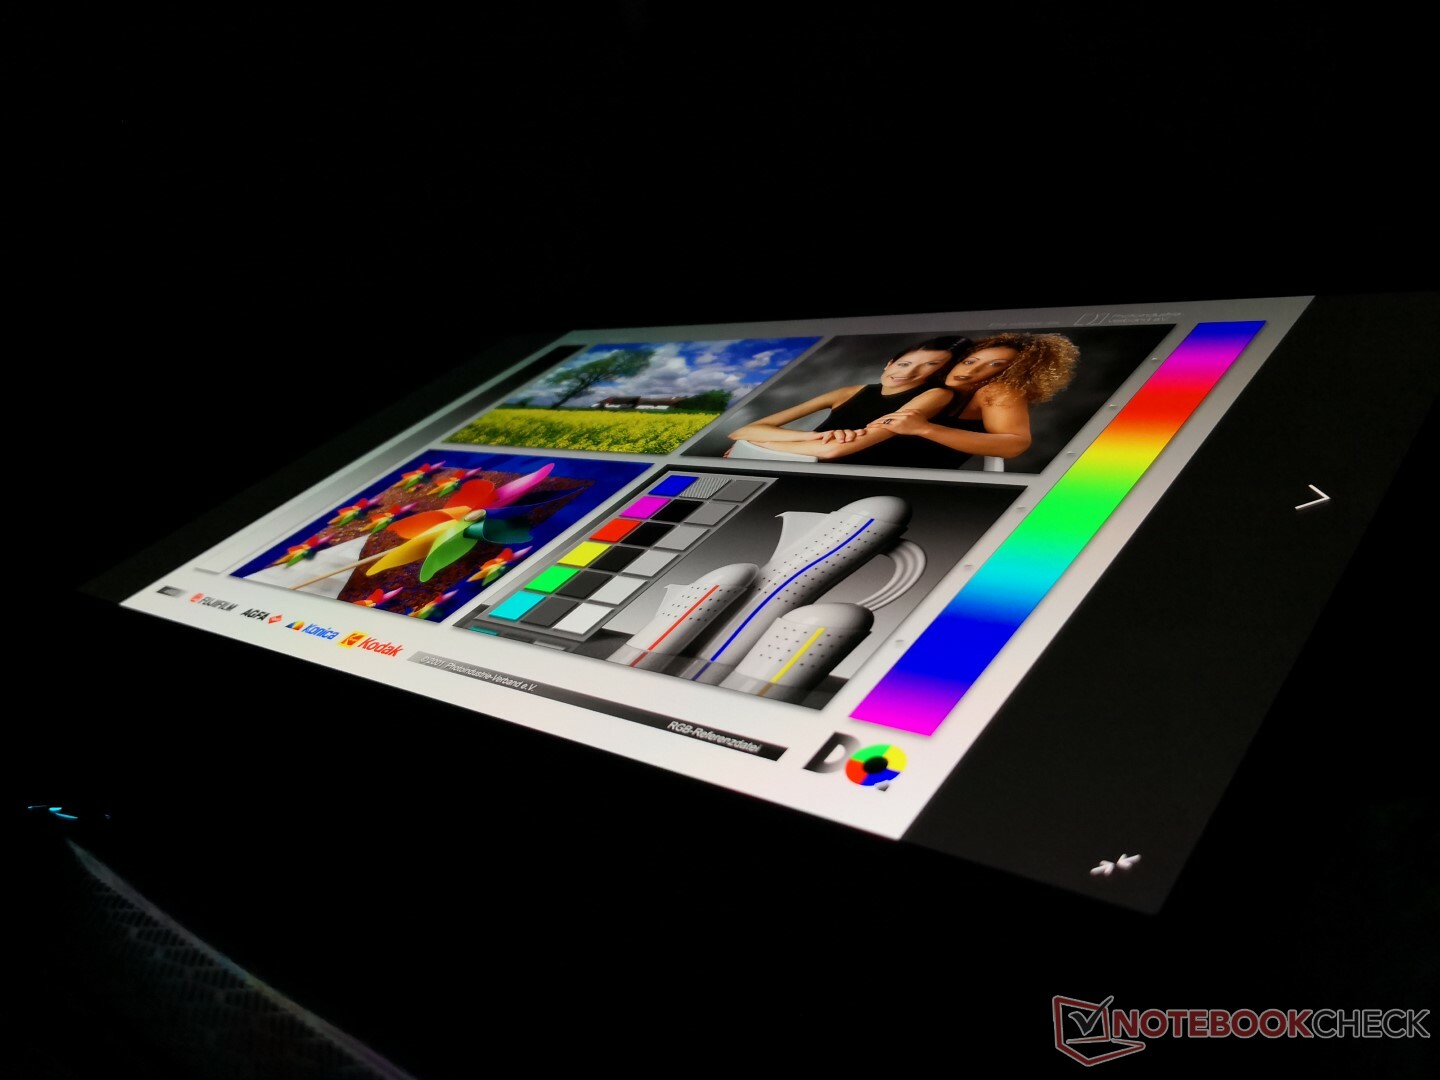
Outdoor visibility is better than what the IPS panel can offer as the backlight is brighter. We find the display to be comfortable if working under shade with the appropriate text scaling to account for the dense PPI. Glare will become an issue if ambient conditions become any brighter.
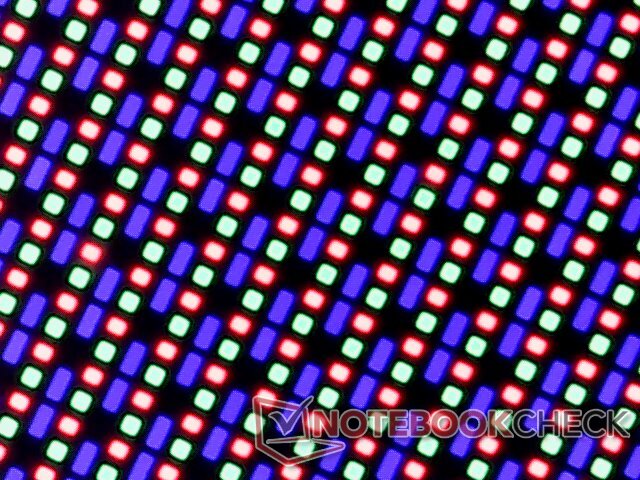
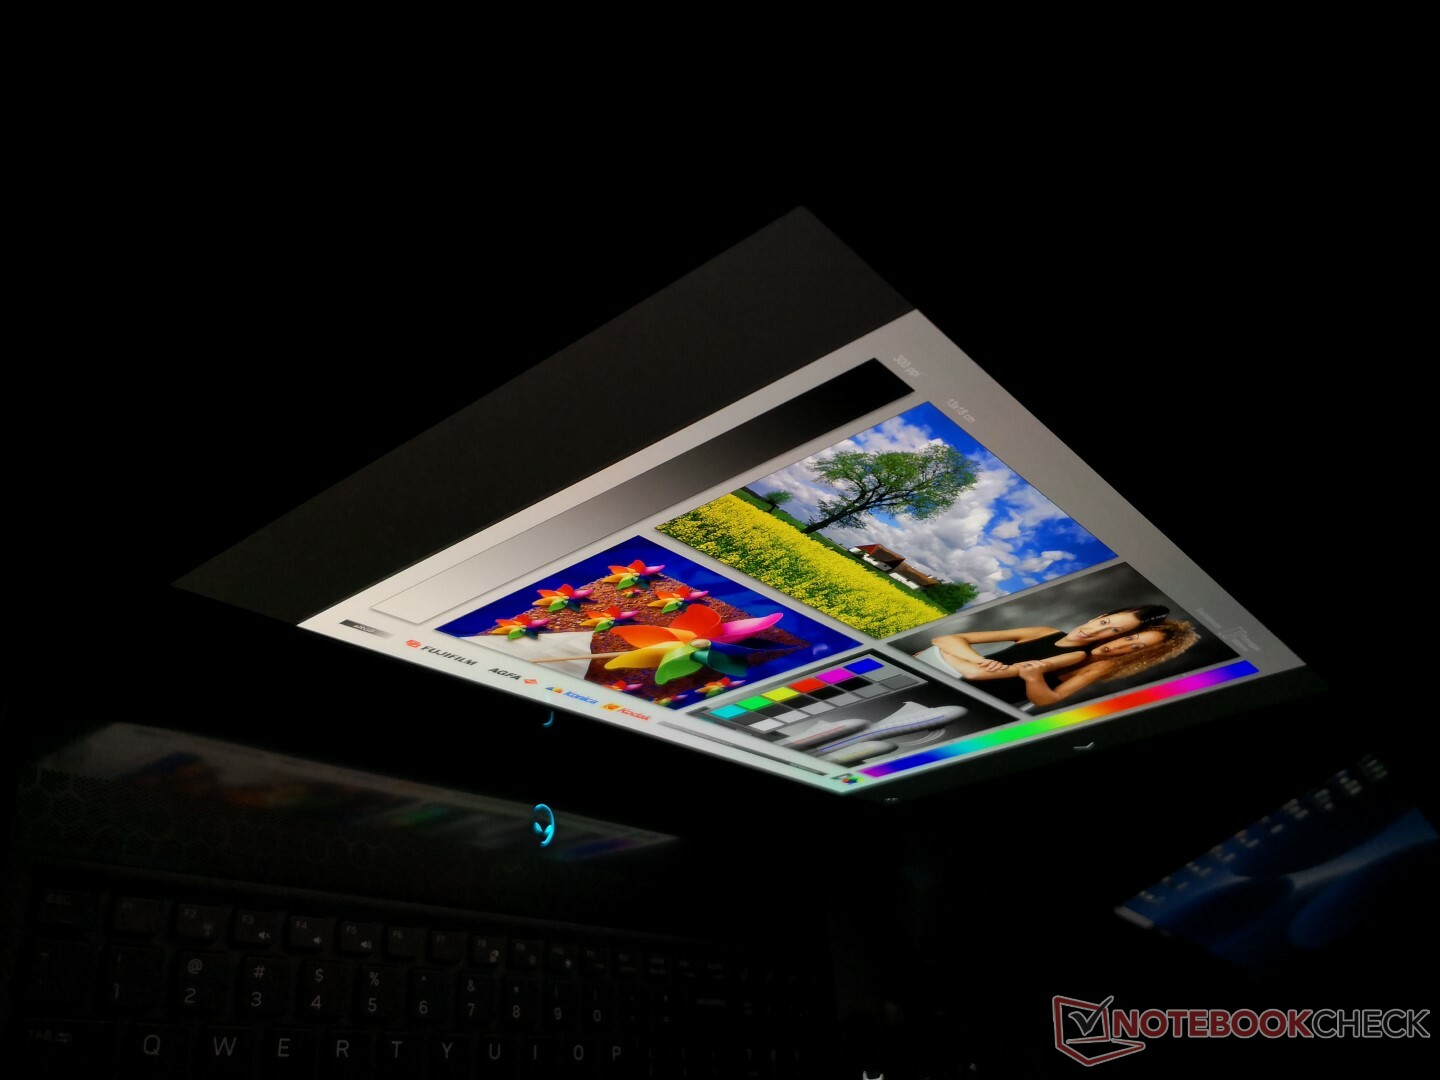
Viewing angles are wide with almost no shift in contrast. Unlike IPS, however, there is a slight "rainbow effect" if viewing from extreme angles that becomes more noticeable if viewing bright white content or web pages. It's thankfully not bothersome or impactful to the overall experience.
Performance
Dell usually offers a wider range of configurable options for its laptops when compared to competitors and the Alienware m15 is no different. Users can choose between a Core i5-8300H or unlocked Core i9-8950HK with 8 GB to 32 GB of RAM and GeForce GTX 1660 Ti or RTX 2080 Max-Q graphics.
Nvidia Optimus comes standard which means no G-Sync options regardless of configuration.
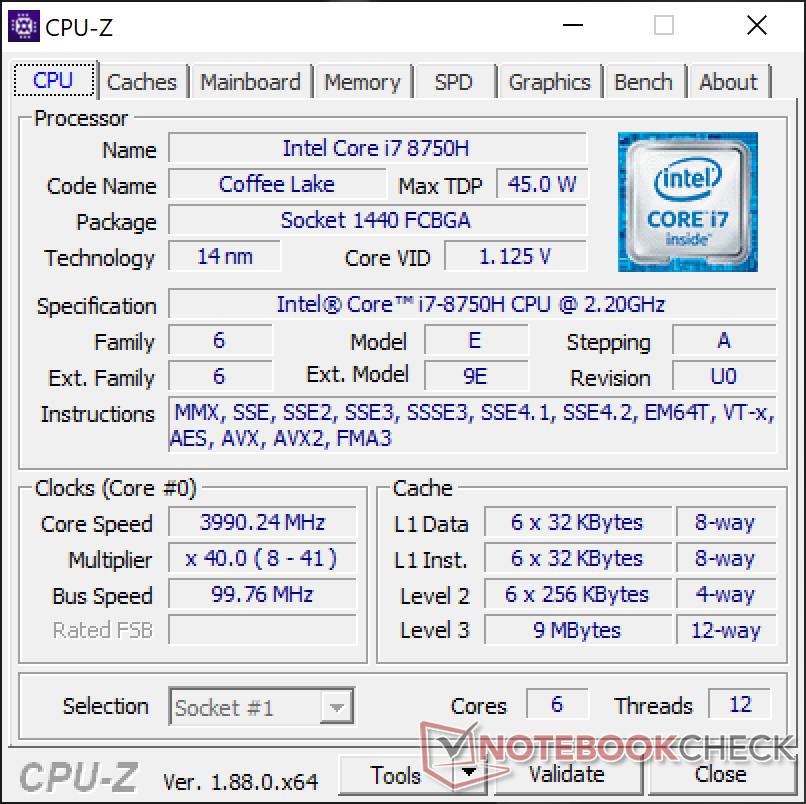
Processor
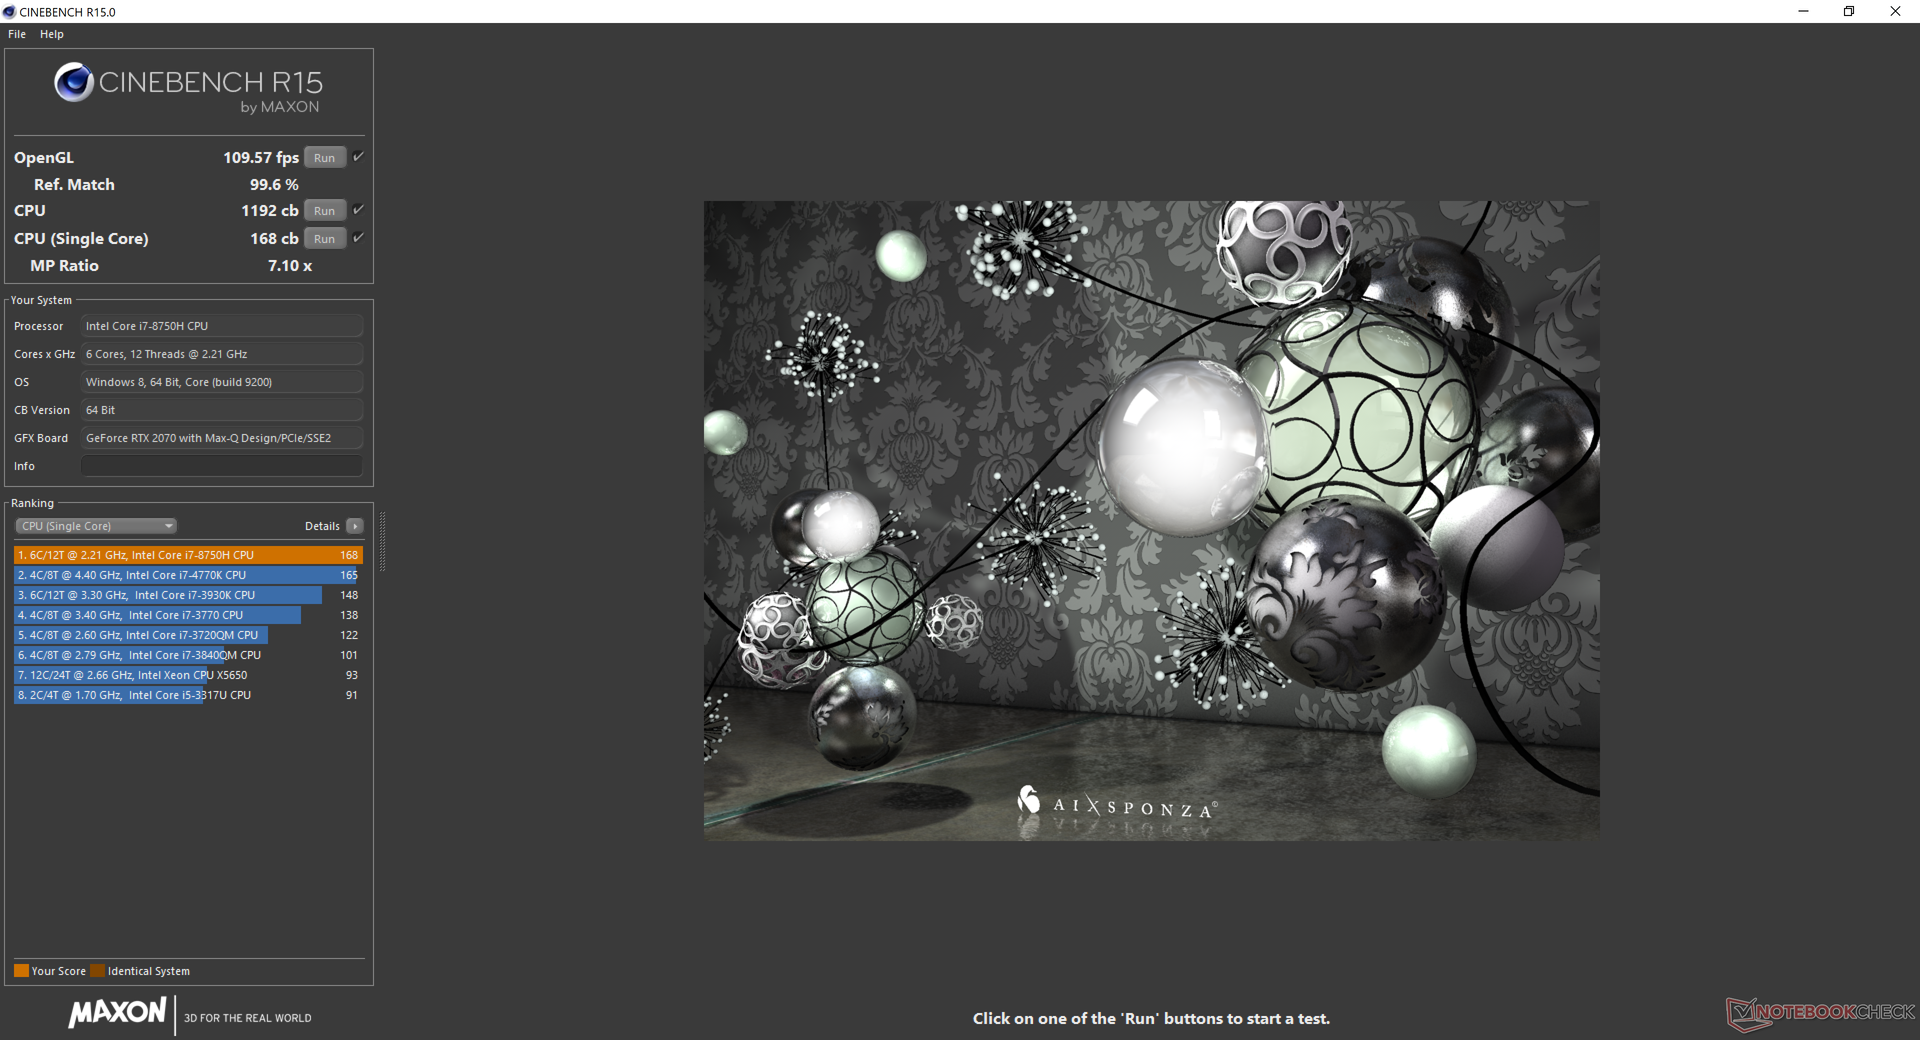
CPU performance is excellent and one the highest we've seen from the 8th gen Core i7-8750H. In fact, performance is even better than most laptops with the 9th gen Core i7-9750H due to better Turbo Boost sustainability on the Alienware as shown by our comparison graph below. The Razer Blade 15, for example, throttles CPU performance slightly more heavily over time to be about 5 to 6 percent slower after accounting for throttling. The impressive numbers the Alienware, however, come at the cost of temperatures as our Stress Test section will show.
Users upgrading from the less expensive quad-core Core i5-8300H SKU will see a near 50 percent gain in multi-thread performance.
See our dedicated page on the Core i7-8750H for more technical information and benchmarks.
System Performance
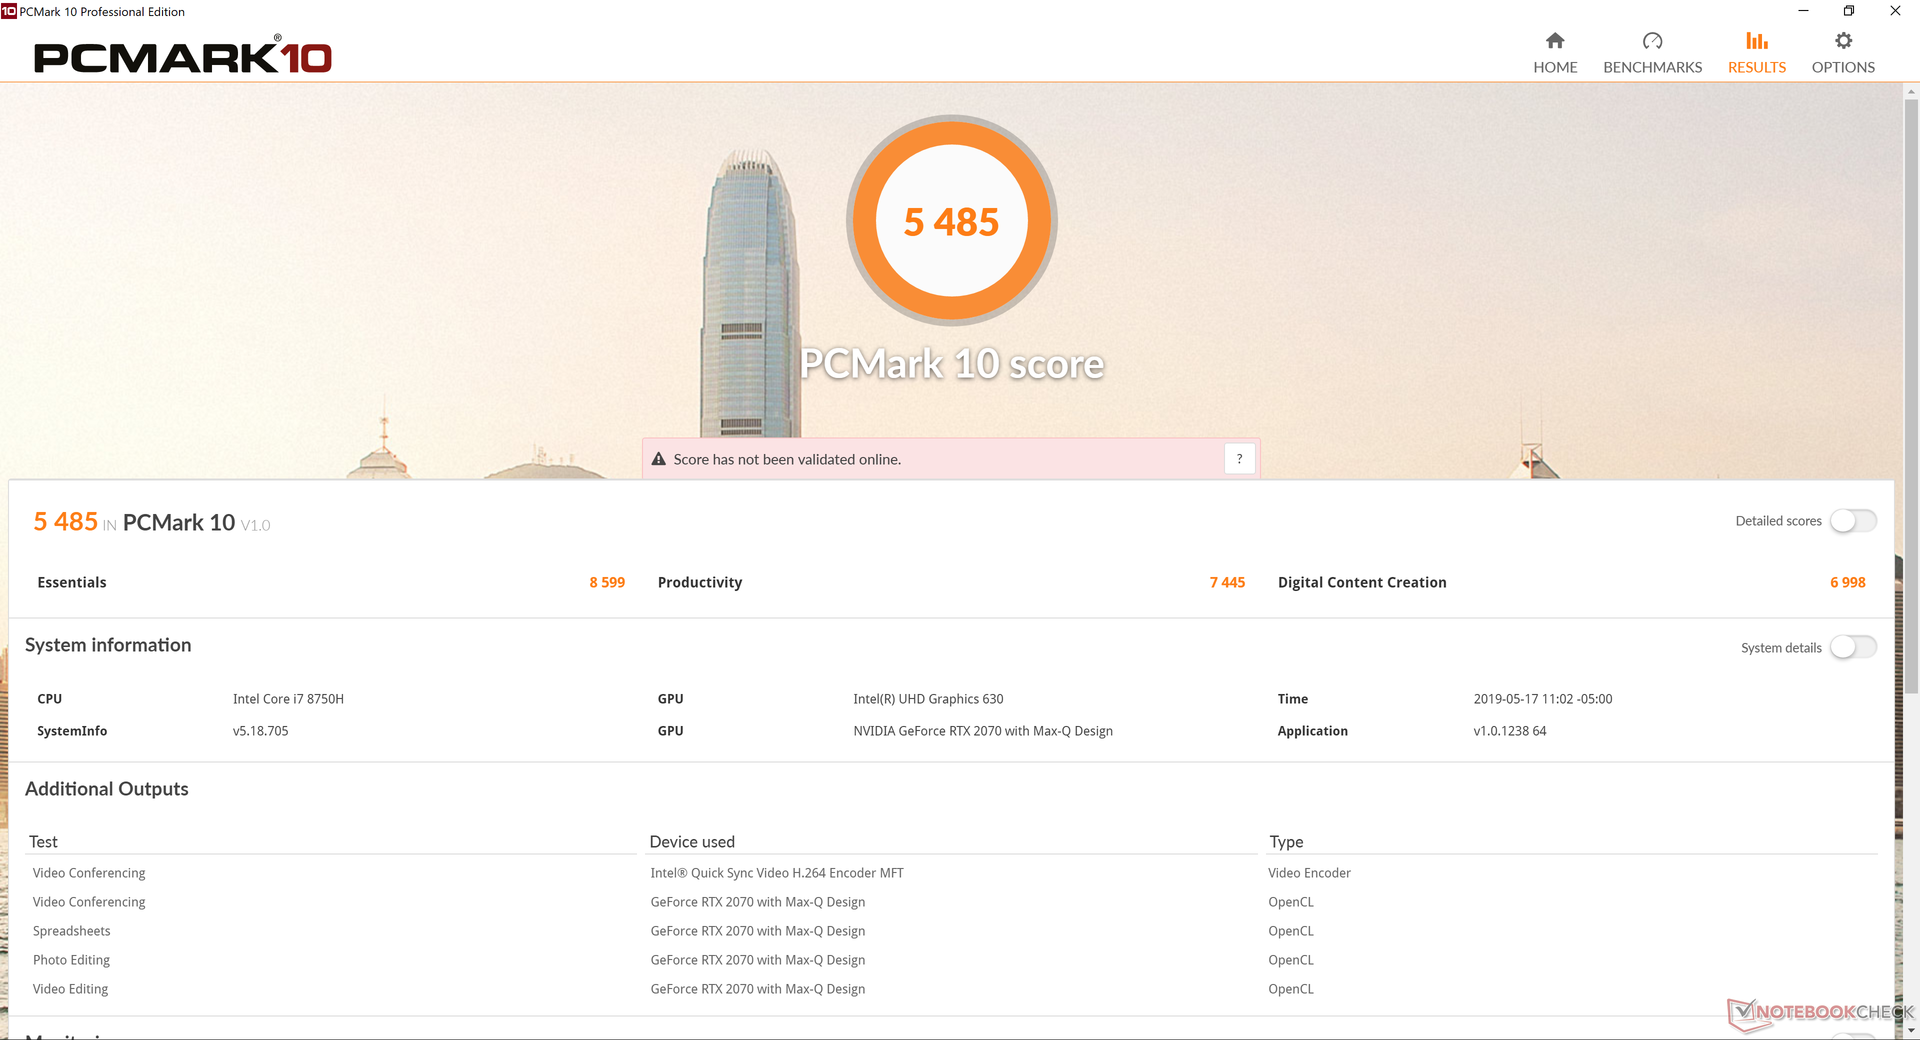
PCMark benchmarks rank our Alienware within single-digit percentages of last year's model. The only exception is the GPU-focused Digital Content Creation benchmark where the RTX 2070 Max-Q can flex its muscles over the slower GTX 1070 Max-Q.
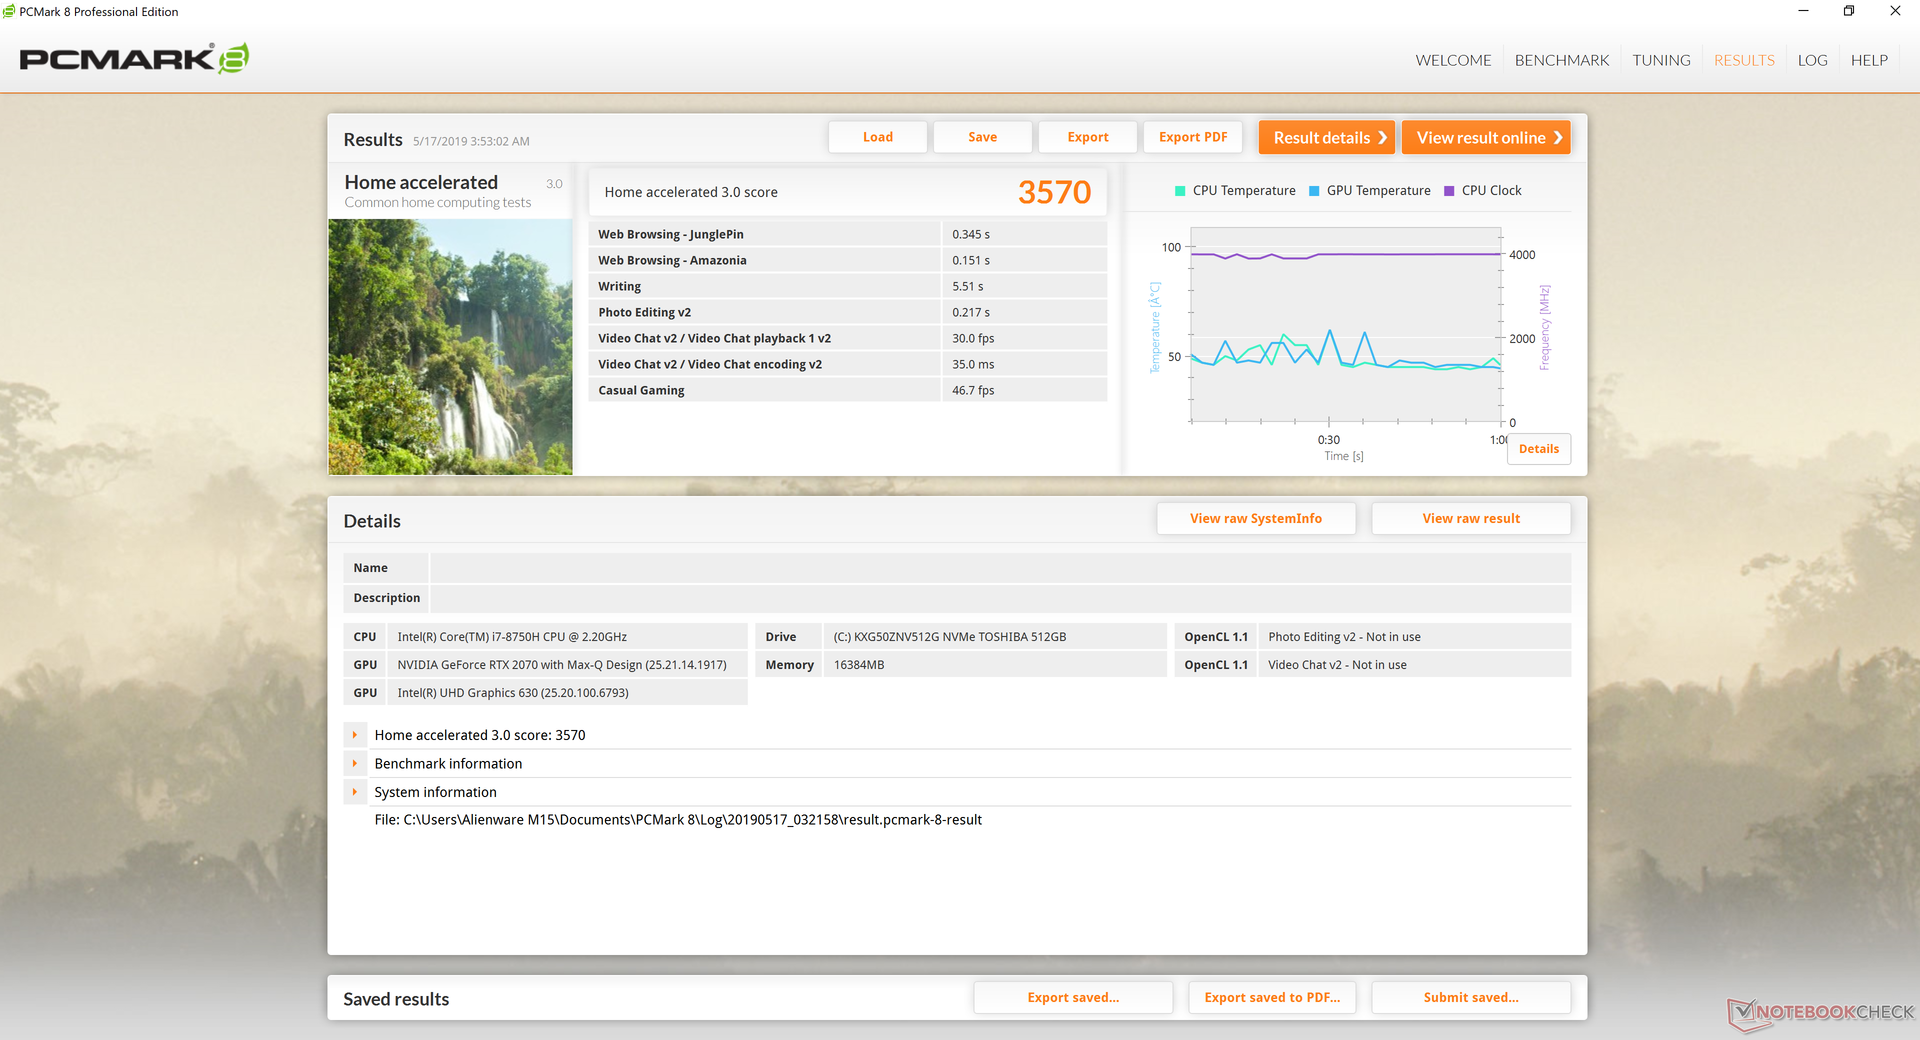
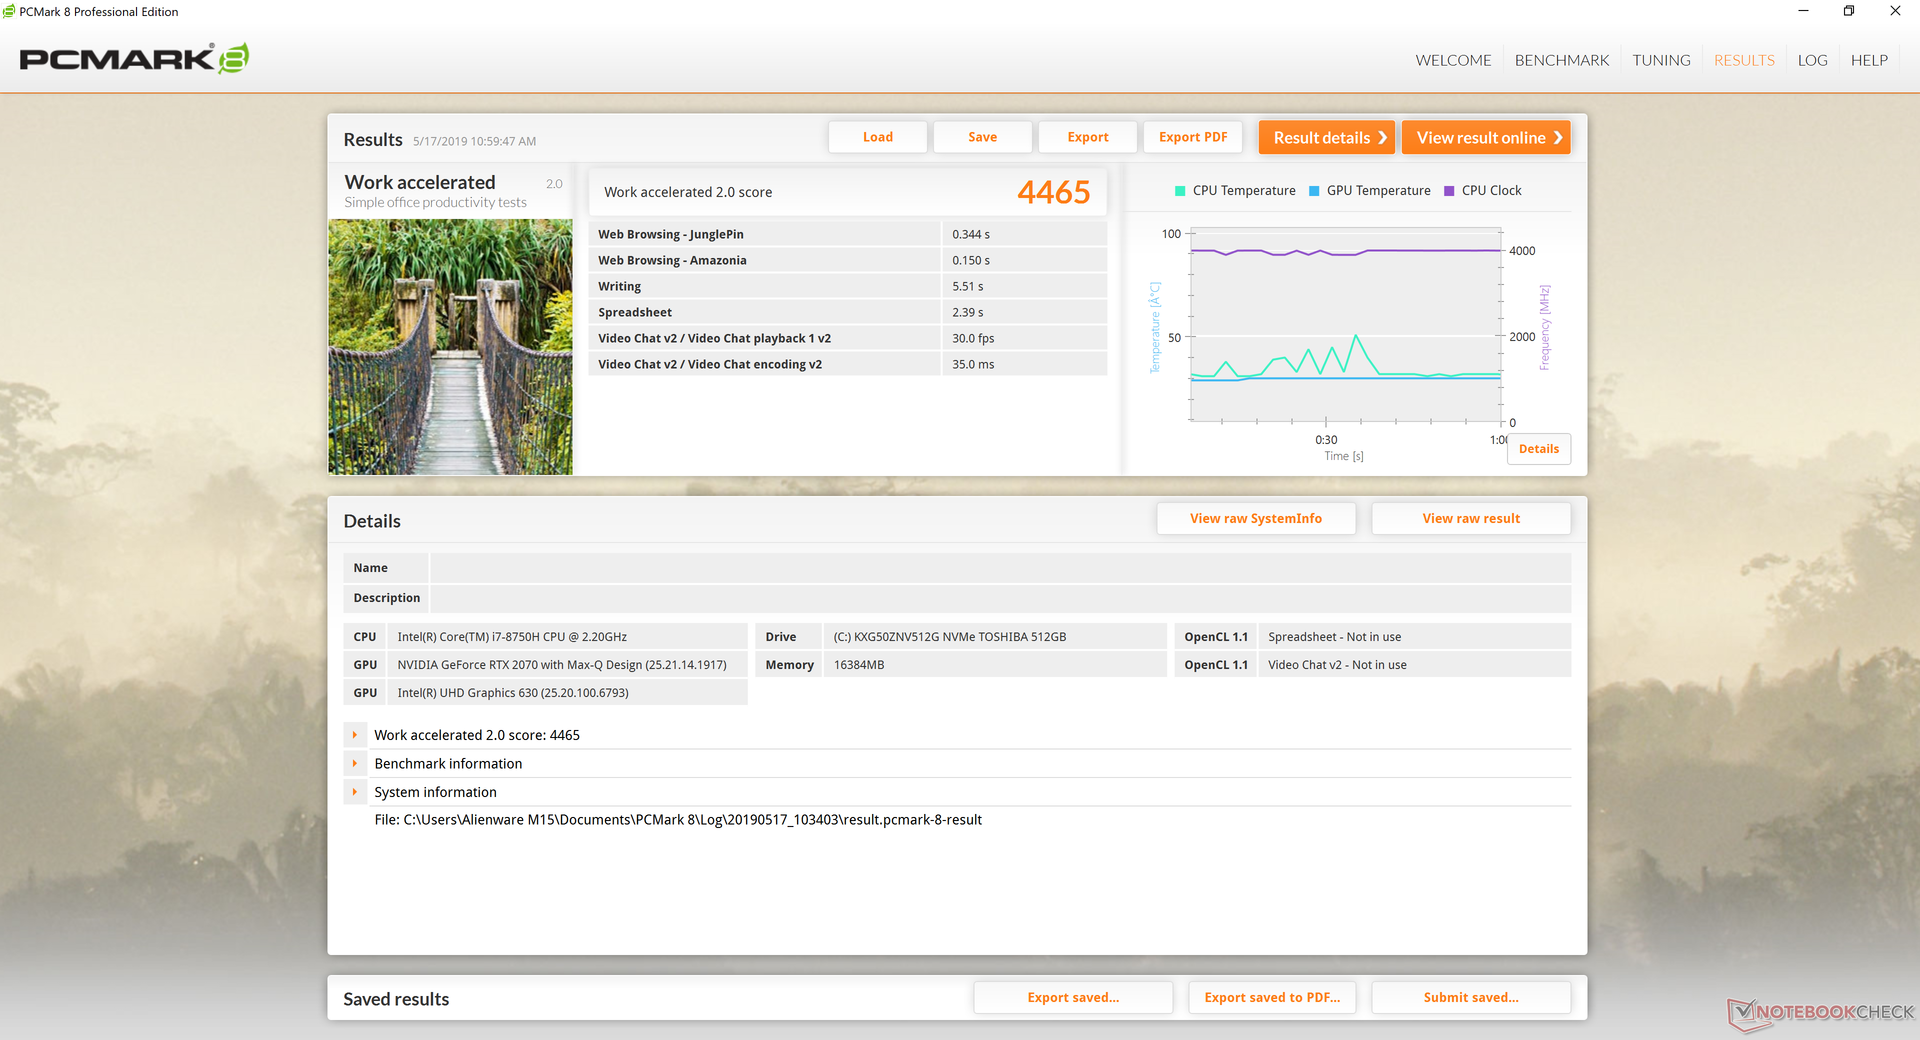
| PCMark 8 Home Score Accelerated v2 | 3570 points | |
| PCMark 8 Work Score Accelerated v2 | 4465 points | |
| PCMark 10 Score | 5485 points | |
Help | ||
Storage Devices
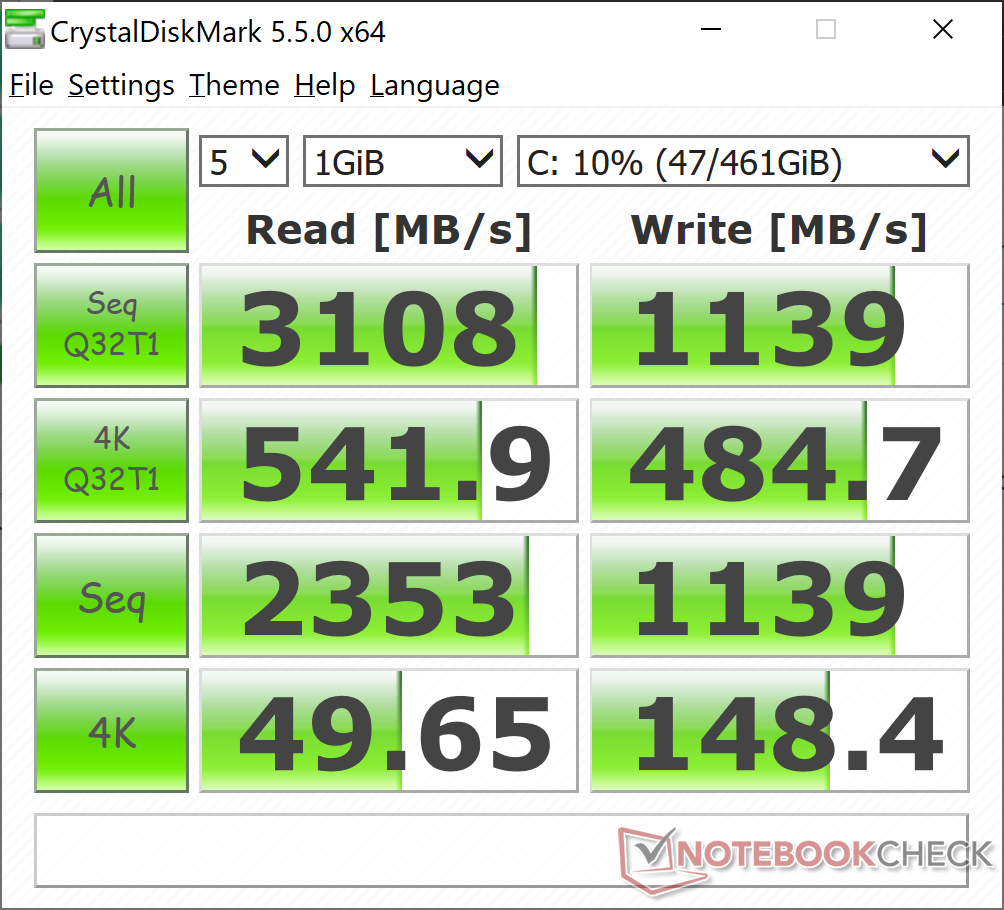
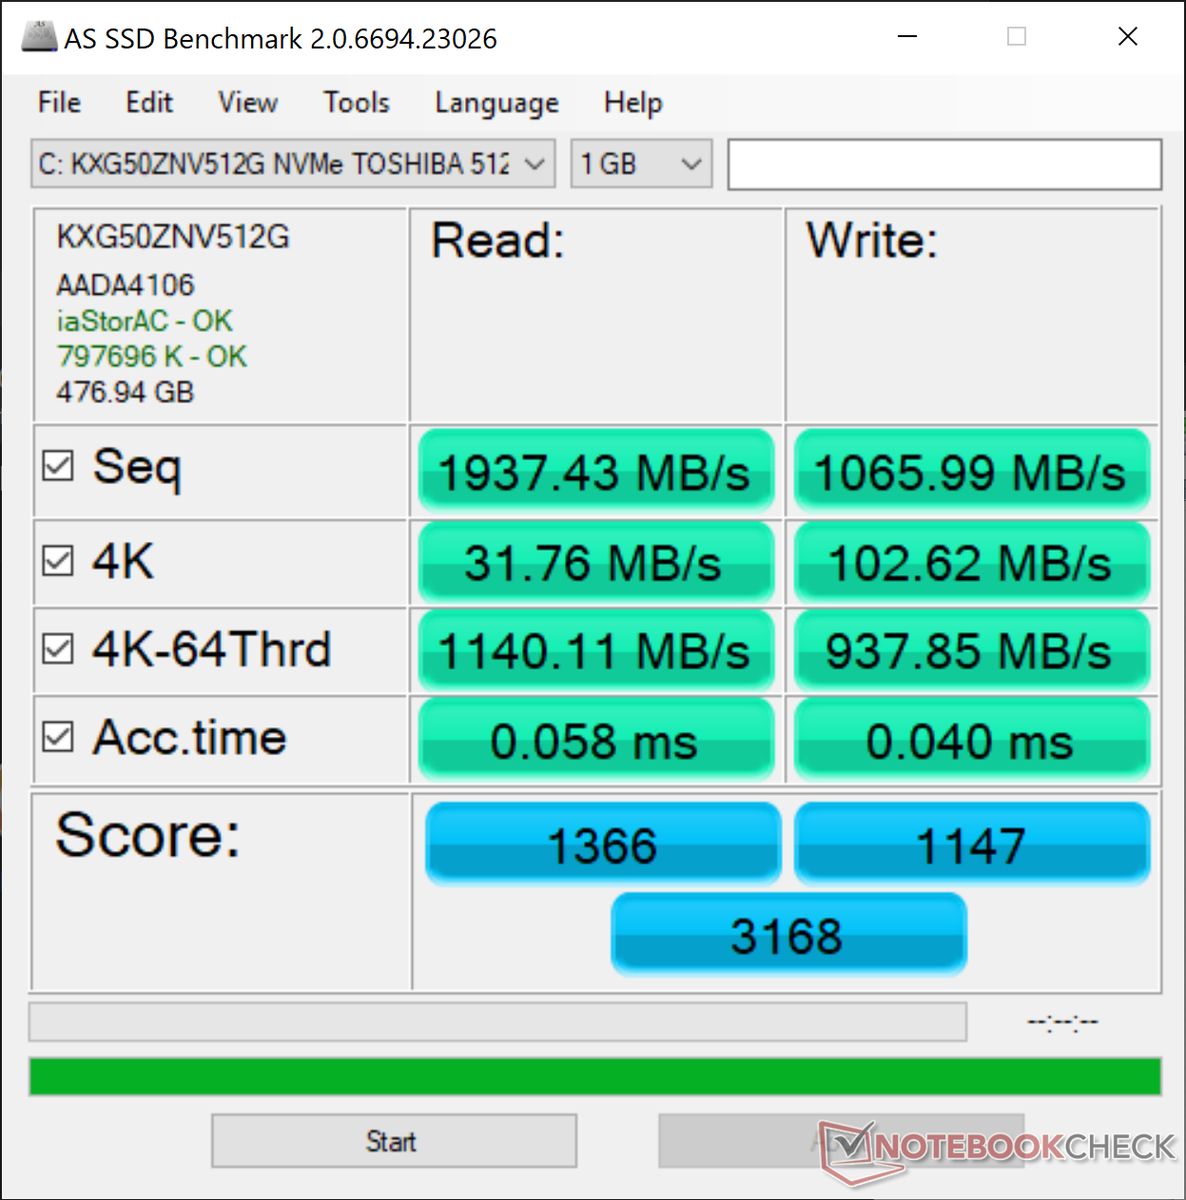
Available storage bays differ depending on the SKU. In this particular case, our test unit is equipped with the same 512 GB Toshiba XG5 NVMe SSD as on our last Alienware m15 test unit.AS SSD benchmark results are consequently almost the same between them. It's unfortunate that you can't specifically request Samsung drives instead as the Toshiba offers comparatively slower sequential write rates.
See our table of HDDs and SSDs for more benchmark comparisons.
| Alienware m15 P79F Toshiba XG5 KXG50ZNV512G | Alienware m15 GTX 1070 Max-Q Toshiba XG5 KXG50ZNV512G | Razer Blade 15 RTX 2080 Max-Q Samsung SSD PM981 MZVLB512HAJQ | Asus Zephyrus S GX502GW 2x Intel SSD 660p SSDPEKNW512G8 (RAID 0) | Aorus 15 W9 Intel SSD 760p SSDPEKKW512G8 | Dell XPS 15 9570 Core i9 UHD Samsung SSD PM981 MZVLB1T0HALR | |
|---|---|---|---|---|---|---|
| AS SSD | -24% | 36% | 8% | 21% | 31% | |
| Seq Read | 1937 | 1967 2% | 1832 -5% | 2506 29% | 2611 35% | 1320 -32% |
| Seq Write | 1066 | 1135 6% | 1864 75% | 1712 61% | 1545 45% | 1500 41% |
| 4K Read | 31.76 | 29.17 -8% | 52.1 64% | 48.32 52% | 55.2 74% | 30.73 -3% |
| 4K Write | 102.6 | 93.4 -9% | 108.3 6% | 103.6 1% | 111.9 9% | 94.4 -8% |
| 4K-64 Read | 1140 | 995 -13% | 1159 2% | 624 -45% | 884 -22% | 1453 27% |
| 4K-64 Write | 938 | 656 -30% | 1807 93% | 1253 34% | 941 0% | 1815 93% |
| Access Time Read * | 0.058 | 0.116 -100% | 0.05 14% | 0.08 -38% | 0.045 22% | 0.061 -5% |
| Access Time Write * | 0.04 | 0.063 -58% | 0.034 15% | 0.04 -0% | 0.033 17% | 0.044 -10% |
| Score Read | 1366 | 1221 -11% | 1394 2% | 923 -32% | 1200 -12% | 1616 18% |
| Score Write | 1147 | 862 -25% | 2102 83% | 1528 33% | 1207 5% | 2059 80% |
| Score Total | 3168 | 2667 -16% | 4221 33% | 2896 -9% | 2982 -6% | 4507 42% |
| Copy ISO MB/s | 946 | 642 -32% | 2083 120% | 2131 125% | 2577 172% | |
| Copy Program MB/s | 452.8 | 431.5 -5% | 496.5 10% | 407.2 -10% | 515 14% | |
| Copy Game MB/s | 1013 | 706 -30% | 977 -4% | 1094 8% | 1120 11% |
* ... smaller is better

GPU Performance
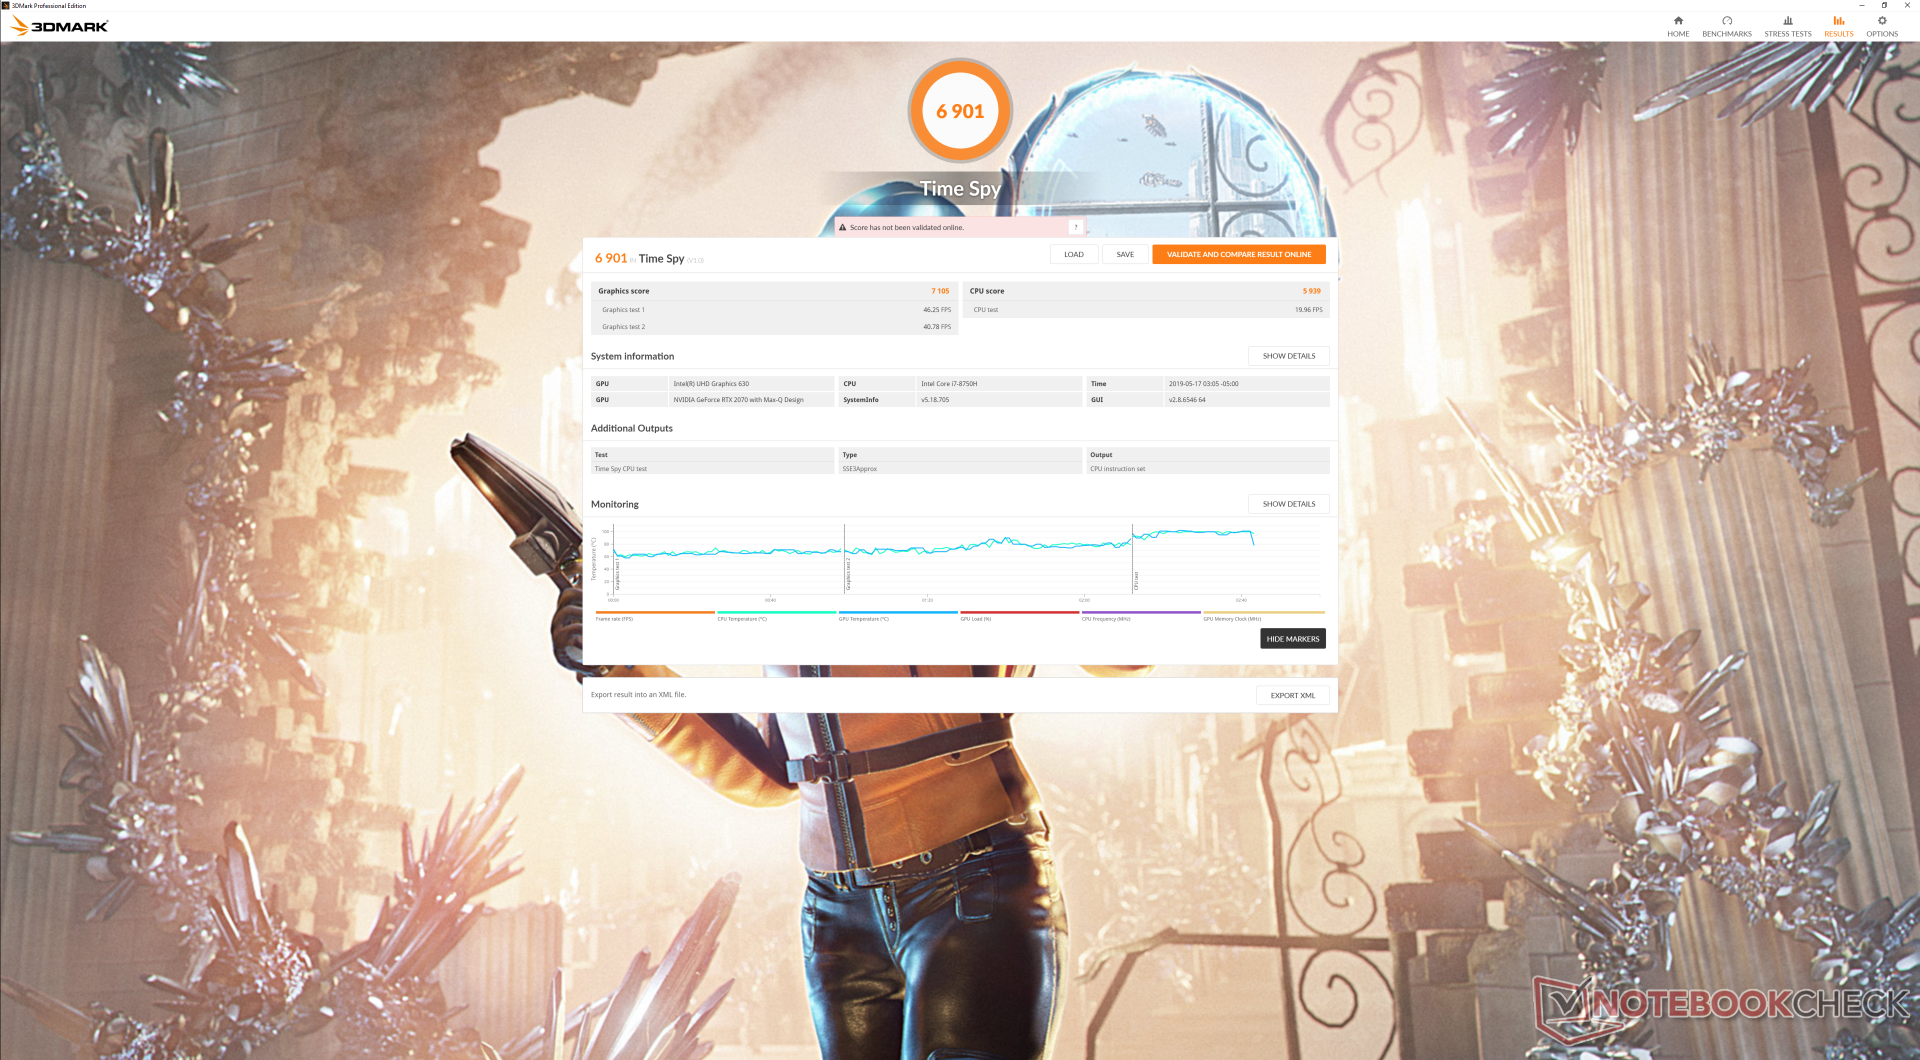
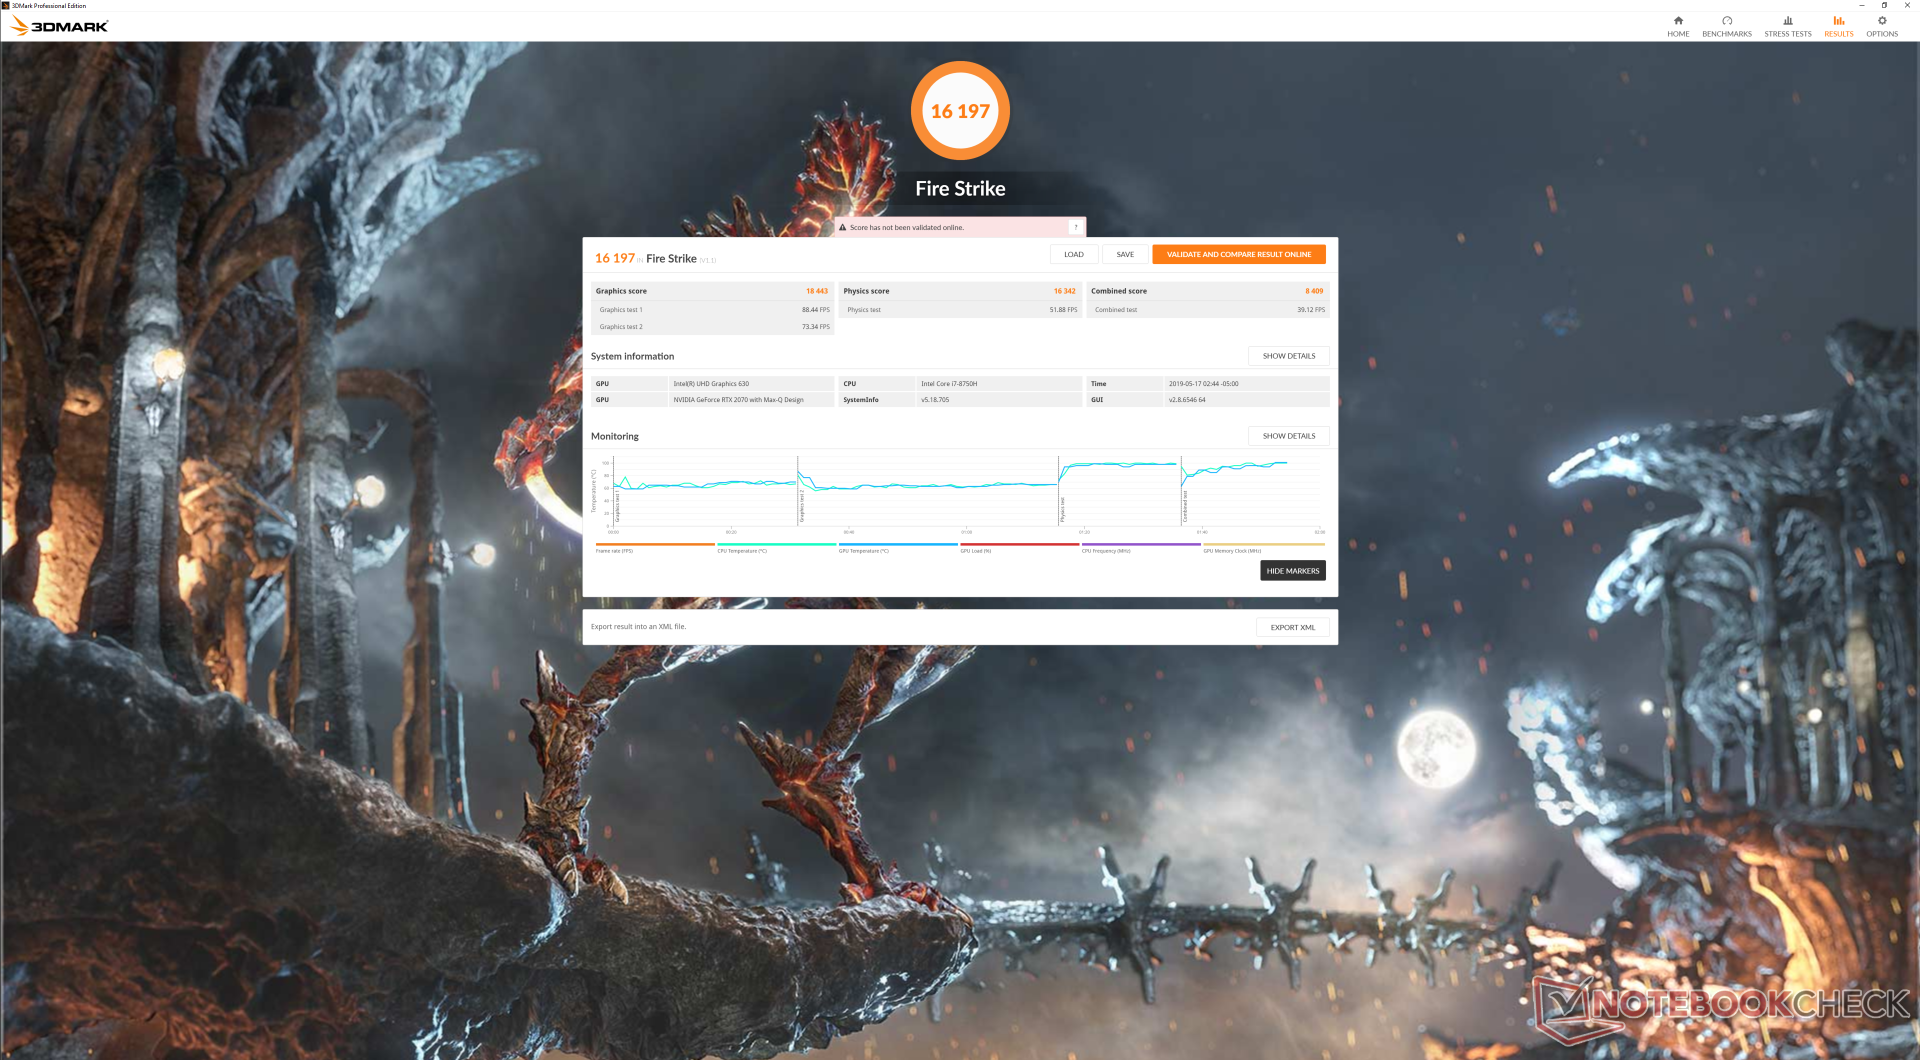
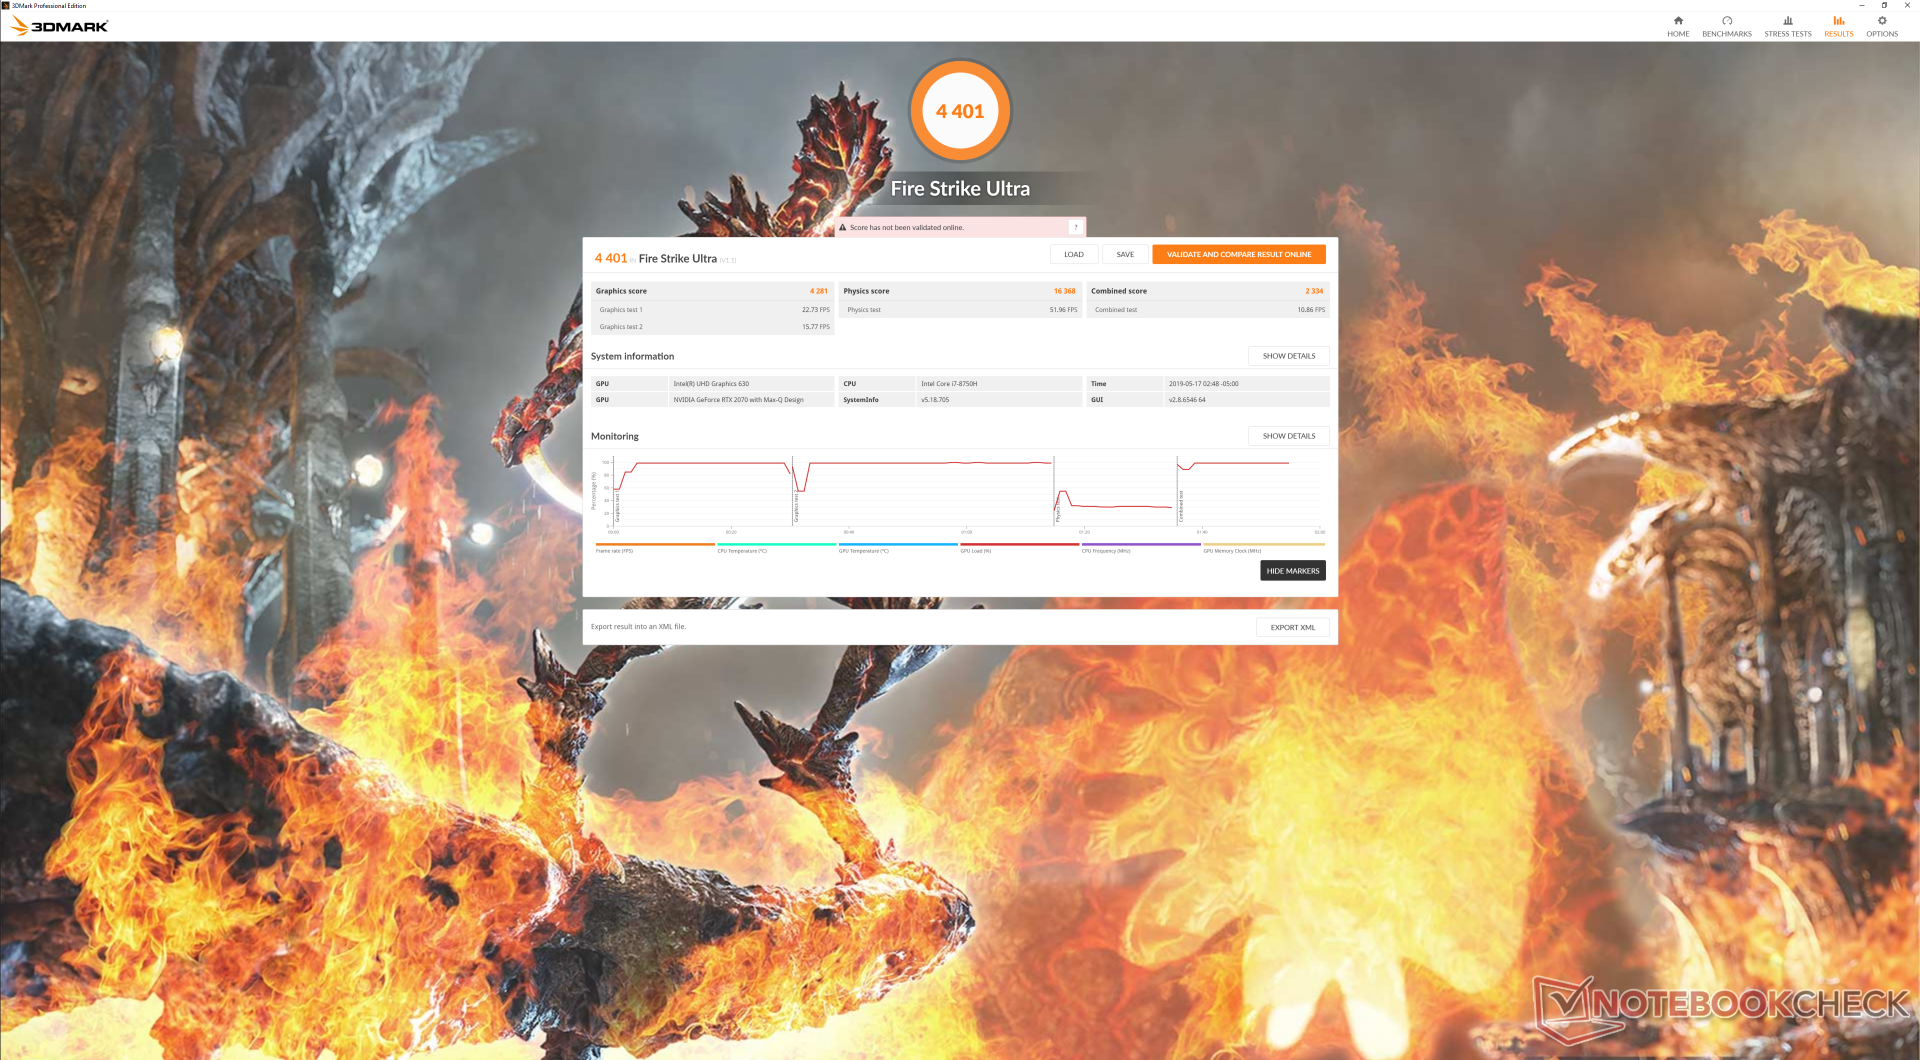
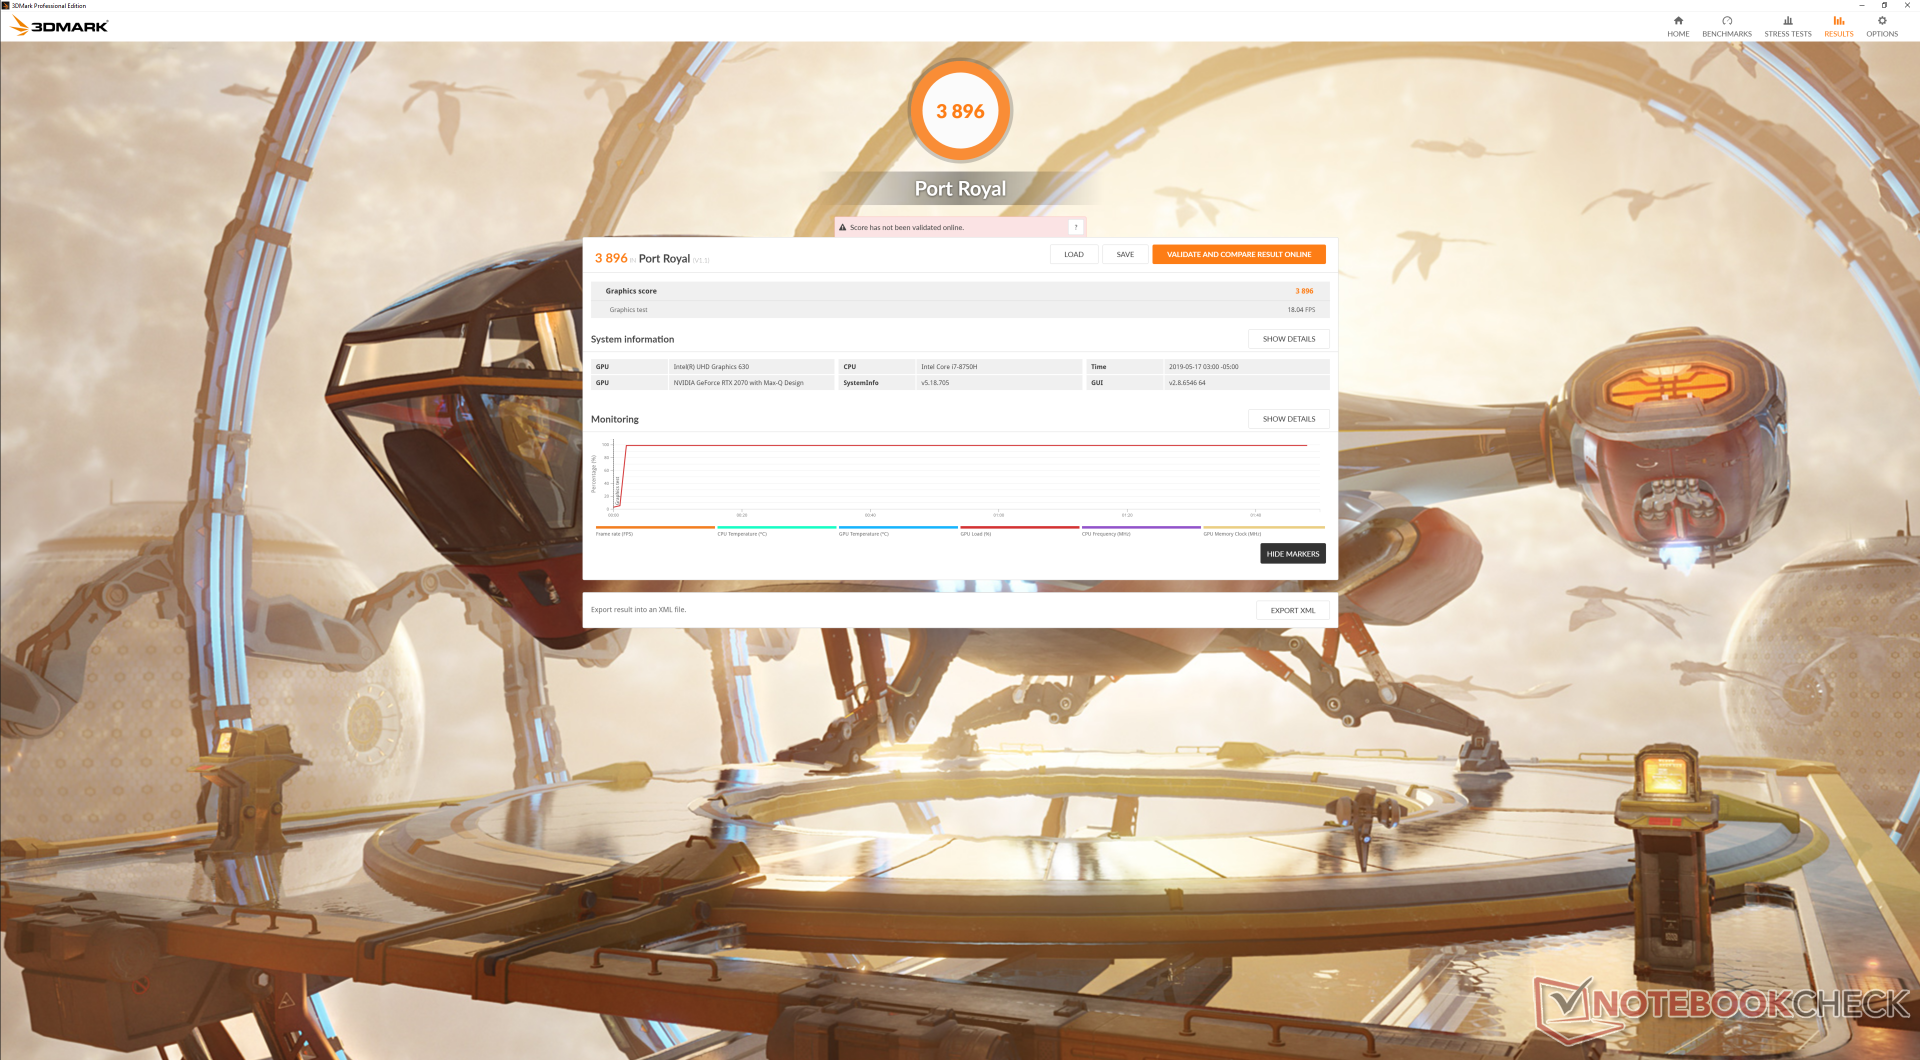
Graphics performance is about 15 percent faster than the GTX 1070 Max-Q in 3DMark Fire Strike and 56 percent faster than the same GPU in 3DMark Time Spy. In other words, games running on DX12 will benefit the most from the RTX 2070 Max-Q. Raw performance is 9 percent higher than the average RTX 2070 Max-Q in our database to be almost on par with a standard mobile RTX 2070.
Gaming at native 4K UHD is possible albeit difficult without tuning down settings to Low or Medium. Enabling DLSS would also be an option if the title supports it. Be sure to enable DX12 to get more performance out of a GeForce RTX card.
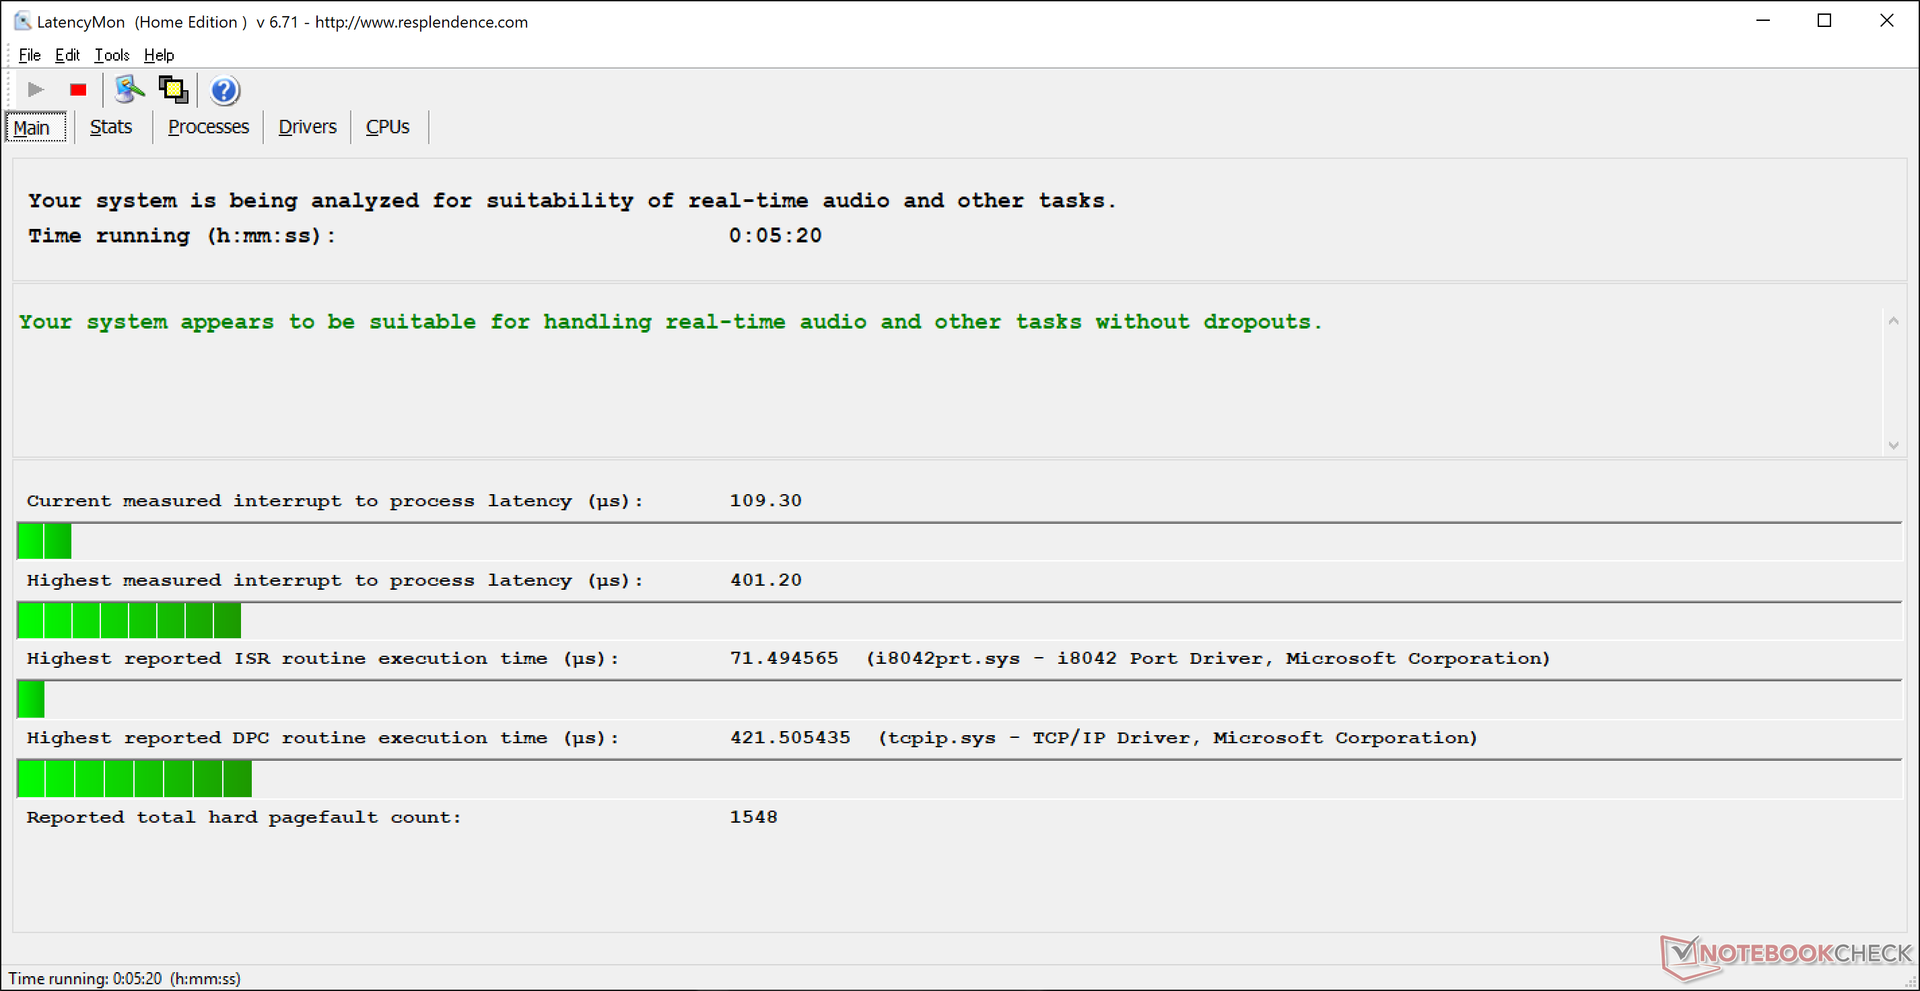
Running Witcher 3 shows no recurring frame dips to suggest no interrupting background activity when gaming.
See our dedicated page on the GeForce RTX 2070 Max-Q for more technical information and benchmarks.
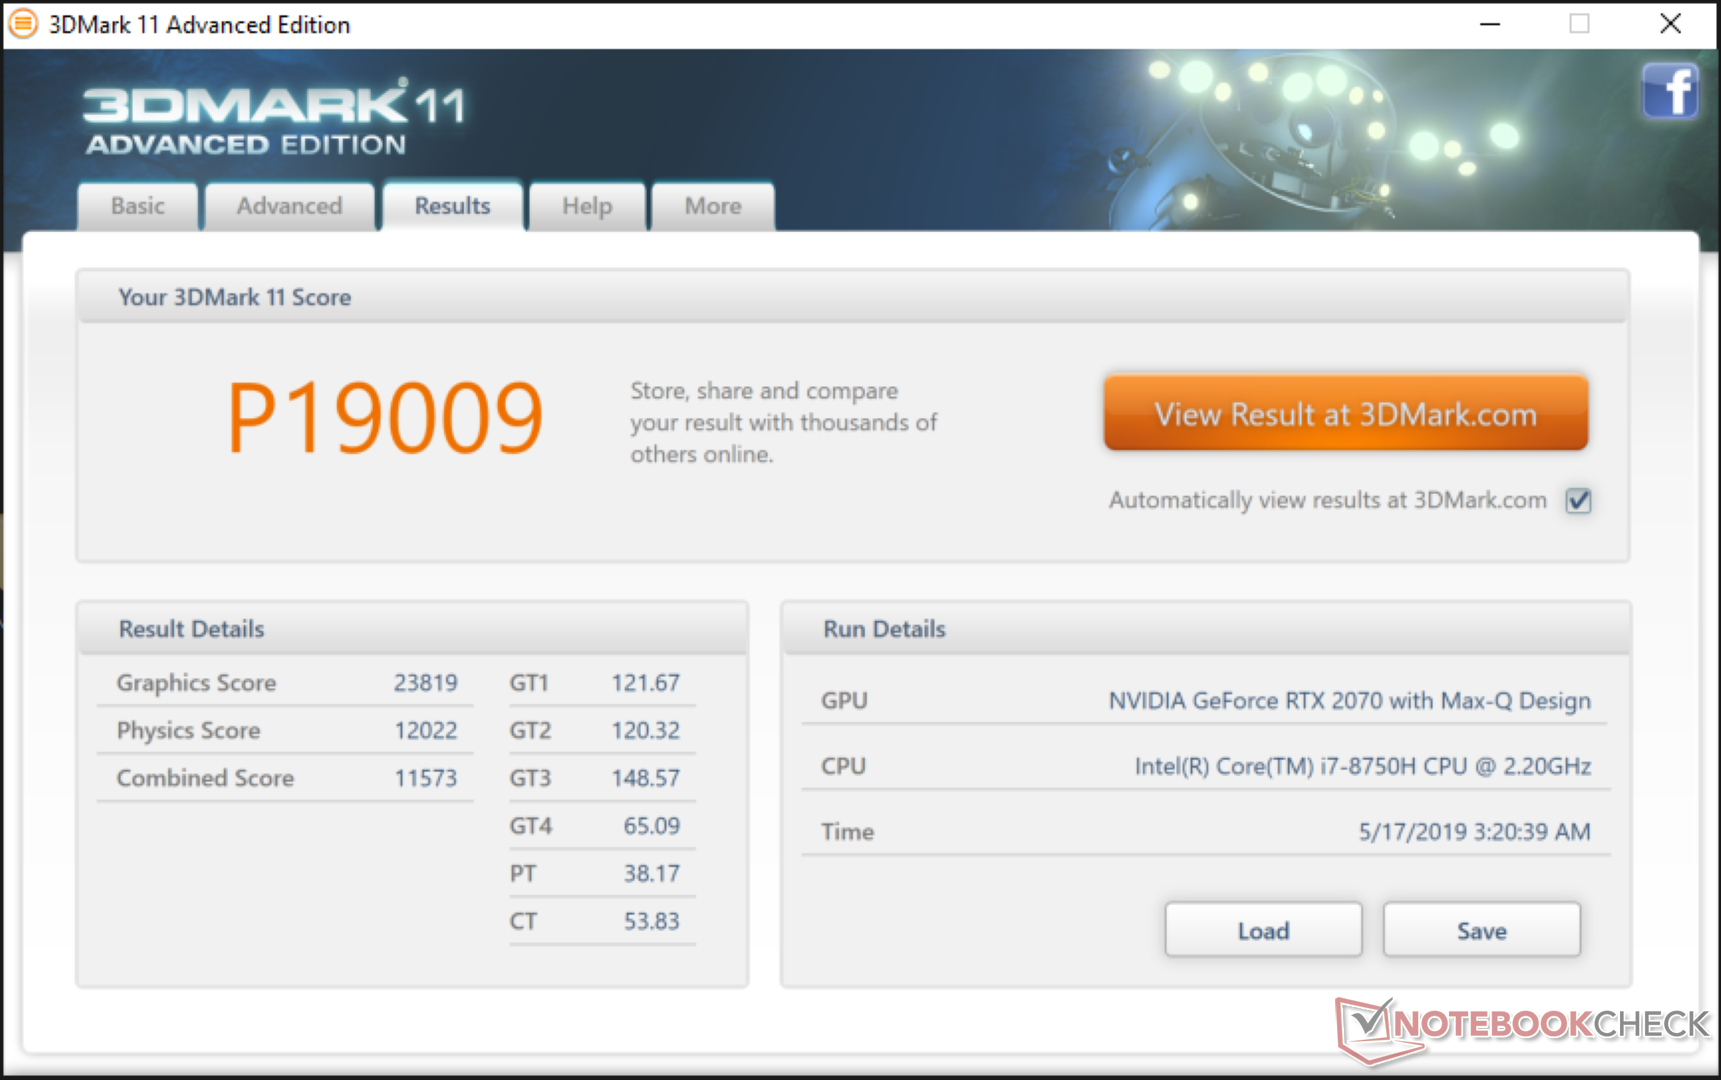

| 3DMark 11 Performance | 19009 points | |
| 3DMark Cloud Gate Standard Score | 24876 points | |
| 3DMark Fire Strike Score | 16197 points | |
| 3DMark Time Spy Score | 6901 points | |
Help | ||
| Shadow of the Tomb Raider - 1920x1080 Highest Preset AA:T | |
| MSI GE75 9SG | |
| Alienware m15 P79F | |
| Average NVIDIA GeForce RTX 2070 Max-Q (57 - 89, n=12) | |
| Asus Zephyrus S GX502GW | |
| low | med. | high | ultra | 4K | |
| BioShock Infinite (2013) | 296.7 | 261.5 | 243.7 | 153.7 | |
| The Witcher 3 (2015) | 261.8 | 200.6 | 123.8 | 64.4 | 47.2 |
| Rise of the Tomb Raider (2016) | 204.7 | 162.3 | 125.8 | 105.7 | 45.6 |
| Shadow of the Tomb Raider (2018) | 119 | 93 | 87 | 84 | 33 |
Emissions
System Noise
Fan noise is essentially identical to last year's Alienware m15 despite the huge gains in graphics performance. What users should keep in mind, however, is that fan noise is tied more closely to the Alienware Command Center power settings rather than the Windows power settings when compared to most other laptops. When setting the system profile to "High Performance" or "Turbo" on the Alienware Command Center app, for example, fan noise immediately jumps to its maximum of 50 dB(A) no matter the onscreen load. It's important to set the system to "Quiet" mode when the extra horsepower is not needed.
Since we always want to benchmark gaming laptops at their best, we elected to run games and synthetic loads at the "High Performance" setting. The constant 50 dB(A) fan noise is very loud and almost as loud as the Asus Zephyrus S GX502GW, CUK Model Z, or Aorus 15 W9 when under similar gaming loads. Interestingly, running the system on "Balanced" mode will not reduce fan noise when gaming. It will, however, cause the fans to pulse more frequently between 40 dB(A) and 50 dB(A) depending on the load.
Users who want quieter fans can consider the Razer Blade 15 or MSI GS65.
We can notice no coil whine on our test unit.
| Alienware m15 P79F GeForce RTX 2070 Max-Q, i7-8750H, Toshiba XG5 KXG50ZNV512G | Alienware m15 GTX 1070 Max-Q GeForce GTX 1070 Max-Q, i7-8750H, Toshiba XG5 KXG50ZNV512G | Razer Blade 15 RTX 2080 Max-Q GeForce RTX 2080 Max-Q, i7-9750H, Samsung SSD PM981 MZVLB512HAJQ | Asus Zephyrus S GX502GW GeForce RTX 2070 Mobile, i7-9750H, 2x Intel SSD 660p SSDPEKNW512G8 (RAID 0) | Aorus 15 W9 GeForce RTX 2060 Mobile, i7-8750H, Intel SSD 760p SSDPEKKW512G8 | Dell XPS 15 9570 Core i9 UHD GeForce GTX 1050 Ti Max-Q, i9-8950HK, Samsung SSD PM981 MZVLB1T0HALR | |
|---|---|---|---|---|---|---|
| Noise | 13% | 17% | 1% | -1% | 15% | |
| off / environment * | 28.2 | 28.6 -1% | 28.3 -0% | 30 -6% | 29 -3% | 28.2 -0% |
| Idle Minimum * | 30.3 | 28.6 6% | 28.8 5% | 31 -2% | 34 -12% | 28.5 6% |
| Idle Average * | 35.4 | 28.6 19% | 28.8 19% | 33 7% | 36 -2% | 28.6 19% |
| Idle Maximum * | 50.3 | 28.6 43% | 29 42% | 38 24% | 38 24% | 28.8 43% |
| Load Average * | 50.3 | 40.8 19% | 33.5 33% | 50 1% | 52 -3% | 36.2 28% |
| Witcher 3 ultra * | 50.2 | 49.6 1% | 45 10% | 53 -6% | 52 -4% | 47.6 5% |
| Load Maximum * | 50.2 | 49.6 1% | 45.2 10% | 56 -12% | 53 -6% | 47.6 5% |
* ... smaller is better
Noise Level
| Idle |
| 30.3 / 35.4 / 50.3 dB(A) |
| Load |
| 50.3 / 50.2 dB(A) |
 | ||
30 dB silent 40 dB(A) audible 50 dB(A) loud |
||
min: | ||
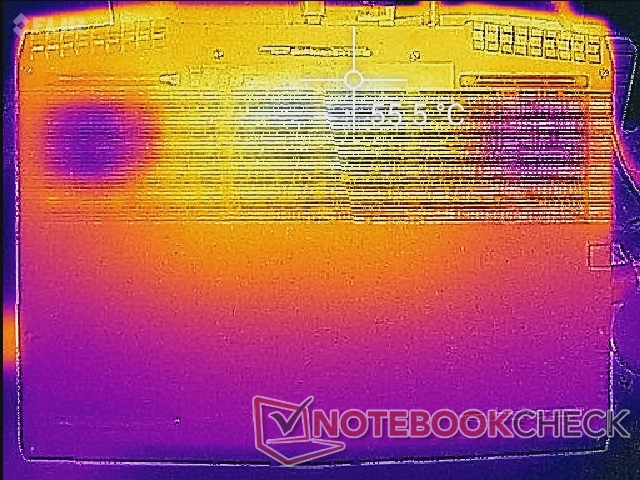
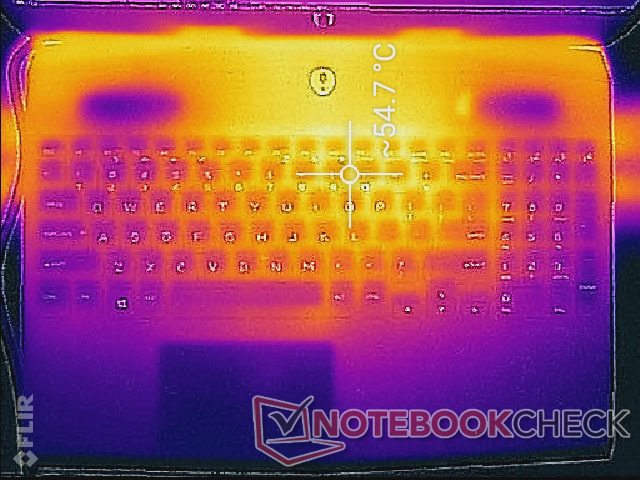
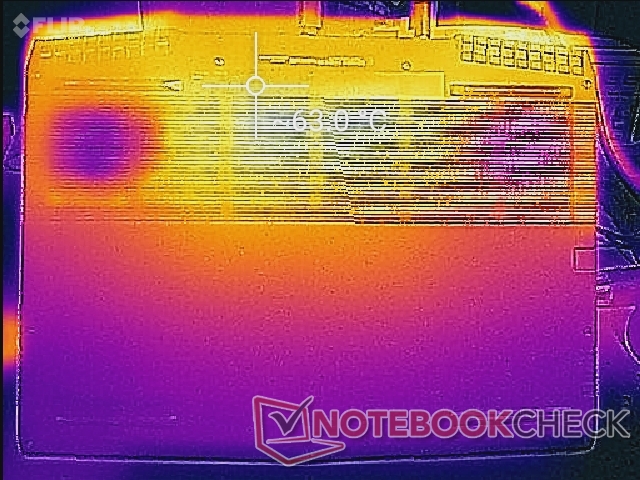
Temperature
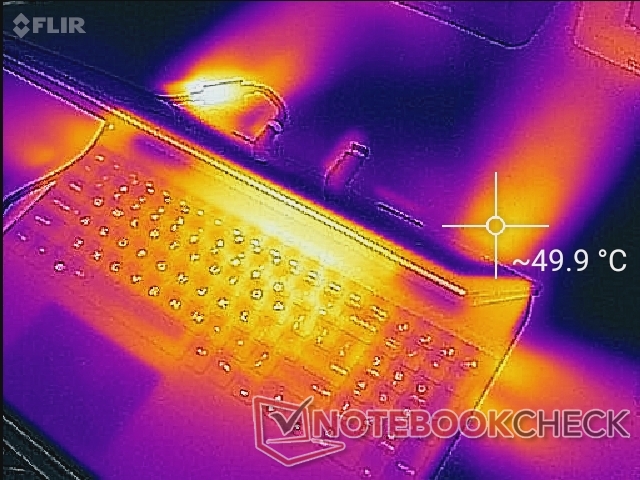
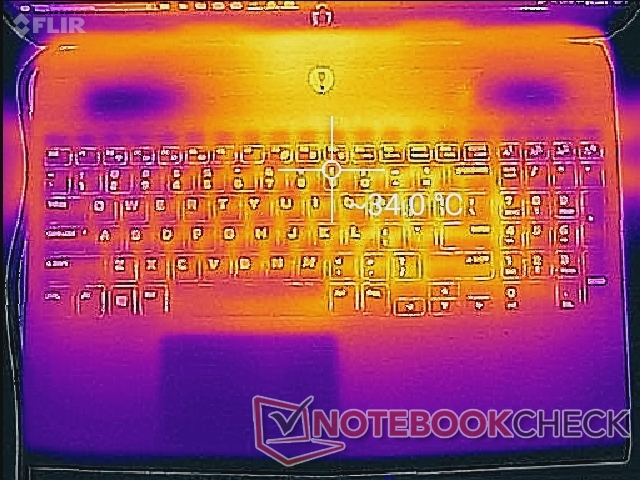
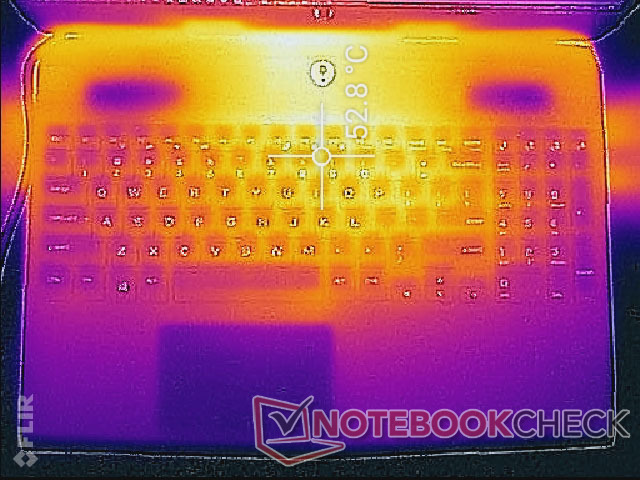
Surface temperatures remain largely identical to last year's model with GTX 1070 Max-Q graphics. Hot spots toward the center top row of the keyboard can reach over 50 C when running Witcher 3, but palms and fingers are thankfully unlikely to touch these areas frequently when gaming. Surface temperatures on the competing Asus Zephyrus S GX502GW also approach 50 C when under similar loads.
Stress Test
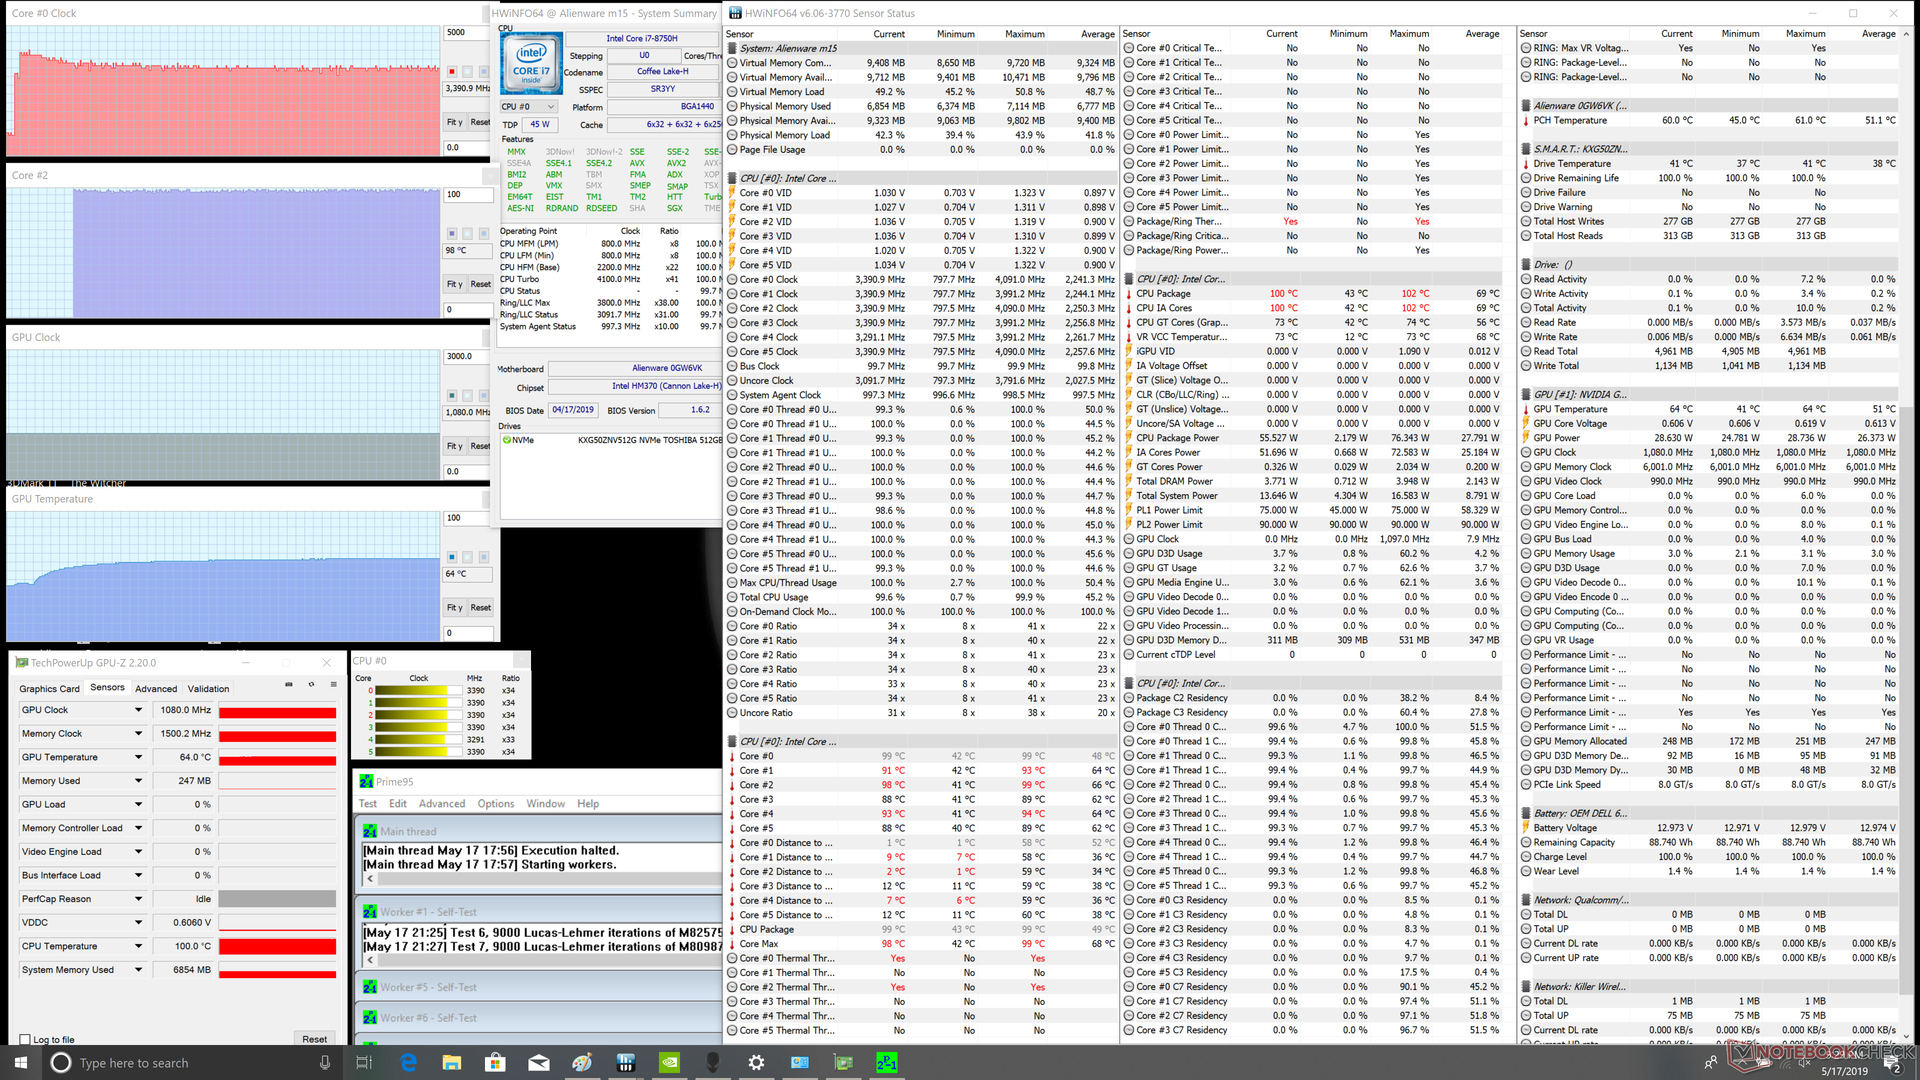
We stress the system with synthetic loads to identify for any potential throttling or stability issues. Results are warmer than what we recorded on last year's Alienware m15 with GTX 1070 Max-Q graphics. When running Witcher 3, for example, CPU and GPU temperatures stabilize at 98 C and 80 C, respectively, compared to 81 C and 71 C on the 2018 Alienware m15. Both systems, of course, were running on the High Performance profile. CPU clock rates can reach up to 3.9 GHz during the start of the test, but this immediately and inevitably falls to around 3.4 GHz in order to keep temperatures in check. Other 15.6-inch gaming laptops have cooler core temperatures when gaming including the MSI GS65.
Running on battery power will limit performance. A 3DMark 11 run on batteries returns Physics and Graphics scores of 9467 and 6630 points, respectively, compared to 12022 and 23819 points when on mains.

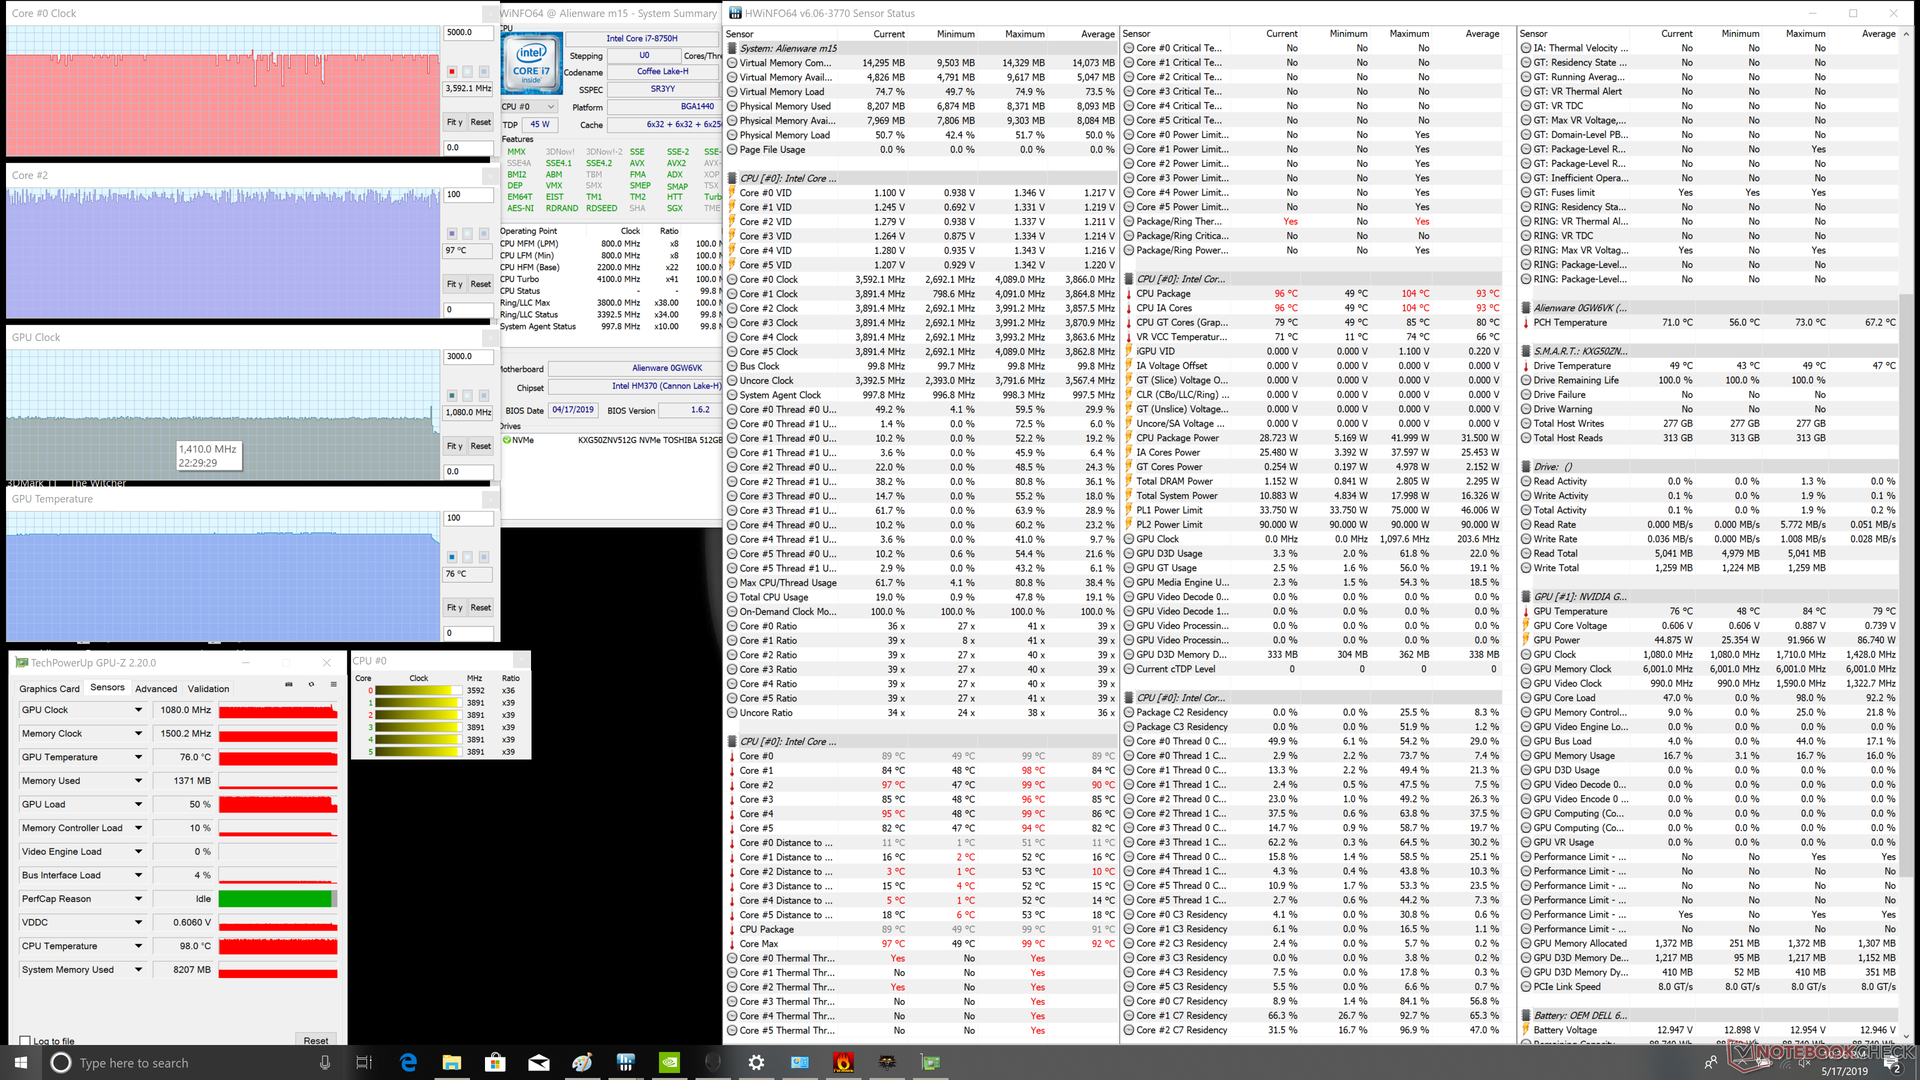
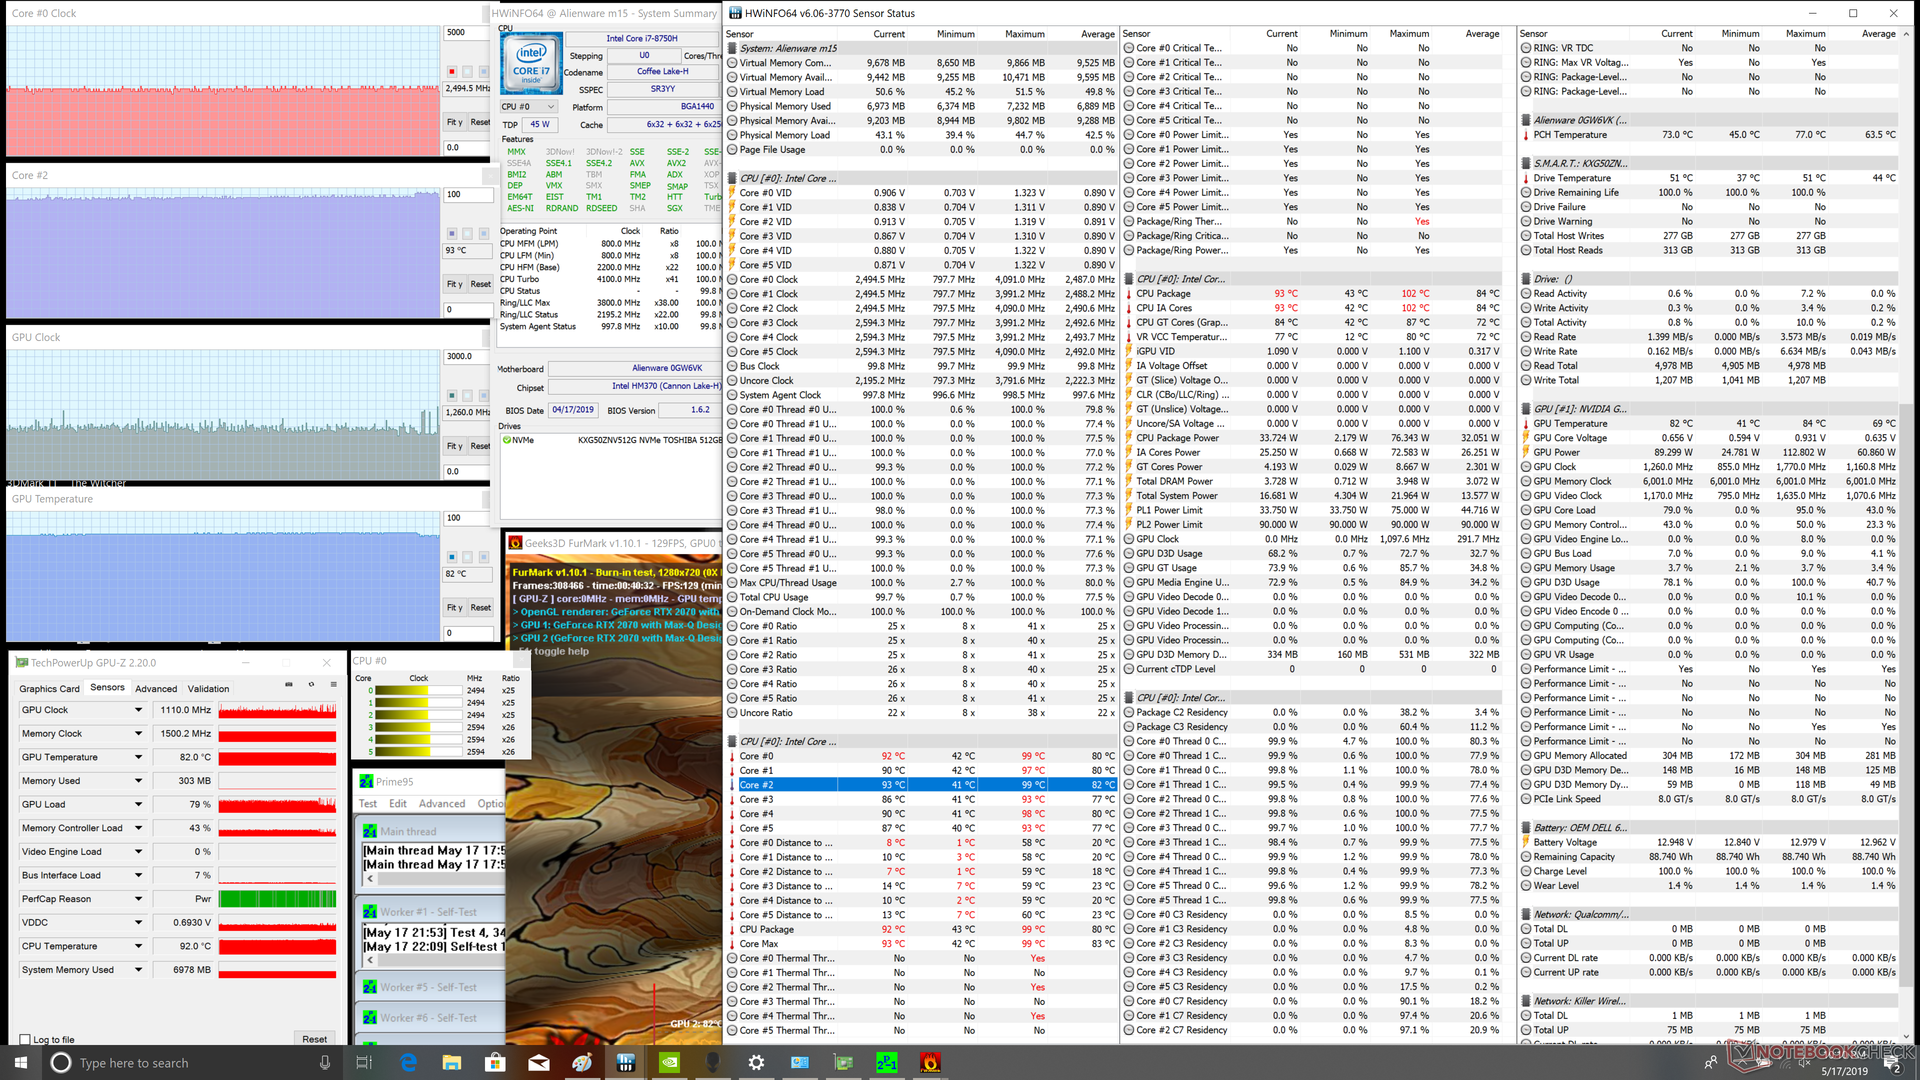
| CPU Clock (GHz) | GPU Clock (MHz) | Average CPU Temperature (°C) | Average GPU Temperature (°C) | |
| System Idle | -- | -- | 44 | 42 |
| Prime95 Stress | 3.4 | -- | 98 | 64 |
| Prime95 + FurMark Stress | 2.5 | 1110 | 92 | 83 |
| Witcher 3 Stress | 3.6 | 1410 | 98 | 80 |
(-) The maximum temperature on the upper side is 55.6 °C / 132 F, compared to the average of 40.4 °C / 105 F, ranging from 21.2 to 68.8 °C for the class Gaming.
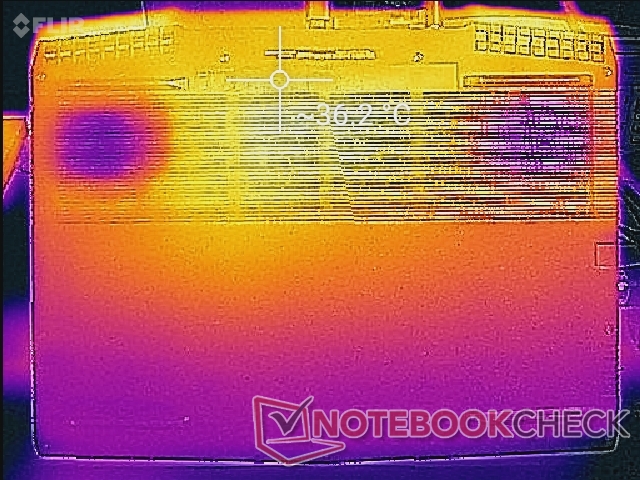
(-) The bottom heats up to a maximum of 62.4 °C / 144 F, compared to the average of 43.2 °C / 110 F
(+) In idle usage, the average temperature for the upper side is 31.7 °C / 89 F, compared to the device average of 33.8 °C / 93 F.
(-) Playing The Witcher 3, the average temperature for the upper side is 43.6 °C / 110 F, compared to the device average of 33.8 °C / 93 F.
(+) The palmrests and touchpad are reaching skin temperature as a maximum (35.2 °C / 95.4 F) and are therefore not hot.
(-) The average temperature of the palmrest area of similar devices was 28.9 °C / 84 F (-6.3 °C / -11.4 F).
Speakers

Alienware m15 P79F audio analysis
(±) | speaker loudness is average but good (75 dB)
Analysis not possible as minimum curve is missing or too high
Apple MacBook 12 (Early 2016) 1.1 GHz audio analysis
(+) | speakers can play relatively loud (83.6 dB)
Bass 100 - 315 Hz
(±) | reduced bass - on average 11.3% lower than median
(±) | linearity of bass is average (14.2% delta to prev. frequency)
Mids 400 - 2000 Hz
(+) | balanced mids - only 2.4% away from median
(+) | mids are linear (5.5% delta to prev. frequency)
Highs 2 - 16 kHz
(+) | balanced highs - only 2% away from median
(+) | highs are linear (4.5% delta to prev. frequency)
Overall 100 - 16.000 Hz
(+) | overall sound is linear (10.2% difference to median)
Compared to same class
» 5% of all tested devices in this class were better, 2% similar, 93% worse
» The best had a delta of 5%, average was 19%, worst was 53%
Compared to all devices tested
» 3% of all tested devices were better, 1% similar, 96% worse
» The best had a delta of 4%, average was 25%, worst was 134%
Energy Management
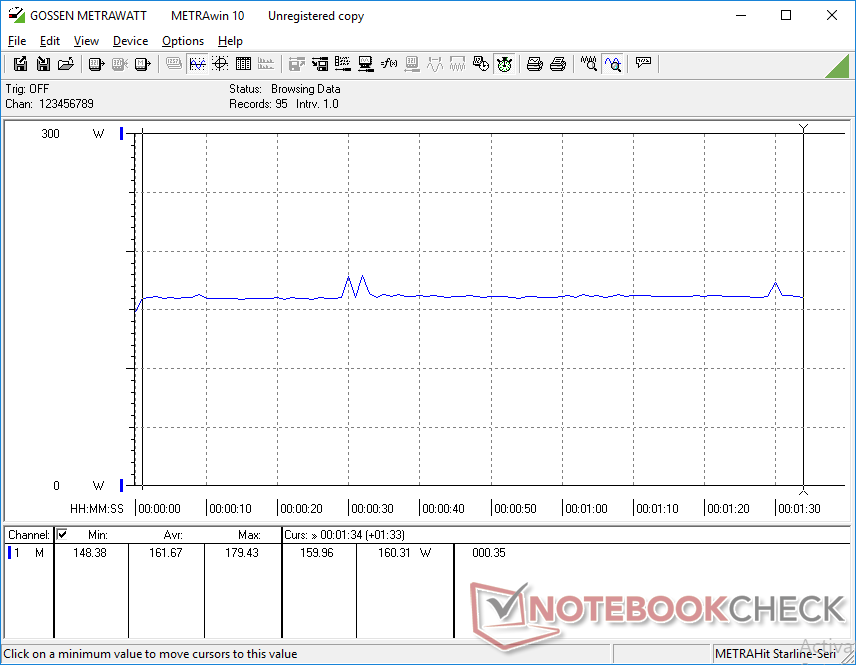
Power Consumption
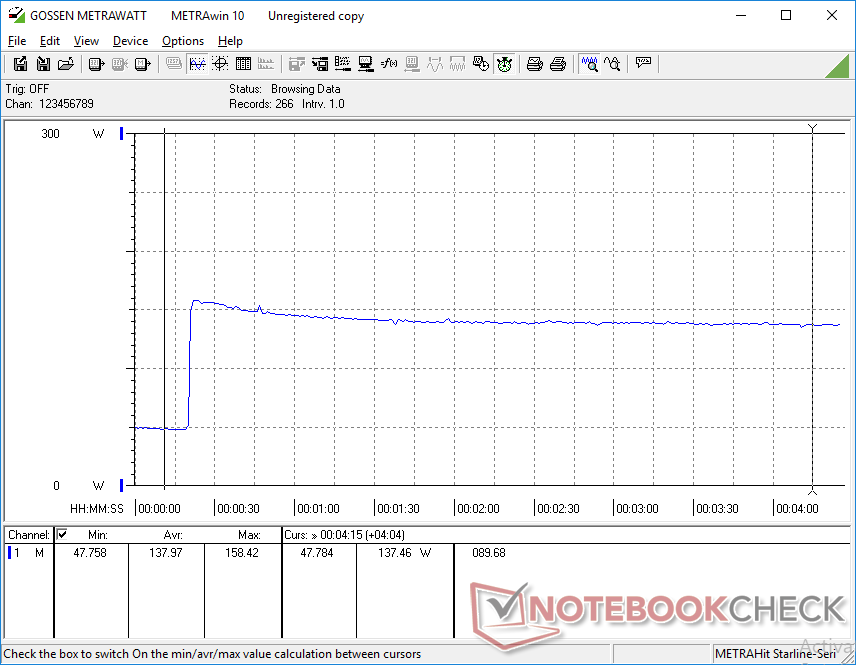
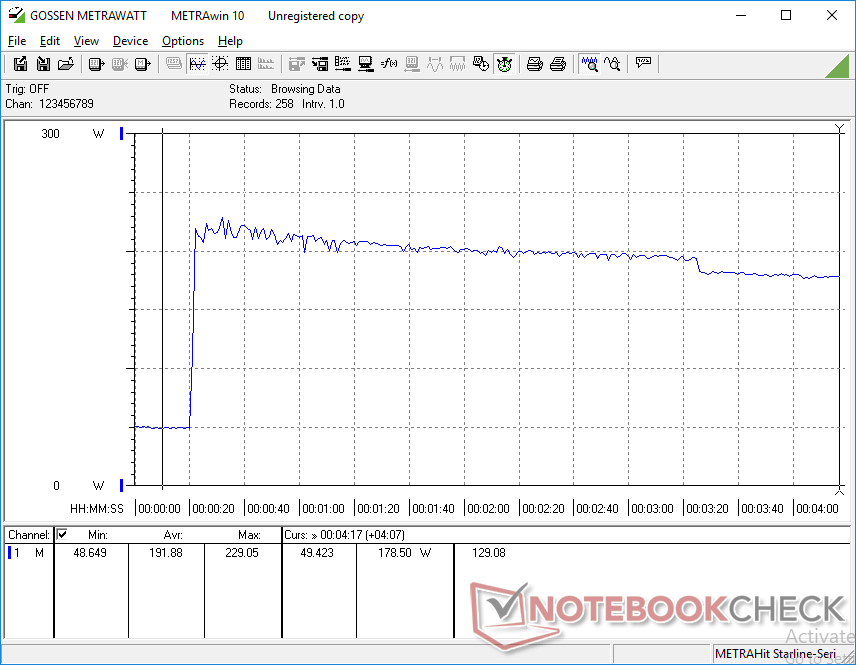
When idling, the system demands anywhere between 10 W and 19 W depending on the brightness setting and power profile. When running Witcher 3, consumption becomes stable at 162 W compared to 146 W on last year's Alienware m15. While power consumption is up by 11 percent, GPU performance is up by 15 to 56 percent for better performance-per-Watt overall.
We're able to record a maximum draw of 229 W from the relatively large (~20 x 10 x 2.6 cm) AC adapter. Power consumption when running Prime95 or FurMark load remains relatively constantly when compared to other laptops where sharper spikes and deeper drops are more common. Our observations back up the excellent Turbo Boost performance and CineBench R15 loop test results from above.
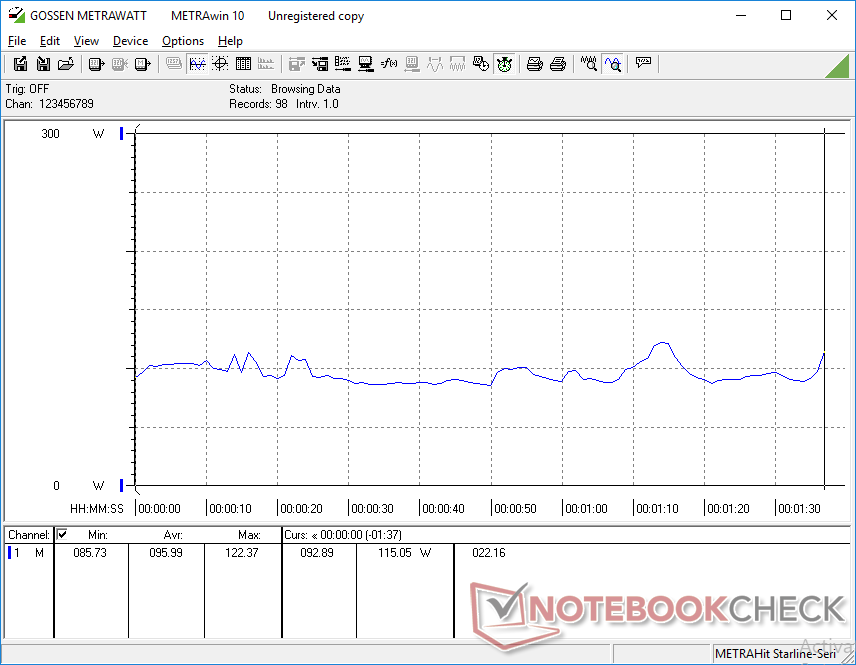
How does the OLED panel impact power consumption? When displaying all white, we're able to record a power consumption difference of 11 W between the minimum and maximum brightness settings. Conversely, the power consumption difference between minimum and maximum brightness when displaying all black is just 0.06 W. Thus, onscreen content will impact battery life more heavily than your typical TN or IPS panel.
| Off / Standby | |
| Idle | |
| Load |
|
| Alienware m15 P79F i7-8750H, GeForce RTX 2070 Max-Q, Toshiba XG5 KXG50ZNV512G, OLED, 3840x2160, 15.60 | Alienware m15 GTX 1070 Max-Q i7-8750H, GeForce GTX 1070 Max-Q, Toshiba XG5 KXG50ZNV512G, IPS, 1920x1080, 15.60 | Razer Blade 15 RTX 2080 Max-Q i7-9750H, GeForce RTX 2080 Max-Q, Samsung SSD PM981 MZVLB512HAJQ, IPS, 1920x1080, 15.60 | Asus Zephyrus S GX502GW i7-9750H, GeForce RTX 2070 Mobile, 2x Intel SSD 660p SSDPEKNW512G8 (RAID 0), IPS, 1920x1080, 15.60 | Aorus 15 W9 i7-8750H, GeForce RTX 2060 Mobile, Intel SSD 760p SSDPEKKW512G8, IPS, 1920x1080, 15.60 | Dell XPS 15 9570 Core i9 UHD i9-8950HK, GeForce GTX 1050 Ti Max-Q, Samsung SSD PM981 MZVLB1T0HALR, IPS, 3840x2160, 15.60 | |
|---|---|---|---|---|---|---|
| Power Consumption | 12% | -6% | -59% | -21% | 20% | |
| Idle Minimum * | 10.9 | 7.6 30% | 12.5 -15% | 24 -120% | 18 -65% | 7.1 35% |
| Idle Average * | 12.3 | 13.8 -12% | 15.3 -24% | 27 -120% | 20 -63% | 13.6 -11% |
| Idle Maximum * | 19 | 14.6 23% | 20.7 -9% | 33 -74% | 28 -47% | 14.1 26% |
| Load Average * | 96 | 97.6 -2% | 90.2 6% | 129 -34% | 87 9% | 103.9 -8% |
| Witcher 3 ultra * | 161.7 | 145.8 10% | 162 -0% | 176 -9% | 135 17% | 103 36% |
| Load Maximum * | 229.1 | 172.5 25% | 209.3 9% | 216 6% | 175 24% | 130.9 43% |
* ... smaller is better
Battery Life
Runtimes are shorter by at least a couple of hours when compared to the standard IPS SKU. We're only able to record a battery life of just over 5 hours during real-world WLAN conditions. Charging time remains the same at 1.5 to 2 hours.
| Alienware m15 P79F i7-8750H, GeForce RTX 2070 Max-Q, 90 Wh | Alienware m15 GTX 1070 Max-Q i7-8750H, GeForce GTX 1070 Max-Q, 90 Wh | Razer Blade 15 RTX 2080 Max-Q i7-9750H, GeForce RTX 2080 Max-Q, 80 Wh | Asus Zephyrus S GX502GW i7-9750H, GeForce RTX 2070 Mobile, 76 Wh | Aorus 15 W9 i7-8750H, GeForce RTX 2060 Mobile, 62 Wh | Dell XPS 15 9570 Core i9 UHD i9-8950HK, GeForce GTX 1050 Ti Max-Q, 97 Wh | |
|---|---|---|---|---|---|---|
| Battery Runtime | 50% | 27% | -29% | -54% | 66% | |
| WiFi v1.3 | 309 | 463 50% | 393 27% | 220 -29% | 141 -54% | 514 66% |
| Reader / Idle | 627 | 953 | 353 | 176 | 899 | |
| Load | 103 | 102 | 62 | 81 | 62 |
Pros
Cons
Verdict

The Alienware m15 is able to squeeze out more performance than another gaming laptop when given the same CPU and GPU. The Core i7-8750H and RTX 2070 Max-Q, for example, are each 8 to 9 percent faster than the average i7-8750H or RTX 2070 Max-Q in our database. If you want the fastest performance possible in a thin chassis design, then the Alienware m15 should fit the bill.
The drawbacks are the warmer core temperatures and louder fans associated with trying to squeeze out every last MHz of each processor. Expect CPU temperatures as high as 90 C and fans as loud as 50 dB(A) if you want the get the most out of the Alienware m15.
The wild card, however, is the 4K UHD OLED display. While more than two times the price of the 1080p 144 Hz or 240 Hz IPS panel, we want to stress that it doesn't objectively offer the better gaming experience or automatically invalidate the IPS SKUs. Its higher native resolution, deeper colors, brighter backlight, and faster black-white response times certainly give it an edge, but its native 60 Hz refresh rate is a disadvantage in certain titles where 144 Hz is preferable. Overwatch, Rocket League, CS:GO, and Apex Legends, for example, are arguably better at 144 Hz while single-player games like Shadow of the Tomb Raider or Metro Exodus may benefit more from the OLED screen. As impressive as it may be, OLED isn't for everyone at the moment especially since IPS options have been growing more lucrative.
Depending on what games you play most, you may want to choose wisely between 1080p 144/240 Hz IPS or 2160p 60 Hz OLED. It's an excellent start for OLED, but it remains a niche option until more resolutions and refresh rates become available to rival IPS.
Alienware m15 P79F
-
06/13/2019 v6(old)
Allen Ngo


Pricecompare
