 Deutsch
 English
 Español
 Français
 Italiano
 Nederlands
 Polski
 Português
 Русский
 Türkçe
 Svenska
 Chinese
 Magyar
Acer Swift 3X laptop in review: Intel Iris Xe MAX combines high battery life and gaming performance
With the 14-inch Swift 3X, Acer offers a more powerful variant of its traditional Swift 3 models for around 1,100 Euros (~$1,245). Besides the Intel Core i7-1165G7 Tiger Lake processor, the manufacturer has also installed the dedicated Intel Iris Xe MAX graphics card instead of just relying on the processor's onboard GPU. In addition, our Acer Swift 3X SF314-510G-70DW test device comes with 16 GB of LPDDR4X RAM in dual-channel mode, and 1 TB of SSD storage space.
In our test, the Acer Swift 3X SF314-510G-70DW has to face the Dell Inspiron 15 7000 7506 with the same CPU/GPU configuration, among others. There are also two contenders with the same processor and a different dedicated GPU, namely the Asus Vivobook 15 K513EQ with the GeForce MX350 and the MSI Modern 14 B11SB-085 with the GeForce MX450. The comparison field is rounded off by two other Acer Swift models - the 14-inch Acer Swift 5 SF514-55T-58DN with the Intel Core i5-1135G7 and the Iris Xe G7 (80EUs) as well as the Acer Swift 3 SF316-51 with the Intel Core i7-11370H and the Iris Xe G7 (96EUs) - and the Lenovo ThinkPad L14 Gen 2 with the AMD R7 PRO 5850U.
Potential Competitors in Comparison
Rating | Date | Model | Weight | Height | Size | Resolution | Best Price |
|---|---|---|---|---|---|---|---|
| 86.1 % | 12/2021 | Acer Swift 3X SF314-510G-70DW i7-1165G7, Xe MAX | 1.4 kg | 17.9 mm | 14.00" | 1920x1080 | |
| 80.6 % | 11/2021 | Asus Vivobook 15 K513EQ i7-1165G7, GeForce MX350 | 1.6 kg | 17.9 mm | 15.60" | 1920x1080 | |
| 82.4 % | 01/2021 | Dell Inspiron 15 7000 7506 2-in-1 Black Edition i7-1165G7, Xe MAX | 1.9 kg | 17.94 mm | 15.60" | 3840x2160 | |
| 86.1 % | 08/2021 | Lenovo ThinkPad L14 G2 AMD R7 PRO 5850U, Vega 8 | 1.7 kg | 20.4 mm | 14.00" | 1920x1080 | |
| 86.4 % | 10/2021 | Acer Swift 3 SF316-51 i7-11370H, Iris Xe G7 96EUs | 1.7 kg | 15.9 mm | 16.10" | 1920x1080 | |
| 85.2 % | 04/2021 | Acer Swift 5 SF514-55T-58DN i5-1135G7, Iris Xe G7 80EUs | 1 kg | 14.95 mm | 14.00" | 1920x1080 | |
| 82.2 % | 07/2021 | MSI Modern 14 B11SB-085 i7-1165G7, GeForce MX450 | 1.3 kg | 16.9 mm | 14.00" | 1920x1080 |
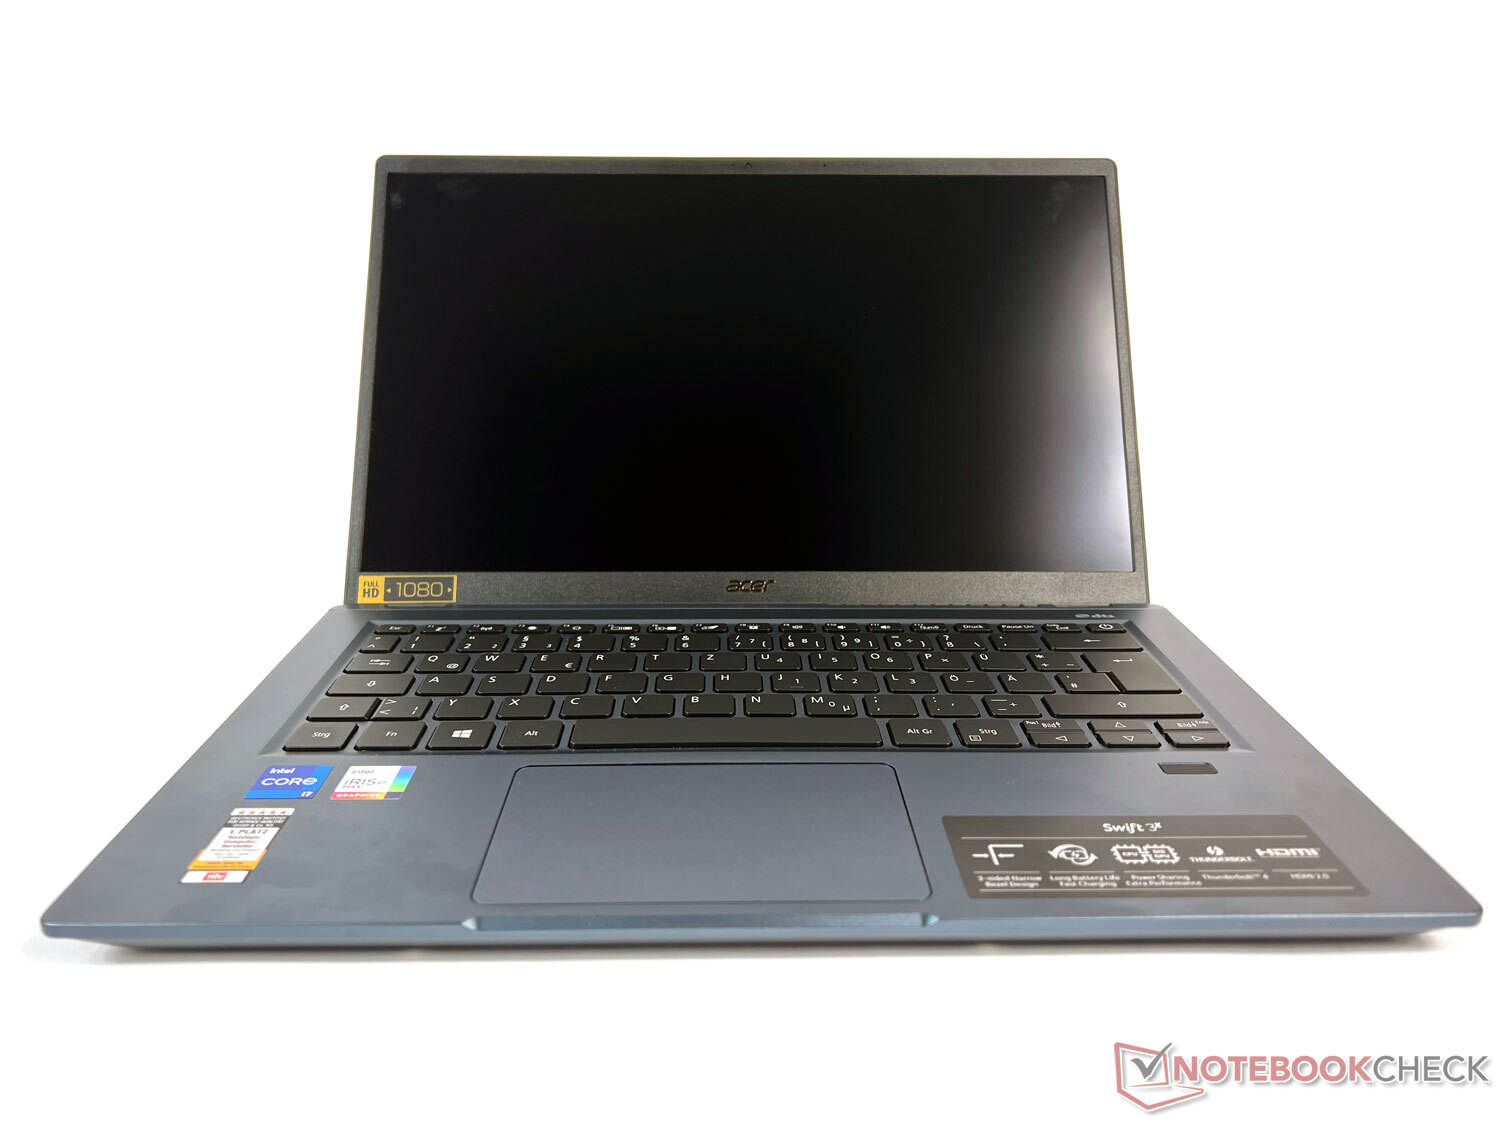
Elegant laptop case with turquoise eye-catcher and low weight
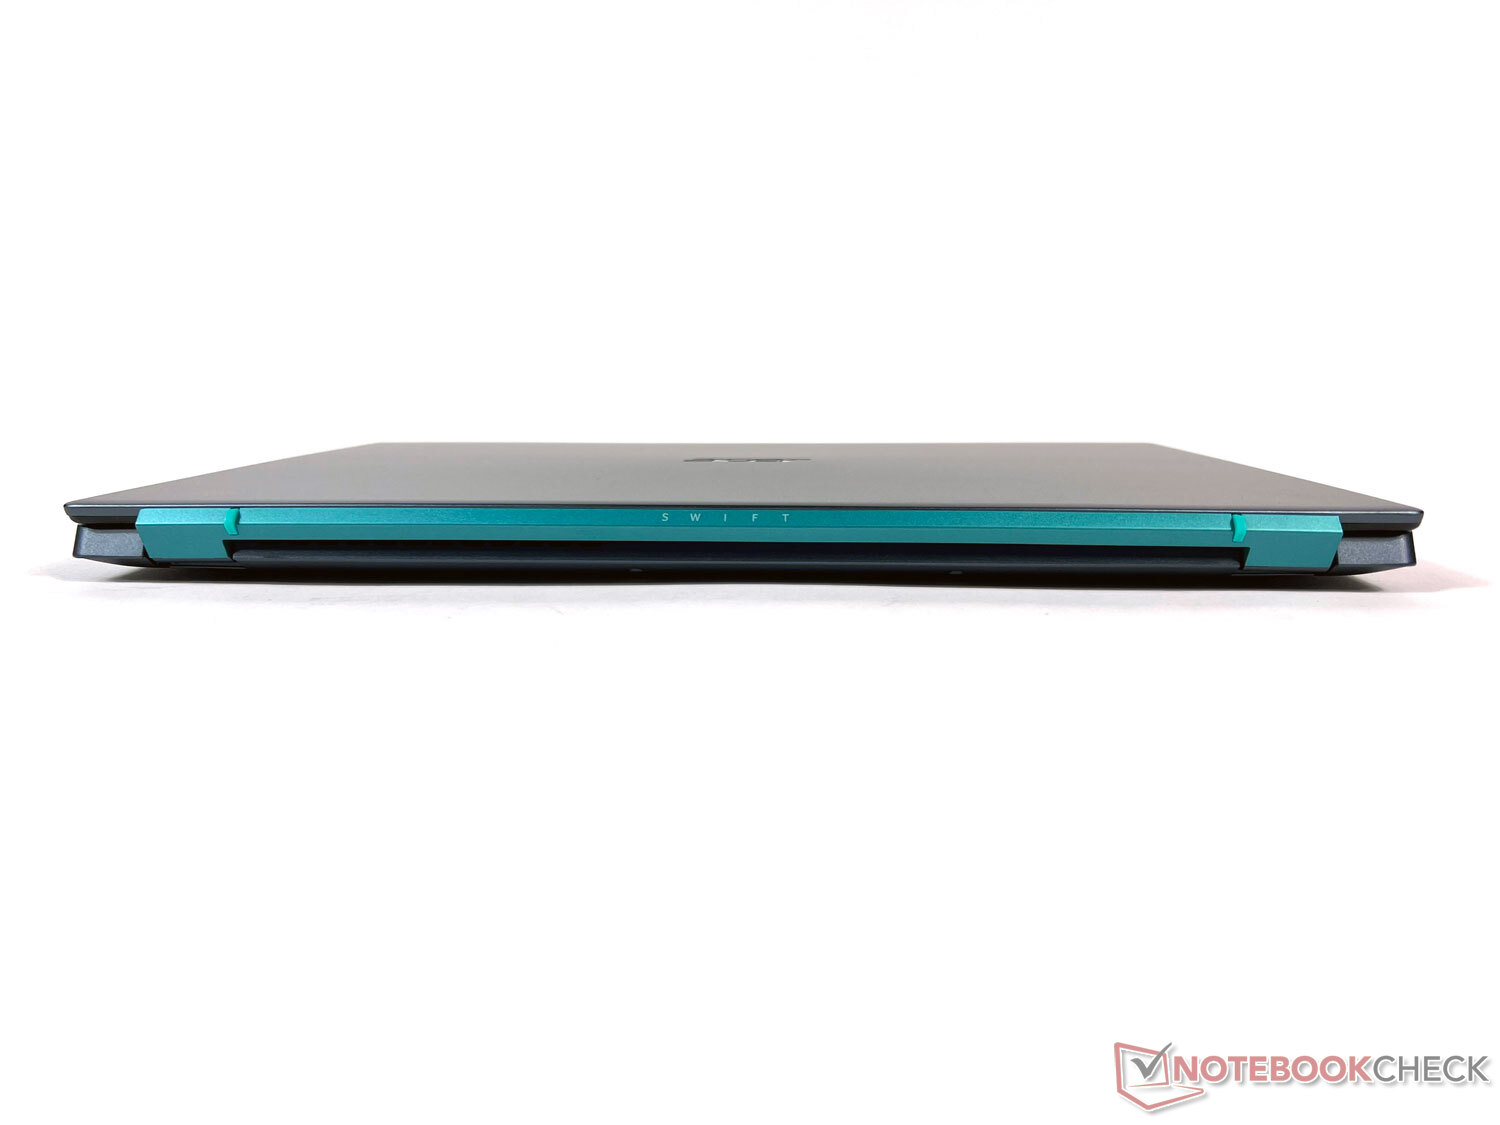
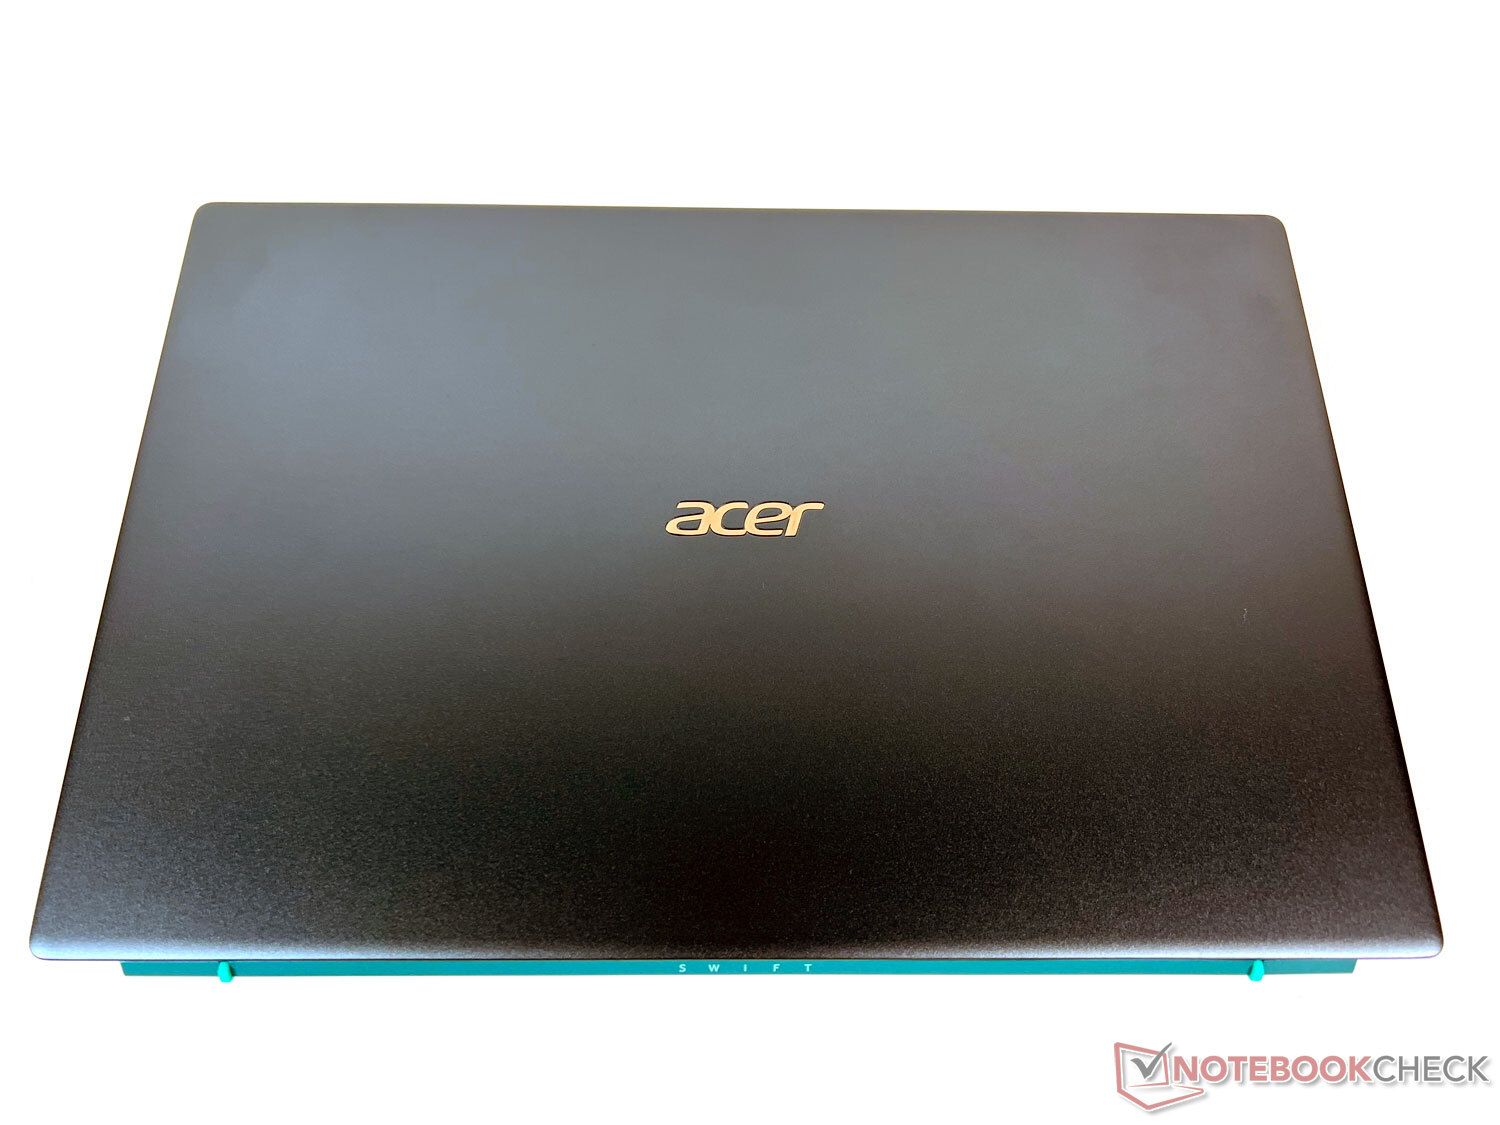
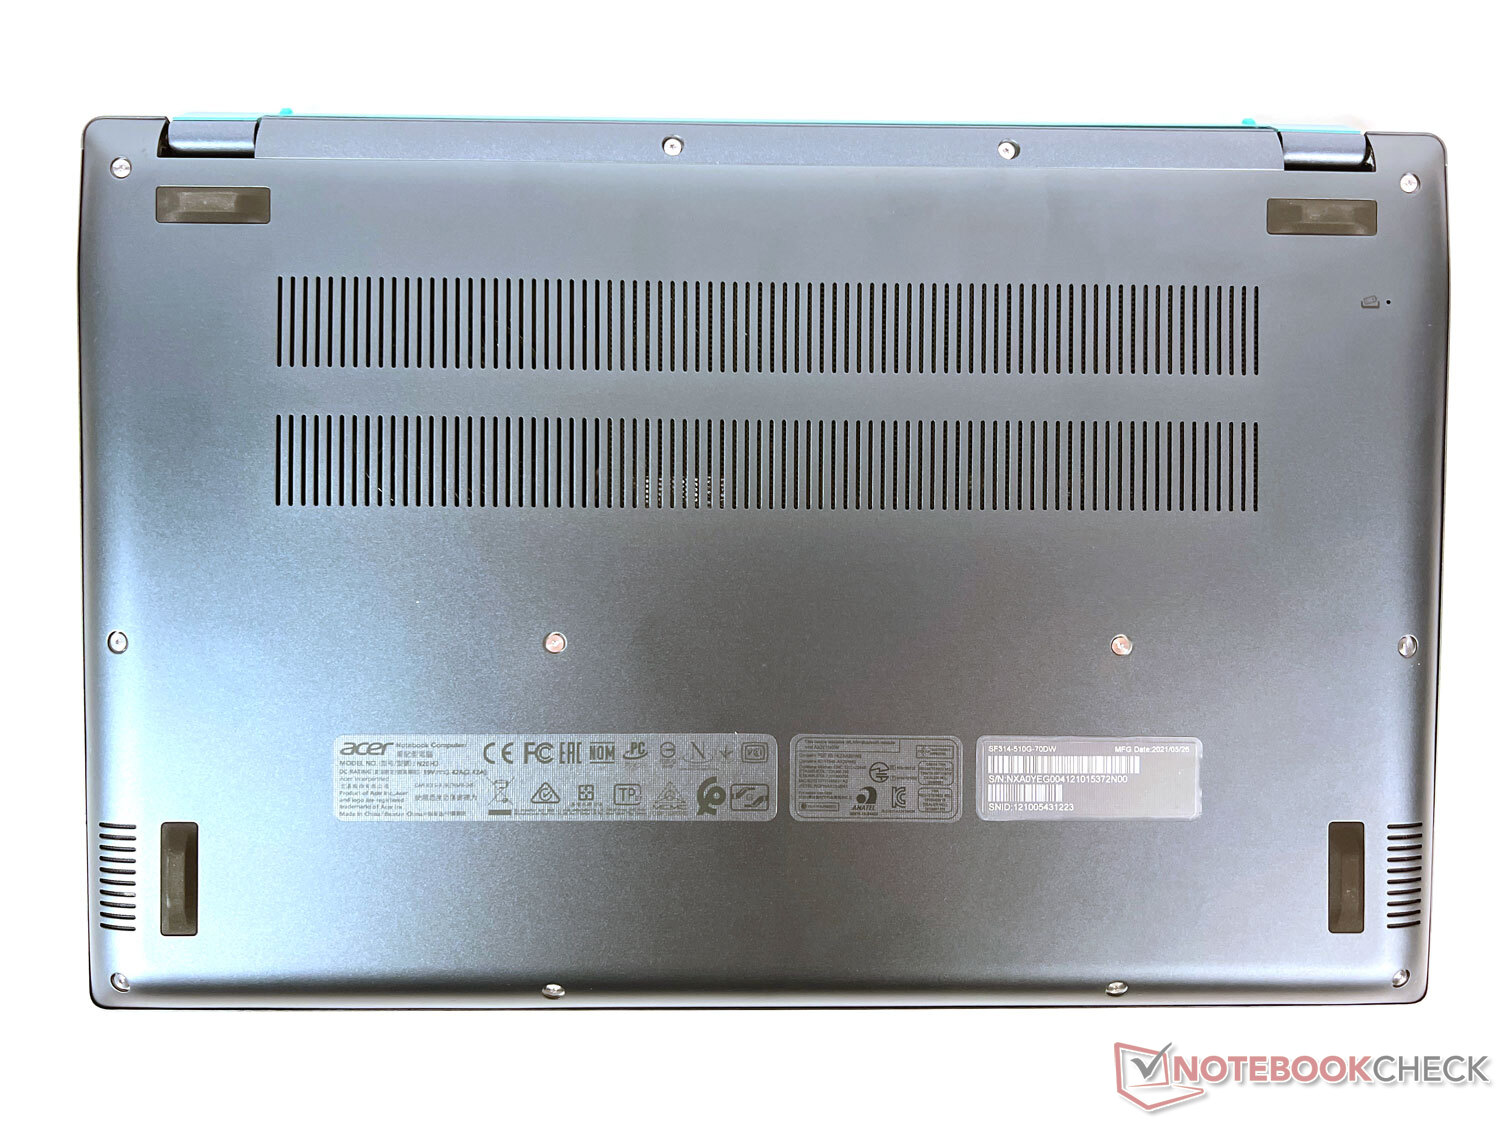
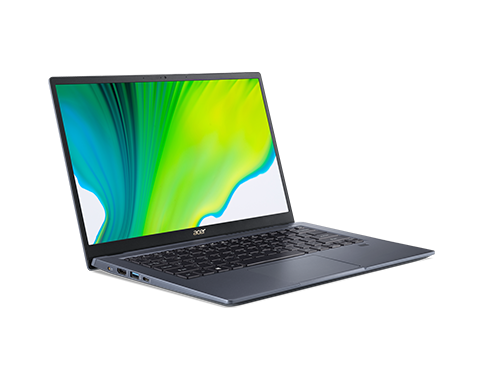
Acer offers the Swift 3X SF314 in two color variants: Safari Gold and Steam Blue. We have the more discreet gray-blue model in for testing, which at least offers a small eye-catcher with its turquoise-green stripe including the Swift logo between the two hinges.
Otherwise, the high-quality aluminum-magnesium case features a rather restrained design with an elegant haptics. The base is resistant to torsion and can easily be carried by one corner.
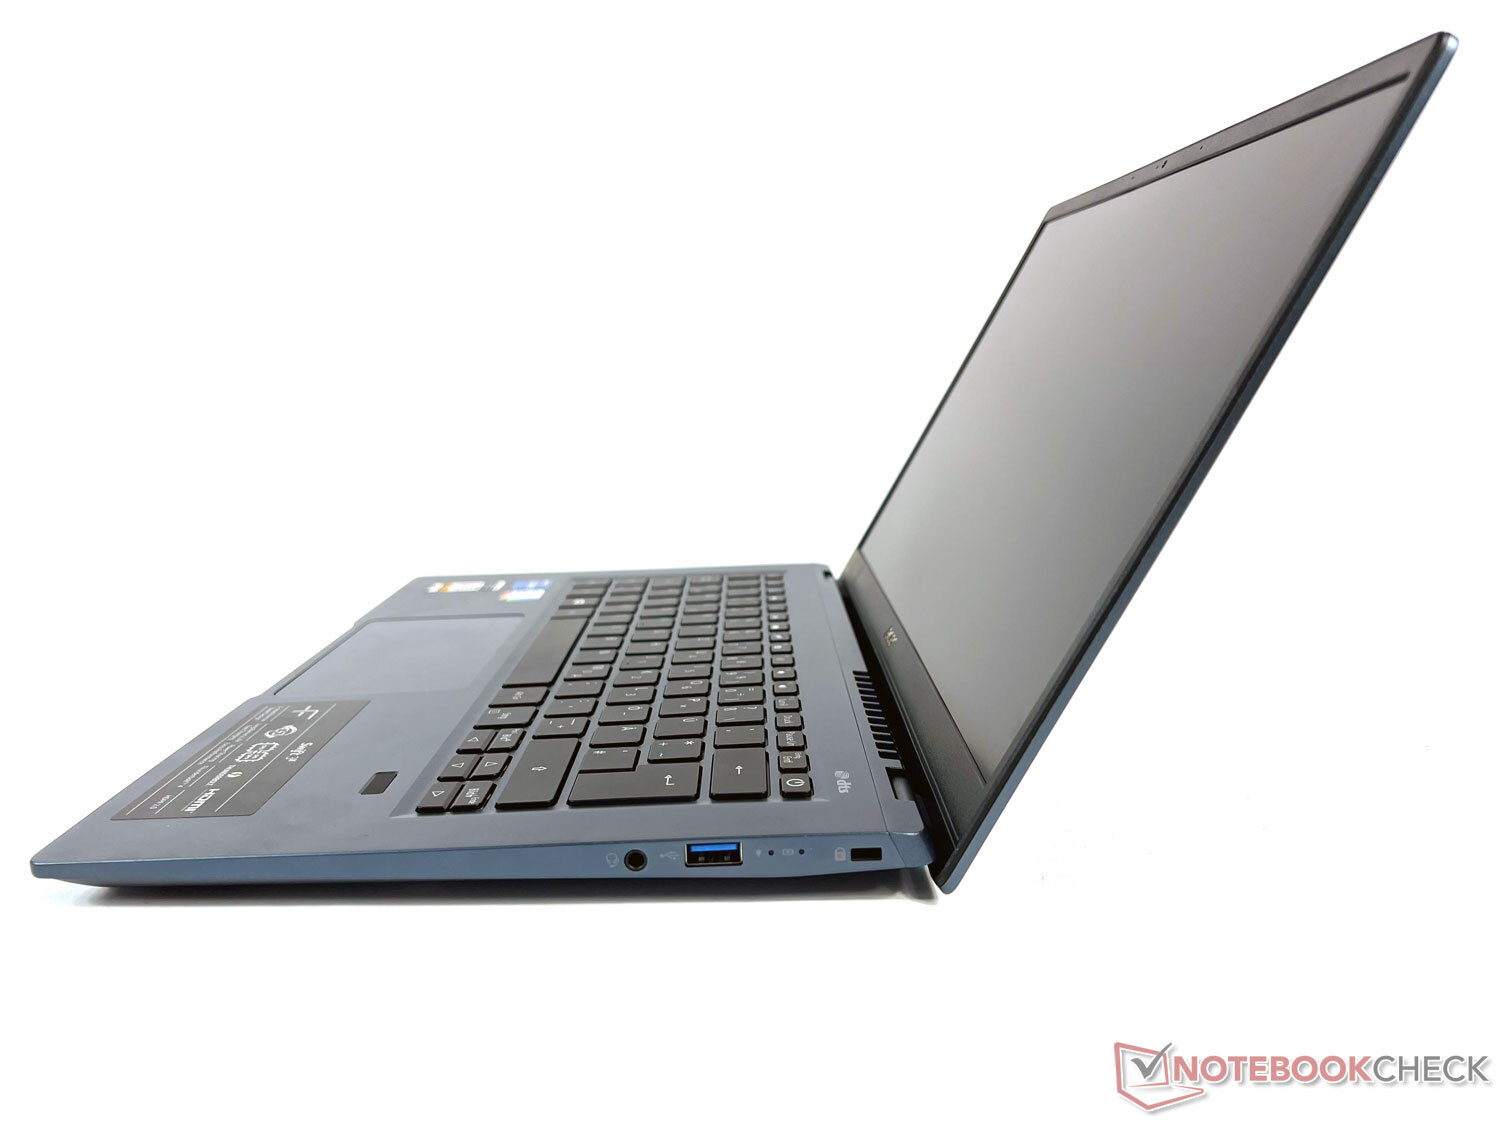
The two hinges hold the screen quite firmly in position. This ensures only little wobbling when moving the laptop, but makes it difficult to open the lid with one hand. In addition, there's a slight creaking noise in our test device.
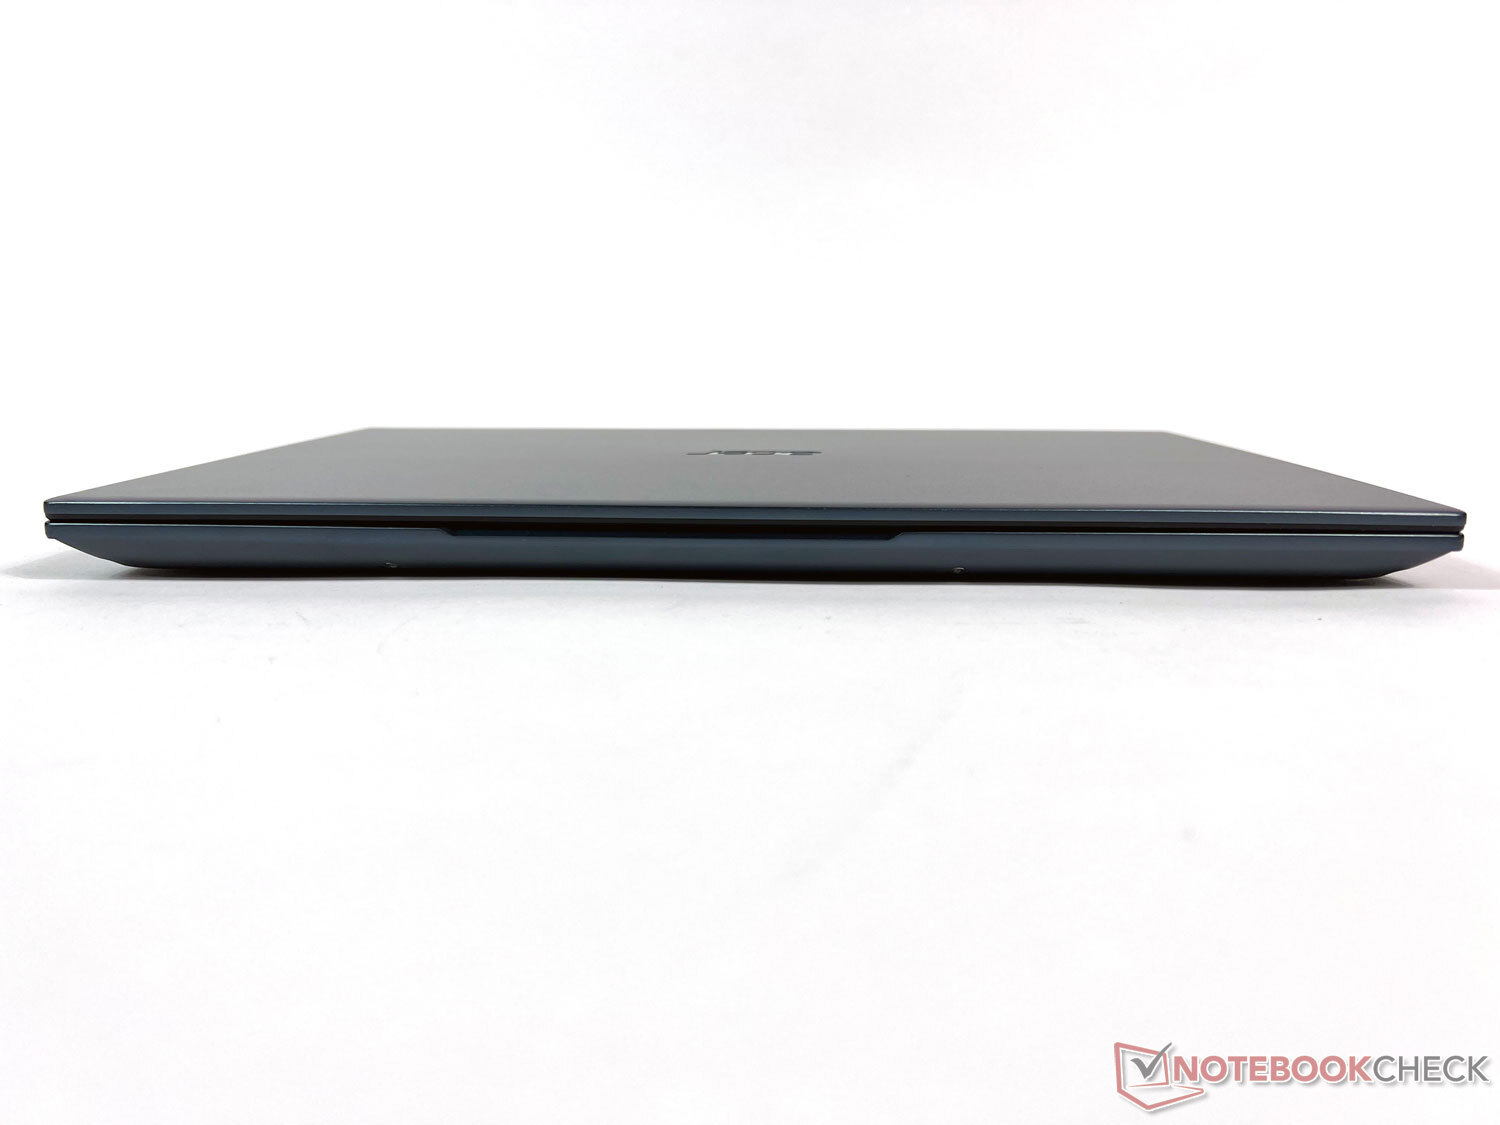
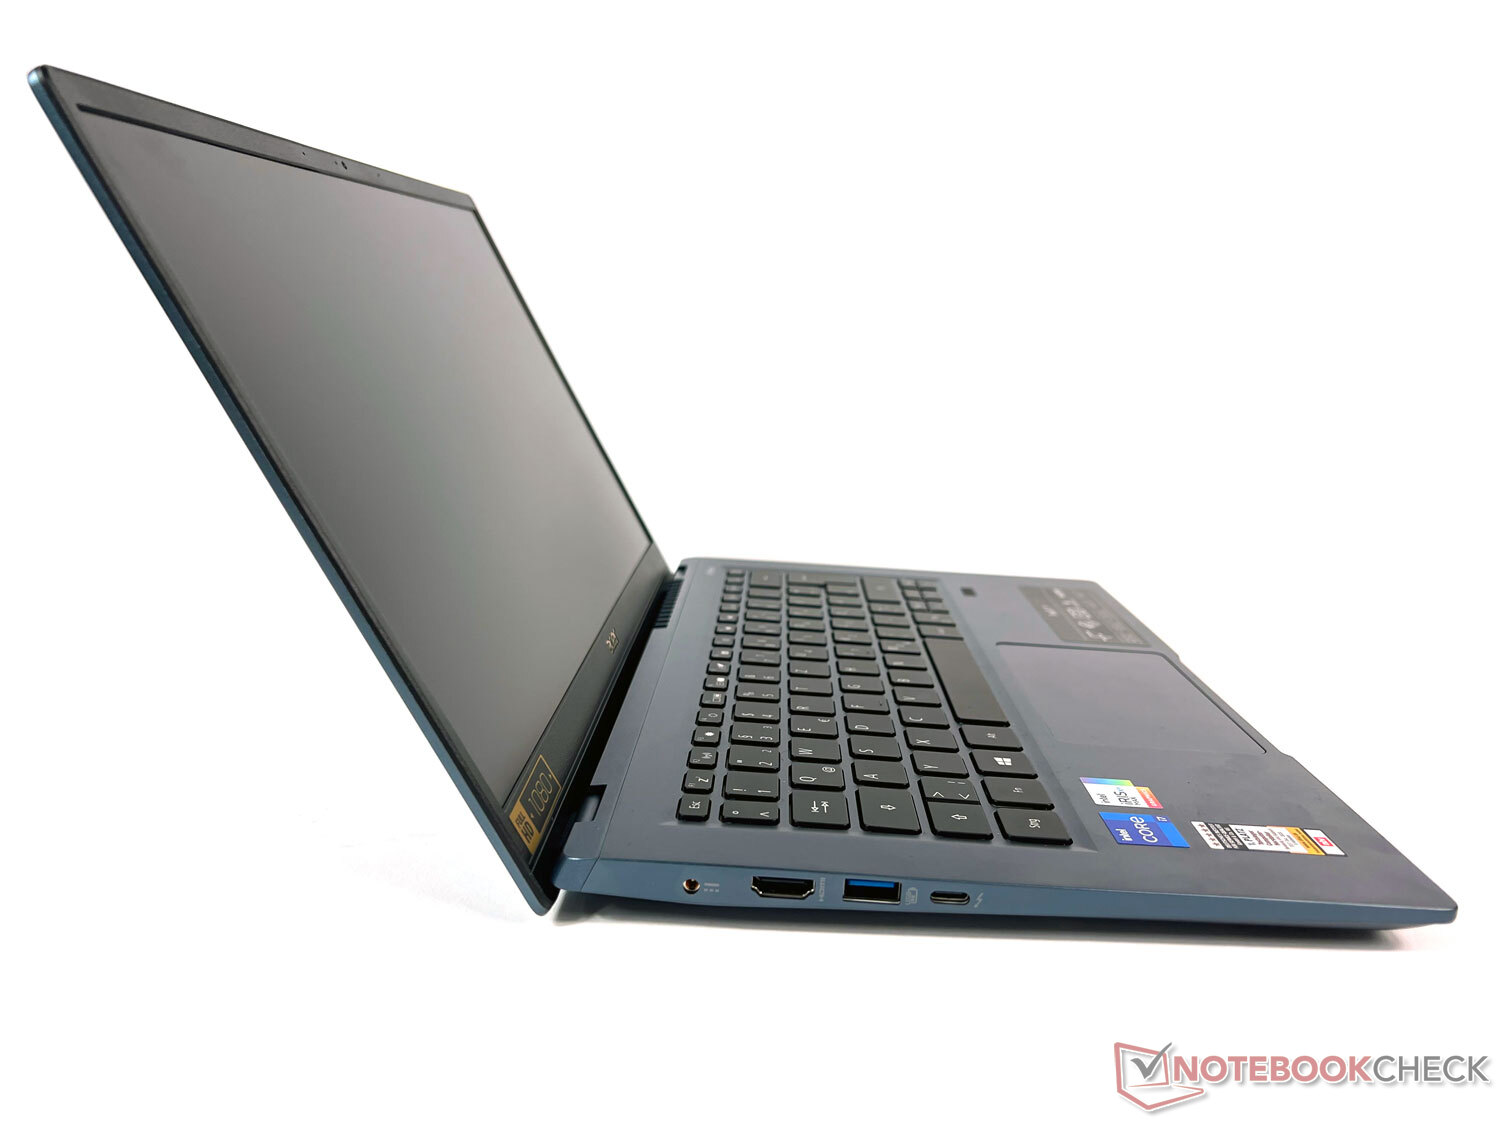
The 14-inch laptop isn't as light as many subnotebooks at just under 1.4 kg, but it doesn't need to shy away in our comparison field. The particularly slim and light Acer Swift 5 SF514 is considerably lighter at around 1 kg. The MSI Modern 14, which is also equipped with a 14-inch display, weighs about the same, while the Lenovo ThinkPad L14 G2 is significantly heavier.
With a thickness of just under 18 mm, the Acer Swift 3X is also on par with the MSI competitor here, but it's two to three millimeters thicker than the other two Swift comparison models. Overall, the device's dimensions make it a pleasantly compact companion that can be stored in a briefcase, backpack, or luggage without taking up much space.
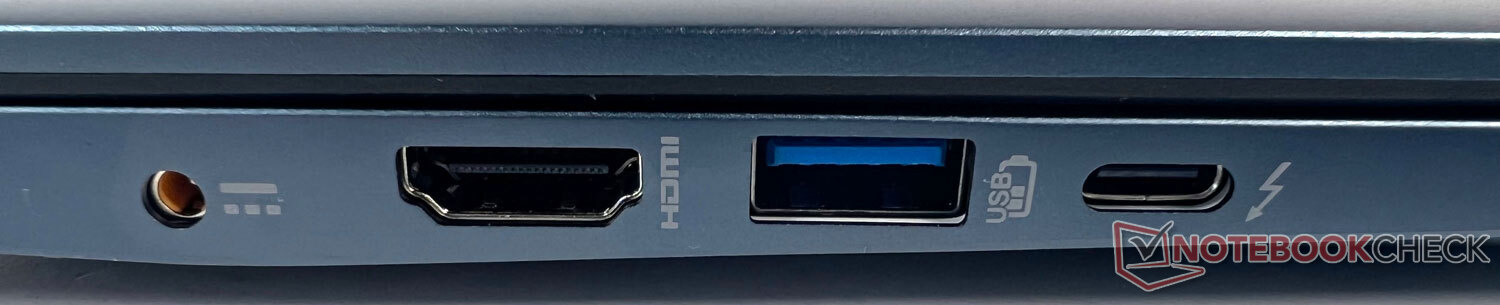
Acer Swift 3X with modest connectivity, but fast Wi-Fi
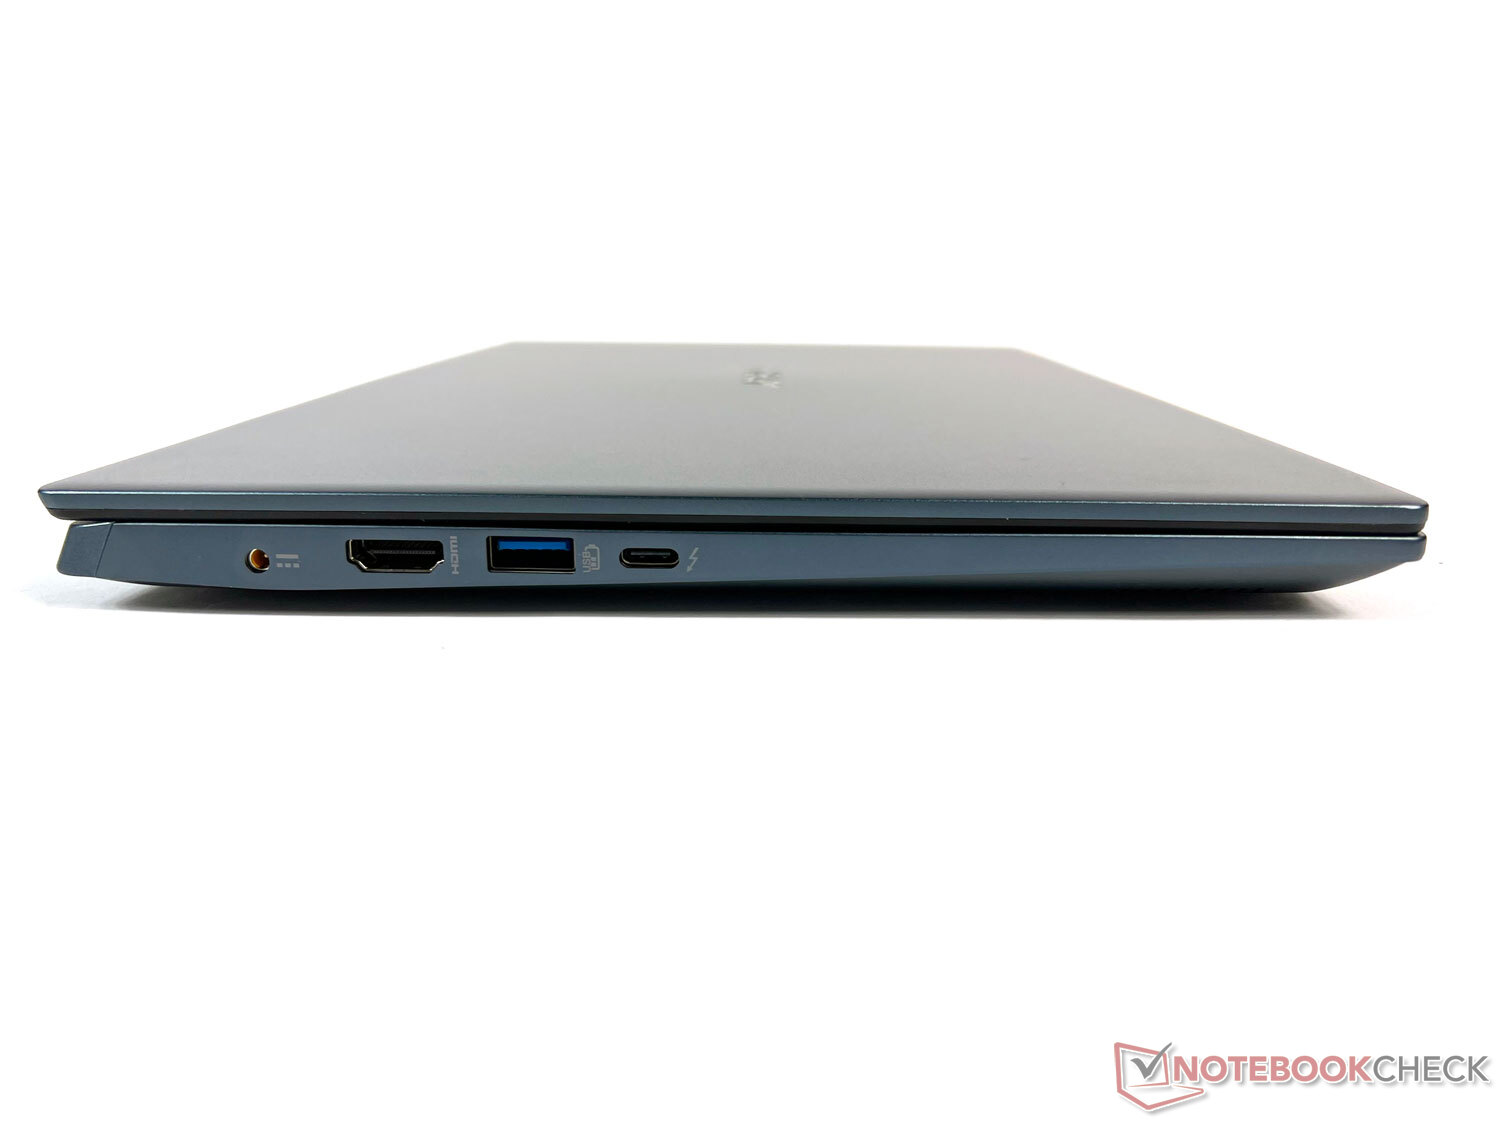
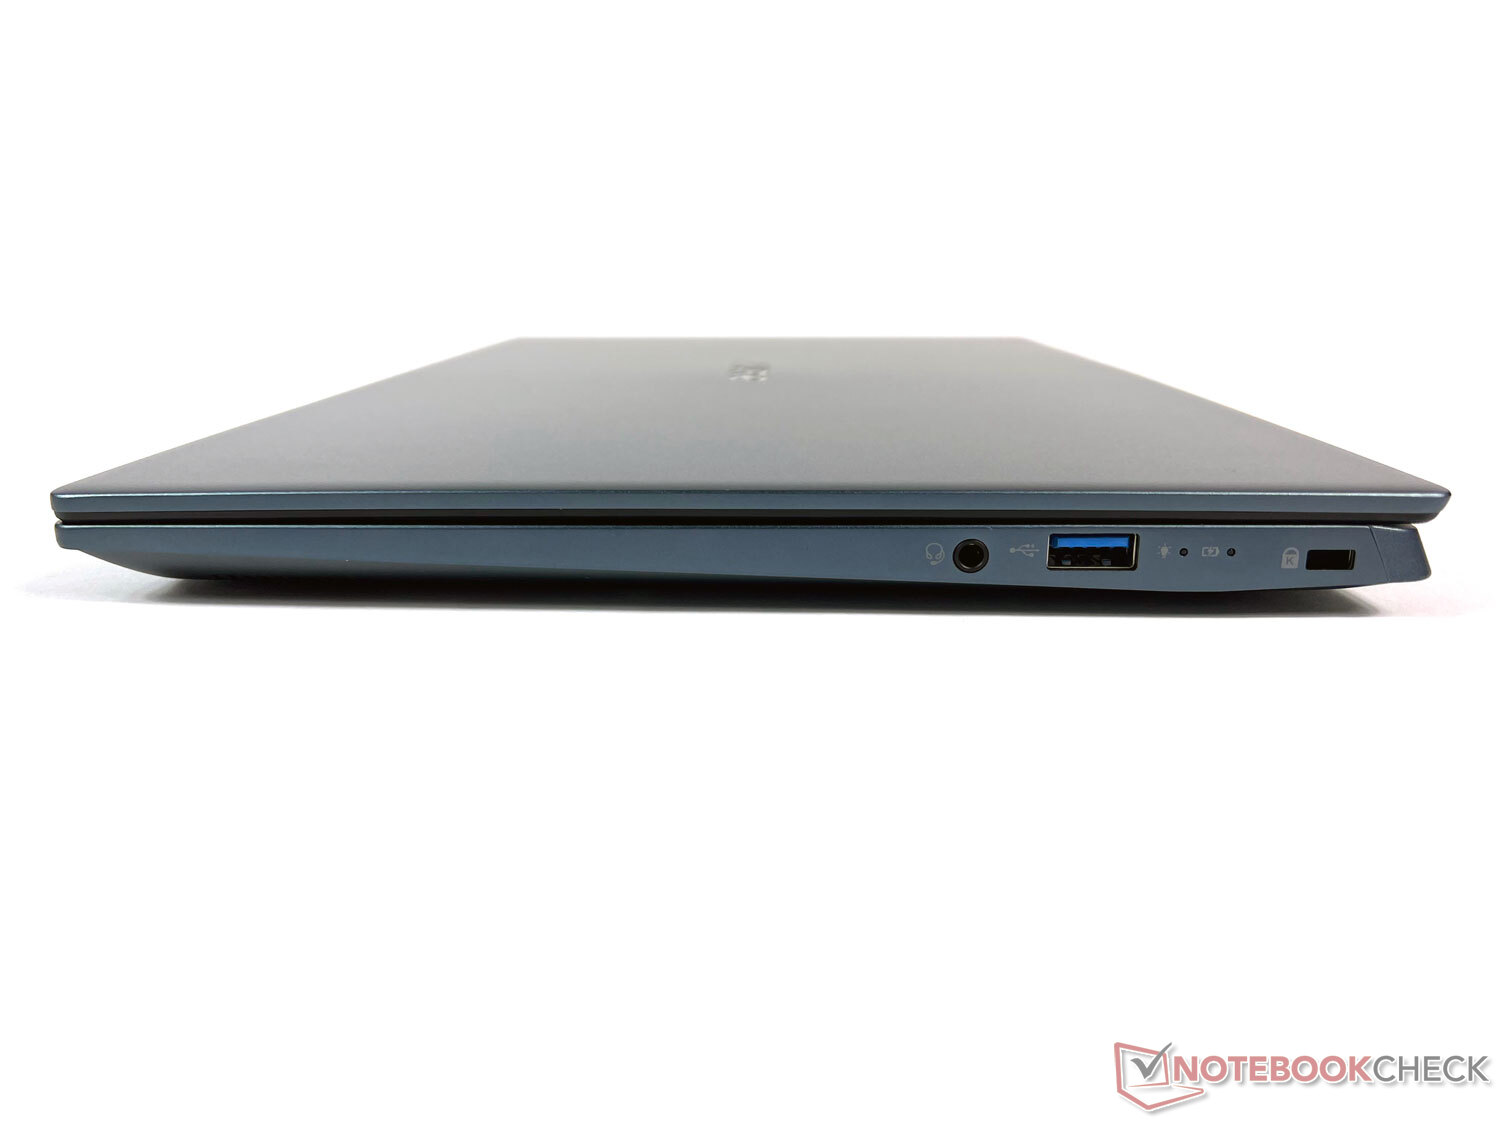
Since the Acer Swift 3X is not as ultra-thin as other Swift models, Acer would actually have enough space here for a comprehensive port arsenal. But the manufacturer only provides the device with two USB Type-A (5 Gb/s) and one USB Type-C (10 Gb/s) with Thunderbolt 4. There's also an HDMI port for external monitors, but LAN port and card reader are absent.
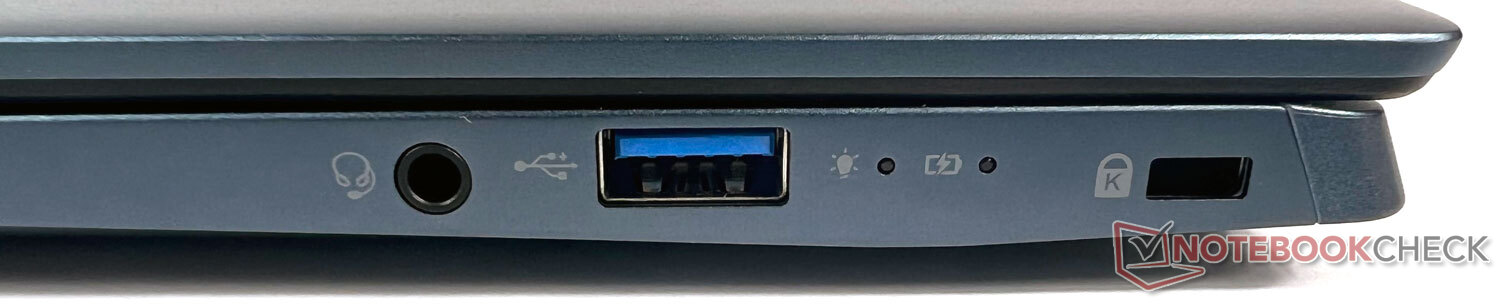
All ports are distributed across the left and right sides. On the left, they are far enough apart that even a larger USB-A stick will not interfere with the neighboring ports.
Communication
The integrated Intel Wi-Fi 6 AX201 Wi-Fi module shows a respectable performance on average. This means that the Acer Swift 3X is not only able to position itself ahead of the average, but it also manages to secure a top 3 place among the competition for sending and receiving data. However, the measured speeds fluctuate relatively strongly over time.
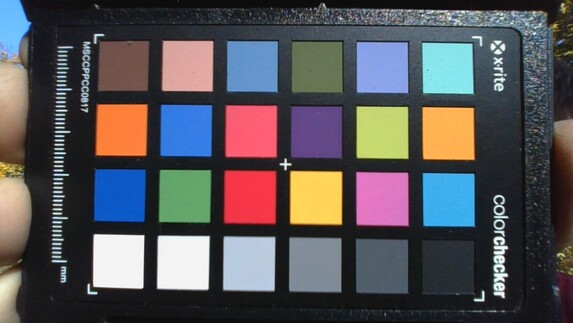
Webcam
The HD webcam captures colors quite accurately, which is reflected in the ∆E values that are the second lowest ones in the comparison field. The image is passable in both good and poor lighting conditions, and it's sufficient for the intended purposes of a laptop camera.


Security
Except for a fingerprint scanner and a slot for a Kensington lock, there are no other security features.
Accessories
Acer only includes a 65-watt power adapter with the Swift 3X SF314-510G-70DW. Other accessories are not included in the box. Optionally, the manufacturer offers a range of universal adapters, carrying cases, and more in its online store.
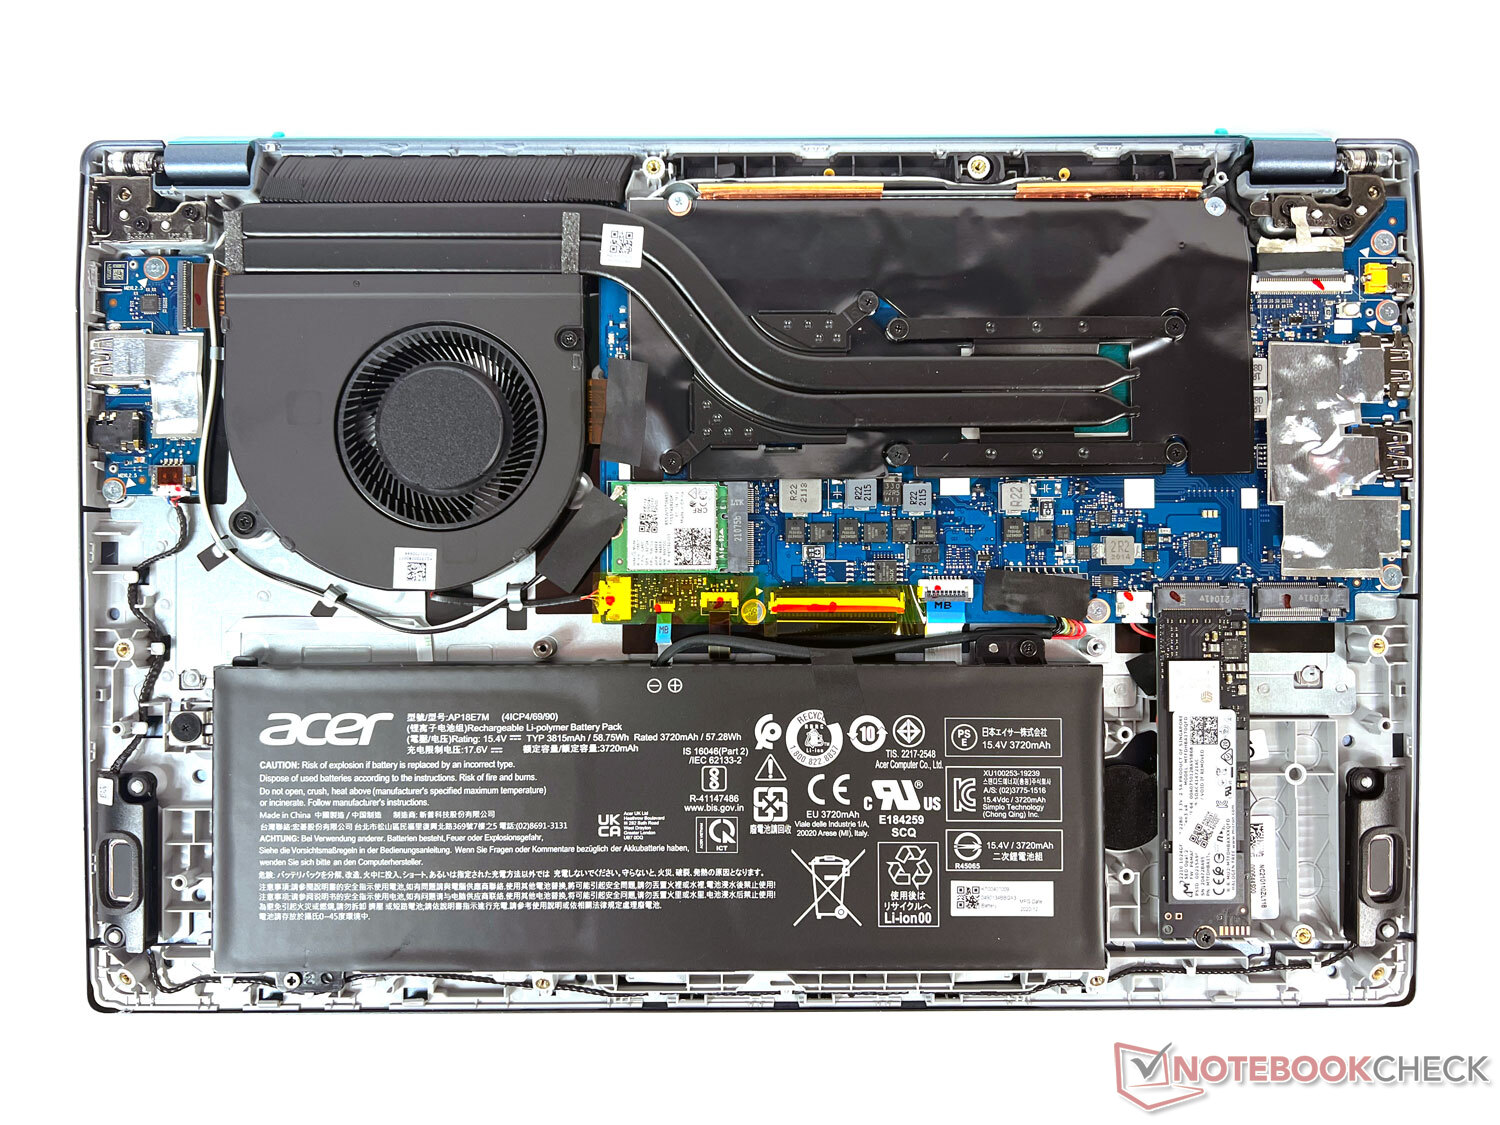
Maintenance
After removing twelve tiny Torx screws, the interior can be accessed, but only to clean the fan or to replace the battery and the SSD. There are no other maintenance options for the ordinary user.
Warranty
Acer provides the usual 24-month manufacturer's warranty including send-in and return service for its Swift models. Optional service extensions are available starting at 50 Euros (~$57).
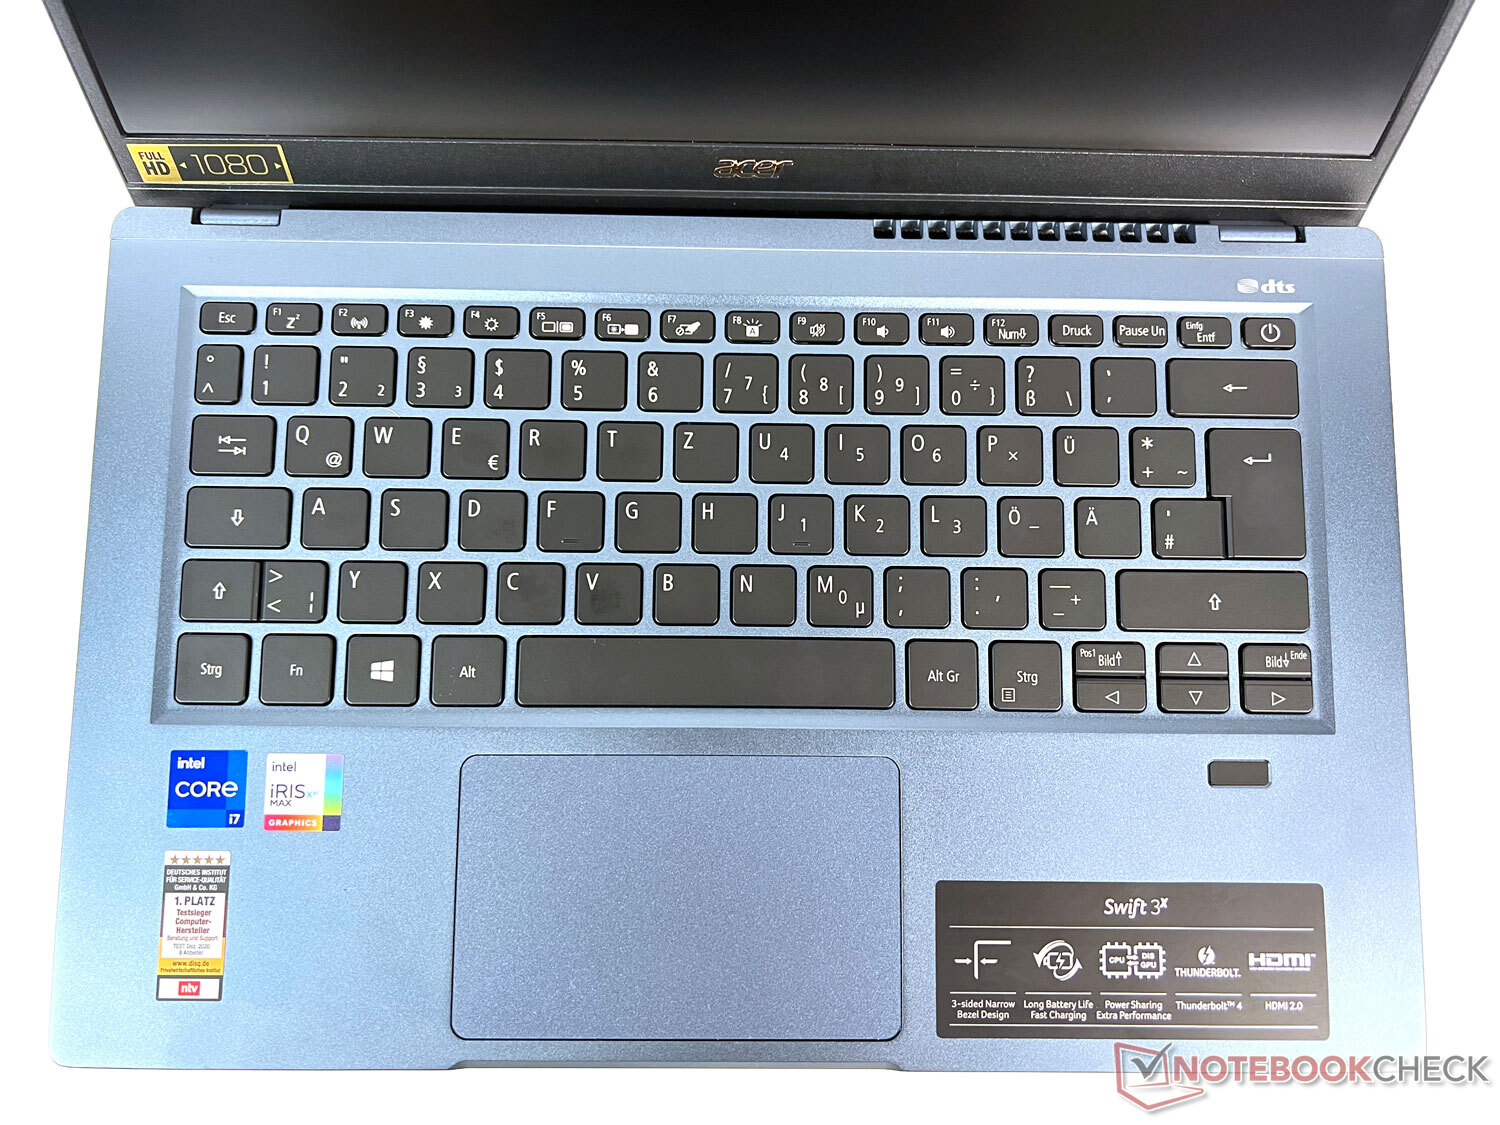
Input devices: Acer laptop with quiet keyboard and fingerprint scanner
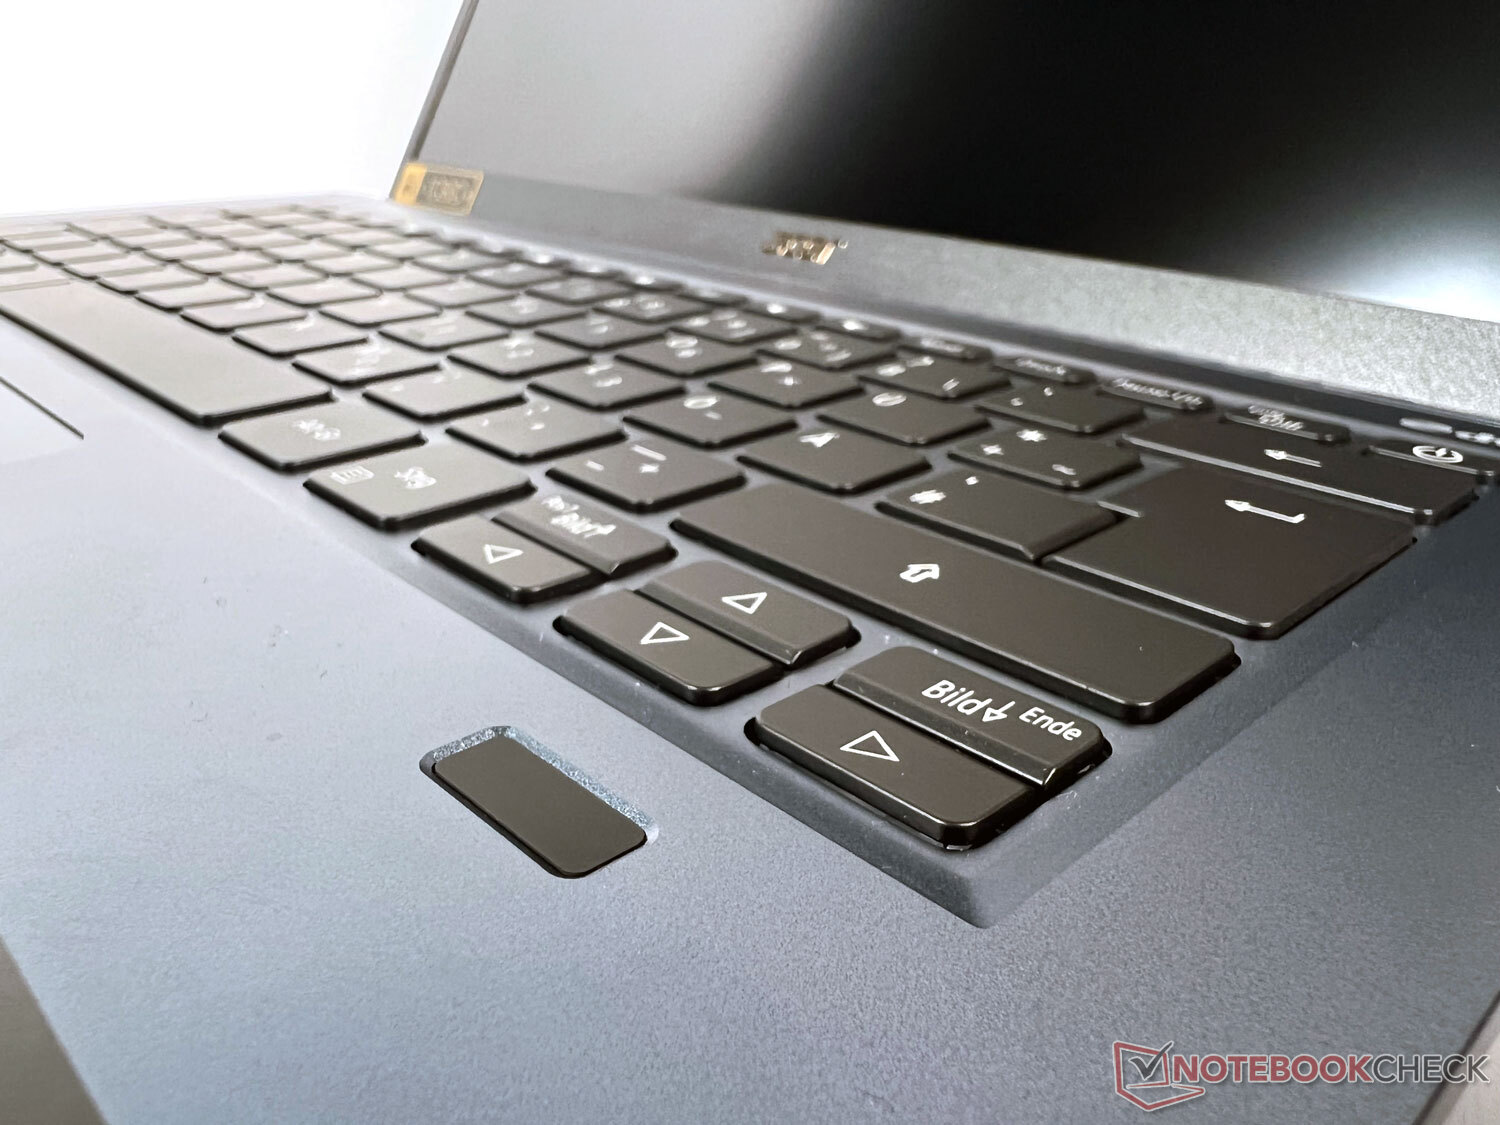
Thanks to its 14-inch display, the Acer Swift 3X offers a sufficiently large case that fits a solid-sized keyboard. Apart from the almost 2.5 cm wide edges to the left and right, it takes up the entire width. The touchpad is almost centered below the keyboard, and a fingerprint scanner is located underneath the arrow keys on the right.
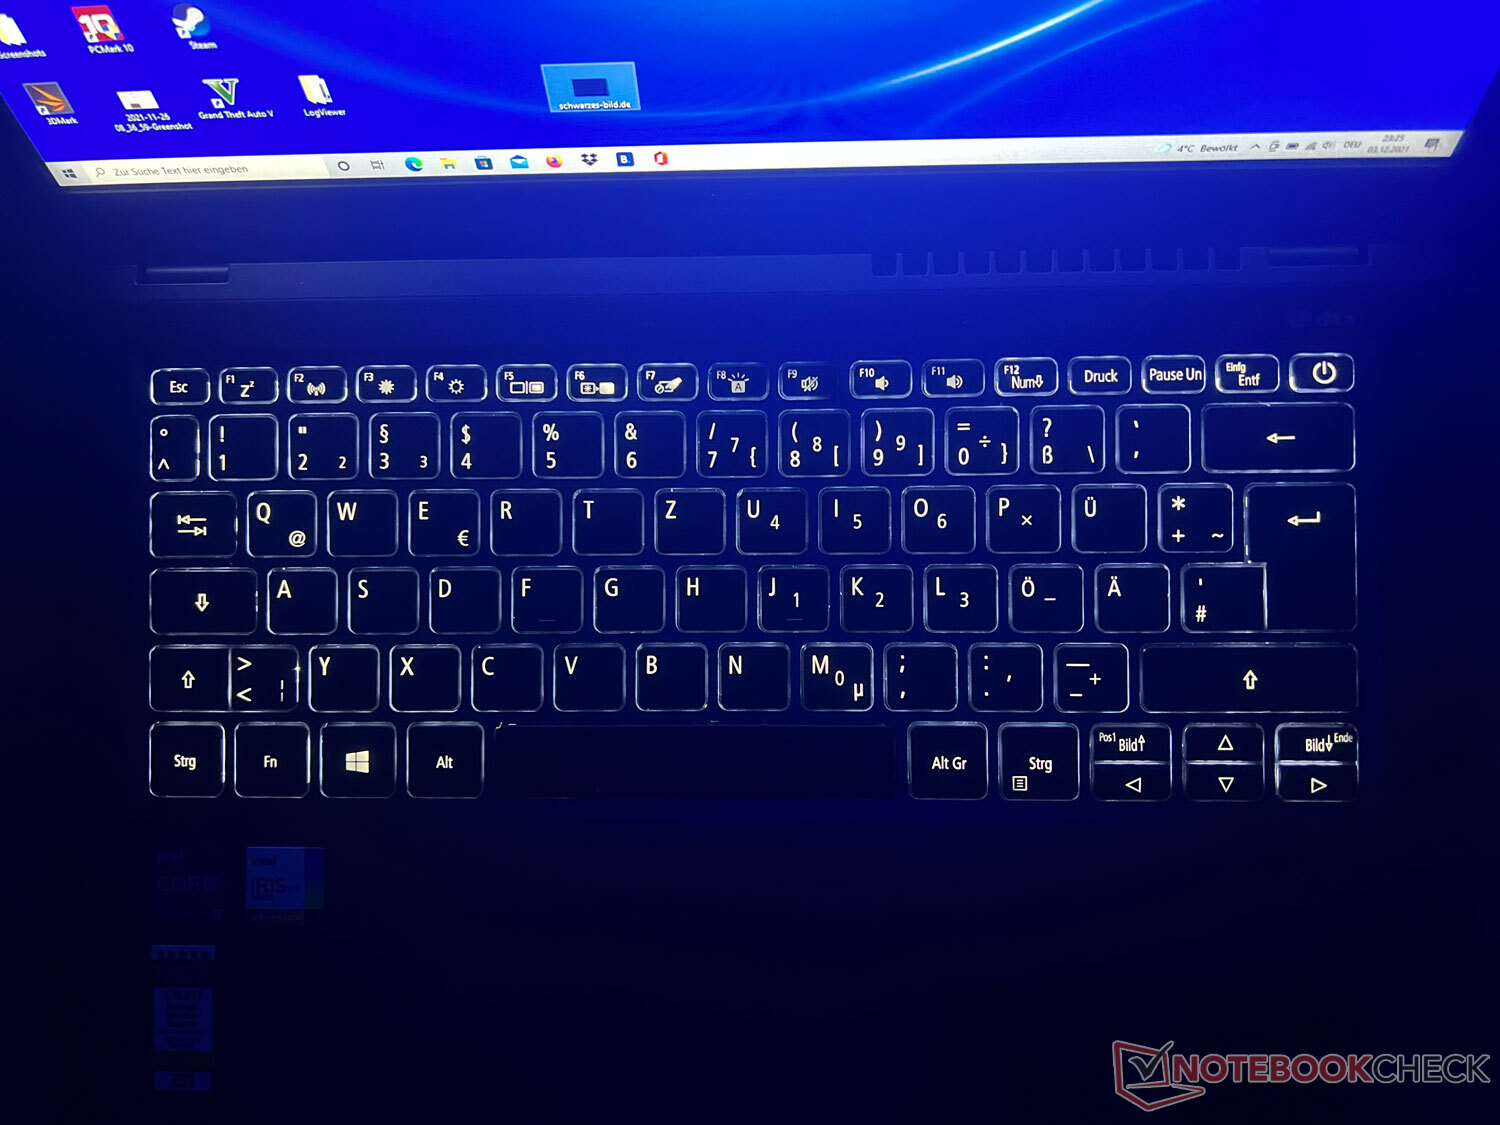
Keyboard
With its approximately 1.5 x 1.5 cm keys and firm stroke, the keyboard can be used quite well after a short accustomization period, and it's also pleasantly quiet. This also applies to the space bar, even though it makes a somewhat clattery impression. Pressing the keys with a lot of force causes the case to yield slightly at the center.
Acer uses the F1 to F12 keys for some functions, such as turning Wi-Fi on and off, managing external monitor settings, and switching the keyboard backlight. However, the keyboard illumination can't be dimmed.
Touchpad
The touchpad is slightly offset to the left under the space bar and measures approximately 10.5 x 6.5 cm. Its size is large enough, the feel is comfortable, and it's easy to use. The two integrated mouse buttons in the lower area are not separated haptically, and they're pleasantly quiet in use.
A bright matte display turn the Acer Swift 3X into a good outdoor device
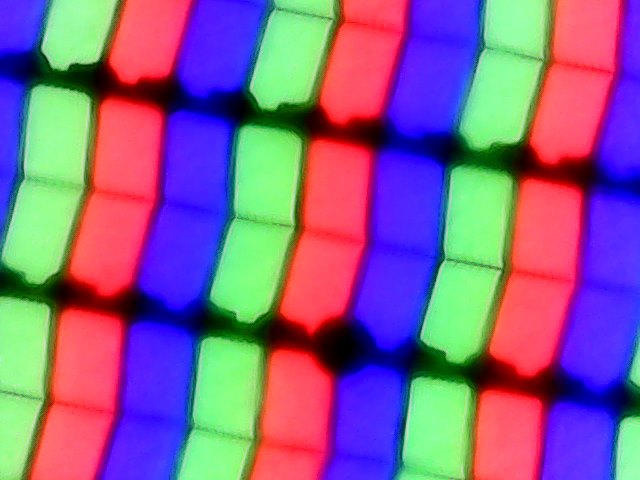
Acer has installed a 14-inch, matte IPS panel in the 16:9 format from AU Optronics. It has a resolution of 1920x1080 pixels (Full HD). Subjectively, the quality of device's display is pleasant, which can be confirmed objectively by the measured values.
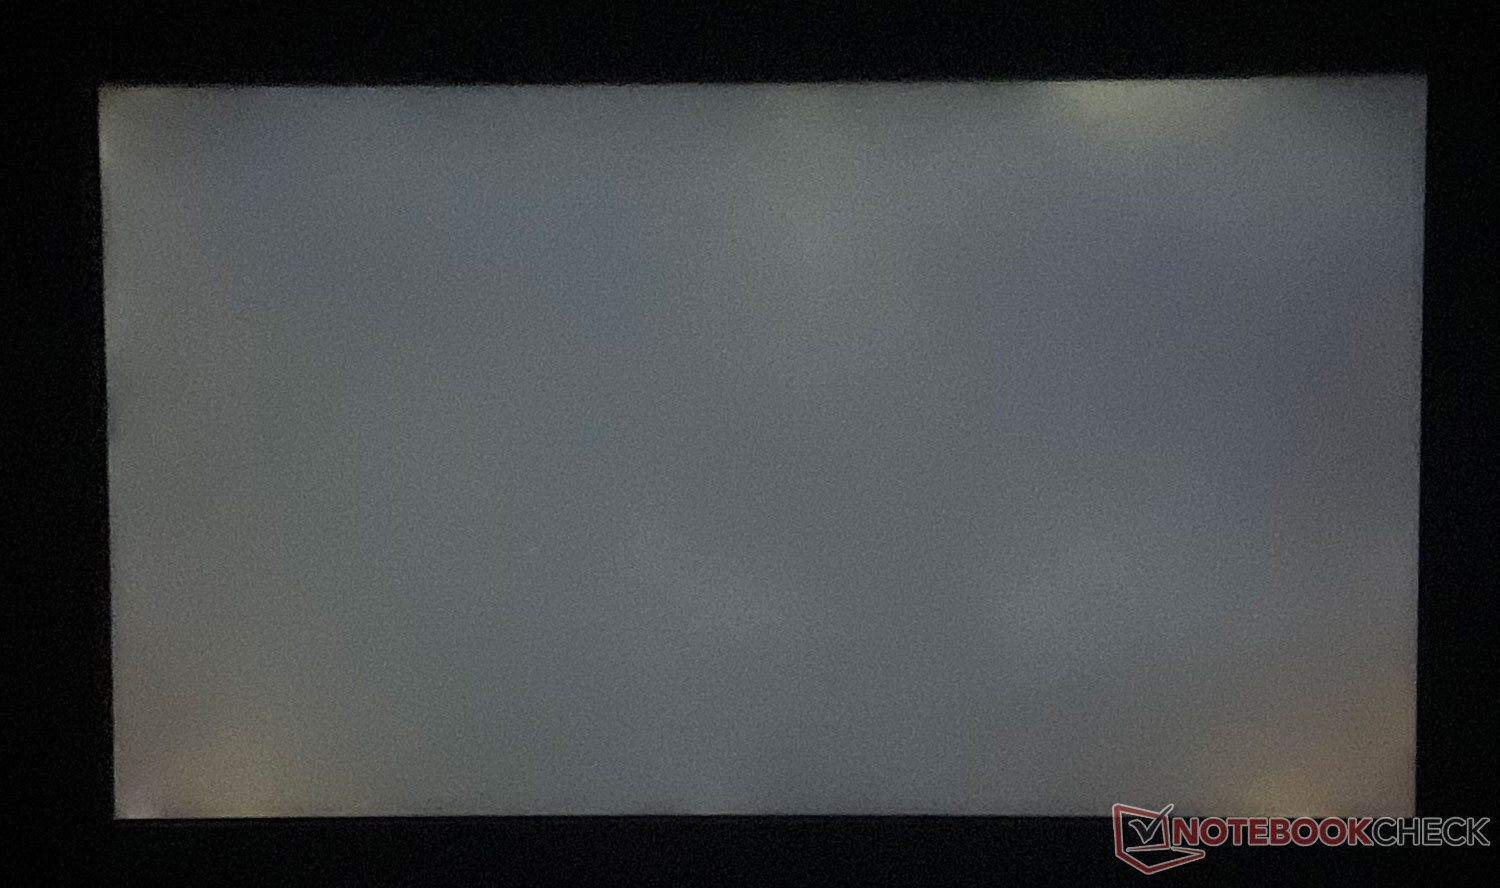
While the panel scores worse than most comparison models in terms of response times, many other aspects look significantly better. With an average of 372 cd/m², the Acer Swift 3X offers a pleasantly bright display that is also relatively uniformly illuminated. However, there is slight clouding as well as IPS glow at the edges, which is only visible when displaying fully dark backgrounds.
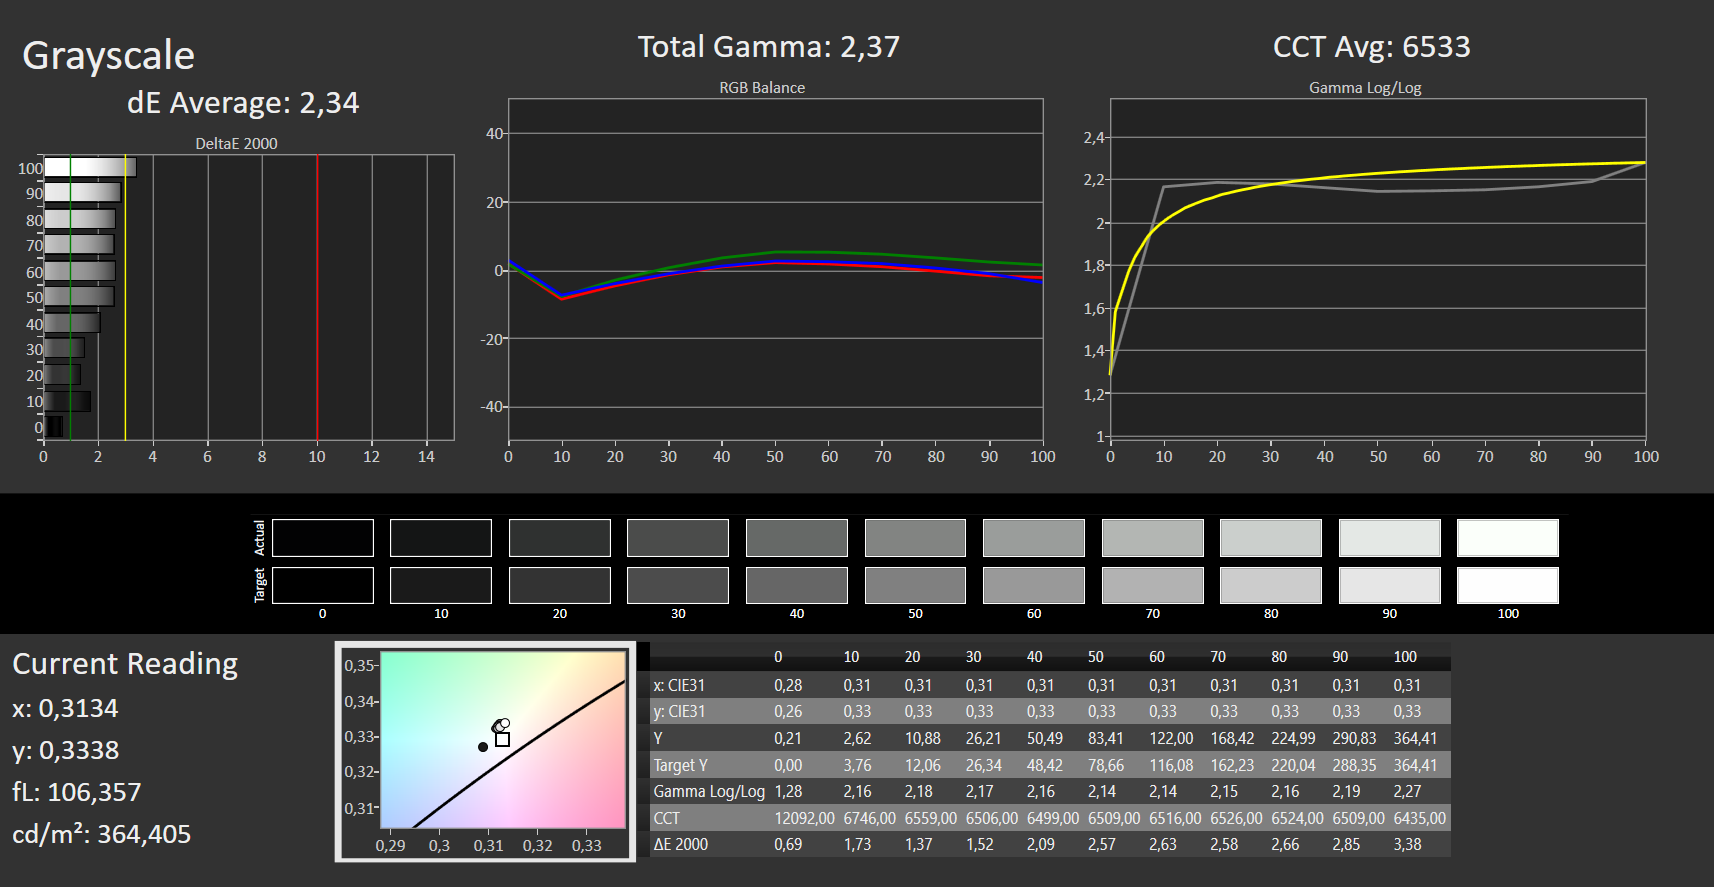
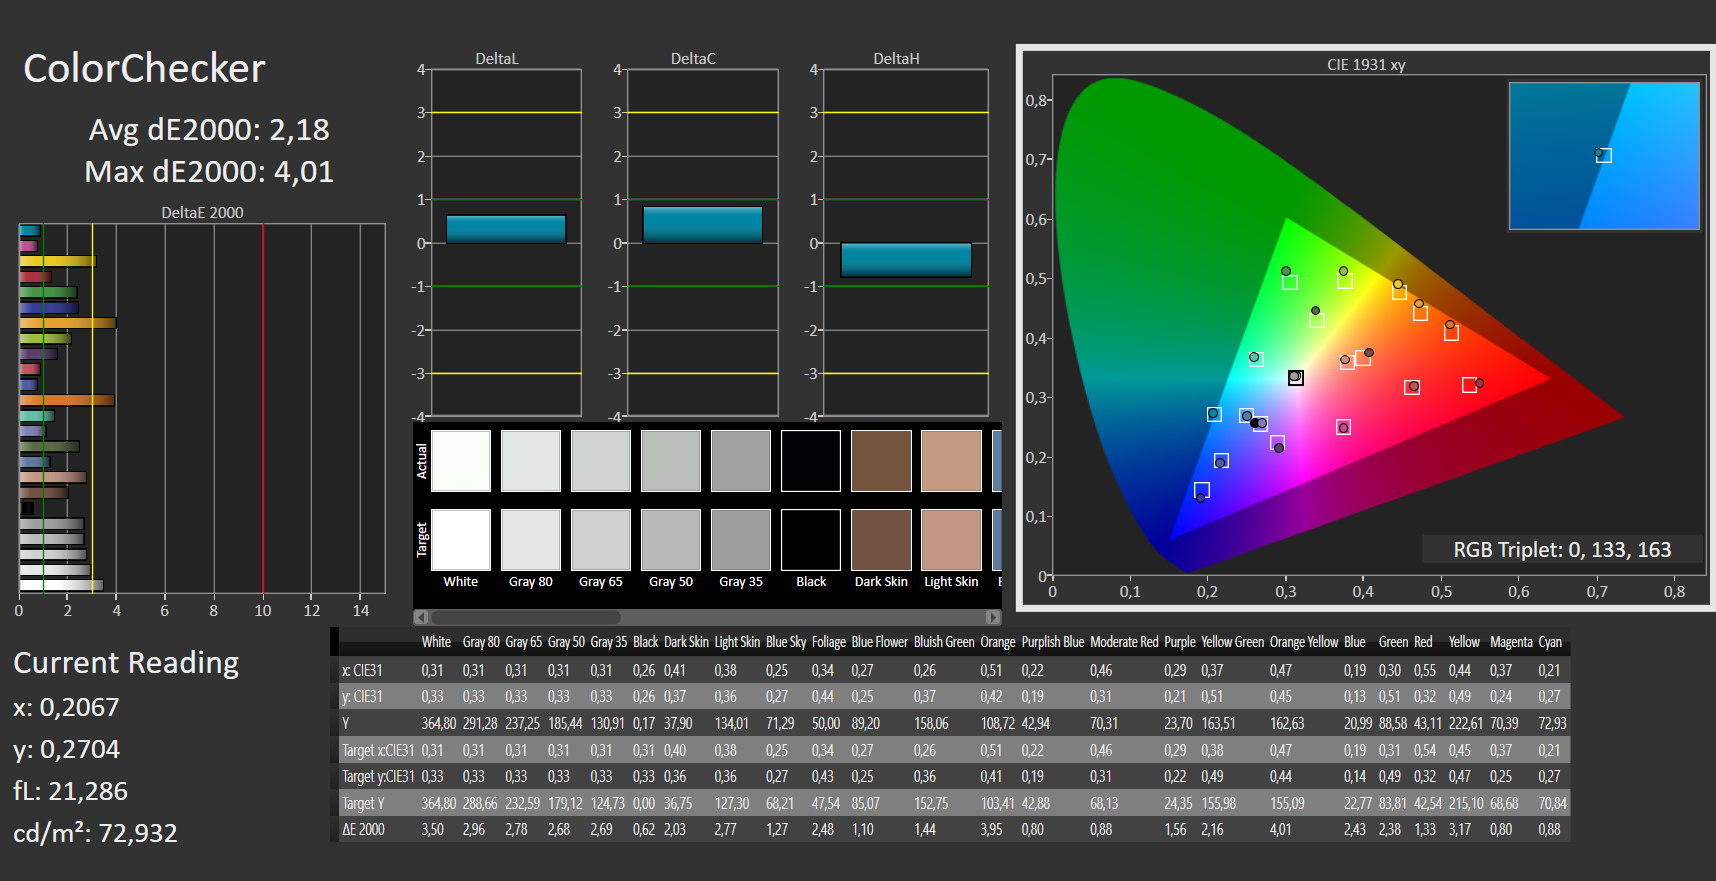
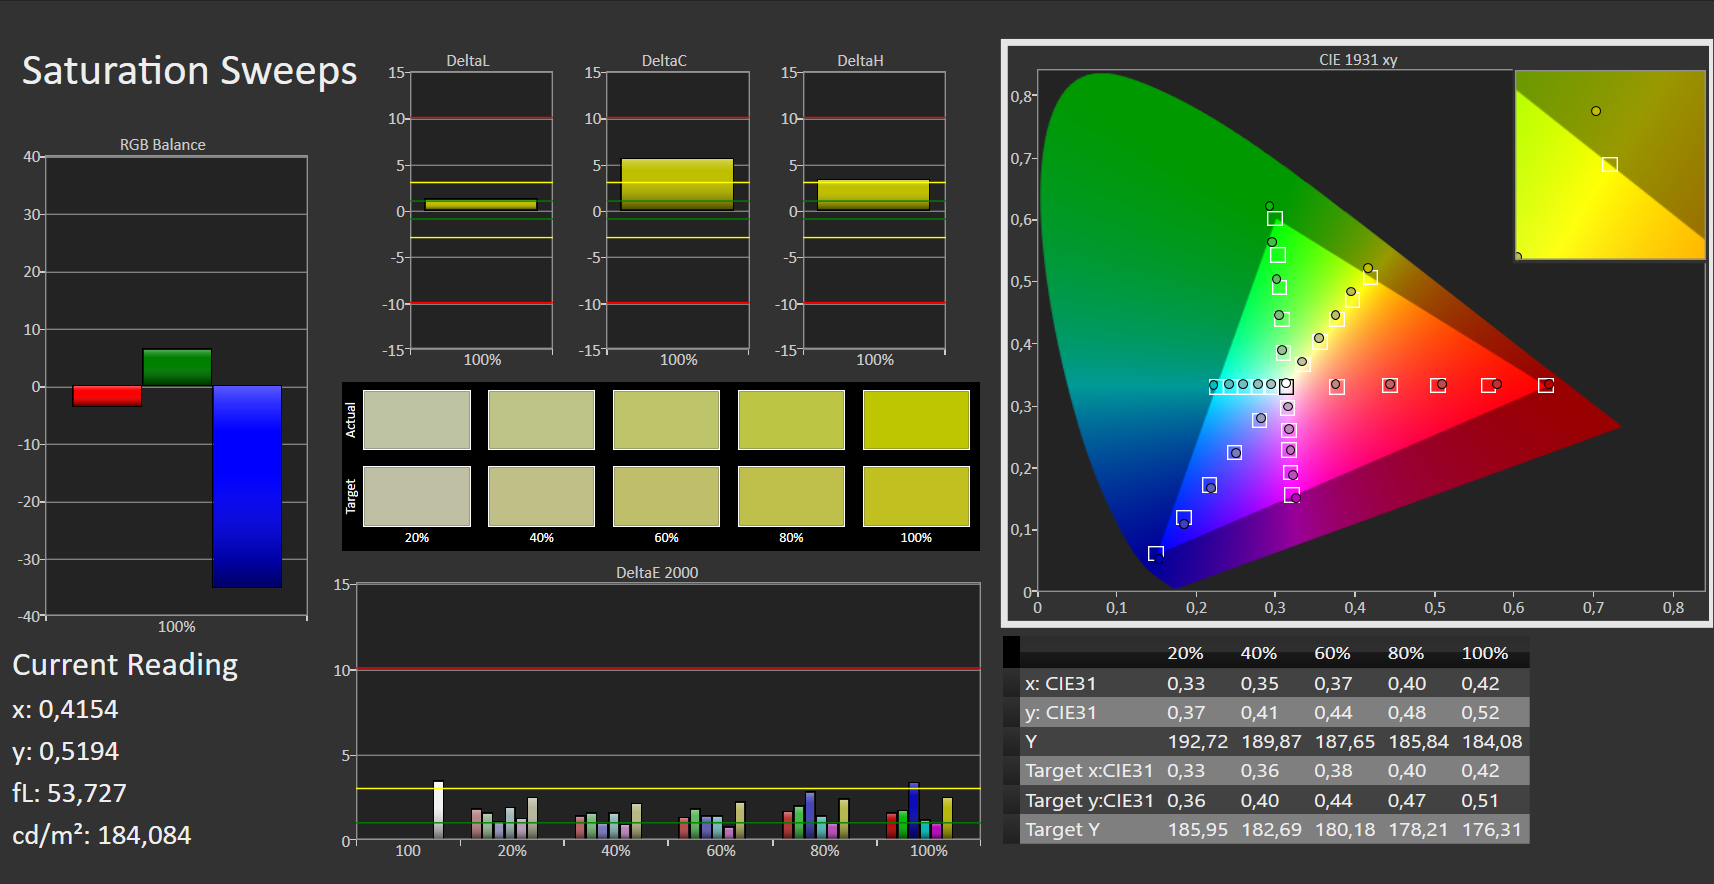
The black level, grayscales and colors are solidly displayed, as evidenced by DeltaE values of just over 2, among others. The contrast ratio is the second-highest after MSI's opponent.
| |||||||||||||||||||||||||
Brightness Distribution: 89 %
Center on Battery: 364 cd/m²
Contrast: 1916:1 (Black: 0.19 cd/m²)
ΔE Color 2.18 | 0.5-29.43 Ø5
ΔE Greyscale 2.34 | 0.57-98 Ø5.3
72.5% AdobeRGB 1998 (Argyll 2.2.0 3D)
99% sRGB (Argyll 2.2.0 3D)
71.5% Display P3 (Argyll 2.2.0 3D)
Gamma: 2.37
| Acer Swift 3X SF314-510G-70DW AU Optronics AUO683D, IPS, 1920x1080, 14.00 | Asus Vivobook 15 K513EQ Samsung ATNA56YX03-0, OLED, 1920x1080, 15.60 | Dell Inspiron 15 7000 7506 2-in-1 Black Edition AU Optronics B156ZAN, IPS, 3840x2160, 15.60 | Lenovo ThinkPad L14 G2 AMD B140HAN04.0, IPS LED, 1920x1080, 14.00 | Acer Swift 3 SF316-51 Chi Mei CMN160B, IPS, 1920x1080, 16.10 | Acer Swift 5 SF514-55T-58DN AU Optronics AUO7490, IPS, 1920x1080, 14.00 | MSI Modern 14 B11SB-085 BOE CQ NV140FHM-N4V, IPS, 1920x1080, 14.00 | |
|---|---|---|---|---|---|---|---|
| Display | 26% | 2% | -46% | -4% | -4% | -43% | |
| Display P3 Coverage | 71.5 | 99.9 40% | 74.3 4% | 37.5 -48% | 66.6 -7% | 67 -6% | 39.9 -44% |
| sRGB Coverage | 99 | 100 1% | 99 0% | 56.3 -43% | 99.5 1% | 98.3 -1% | 58.8 -41% |
| AdobeRGB 1998 Coverage | 72.5 | 99.9 38% | 74.6 3% | 38.7 -47% | 68.5 -6% | 68.3 -6% | 41.2 -43% |
| Response Times | 93% | -18% | 16% | 31% | 44% | 46% | |
| Response Time Grey 50% / Grey 80% * | 48 ? | 2.2 ? 95% | 55.2 ? -15% | 36 ? 25% | 32 ? 33% | 30 ? 37% | 25 ? 48% |
| Response Time Black / White * | 28 ? | 2.9 ? 90% | 34 ? -21% | 26 ? 7% | 20 ? 29% | 14 ? 50% | 16 ? 43% |
| PWM Frequency | 59.5 ? | 2500 ? | 92 ? | ||||
| Screen | -3% | -64% | -105% | 0% | 6% | -46% | |
| Brightness middle | 364 | 384.5 6% | 303.8 -17% | 278 -24% | 304 -16% | 404 11% | 347 -5% |
| Brightness | 372 | 388 4% | 296 -20% | 255 -31% | 284 -24% | 377 1% | 311 -16% |
| Brightness Distribution | 89 | 98 10% | 93 4% | 86 -3% | 88 -1% | 79 -11% | 81 -9% |
| Black Level * | 0.19 | 0.24 -26% | 0.33 -74% | 0.165 13% | 0.25 -32% | 0.12 37% | |
| Contrast | 1916 | 1266 -34% | 842 -56% | 1842 -4% | 1616 -16% | 2892 51% | |
| Colorchecker dE 2000 * | 2.18 | 2.53 -16% | 4.58 -110% | 5.9 -171% | 1.44 34% | 1.47 33% | 5.05 -132% |
| Colorchecker dE 2000 max. * | 4.01 | 6.16 -54% | 9.4 -134% | 20.2 -404% | 3.62 10% | 2.6 35% | 16.98 -323% |
| Greyscale dE 2000 * | 2.34 | 1.6 32% | 6.4 -174% | 4.1 -75% | 2.6 -11% | 1.7 27% | 1.63 30% |
| Gamma | 2.37 93% | 2.24 98% | 2.3 96% | 2.15 102% | 2.41 91% | 2.35 94% | 2.3 96% |
| CCT | 6533 99% | 6464 101% | 7414 88% | 7224 90% | 6527 100% | 6662 98% | 6666 98% |
| Colorchecker dE 2000 calibrated * | 2.17 | 4.5 | 0.84 | ||||
| Color Space (Percent of AdobeRGB 1998) | 66.7 | 68.5 | 63 | 38 | |||
| Color Space (Percent of sRGB) | 99 | 99.5 | 98 | 58 | |||
| Total Average (Program / Settings) | 39% /
22% | -27% /
-42% | -45% /
-73% | 9% /
4% | 15% /
9% | -14% /
-31% |
* ... smaller is better
The display of the Acer Swift 3X covers 99% of the sRGB color space. The values for DCI-P3 and AdobeRGB 1998 are just over 70%, which makes the device rather unfit for professional graphics editing.
Display Response Times
| ↔ Response Time Black to White | ||
|---|---|---|
| 28 ms ... rise ↗ and fall ↘ combined | ↗ 14 ms rise |  |
| ↘ 14 ms fall | ||
| The screen shows relatively slow response rates in our tests and may be too slow for gamers. In comparison, all tested devices range from 0.1 (minimum) to 240 (maximum) ms. » 67 % of all devices are better. This means that the measured response time is worse than the average of all tested devices (21.5 ms). | ||
| ↔ Response Time 50% Grey to 80% Grey | ||
| 48 ms ... rise ↗ and fall ↘ combined | ↗ 21 ms rise |  |
| ↘ 27 ms fall | ||
| The screen shows slow response rates in our tests and will be unsatisfactory for gamers. In comparison, all tested devices range from 0.2 (minimum) to 636 (maximum) ms. » 80 % of all devices are better. This means that the measured response time is worse than the average of all tested devices (33.7 ms). | ||
Screen Flickering / PWM (Pulse-Width Modulation)
| Screen flickering / PWM not detected |  | ||
In comparison: 53 % of all tested devices do not use PWM to dim the display. If PWM was detected, an average of 17900 (minimum: 5 - maximum: 3846000) Hz was measured. | |||
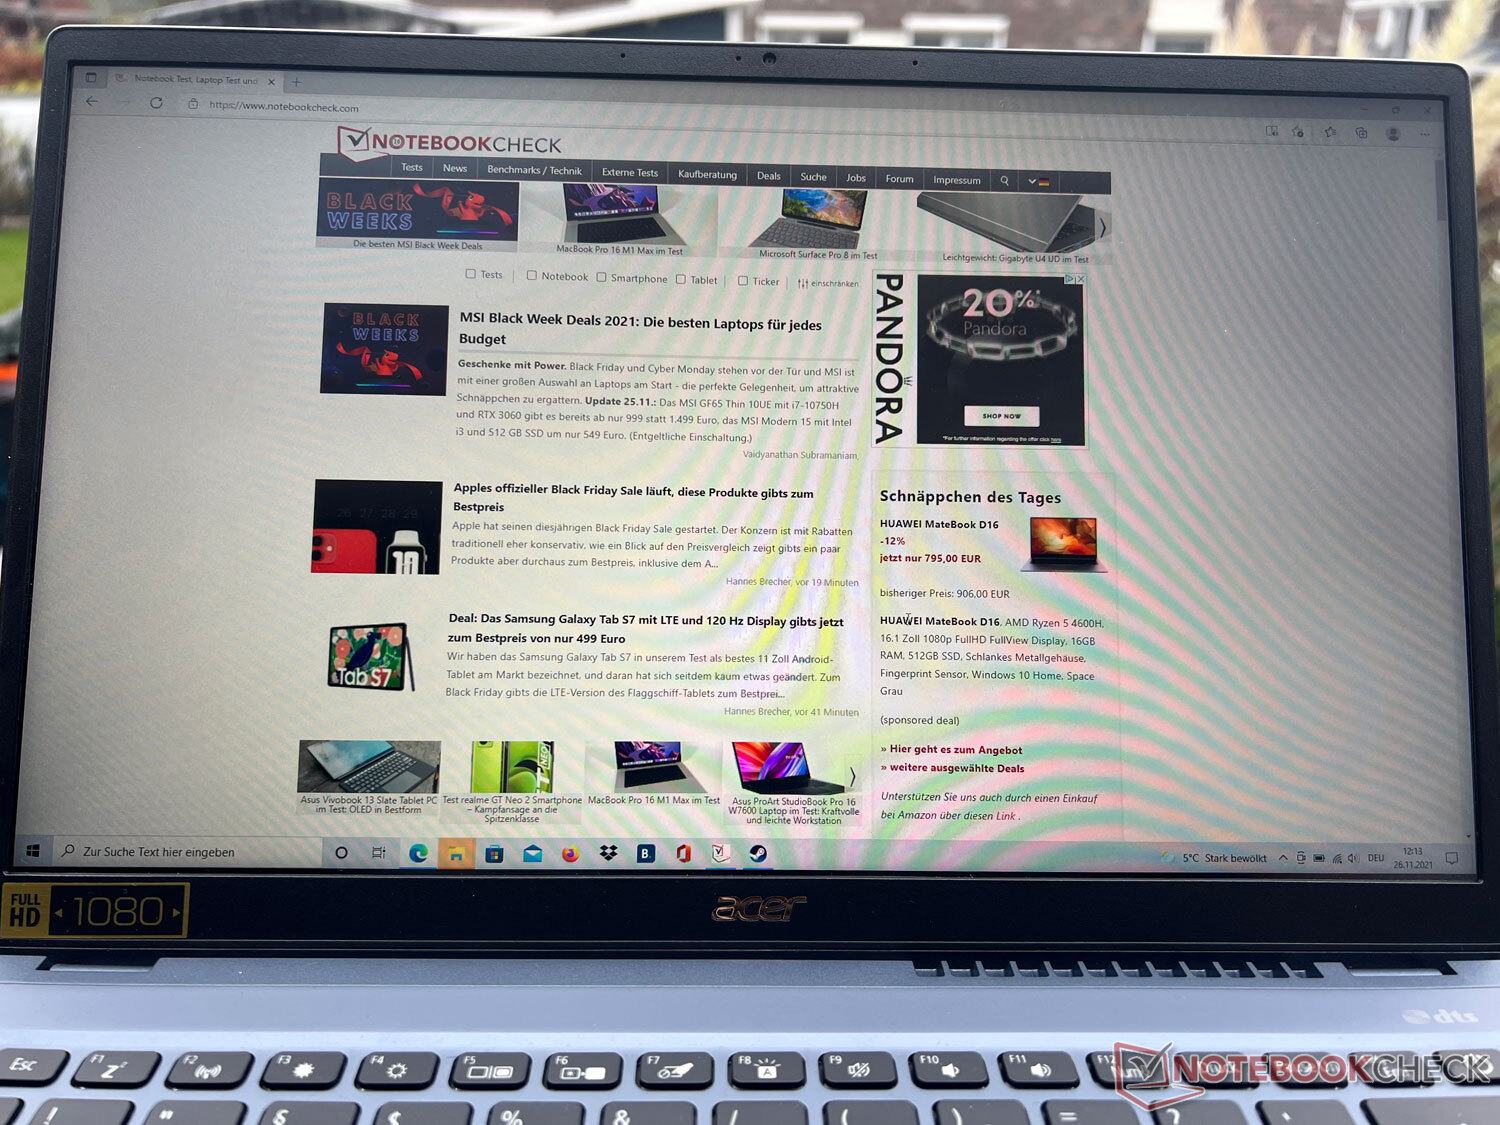
Thanks to the matte display with the fairly high brightness, the Acer Swift 3X SF314-510G-70DW is also well suited for outdoor use. As with most laptops, visibility becomes worse in direct sunlight. However, the device can be used without issues outdoors in a shaded spot.
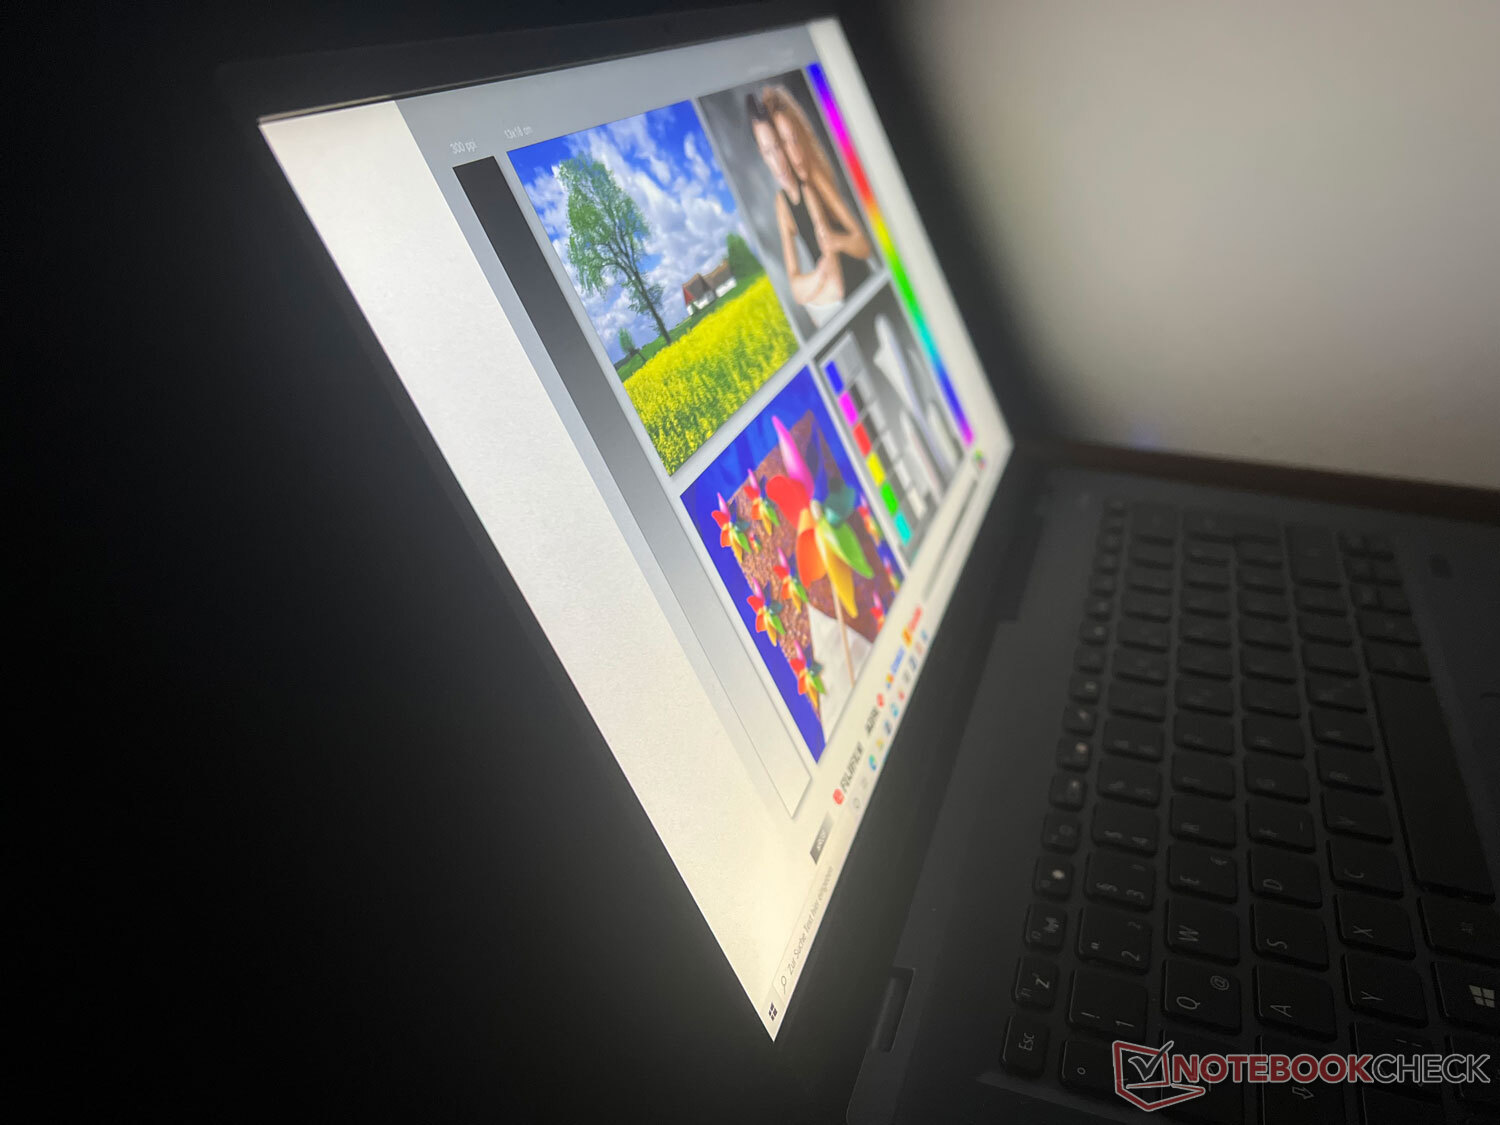
In addition, the display is very viewing-angle stable, as expected from the IPS panel. Therefore, content can still be recognized well from very oblique viewing angles.
MAXimum performance thanks to the dedicated GPU and fast CPU
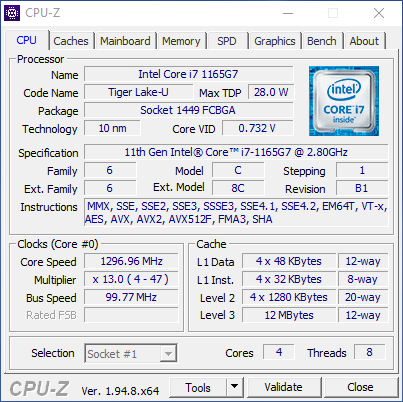
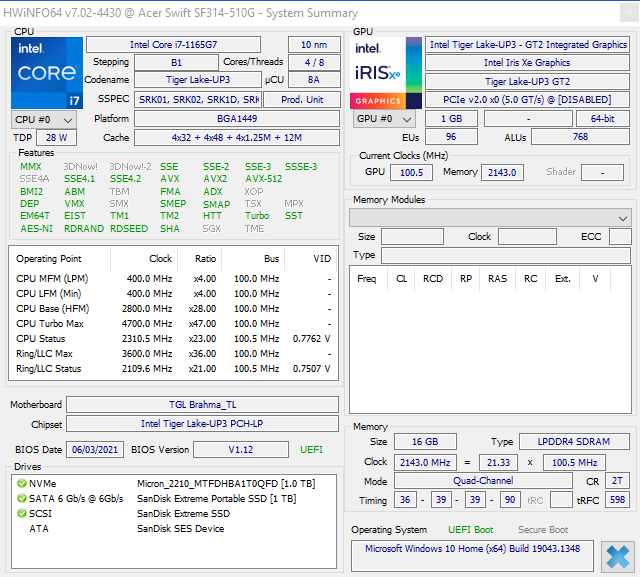
The Acer Swift 3X that we are reviewing has the model number SF314-510G-70DW and is equipped with the widely used Intel Core i7-1165G7 processor from the Tiger Lake generation, the dedicated Intel Iris Xe MAX GPU with 4 GB of onboard memory, as well as 16 GB of LPDDR4X RAM in dual-channel mode, and a 1 TB SSD. With this configuration, the device should be equipped for all the usual tasks of an office and multimedia device, and also should be good for occasional gaming. The following benchmarks will reveal whether this is confirmed, and whether the device can live up to its theoretical potential.
Alternatively, Acer offers the Swift 3X SF314-510G in other configurations, including the weaker i5-1135G7 and half as much RAM. The Intel Iris Xe Max Graphics is always on board.
Test conditions
The performance measurements were carried out using the "Best Performance" Windows power plan. The manufacturer doesn't provide its own performance modes via the Acer Care Center. The CPU's maximum TDP is 28 watts. When the power adapter is plugged into the Swift 3X, Acer supplies the processor with up to 64 watts (PL2) in the short term and 12 watts (PL1) in the long term load. The PL1 value drops minimally to 11.5 watts on battery power.
Processor
The built-in Intel Core i7-1165G7 consists of four cores with a base clock rate of 2.8 GHz and a Turbo clock speed of 4.7 GHz (4.1 GHz for all cores). In our CPU benchmarks, the Acer Swift 3X is consistently ranked in the top three among the competitors, although it never makes it to the very top. As expected, this is where devices with the AMD Ryzen 7 PRO 5850U, which has a much higher multi-core performance, or the stronger Intel Core i7-11370H are usually found. However, the gap to the latter is quite narrow.
On the other hand, the Swift 3X regularly leaves the rest of the comparison models that have the same CPU behind, and it always positions itself above the Intel Core i7-1165G7's average score. In the Cinebench multi-core test, performance remains very constant over time after a short initial peak, which means that the CPU performance doesn't fluctuate or drop even during prolonged load. The processor performance drops by about 20% to 30% on battery power.
Cinebench R15 Multi endurance test
Cinebench R23: Multi Core | Single Core
Cinebench R20: CPU (Multi Core) | CPU (Single Core)
Cinebench R15: CPU Multi 64Bit | CPU Single 64Bit
Blender: v2.79 BMW27 CPU
7-Zip 18.03: 7z b 4 | 7z b 4 -mmt1
Geekbench 5.5: Multi-Core | Single-Core
HWBOT x265 Benchmark v2.2: 4k Preset
LibreOffice : 20 Documents To PDF
R Benchmark 2.5: Overall mean
| CPU Performance Rating | |
| Average of class Multimedia | |
| Lenovo ThinkPad L14 G2 AMD | |
| Acer Swift 3 SF316-51 | |
| Acer Swift 3X SF314-510G-70DW | |
| MSI Modern 14 B11SB-085 | |
| Asus Vivobook 15 K513EQ -2! | |
| Average Intel Core i7-1165G7 | |
| Dell Inspiron 15 7000 7506 2-in-1 Black Edition -1! | |
| Acer Swift 5 SF514-55T-58DN -2! | |
| Cinebench R23 / Multi Core | |
| Average of class Multimedia (4624 - 30789, n=101, last 2 years) | |
| Lenovo ThinkPad L14 G2 AMD | |
| Acer Swift 3 SF316-51 | |
| Acer Swift 3X SF314-510G-70DW | |
| Asus Vivobook 15 K513EQ | |
| MSI Modern 14 B11SB-085 | |
| Average Intel Core i7-1165G7 (2525 - 6862, n=64) | |
| Dell Inspiron 15 7000 7506 2-in-1 Black Edition | |
| Cinebench R23 / Single Core | |
| Average of class Multimedia (878 - 2110, n=99, last 2 years) | |
| Acer Swift 3 SF316-51 | |
| Acer Swift 3X SF314-510G-70DW | |
| MSI Modern 14 B11SB-085 | |
| Asus Vivobook 15 K513EQ | |
| Average Intel Core i7-1165G7 (1110 - 1539, n=59) | |
| Lenovo ThinkPad L14 G2 AMD | |
| Cinebench R20 / CPU (Multi Core) | |
| Average of class Multimedia (1783 - 11768, n=97, last 2 years) | |
| Lenovo ThinkPad L14 G2 AMD | |
| Acer Swift 3 SF316-51 | |
| Acer Swift 3X SF314-510G-70DW | |
| Asus Vivobook 15 K513EQ | |
| MSI Modern 14 B11SB-085 | |
| Acer Swift 5 SF514-55T-58DN | |
| Average Intel Core i7-1165G7 (1060 - 2657, n=81) | |
| Dell Inspiron 15 7000 7506 2-in-1 Black Edition | |
| Cinebench R20 / CPU (Single Core) | |
| Average of class Multimedia (341 - 812, n=97, last 2 years) | |
| Acer Swift 3 SF316-51 | |
| Acer Swift 3X SF314-510G-70DW | |
| MSI Modern 14 B11SB-085 | |
| Asus Vivobook 15 K513EQ | |
| Average Intel Core i7-1165G7 (442 - 589, n=81) | |
| Lenovo ThinkPad L14 G2 AMD | |
| Acer Swift 5 SF514-55T-58DN | |
| Dell Inspiron 15 7000 7506 2-in-1 Black Edition | |
| Cinebench R15 / CPU Multi 64Bit | |
| Average of class Multimedia (785 - 4703, n=106, last 2 years) | |
| Lenovo ThinkPad L14 G2 AMD | |
| Acer Swift 3 SF316-51 | |
| Acer Swift 3X SF314-510G-70DW | |
| Acer Swift 5 SF514-55T-58DN | |
| MSI Modern 14 B11SB-085 | |
| Asus Vivobook 15 K513EQ | |
| Average Intel Core i7-1165G7 (553 - 1027, n=86) | |
| Dell Inspiron 15 7000 7506 2-in-1 Black Edition | |
| Cinebench R15 / CPU Single 64Bit | |
| Average of class Multimedia (142.6 - 308, n=99, last 2 years) | |
| Acer Swift 3 SF316-51 | |
| Acer Swift 3X SF314-510G-70DW | |
| Lenovo ThinkPad L14 G2 AMD | |
| Asus Vivobook 15 K513EQ | |
| Average Intel Core i7-1165G7 (115 - 230, n=78) | |
| Dell Inspiron 15 7000 7506 2-in-1 Black Edition | |
| MSI Modern 14 B11SB-085 | |
| Acer Swift 5 SF514-55T-58DN | |
| Blender / v2.79 BMW27 CPU | |
| Average Intel Core i7-1165G7 (468 - 1138, n=80) | |
| Dell Inspiron 15 7000 7506 2-in-1 Black Edition | |
| Acer Swift 5 SF514-55T-58DN | |
| MSI Modern 14 B11SB-085 | |
| Asus Vivobook 15 K513EQ | |
| Acer Swift 3X SF314-510G-70DW | |
| Acer Swift 3 SF316-51 | |
| Lenovo ThinkPad L14 G2 AMD | |
| Average of class Multimedia (107 - 662, n=95, last 2 years) | |
| 7-Zip 18.03 / 7z b 4 | |
| Average of class Multimedia (20166 - 119900, n=90, last 2 years) | |
| Lenovo ThinkPad L14 G2 AMD | |
| Acer Swift 3 SF316-51 | |
| Acer Swift 3X SF314-510G-70DW | |
| Asus Vivobook 15 K513EQ | |
| Acer Swift 5 SF514-55T-58DN | |
| MSI Modern 14 B11SB-085 | |
| Dell Inspiron 15 7000 7506 2-in-1 Black Edition | |
| Average Intel Core i7-1165G7 (15347 - 27405, n=80) | |
| 7-Zip 18.03 / 7z b 4 -mmt1 | |
| Average of class Multimedia (3398 - 7163, n=90, last 2 years) | |
| Acer Swift 3 SF316-51 | |
| Acer Swift 3X SF314-510G-70DW | |
| Asus Vivobook 15 K513EQ | |
| MSI Modern 14 B11SB-085 | |
| Average Intel Core i7-1165G7 (4478 - 5507, n=80) | |
| Dell Inspiron 15 7000 7506 2-in-1 Black Edition | |
| Lenovo ThinkPad L14 G2 AMD | |
| Acer Swift 5 SF514-55T-58DN | |
| Geekbench 5.5 / Multi-Core | |
| Average of class Multimedia (3828 - 23059, n=100, last 2 years) | |
| Acer Swift 3 SF316-51 | |
| Acer Swift 3X SF314-510G-70DW | |
| Acer Swift 5 SF514-55T-58DN | |
| Dell Inspiron 15 7000 7506 2-in-1 Black Edition | |
| Average Intel Core i7-1165G7 (3078 - 5926, n=77) | |
| Lenovo ThinkPad L14 G2 AMD | |
| MSI Modern 14 B11SB-085 | |
| Geekbench 5.5 / Single-Core | |
| Average of class Multimedia (926 - 2342, n=100, last 2 years) | |
| Acer Swift 3 SF316-51 | |
| Acer Swift 3X SF314-510G-70DW | |
| Average Intel Core i7-1165G7 (1302 - 1595, n=77) | |
| MSI Modern 14 B11SB-085 | |
| Dell Inspiron 15 7000 7506 2-in-1 Black Edition | |
| Acer Swift 5 SF514-55T-58DN | |
| Lenovo ThinkPad L14 G2 AMD | |
| HWBOT x265 Benchmark v2.2 / 4k Preset | |
| Average of class Multimedia (4.99 - 30.5, n=88, last 2 years) | |
| Lenovo ThinkPad L14 G2 AMD | |
| Acer Swift 3 SF316-51 | |
| Acer Swift 3X SF314-510G-70DW | |
| Asus Vivobook 15 K513EQ | |
| MSI Modern 14 B11SB-085 | |
| Dell Inspiron 15 7000 7506 2-in-1 Black Edition | |
| Acer Swift 5 SF514-55T-58DN | |
| Average Intel Core i7-1165G7 (1.39 - 8.47, n=80) | |
| LibreOffice / 20 Documents To PDF | |
| Lenovo ThinkPad L14 G2 AMD | |
| MSI Modern 14 B11SB-085 | |
| Acer Swift 5 SF514-55T-58DN | |
| Average Intel Core i7-1165G7 (21.5 - 88.1, n=78) | |
| Average of class Multimedia (6.7 - 84.9, n=92, last 2 years) | |
| Dell Inspiron 15 7000 7506 2-in-1 Black Edition | |
| Asus Vivobook 15 K513EQ | |
| Acer Swift 3X SF314-510G-70DW | |
| Acer Swift 3 SF316-51 | |
| R Benchmark 2.5 / Overall mean | |
| Acer Swift 5 SF514-55T-58DN | |
| Dell Inspiron 15 7000 7506 2-in-1 Black Edition | |
| Average Intel Core i7-1165G7 (0.552 - 1.002, n=80) | |
| MSI Modern 14 B11SB-085 | |
| Asus Vivobook 15 K513EQ | |
| Acer Swift 3X SF314-510G-70DW | |
| Lenovo ThinkPad L14 G2 AMD | |
| Acer Swift 3 SF316-51 | |
| Average of class Multimedia (0.3826 - 0.723, n=90, last 2 years) | |
* ... smaller is better
AIDA64: FP32 Ray-Trace | FPU Julia | CPU SHA3 | CPU Queen | FPU SinJulia | FPU Mandel | CPU AES | CPU ZLib | FP64 Ray-Trace | CPU PhotoWorxx
| Performance Rating | |
| Average of class Multimedia | |
| Lenovo ThinkPad L14 G2 AMD | |
| Acer Swift 3X SF314-510G-70DW | |
| Asus Vivobook 15 K513EQ | |
| Average Intel Core i7-1165G7 | |
| MSI Modern 14 B11SB-085 | |
| Acer Swift 5 SF514-55T-58DN -9! | |
| AIDA64 / FP32 Ray-Trace | |
| Average of class Multimedia (3804 - 27411, n=88, last 2 years) | |
| Lenovo ThinkPad L14 G2 AMD | |
| Acer Swift 3X SF314-510G-70DW | |
| Asus Vivobook 15 K513EQ | |
| MSI Modern 14 B11SB-085 | |
| Average Intel Core i7-1165G7 (3933 - 8184, n=58) | |
| AIDA64 / FPU Julia | |
| Average of class Multimedia (16379 - 136048, n=88, last 2 years) | |
| Lenovo ThinkPad L14 G2 AMD | |
| Acer Swift 3X SF314-510G-70DW | |
| Asus Vivobook 15 K513EQ | |
| MSI Modern 14 B11SB-085 | |
| Average Intel Core i7-1165G7 (17720 - 34369, n=58) | |
| AIDA64 / CPU SHA3 | |
| Average of class Multimedia (1099 - 6681, n=88, last 2 years) | |
| Acer Swift 3X SF314-510G-70DW | |
| Lenovo ThinkPad L14 G2 AMD | |
| Asus Vivobook 15 K513EQ | |
| MSI Modern 14 B11SB-085 | |
| Average Intel Core i7-1165G7 (958 - 2338, n=58) | |
| AIDA64 / CPU Queen | |
| Average of class Multimedia (21547 - 134321, n=88, last 2 years) | |
| Lenovo ThinkPad L14 G2 AMD | |
| Acer Swift 3X SF314-510G-70DW | |
| Asus Vivobook 15 K513EQ | |
| Average Intel Core i7-1165G7 (44161 - 50624, n=58) | |
| MSI Modern 14 B11SB-085 | |
| AIDA64 / FPU SinJulia | |
| Lenovo ThinkPad L14 G2 AMD | |
| Average of class Multimedia (3099 - 15484, n=88, last 2 years) | |
| Acer Swift 3X SF314-510G-70DW | |
| Asus Vivobook 15 K513EQ | |
| MSI Modern 14 B11SB-085 | |
| Average Intel Core i7-1165G7 (3183 - 4796, n=58) | |
| AIDA64 / FPU Mandel | |
| Average of class Multimedia (9602 - 68591, n=88, last 2 years) | |
| Lenovo ThinkPad L14 G2 AMD | |
| Acer Swift 3X SF314-510G-70DW | |
| Asus Vivobook 15 K513EQ | |
| MSI Modern 14 B11SB-085 | |
| Average Intel Core i7-1165G7 (11876 - 20468, n=58) | |
| AIDA64 / CPU AES | |
| Lenovo ThinkPad L14 G2 AMD | |
| Average of class Multimedia (23702 - 169946, n=88, last 2 years) | |
| Asus Vivobook 15 K513EQ | |
| Acer Swift 3X SF314-510G-70DW | |
| Average Intel Core i7-1165G7 (29506 - 73387, n=58) | |
| MSI Modern 14 B11SB-085 | |
| AIDA64 / CPU ZLib | |
| Average of class Multimedia (302 - 1901, n=88, last 2 years) | |
| Lenovo ThinkPad L14 G2 AMD | |
| Acer Swift 3X SF314-510G-70DW | |
| Asus Vivobook 15 K513EQ | |
| MSI Modern 14 B11SB-085 | |
| Average Intel Core i7-1165G7 (169 - 402, n=65) | |
| Acer Swift 5 SF514-55T-58DN | |
| AIDA64 / FP64 Ray-Trace | |
| Average of class Multimedia (1996 - 14590, n=88, last 2 years) | |
| Lenovo ThinkPad L14 G2 AMD | |
| Acer Swift 3X SF314-510G-70DW | |
| Asus Vivobook 15 K513EQ | |
| MSI Modern 14 B11SB-085 | |
| Average Intel Core i7-1165G7 (2033 - 4461, n=58) | |
| AIDA64 / CPU PhotoWorxx | |
| Acer Swift 3X SF314-510G-70DW | |
| Average of class Multimedia (7419 - 53918, n=88, last 2 years) | |
| Average Intel Core i7-1165G7 (12392 - 45694, n=58) | |
| Asus Vivobook 15 K513EQ | |
| MSI Modern 14 B11SB-085 | |
| Lenovo ThinkPad L14 G2 AMD | |
System performance
Unfortunately, the Acer laptop isn't able to make full use of the CPU when it comes to system performance, despite the fast RAM. Above all, the slow SSD, which we will discuss in more detail below, reveals itself to be a brake. The scores fluctuate considerably in the end, but they're generally in the midfield. In our test, however, we didn't notice any issues with the device in everyday use.
| PCMark 10 / Score | |
| Average of class Multimedia (4635 - 8670, n=85, last 2 years) | |
| Lenovo ThinkPad L14 G2 AMD | |
| Acer Swift 3 SF316-51 | |
| Asus Vivobook 15 K513EQ | |
| Dell Inspiron 15 7000 7506 2-in-1 Black Edition | |
| Average Intel Core i7-1165G7, Intel Iris Xe MAX Graphics (4912 - 5020, n=2) | |
| Acer Swift 3X SF314-510G-70DW | |
| MSI Modern 14 B11SB-085 | |
| Acer Swift 5 SF514-55T-58DN | |
| PCMark 10 / Essentials | |
| Average of class Multimedia (8480 - 12420, n=85, last 2 years) | |
| Acer Swift 3 SF316-51 | |
| Lenovo ThinkPad L14 G2 AMD | |
| Acer Swift 3X SF314-510G-70DW | |
| Average Intel Core i7-1165G7, Intel Iris Xe MAX Graphics (9666 - 10086, n=2) | |
| Acer Swift 5 SF514-55T-58DN | |
| Dell Inspiron 15 7000 7506 2-in-1 Black Edition | |
| Asus Vivobook 15 K513EQ | |
| MSI Modern 14 B11SB-085 | |
| PCMark 10 / Productivity | |
| Lenovo ThinkPad L14 G2 AMD | |
| Asus Vivobook 15 K513EQ | |
| Average of class Multimedia (5845 - 11186, n=85, last 2 years) | |
| MSI Modern 14 B11SB-085 | |
| Acer Swift 3 SF316-51 | |
| Dell Inspiron 15 7000 7506 2-in-1 Black Edition | |
| Acer Swift 5 SF514-55T-58DN | |
| Average Intel Core i7-1165G7, Intel Iris Xe MAX Graphics (6365 - 6568, n=2) | |
| Acer Swift 3X SF314-510G-70DW | |
| PCMark 10 / Digital Content Creation | |
| Average of class Multimedia (4688 - 13548, n=85, last 2 years) | |
| Acer Swift 3 SF316-51 | |
| Dell Inspiron 15 7000 7506 2-in-1 Black Edition | |
| Average Intel Core i7-1165G7, Intel Iris Xe MAX Graphics (5013 - 5409, n=2) | |
| Lenovo ThinkPad L14 G2 AMD | |
| Acer Swift 3X SF314-510G-70DW | |
| MSI Modern 14 B11SB-085 | |
| Acer Swift 5 SF514-55T-58DN | |
| Asus Vivobook 15 K513EQ | |
| PCMark 8 Home Score Accelerated v2 | 5391 points | |
| PCMark 8 Creative Score Accelerated v2 | 7093 points | |
| PCMark 8 Work Score Accelerated v2 | 3214 points | |
| PCMark 10 Score | 4912 points | |
Help | ||
| AIDA64 / Memory Copy | |
| Acer Swift 3X SF314-510G-70DW | |
| Average of class Multimedia (20513 - 94254, n=88, last 2 years) | |
| Average Intel Core i7-1165G7 (20032 - 65446, n=58) | |
| Asus Vivobook 15 K513EQ | |
| MSI Modern 14 B11SB-085 | |
| Lenovo ThinkPad L14 G2 AMD | |
| AIDA64 / Memory Read | |
| Acer Swift 3X SF314-510G-70DW | |
| Average of class Multimedia (22917 - 90142, n=88, last 2 years) | |
| Average Intel Core i7-1165G7 (23033 - 64524, n=58) | |
| Asus Vivobook 15 K513EQ | |
| Lenovo ThinkPad L14 G2 AMD | |
| MSI Modern 14 B11SB-085 | |
| AIDA64 / Memory Write | |
| Acer Swift 3X SF314-510G-70DW | |
| Average of class Multimedia (20226 - 95196, n=88, last 2 years) | |
| Average Intel Core i7-1165G7 (21736 - 66791, n=58) | |
| Asus Vivobook 15 K513EQ | |
| Lenovo ThinkPad L14 G2 AMD | |
| MSI Modern 14 B11SB-085 | |
| AIDA64 / Memory Latency | |
| Lenovo ThinkPad L14 G2 AMD | |
| Average of class Multimedia (75 - 346, n=87, last 2 years) | |
| Asus Vivobook 15 K513EQ | |
| Acer Swift 3X SF314-510G-70DW | |
| Average Intel Core i7-1165G7 (71.4 - 110, n=65) | |
| MSI Modern 14 B11SB-085 | |
| Acer Swift 5 SF514-55T-58DN | |
* ... smaller is better
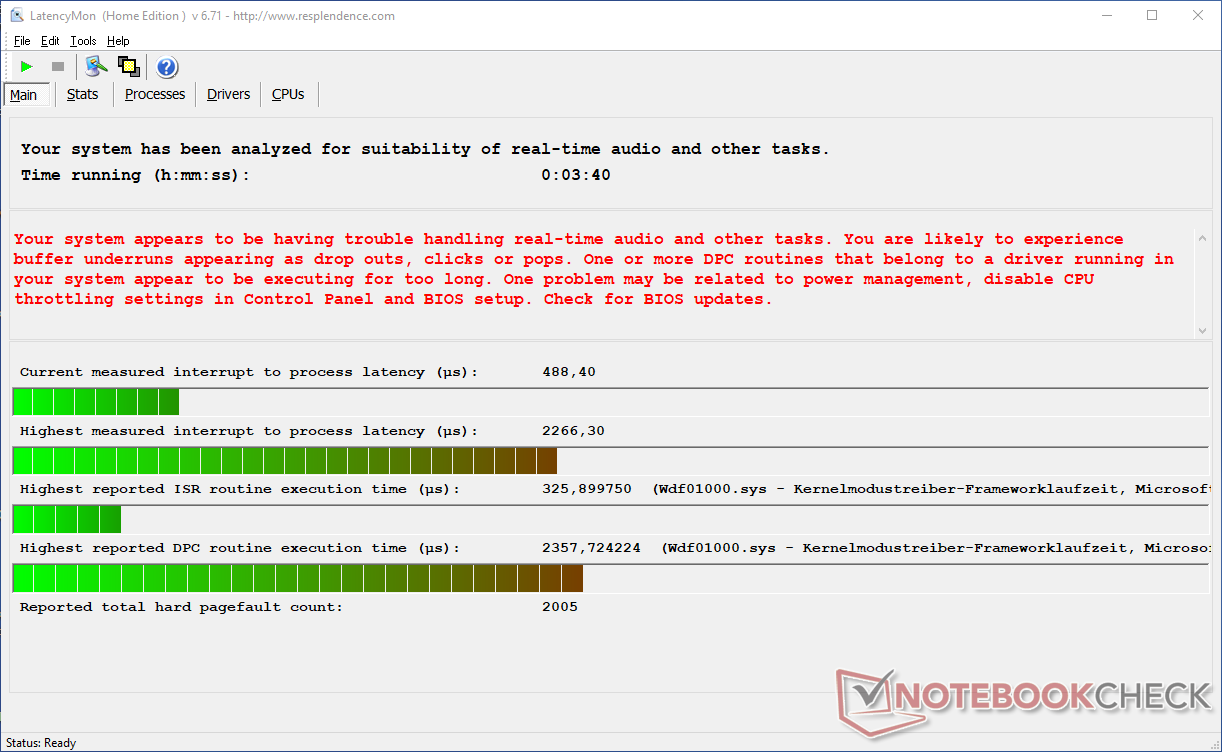
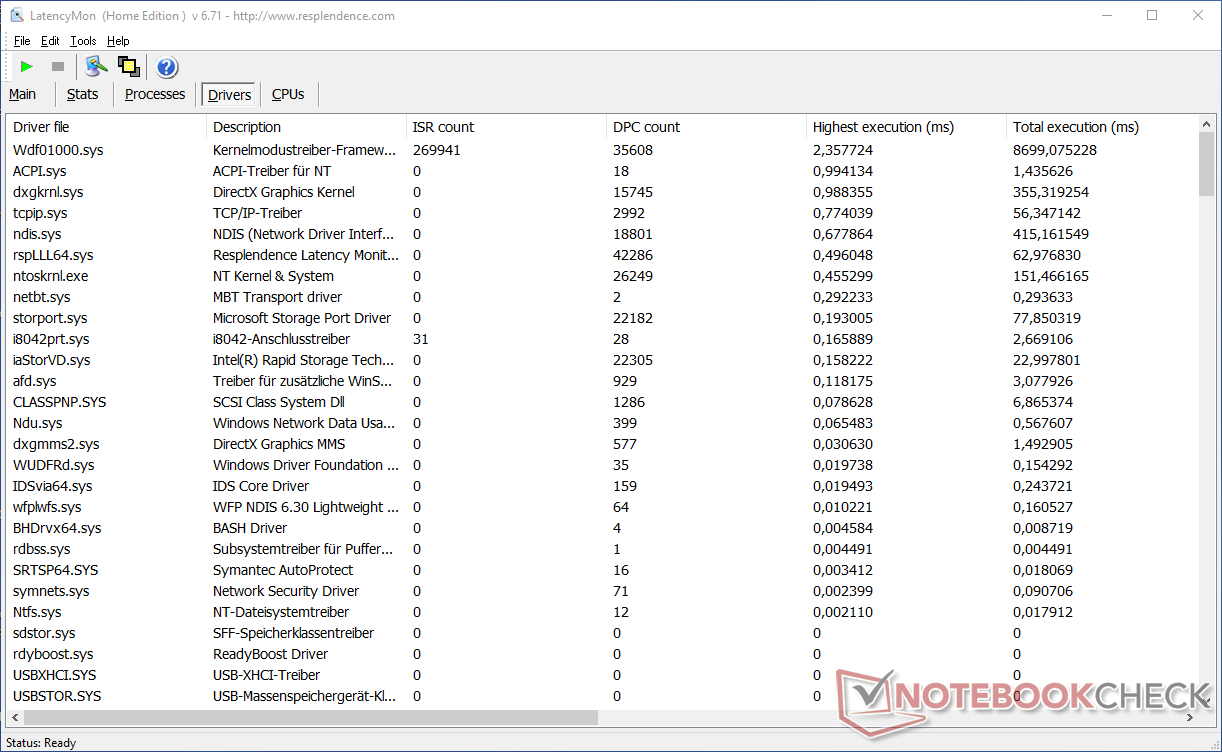
DPC latencies
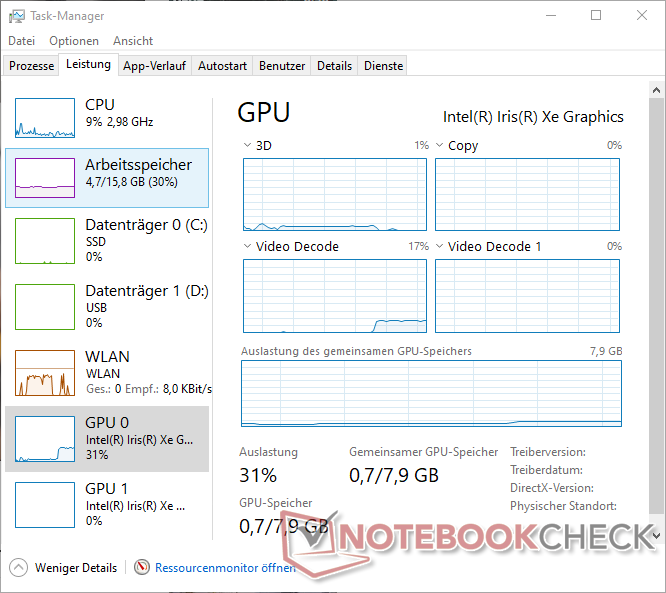
The measured DPC latency is relatively high and above most other competitors. This could indicate that the device is not ideal for real-time audio and the like. Nevertheless, this is still only a momentary impression. We weren't able to determine any issues in daily use. 4K streaming on YouTube worked smoothly and was handled by the iGPU.
| DPC Latencies / LatencyMon - interrupt to process latency (max), Web, Youtube, Prime95 | |
| Asus Vivobook 15 K513EQ | |
| Acer Swift 3X SF314-510G-70DW | |
| Lenovo ThinkPad L14 G2 AMD | |
| MSI Modern 14 B11SB-085 | |
| Acer Swift 5 SF514-55T-58DN | |
| Acer Swift 3 SF316-51 | |
| Dell Inspiron 15 7000 7506 2-in-1 Black Edition | |
* ... smaller is better
Storage
The manufacturer didn't do itself any big favors with the choice of the SSD. It offers a lot of storage space with its 1 TB capacity in our current configuration. However, it's certainly not the fastest, and is usually found in the lower half, sometimes at the very bottom of our comparison field, in the various SSD performance tests.

* ... smaller is better
Continuous load read: DiskSpd Read Loop, Queue Depth 8
Graphics card
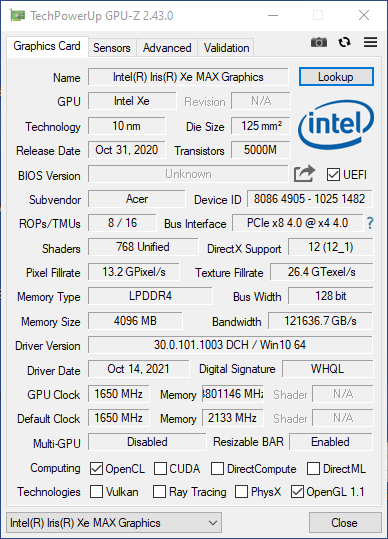
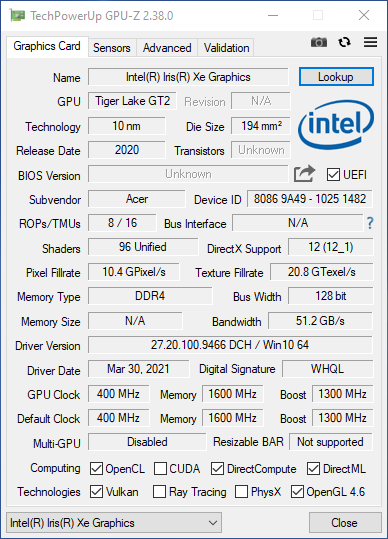
Two graphics units are used in the Acer Swift 3X. The Intel Iris Xe G7 (96 EUs) graphics unit that's integrated into the processor handles the work under low load. However, the more powerful Intel Iris Xe MAX takes over for more demanding tasks like gaming.
This is a dedicated PCIe 4.0 graphics card for laptops with 96 EUs based on the Gen 12 architecture (Xe). Not only does it offer a higher clock rate compared to the iGPU (1.65 GHz vs. 1.3 GHz), but it's also equipped with 4 GB of LPDDR4x graphics memory.
In the benchmarks, the Swift 3X ranks among the frontrunners in the various versions of 3DMark. It's only occasionally beaten by the MSI Modern 14 with the GeForce MX450, but it always lands in front of the Dell Inspiron 15 7000 equipped with the same GPU.
Overall, the test candidate always delivers a good performance that is above the GPU average here, which means that Acer manages to utilize the potential of the dedicated graphics solution. We measured just under 7% less performance on battery power.
| 3DMark 11 Performance | 8594 points | |
| 3DMark Cloud Gate Standard Score | 21799 points | |
| 3DMark Fire Strike Score | 5739 points | |
| 3DMark Time Spy Score | 1939 points | |
Help | ||
Gaming performance
Thanks to its dedicated graphics solution, the Acer Swift 3X delivers a decent gaming performance for a multimedia device in our tests. Most of the games that we tested can be played smoothly at medium quality levels. In some cases, solid frame rates of around 30 fps or higher can even be achieved using high graphics settings.
In The Witcher 3, the device usually takes the top spot among our comparison field and performs better than the MSI Modern 14 equipped with the same CPU and GeForce MX450 in three out of four graphics levels. It beats the Dell Inspiron 15 based on the same CPU and GPU by a long margin, meaning that Acer exploits the available potential considerably better.
Furthermore, performance in the graphics stress test remains nearly constant at 98.4%. Consequently, the Acer Swift 3X is also suitable for the occasional gaming session, but naturally, it can't keep up with proper gaming laptops. The frame rates measured on battery power were about 10% lower the ones observed with the power adapter plugged in.
With a frame rate of just under 20 fps in The Witcher 3's Ultra mode, the title is no longer smoothly playable at this graphics level. However, the frame rate remains constant over time and shows no upwards or downwards spikes.
The Witcher 3 FPS diagram
| low | med. | high | ultra | |
| GTA V (2015) | 99.1 | 90.9 | 30.9 | 13.2 |
| The Witcher 3 (2015) | 107.9 | 66.9 | 34.8 | 18.5 |
| Dota 2 Reborn (2015) | 70.1 | 81.6 | 51.3 | 46.6 |
| Rise of the Tomb Raider (2016) | 68.2 | 38.3 | 25.4 | 20.8 |
| Final Fantasy XV Benchmark (2018) | 26.2 | 18.2 | ||
| X-Plane 11.11 (2018) | 39.8 | 34.9 | 28.9 | |
| Strange Brigade (2018) | 98.4 | 41.2 | 33.6 | 28.9 |
| Dirt 5 (2020) | 39.5 | 18.7 | 15.2 | 11.4 |
| Monster Hunter Stories 2 (2021) | 55.8 | 58 | 52.5 |
Emissions: Windows laptop with pleasant fan and speakers
Noise emissions
The Acer Swift 3X isn't audible in idle because the fan is inactive. When the device is stressed, the fan revs up to a noise level of 44 dB(A). On the one hand, other laptops with a similar configuration have been considerably louder in our test. Also, the fan never pulse so that the Swift 3X never gets unpleasantly loud or dominates the foreground. We didn't experience any other noise in the test.
Noise Level
| Idle |
| 25 / 25 / 25 dB(A) |
| Load |
| 44.2 / 44.2 dB(A) |
 | ||
30 dB silent 40 dB(A) audible 50 dB(A) loud |
||
min: | ||
| Acer Swift 3X SF314-510G-70DW Xe MAX, i7-1165G7, Micron 2210 MTFDHBA1T0QFD | Asus Vivobook 15 K513EQ GeForce MX350, i7-1165G7, Intel SSD 660p SSDPEKNW512G8 | Dell Inspiron 15 7000 7506 2-in-1 Black Edition Xe MAX, i7-1165G7, Micron 2300 1TB MTFDHBA1T0TDV | Lenovo ThinkPad L14 G2 AMD Vega 8, R7 PRO 5850U, WDC PC SN730 SDBQNTY-512GB | Acer Swift 3 SF316-51 Iris Xe G7 96EUs, i7-11370H, Micron 2210 MTFDHBA512QFD | Acer Swift 5 SF514-55T-58DN Iris Xe G7 80EUs, i5-1135G7, SK Hynix BC511 HFM512GDJTNI | MSI Modern 14 B11SB-085 GeForce MX450, i7-1165G7, Kingston OM8PCP3512F-AB | |
|---|---|---|---|---|---|---|---|
| Noise | 4% | -8% | 9% | 3% | 7% | -7% | |
| off / environment * | 25 | 23.4 6% | 27.3 -9% | 25.08 -0% | 26 -4% | 25 -0% | 26 -4% |
| Idle Minimum * | 25 | 23.6 6% | 27.3 -9% | 25.08 -0% | 26 -4% | 25 -0% | 26 -4% |
| Idle Average * | 25 | 23.6 6% | 27.3 -9% | 25.08 -0% | 26 -4% | 25 -0% | 26 -4% |
| Idle Maximum * | 25 | 23.6 6% | 27.3 -9% | 25.08 -0% | 27.7 -11% | 25 -0% | 26 -4% |
| Load Average * | 44.2 | 41 7% | 47.4 -7% | 26.81 39% | 32.7 26% | 34.7 21% | 46.3 -5% |
| Load Maximum * | 44.2 | 47 -6% | 47.5 -7% | 37.99 14% | 39 12% | 34 23% | 52.9 -20% |
| Witcher 3 ultra * | 42.9 | 47.4 | 46.3 |
* ... smaller is better
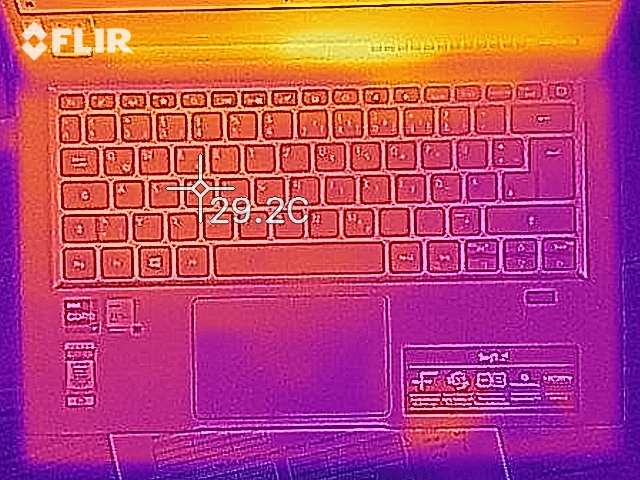
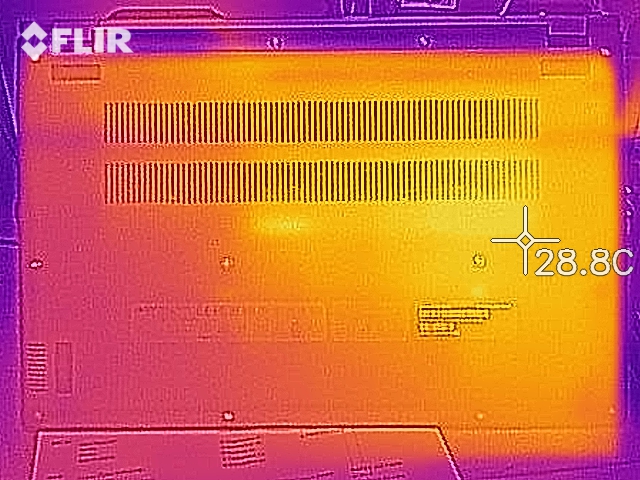
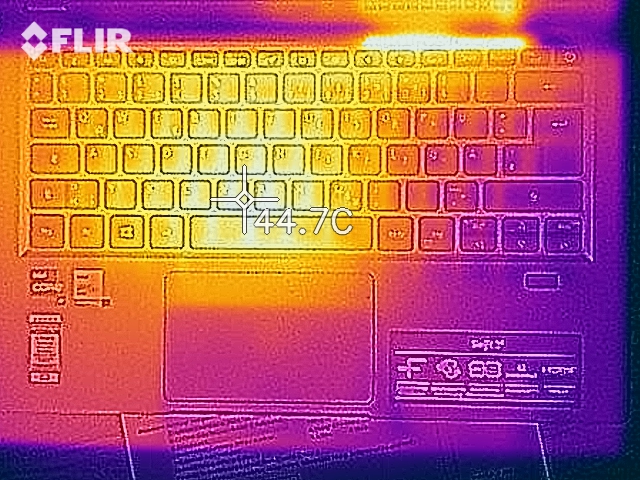
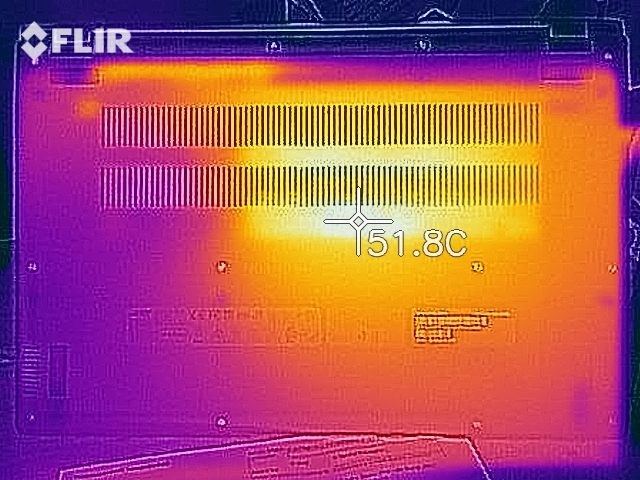
Temperature
As with noise levels, the review sample doesn't show any irregularities in terms of idle temperatures, and it barely heats up above room temperature. Under load, the area at the center in front of the screen heats up to 45 °C (~113 °F) on the bottom and 41 °C (~106 °F) on the top. This is slightly noticeable when using the keys at the top, but it's still far from being uncomfortably hot.
(±) The maximum temperature on the upper side is 40.8 °C / 105 F, compared to the average of 36.9 °C / 98 F, ranging from 21.1 to 71 °C for the class Multimedia.
(-) The bottom heats up to a maximum of 45.2 °C / 113 F, compared to the average of 39.1 °C / 102 F
(+) In idle usage, the average temperature for the upper side is 24.1 °C / 75 F, compared to the device average of 31.2 °C / 88 F.
(+) The palmrests and touchpad are cooler than skin temperature with a maximum of 31.8 °C / 89.2 F and are therefore cool to the touch.
(-) The average temperature of the palmrest area of similar devices was 28.8 °C / 83.8 F (-3 °C / -5.4 F).
| Acer Swift 3X SF314-510G-70DW Intel Core i7-1165G7, Intel Iris Xe MAX Graphics | Asus Vivobook 15 K513EQ Intel Core i7-1165G7, NVIDIA GeForce MX350 | Dell Inspiron 15 7000 7506 2-in-1 Black Edition Intel Core i7-1165G7, Intel Iris Xe MAX Graphics | Lenovo ThinkPad L14 G2 AMD AMD Ryzen 7 PRO 5850U, AMD Radeon RX Vega 8 (Ryzen 4000/5000) | Acer Swift 3 SF316-51 Intel Core i7-11370H, Intel Iris Xe Graphics G7 96EUs | Acer Swift 5 SF514-55T-58DN Intel Core i5-1135G7, Intel Iris Xe Graphics G7 80EUs | MSI Modern 14 B11SB-085 Intel Core i7-1165G7, NVIDIA GeForce MX450 | |
|---|---|---|---|---|---|---|---|
| Heat | -14% | -19% | -7% | -8% | 15% | -25% | |
| Maximum Upper Side * | 40.8 | 48.8 -20% | 43 -5% | 42.1 -3% | 40 2% | 34.5 15% | 55.6 -36% |
| Maximum Bottom * | 45.2 | 42 7% | 48.8 -8% | 45.2 -0% | 47 -4% | 35.4 22% | 67.8 -50% |
| Idle Upper Side * | 29.8 | 30 -1% | 31.6 -6% | 28.6 4% | 30.1 -1% | 23.8 20% | 28.3 5% |
| Idle Bottom * | 24.7 | 35 -42% | 38.6 -56% | 31.5 -28% | 31.6 -28% | 24 3% | 28.9 -17% |
* ... smaller is better
Stress test
The GPU and CPU are put under load for at least an hour during the stress test. After the usual initial peak, the CPU settles at a constant rate of around 1,500 MHz, which is well below the base clock speed, and at a good 60 °C (~140 °F). The dedicated GPU runs constantly at around 1,200 MHz and just below 80 °C (~176 °F).
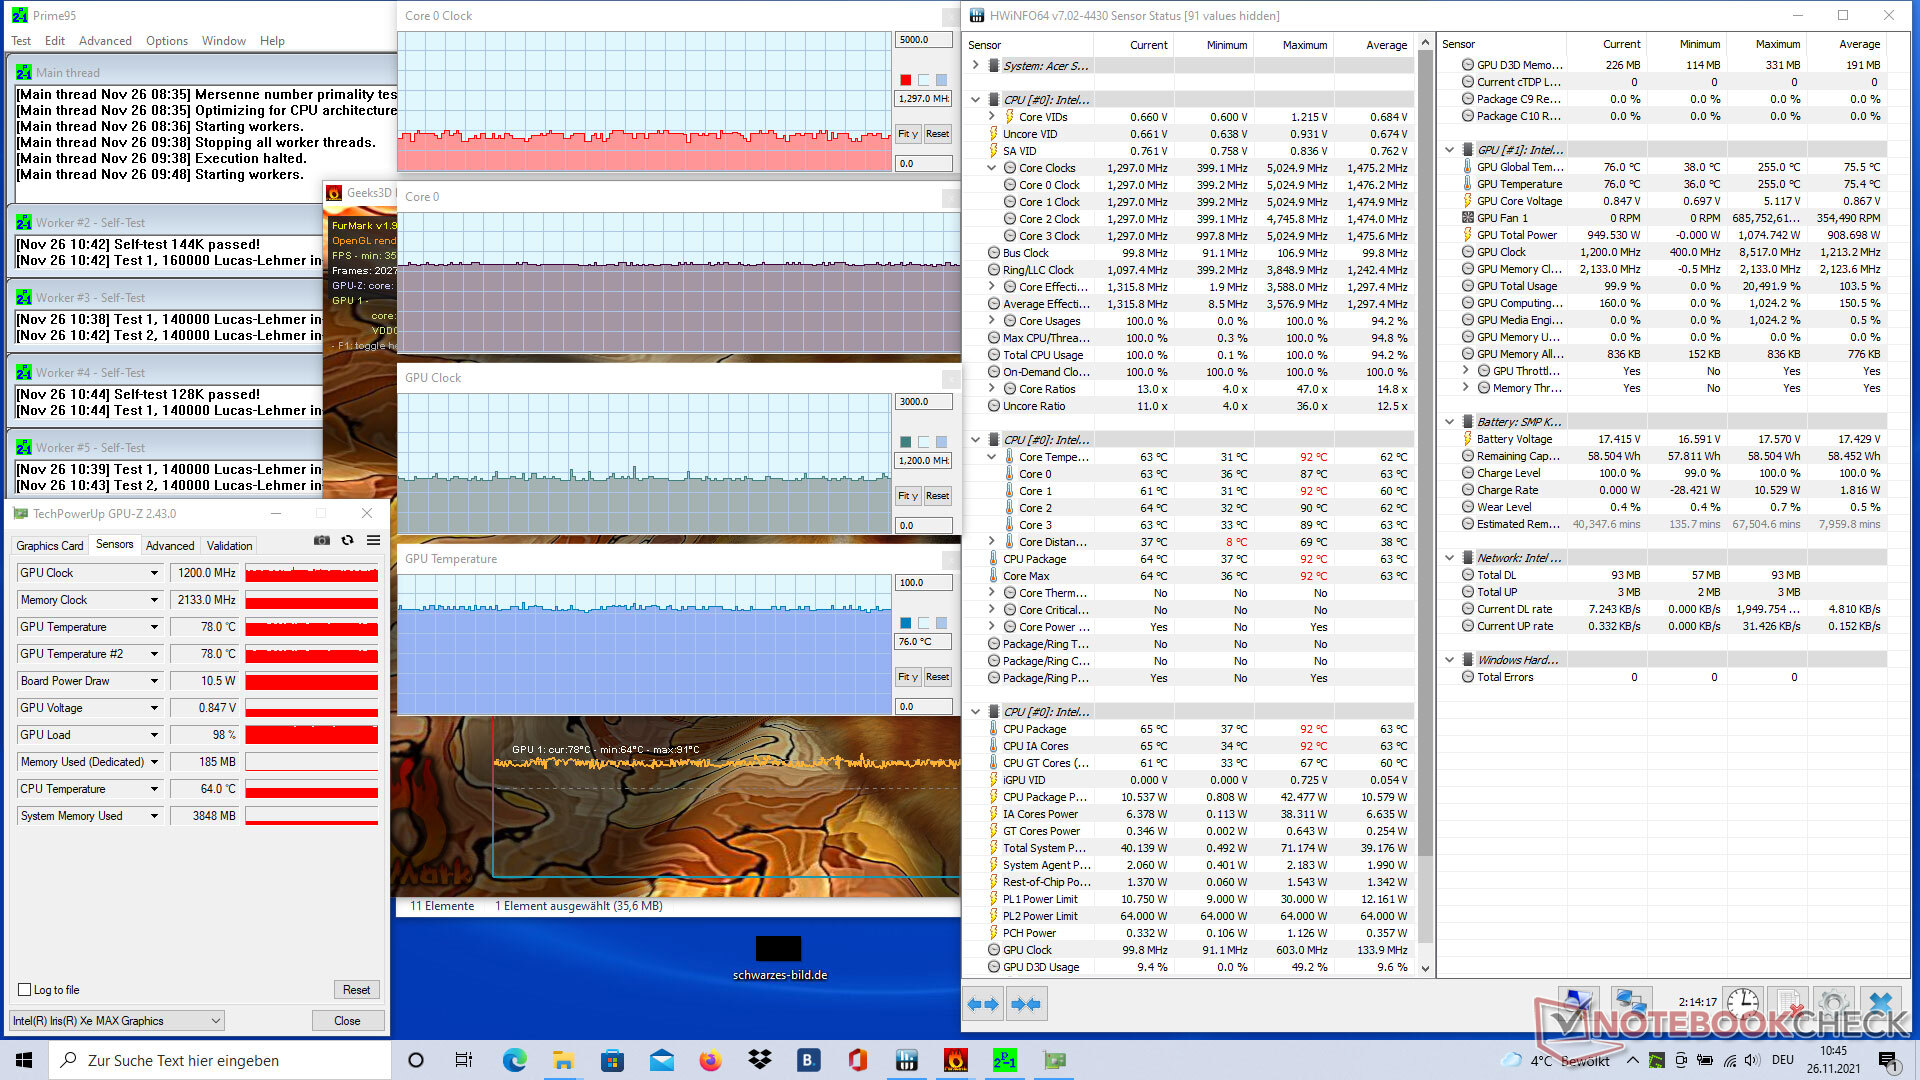
| CPU clock rate (GHz) | GPU clock rate (MHz) | Average CPU temperature (°C) | Average GPU temperature (°C) | |
| Idle system | 1.2 | 100 | 41 | 40 |
| Prime95 stress | 3.1 | 100 | 78 | 79 |
| Prime95 + FurMark stress | 1.5 | 1200 | 63 | 76 |
| The Witcher 3 stress | 3.7 | 1400 | 63 | 76 |
Speakers
The stereo speakers reproduce mids and highs solidly. However, there's a complete lack of bass, so that the sound reproduction is very shrill and thin. Furthermore, they are pretty quiet, even when turned up to full volume. They are sufficient for video calls. For gaming, music, etc., an external solution in the form of speakers or headphones via the 3.5 mm jack is advisable.
Acer Swift 3X SF314-510G-70DW audio analysis
(±) | speaker loudness is average but good (72 dB)
Bass 100 - 315 Hz
(-) | nearly no bass - on average 31.4% lower than median
(±) | linearity of bass is average (10.8% delta to prev. frequency)
Mids 400 - 2000 Hz
(+) | balanced mids - only 4.9% away from median
(+) | mids are linear (6.6% delta to prev. frequency)
Highs 2 - 16 kHz
(+) | balanced highs - only 4% away from median
(±) | linearity of highs is average (8.2% delta to prev. frequency)
Overall 100 - 16.000 Hz
(±) | linearity of overall sound is average (29.4% difference to median)
Compared to same class
» 94% of all tested devices in this class were better, 2% similar, 4% worse
» The best had a delta of 5%, average was 18%, worst was 45%
Compared to all devices tested
» 85% of all tested devices were better, 3% similar, 12% worse
» The best had a delta of 4%, average was 25%, worst was 134%
Apple MacBook 12 (Early 2016) 1.1 GHz audio analysis
(+) | speakers can play relatively loud (83.6 dB)
Bass 100 - 315 Hz
(±) | reduced bass - on average 11.3% lower than median
(±) | linearity of bass is average (14.2% delta to prev. frequency)
Mids 400 - 2000 Hz
(+) | balanced mids - only 2.4% away from median
(+) | mids are linear (5.5% delta to prev. frequency)
Highs 2 - 16 kHz
(+) | balanced highs - only 2% away from median
(+) | highs are linear (4.5% delta to prev. frequency)
Overall 100 - 16.000 Hz
(+) | overall sound is linear (10.2% difference to median)
Compared to same class
» 5% of all tested devices in this class were better, 2% similar, 93% worse
» The best had a delta of 5%, average was 19%, worst was 53%
Compared to all devices tested
» 3% of all tested devices were better, 1% similar, 96% worse
» The best had a delta of 4%, average was 25%, worst was 134%
Energy management: The Swift 3X offers almost 18 hours of endurance
Energy consumption
In terms of energy consumption, the Acer Swift 3X does well in the group with its 58 Wh battery. The remaining models with a dedicated graphics card all consume more energy, sometimes even considerably more. The Dell Inspiron 15 with the same CPU/GPU combination is particularly noticeable here. It consumes more than twice as much power in idle usage, but it also has a higher-resolution touchscreen.
As expected, the three contenders in the comparison field that are equipped with an onboard GPU consume slightly fewer watts. Our review sample consumes a maximum of 58 watts under load, so the 65-watt power adapter is of sufficient capacity.
During our The Witcher 3 test, power consumption settles at around 54 watts over time, but it regularly has short power peaks up to the 65-watt mark. During the stress test, the laptop consumes an average of 58 watts after an initial peak (about 68 watts).
| Off / Standby | |
| Idle | |
| Load |
|
| Acer Swift 3X SF314-510G-70DW i7-1165G7, Xe MAX, Micron 2210 MTFDHBA1T0QFD, IPS, 1920x1080, 14.00 | Asus Vivobook 15 K513EQ i7-1165G7, GeForce MX350, Intel SSD 660p SSDPEKNW512G8, OLED, 1920x1080, 15.60 | Dell Inspiron 15 7000 7506 2-in-1 Black Edition i7-1165G7, Xe MAX, Micron 2300 1TB MTFDHBA1T0TDV, IPS, 3840x2160, 15.60 | Lenovo ThinkPad L14 G2 AMD R7 PRO 5850U, Vega 8, WDC PC SN730 SDBQNTY-512GB, IPS LED, 1920x1080, 14.00 | Acer Swift 3 SF316-51 i7-11370H, Iris Xe G7 96EUs, Micron 2210 MTFDHBA512QFD, IPS, 1920x1080, 16.10 | Acer Swift 5 SF514-55T-58DN i5-1135G7, Iris Xe G7 80EUs, SK Hynix BC511 HFM512GDJTNI, IPS, 1920x1080, 14.00 | MSI Modern 14 B11SB-085 i7-1165G7, GeForce MX450, Kingston OM8PCP3512F-AB, IPS, 1920x1080, 14.00 | Average Intel Iris Xe MAX Graphics | Average of class Multimedia | |
|---|---|---|---|---|---|---|---|---|---|
| Power Consumption | -3% | -44% | 7% | 7% | 23% | -14% | -41% | -77% | |
| Idle Minimum * | 3.6 | 3.7 -3% | 4 -11% | 5.44 -51% | 4.8 -33% | 2.4 33% | 3 17% | 5.4 ? -50% | 7.29 ? -103% |
| Idle Average * | 6.2 | 6.3 -2% | 15.5 -150% | 8.06 -30% | 7.4 -19% | 3.5 44% | 6.3 -2% | 10.4 ? -68% | 11.8 ? -90% |
| Idle Maximum * | 10.4 | 9.7 7% | 16.2 -56% | 9.4 10% | 9 13% | 6.6 37% | 10.3 1% | 17.5 ? -68% | 14.6 ? -40% |
| Load Average * | 55.1 | 59 -7% | 49.7 10% | 36.06 35% | 34.9 37% | 47 15% | 66 -20% | 50.6 ? 8% | 77.7 ? -41% |
| Witcher 3 ultra * | 54.1 | 51.4 5% | 52.2 4% | 26.1 52% | 34.9 35% | 66.6 -23% | |||
| Load Maximum * | 58 | 67.7 -17% | 92.7 -60% | 42.26 27% | 51.4 11% | 67.2 -16% | 90.6 -56% | 73.4 ? -27% | 121 ? -109% |
* ... smaller is better
Energy consumption during The Witcher 3 test / stress test
Battery life
The low consumption, especially under low load, and the relatively large 58 Wh battery lead to impressive battery runtimes. The Swift 3X outperforms the competition by 30% to 60%.
The device lasts almost 18 hours in our video test, and a good 12:30 hours in the Wi-Fi browsing test. Even under load, the device only runs out of energy after almost 4 hours. This is also due to the fact that the laptop uses the CPU's onboard GPU (Intel Iris Xe Graphics) when there are no demanding graphics calculations.
| Acer Swift 3X SF314-510G-70DW i7-1165G7, Xe MAX, 58 Wh | Asus Vivobook 15 K513EQ i7-1165G7, GeForce MX350, 42 Wh | Dell Inspiron 15 7000 7506 2-in-1 Black Edition i7-1165G7, Xe MAX, 68 Wh | Lenovo ThinkPad L14 G2 AMD R7 PRO 5850U, Vega 8, 45 Wh | Acer Swift 3 SF316-51 i7-11370H, Iris Xe G7 96EUs, 56 Wh | Acer Swift 5 SF514-55T-58DN i5-1135G7, Iris Xe G7 80EUs, 56 Wh | MSI Modern 14 B11SB-085 i7-1165G7, GeForce MX450, 52.4 Wh | Average of class Multimedia | |
|---|---|---|---|---|---|---|---|---|
| Battery Runtime | -60% | -41% | -51% | -40% | -27% | -32% | -39% | |
| H.264 | 1067 | 574 -46% | 615 -42% | 710 ? -33% | ||||
| WiFi v1.3 | 764 | 361 -53% | 583 -24% | 469 -39% | 585 -23% | 794 4% | 523 -32% | 572 ? -25% |
| Load | 230 | 78 -66% | 98 -57% | 77 -67% | 103 -55% | 96 -58% | 97.7 ? -58% | |
| Reader / Idle | 799 | 1498 | 1205 | 933 ? | ||||
| Witcher 3 ultra | 130 | 81.8 ? |
Pros
Cons
Verdict: The Acer Swift 3X impresses in the test with its performance and endurance

The Acer Swift 3X SF314-510G-70DW delivers good performance in many aspects in our test.
The combination of onboard and dedicated graphics achieves good battery runtimes of up to 18 hours while still delivering decent gaming performance. As a result, the device can be used for work and multimedia, and even occasional games can also be played at a solid graphics quality.
The device's performance earns it good points in the test, just like the case, keyboard, and display. A slightly better setup in terms of ports would have provided for an even better overall result in the end.
All in all, the Acer Swift 3X with the model number SF314-510G-70DW leaves a good impression in our review with only a few points of criticism. When it comes to performance, this CPU configuration won't be easily beaten. In addition, the device is pleasantly light and quiet. Users looking for an even more portable laptop should consider the less powerful Acer Swift 5 SF514-55T-58DN. The Acer Swift 3 SF316-51 offers even better performance.
Price and availability
Acer Swift 3X SF314-510G-70DW
-
12/08/2021 v7
Marcus Schwarten


Pricecompare

