 Deutsch
 English
 Español
 Français
 Italiano
 Nederlands
 Polski
 Português
 Русский
 Türkçe
 Svenska
 Chinese
 Magyar
Acer Nitro 5 AN515-55 Laptop Review - Price-to-performance champ with an RTX 3060
The Acer Nitro 5 AN515-55 is the latest laptop in Acer’s Nitro 5 series, which consists of low-priced notebooks that aim to cover the basics. Our review device comes with the GeForce RTX 3060, which is one of Nvidia’s latest GPUs. The Nitro 5 is supposed to offer a relatively high level of performance at a reasonable power draw. Our review device is very similar to the Acer Nitro 5 AN515-44, which is why we did not provide a detailed description of the case and the ports. You can find all the relevant information in our review of the predecessor model.
Likely Competitors
Rating | Date | Model | Weight | Height | Size | Resolution | Best Price |
|---|---|---|---|---|---|---|---|
| 80.5 % | 05/2021 | Acer Aspire Nitro 5 AN515-55-57GF i5-10300H, GeForce RTX 3060 Laptop GPU | 2.3 kg | 23.9 mm | 15.60" | 1920x1080 | |
| 80.4 % | 03/2021 | MSI GF65 Thin 10UE i7-10750H, GeForce RTX 3060 Laptop GPU | 1.9 kg | 21.7 mm | 15.60" | 1920x1080 | |
| 82.8 % | 01/2021 | HP Omen 15-en0375ng R7 4800H, GeForce RTX 2060 Mobile | 2.2 kg | 23 mm | 15.60" | 1920x1080 | |
| 84.9 % | 03/2021 | SCHENKER XMG Core 15 Ampere R7 4800H, GeForce RTX 3060 Laptop GPU | 2 kg | 22.9 mm | 15.60" | 2560x1440 | |
| 82.4 % | 02/2021 | Asus TUF Dash F15 FX516PR i7-11370H, GeForce RTX 3070 Laptop GPU | 2 kg | 20 mm | 15.60" | 1920x1080 | |
| 79.8 % | 06/2020 | Acer Nitro 5 AN515-44-R5FT R5 4600H, GeForce GTX 1650 Ti Mobile | 2.2 kg | 24 mm | 15.60" | 1920x1080 |
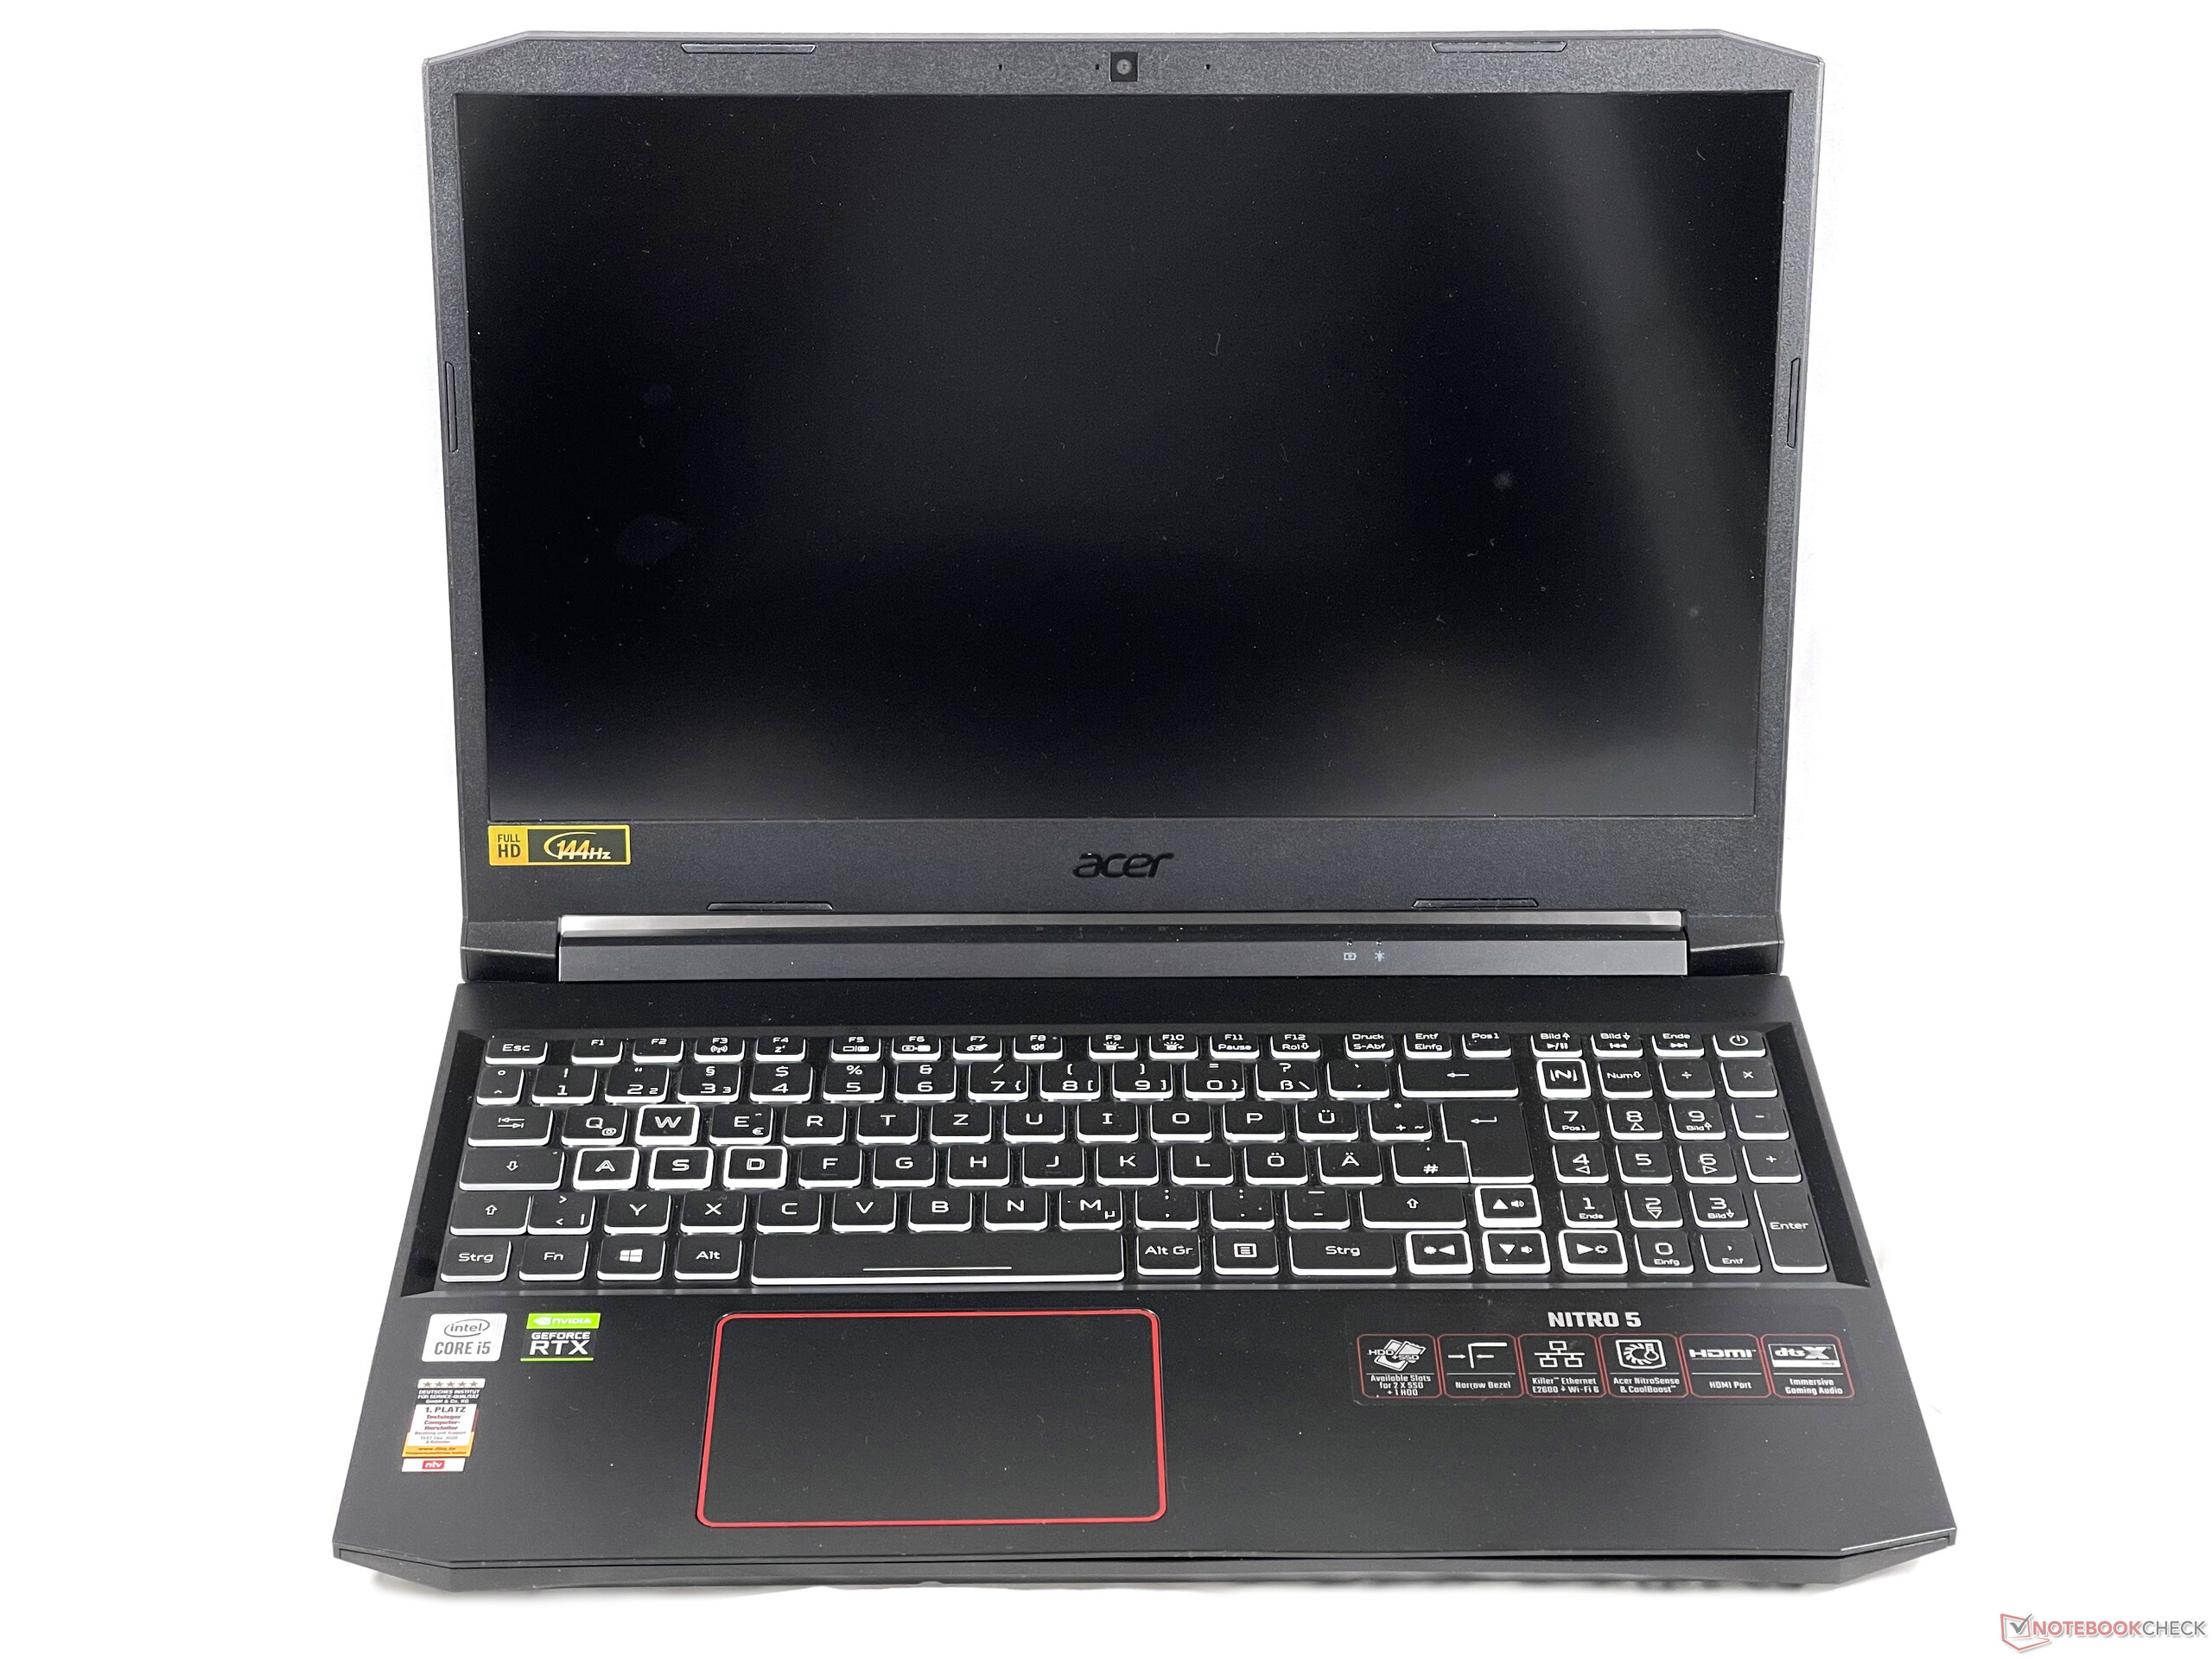
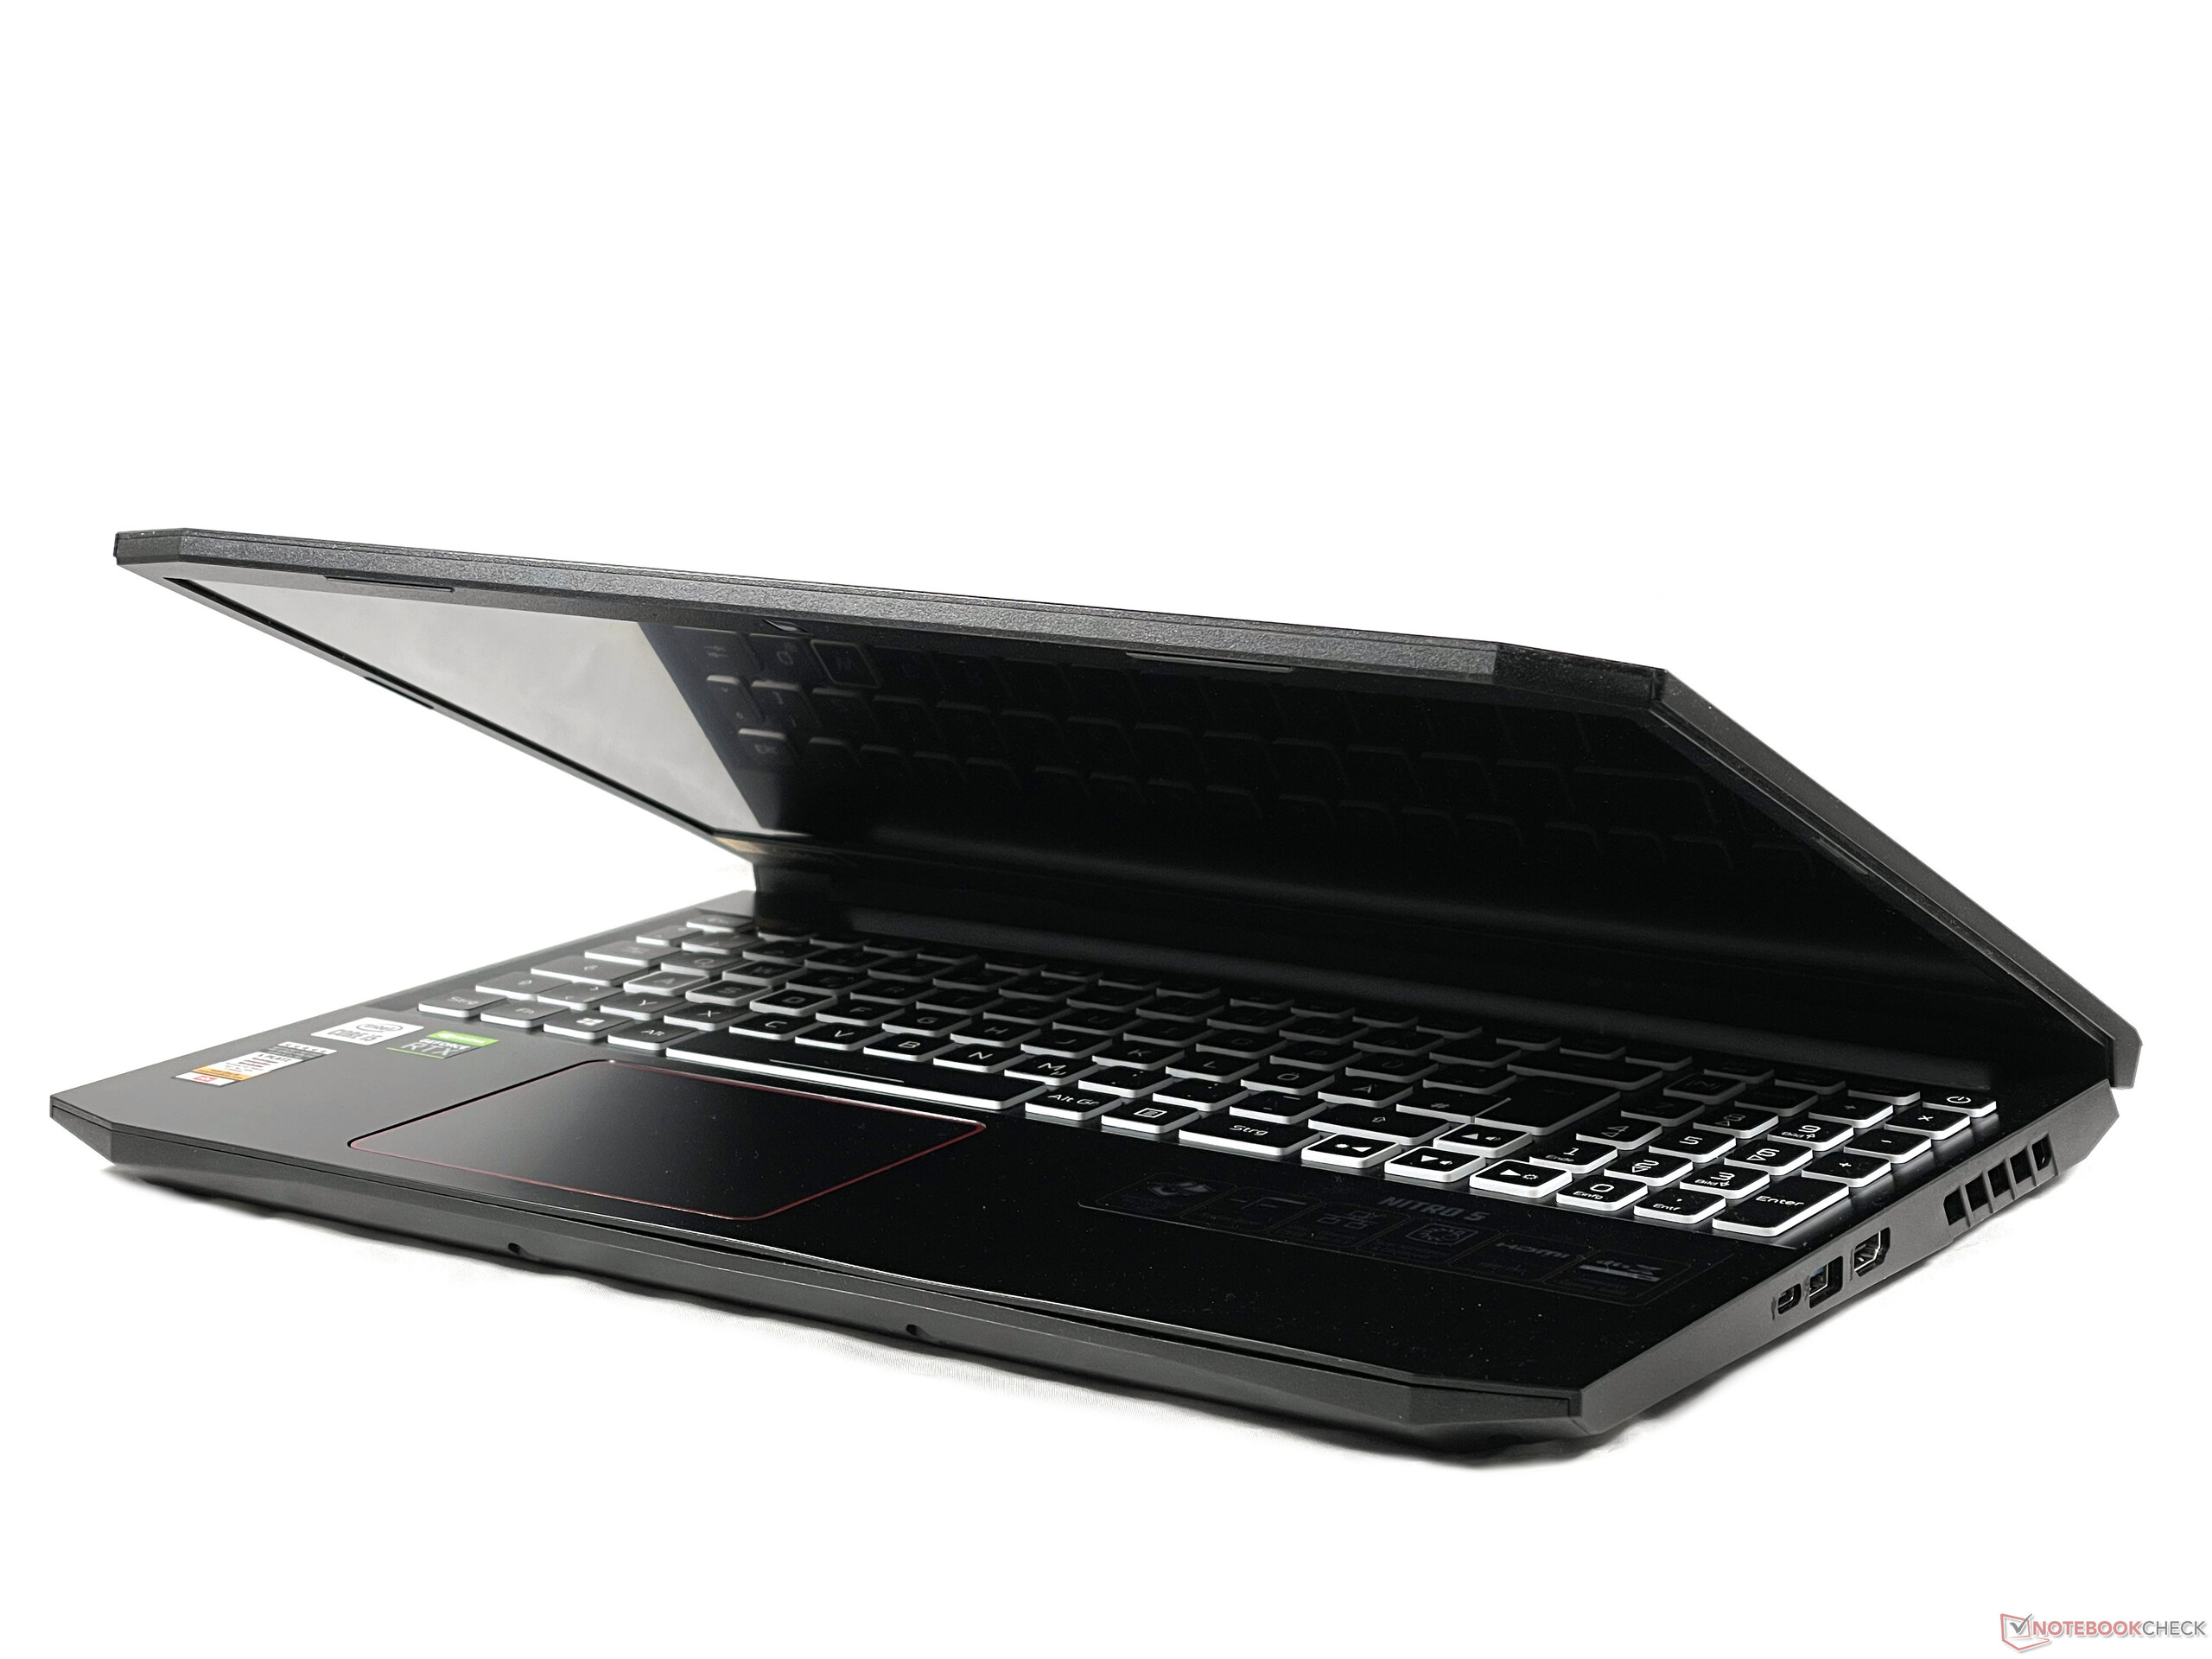
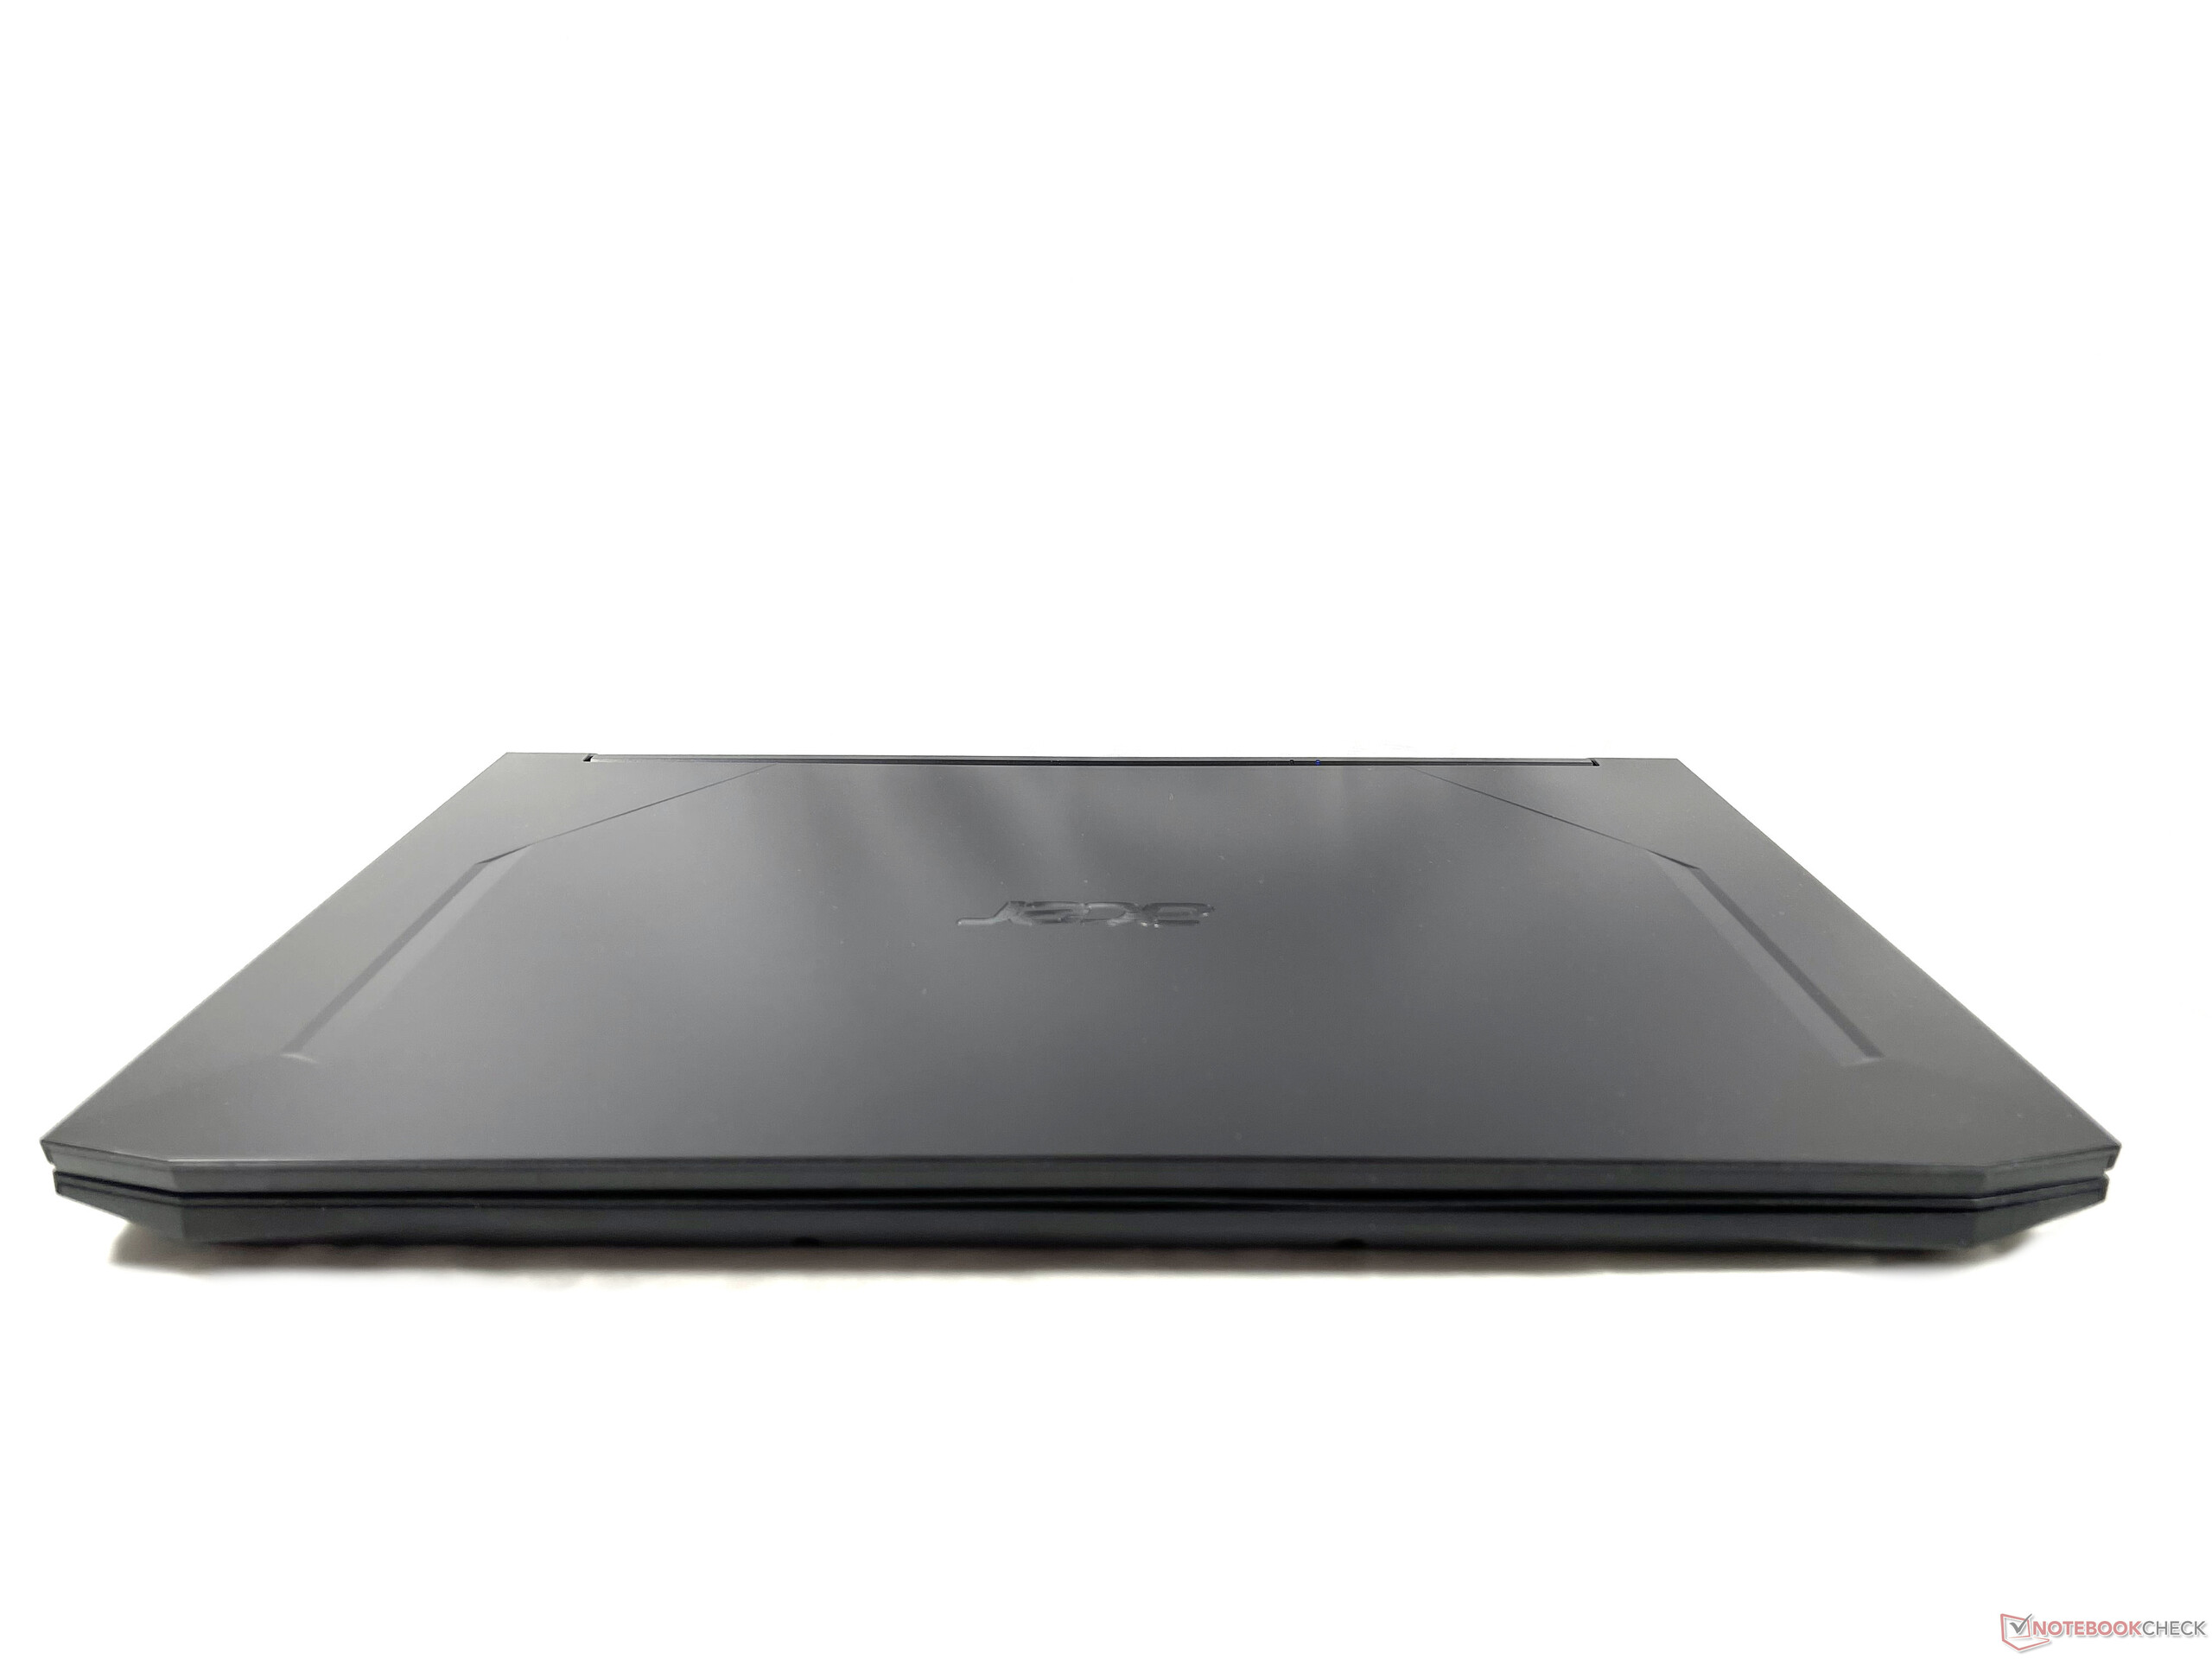
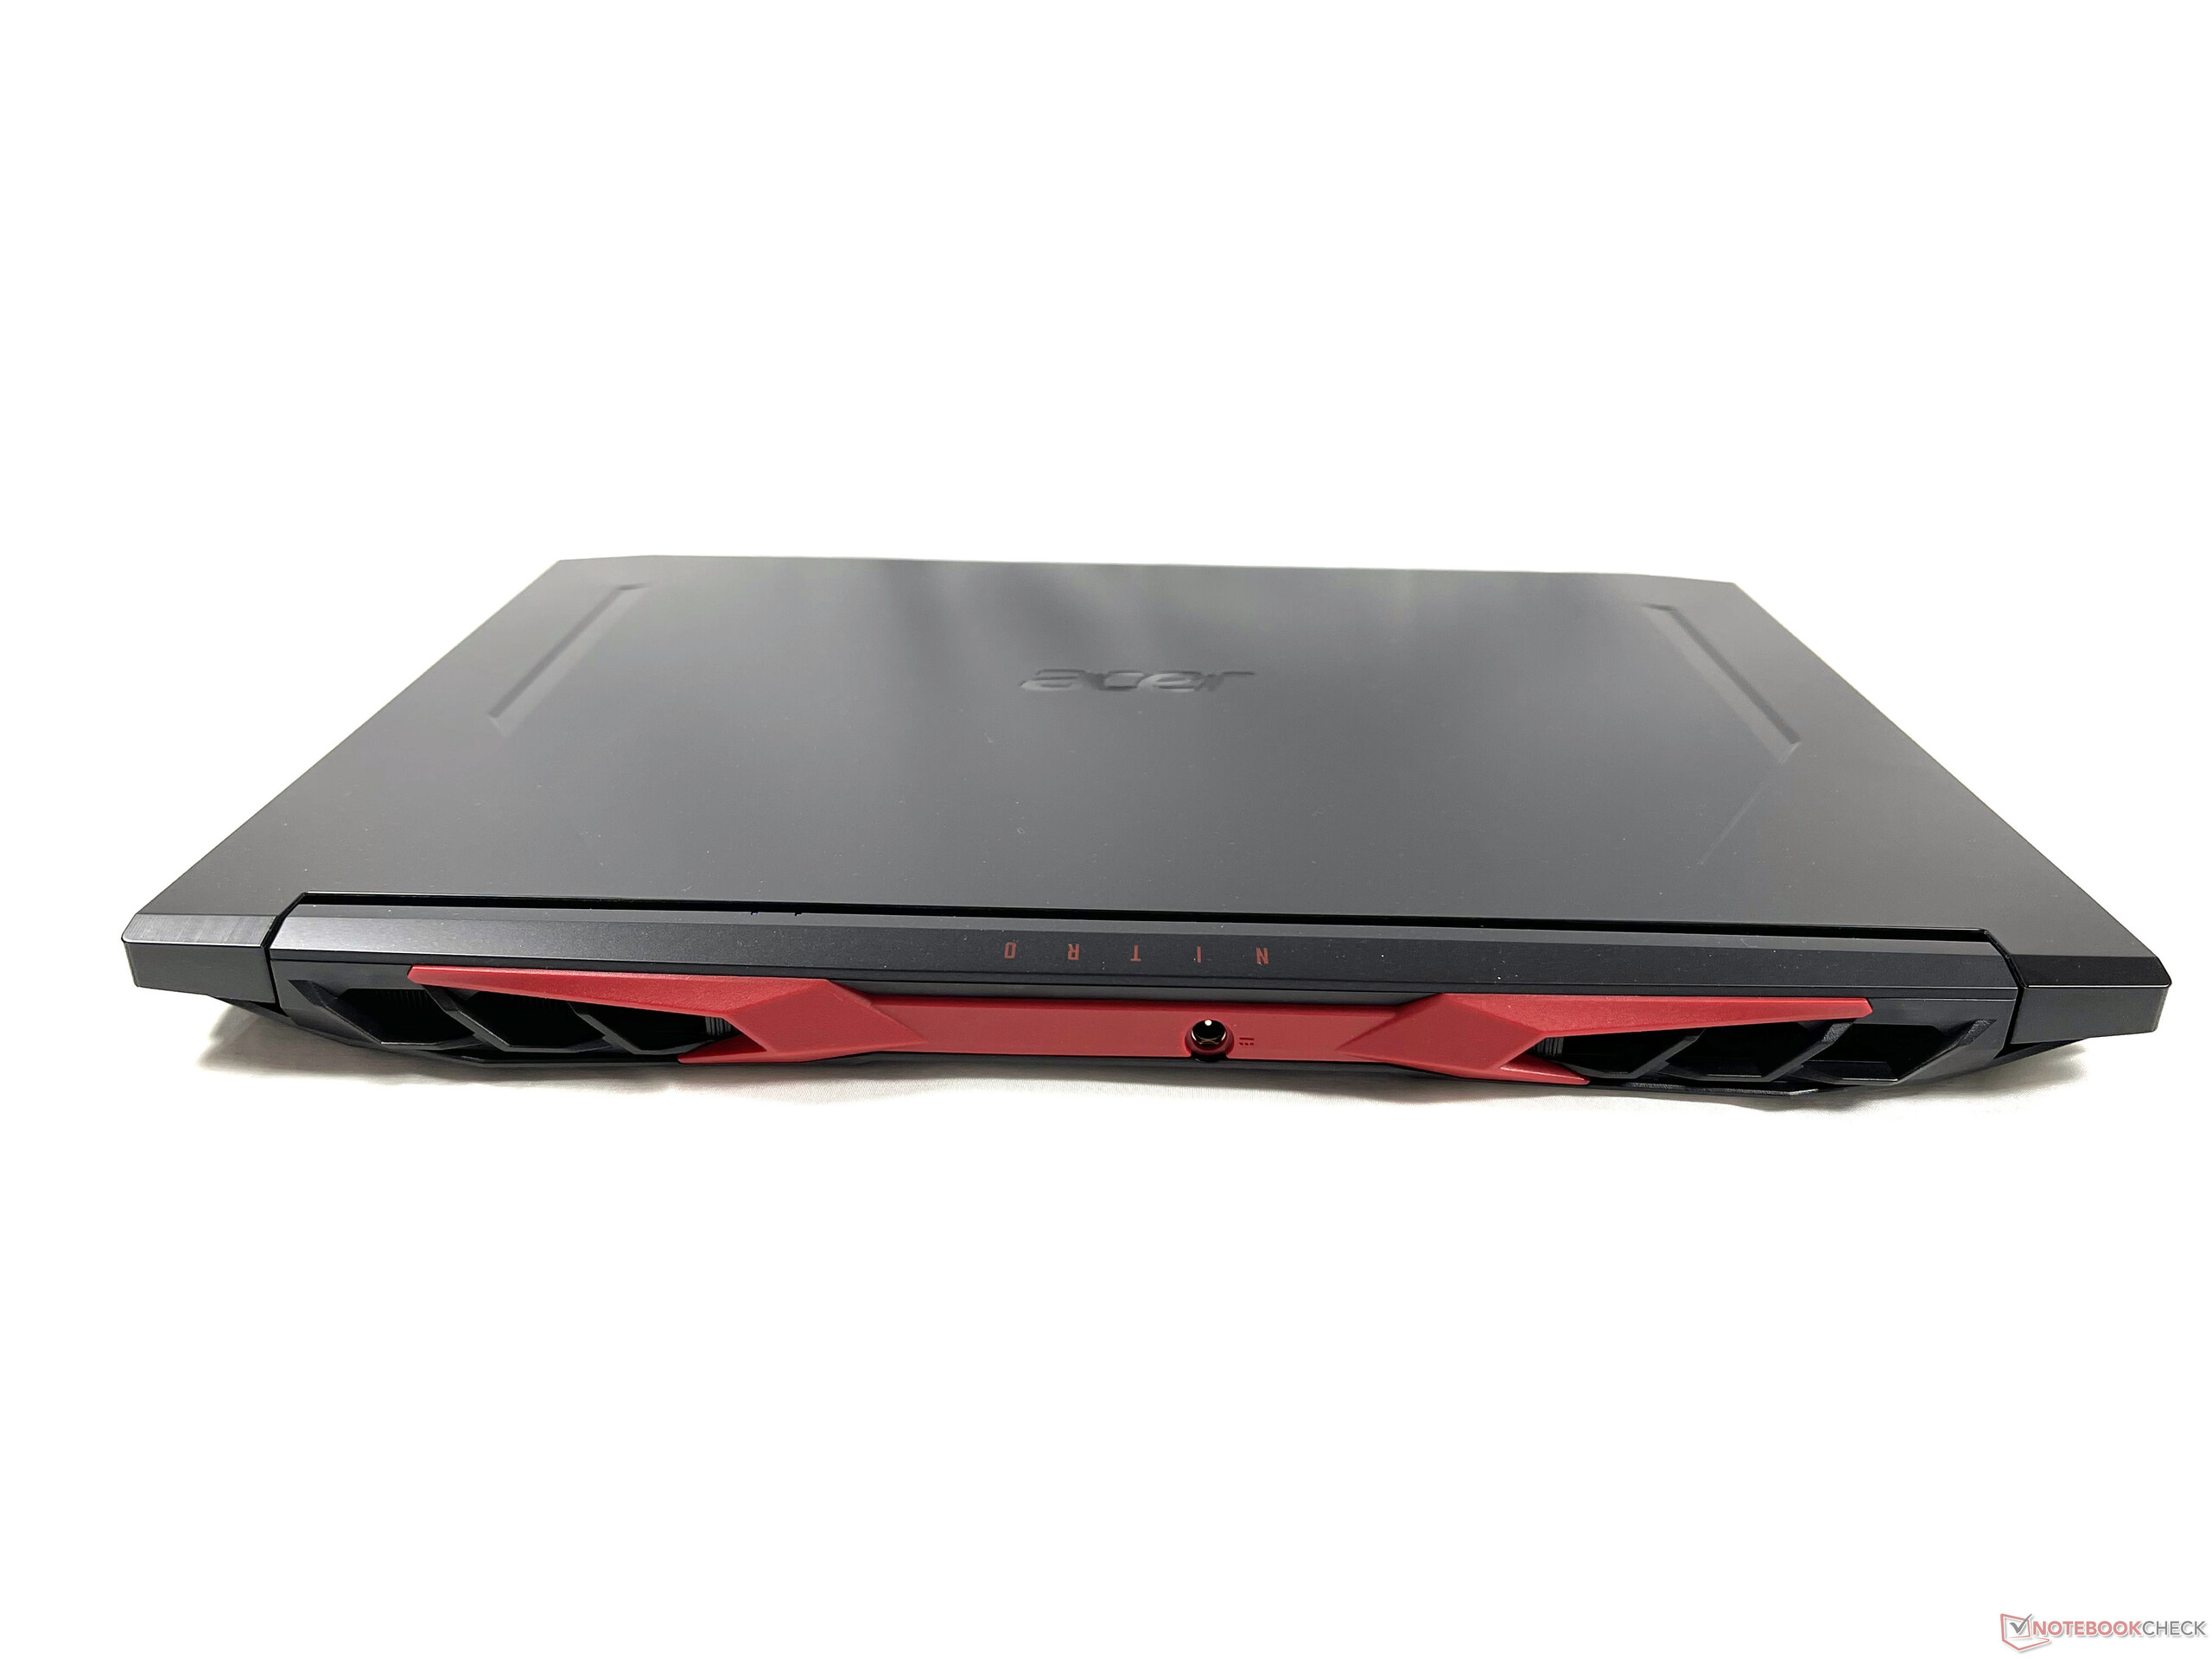
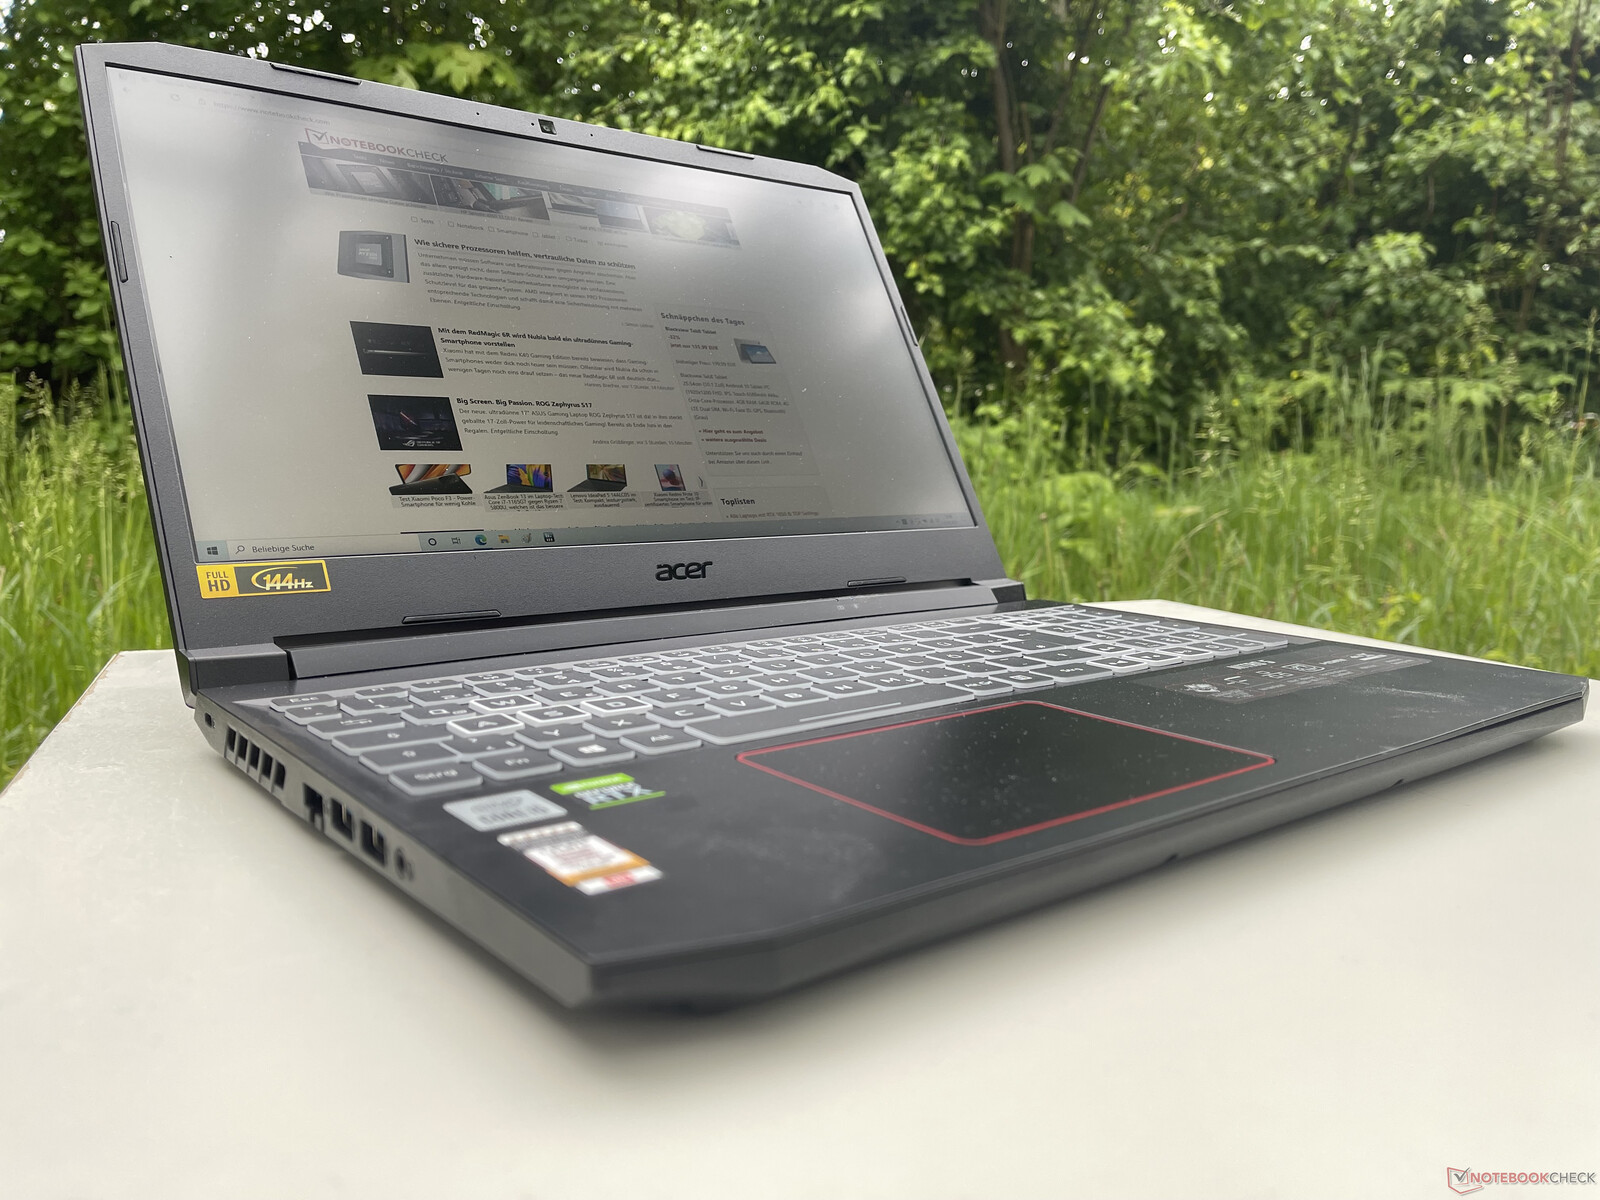
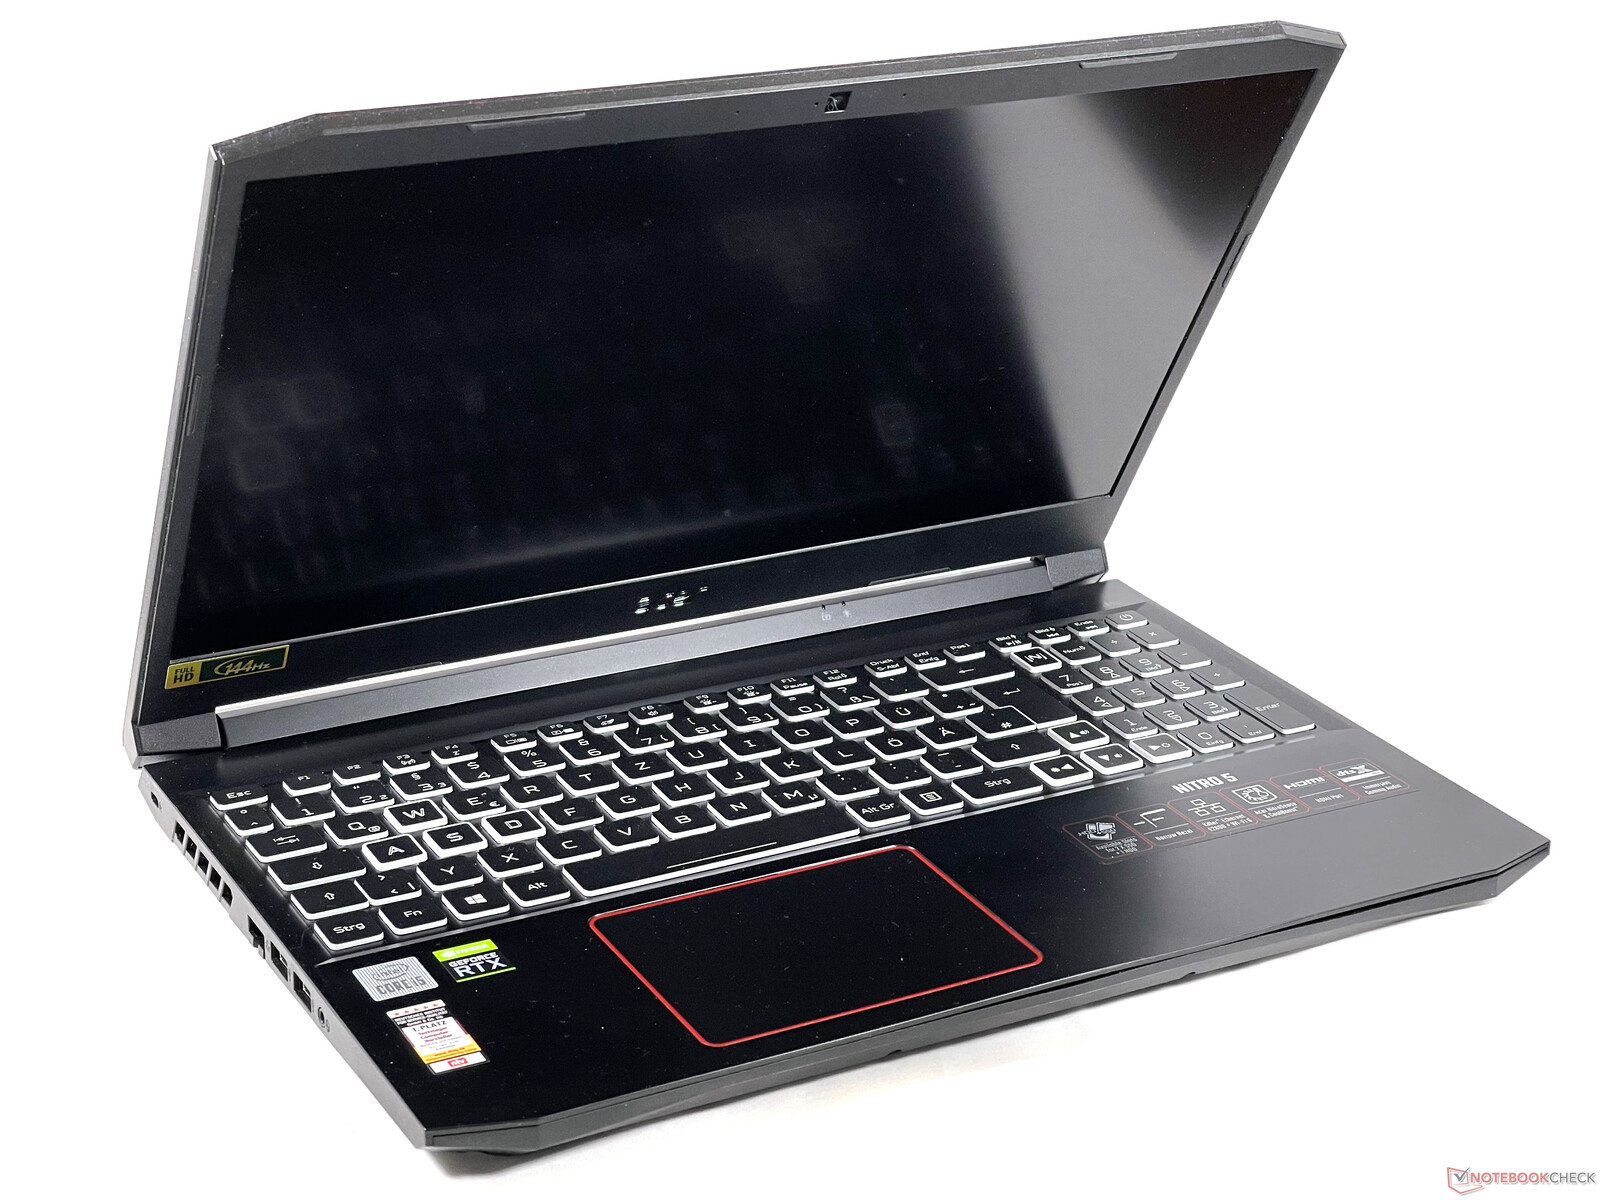
Case - Restrained gaming laptop
The design of the 15.6-inch Nitro 5 AN515-55 has not changed much when compared to the predecessor model. The laptop is still made of matte black plastic. The colour accents are also still here. Because the keys now have a white accent instead of a red one, the Nitro 5 looks less flashy. The angular design, the red colour accent around the touchpad and the red plastic "inserts' are all vestiges of what used to be considered cool in the gaming laptop world. The build quality is on a good level. The chassis is quite stiff. However, the display lid and the keyboard deck exhibit a small amount of flex.
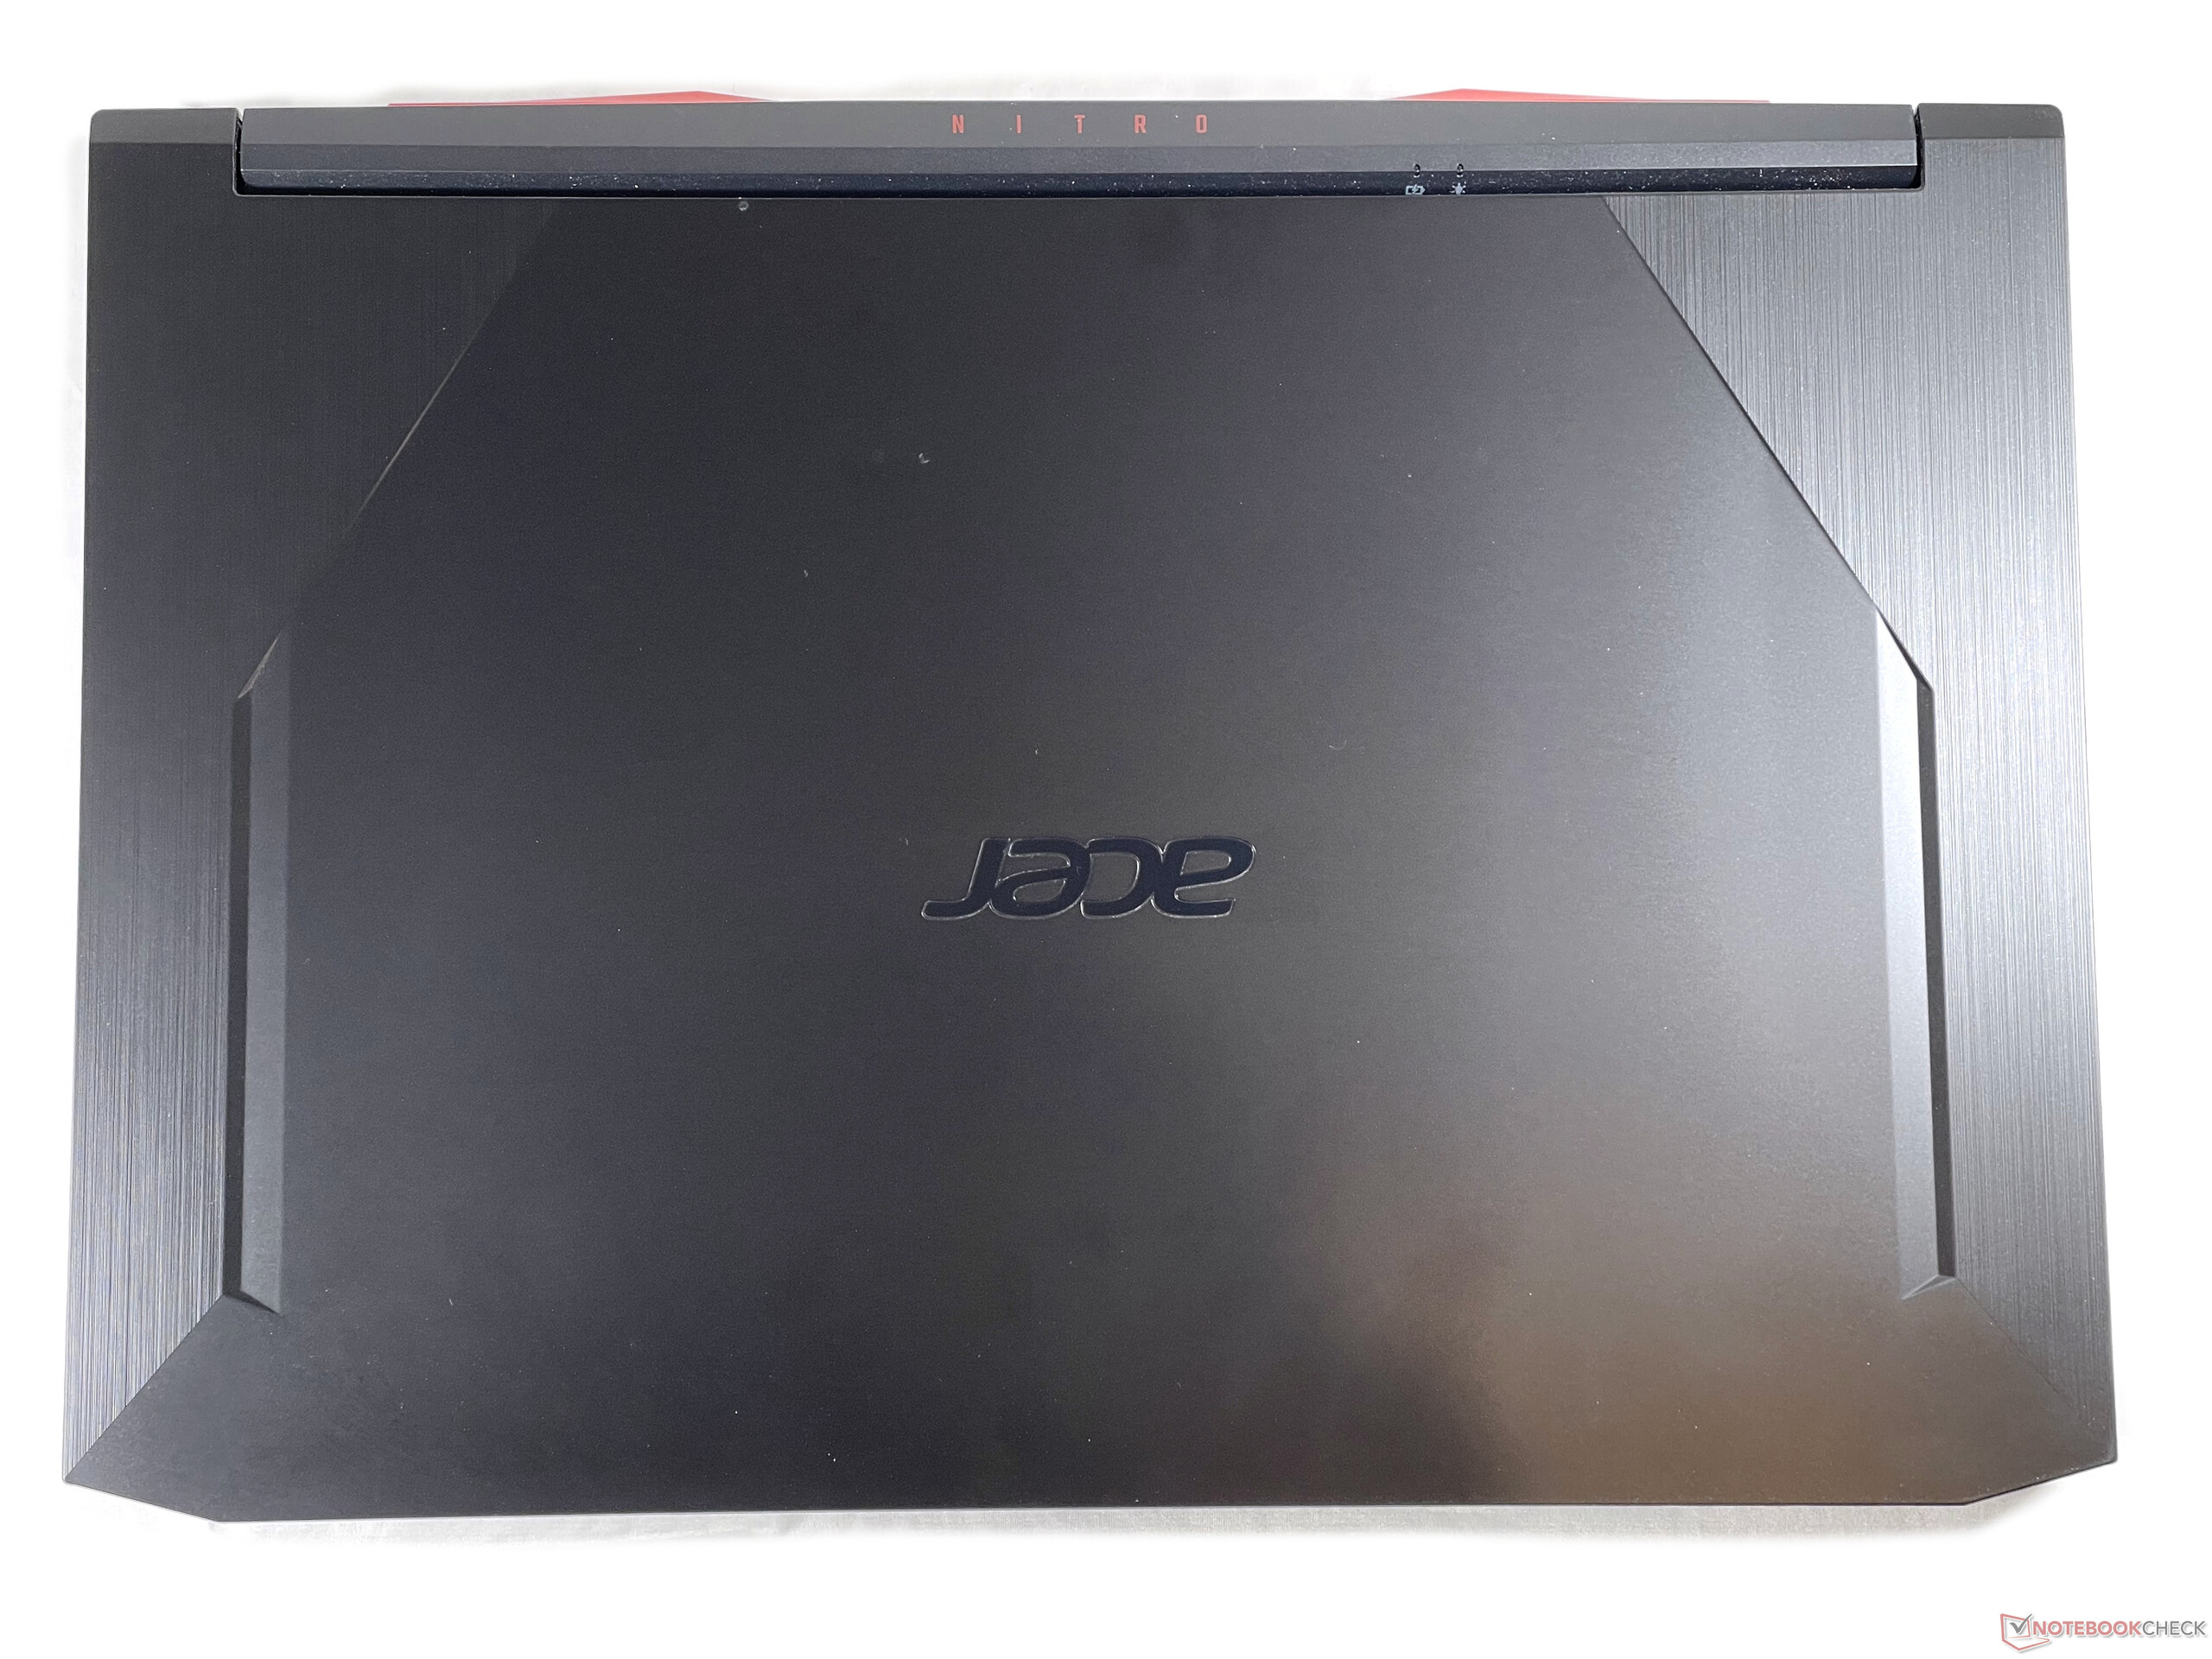
The Nitro 5 AN515-55 takes up slightly more space than most other laptops with similar hardware. Weighing in at 2.3 kg (5 lbs), the Nitro 5 is the heaviest device in our comparison chart. The MSI GF65 Thin 10UE is the lightest notebook that we included in our review. It only weighs 1.9 kg (4.27 lbs).
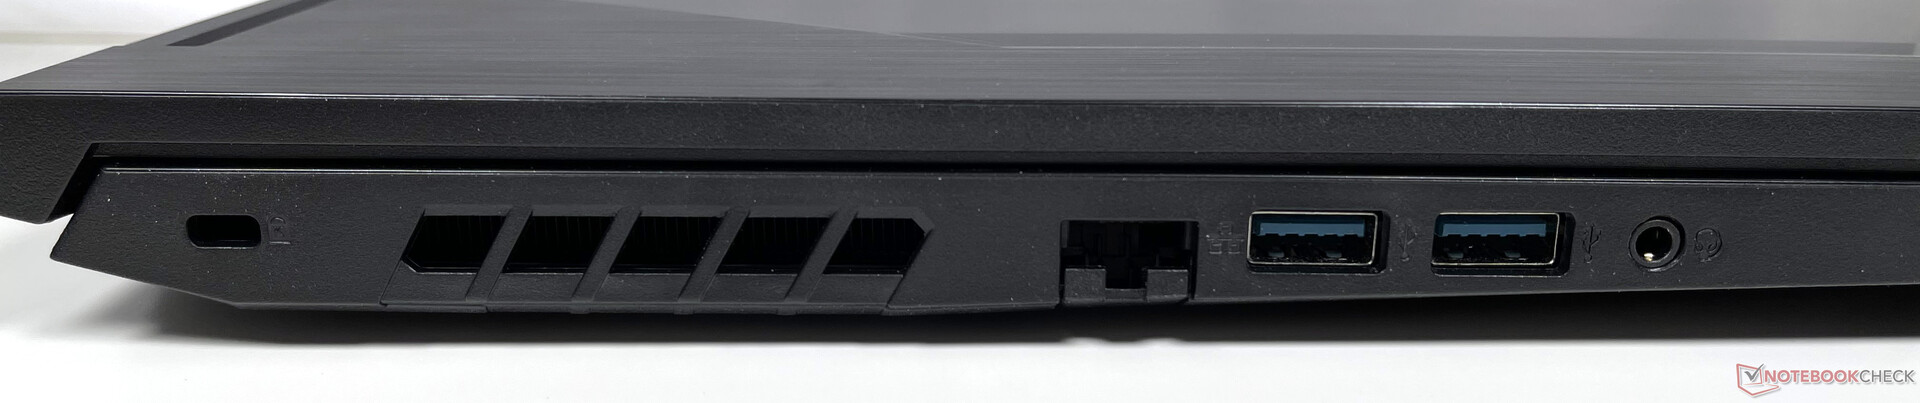
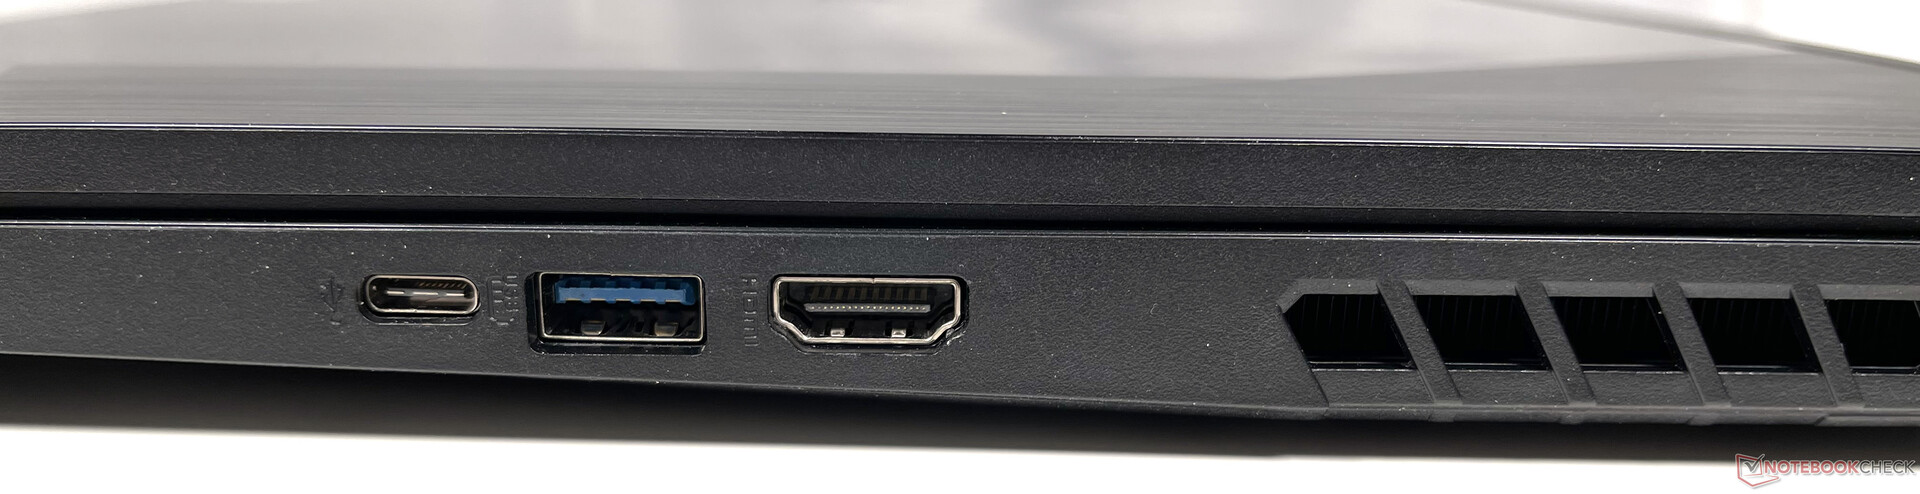
Connectivity - Standard selection of ports
Communication
The Nitro 5 supports Wi-Fi 6 and Bluetooth 5.0, thanks to an Intel communications module (AX201). The Nitro 5 does not achieve spectacular speeds in our Wi-Fi test, but it is still fast enough for all usage scenarios. However, some competing laptops are almost twice as fast as the Acer notebook when it comes to Wi-Fi speeds.
Maintenance
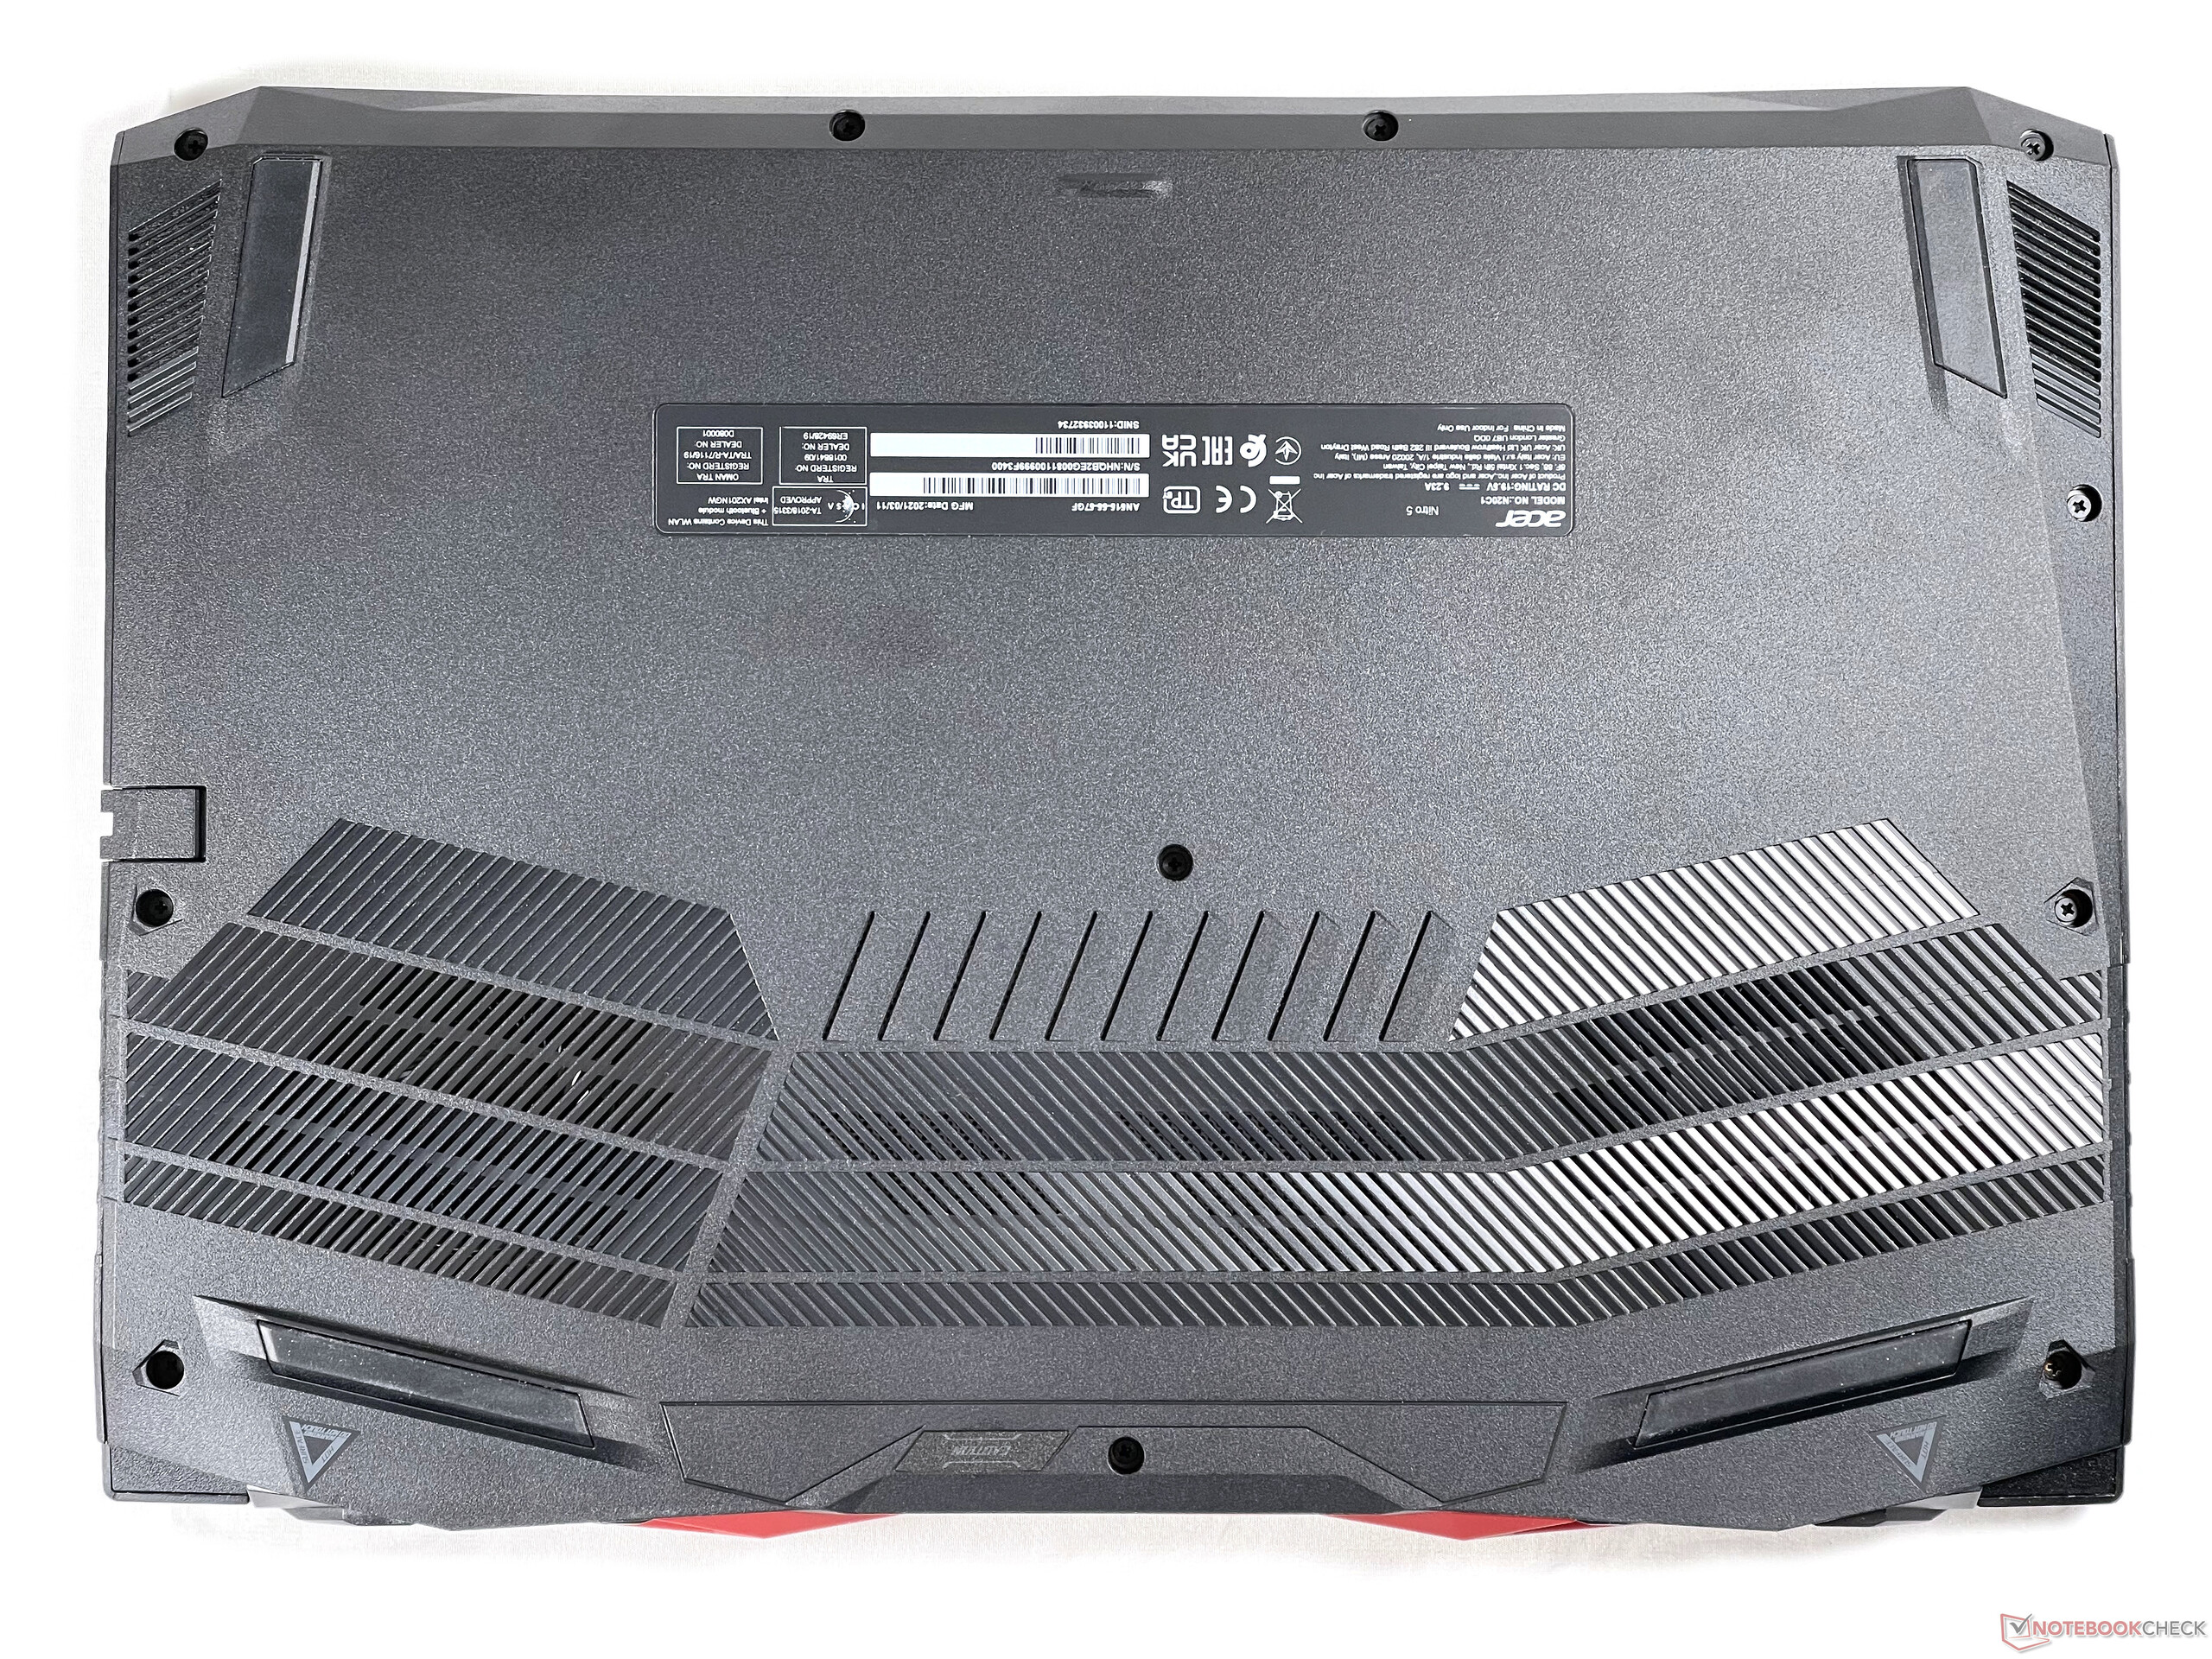
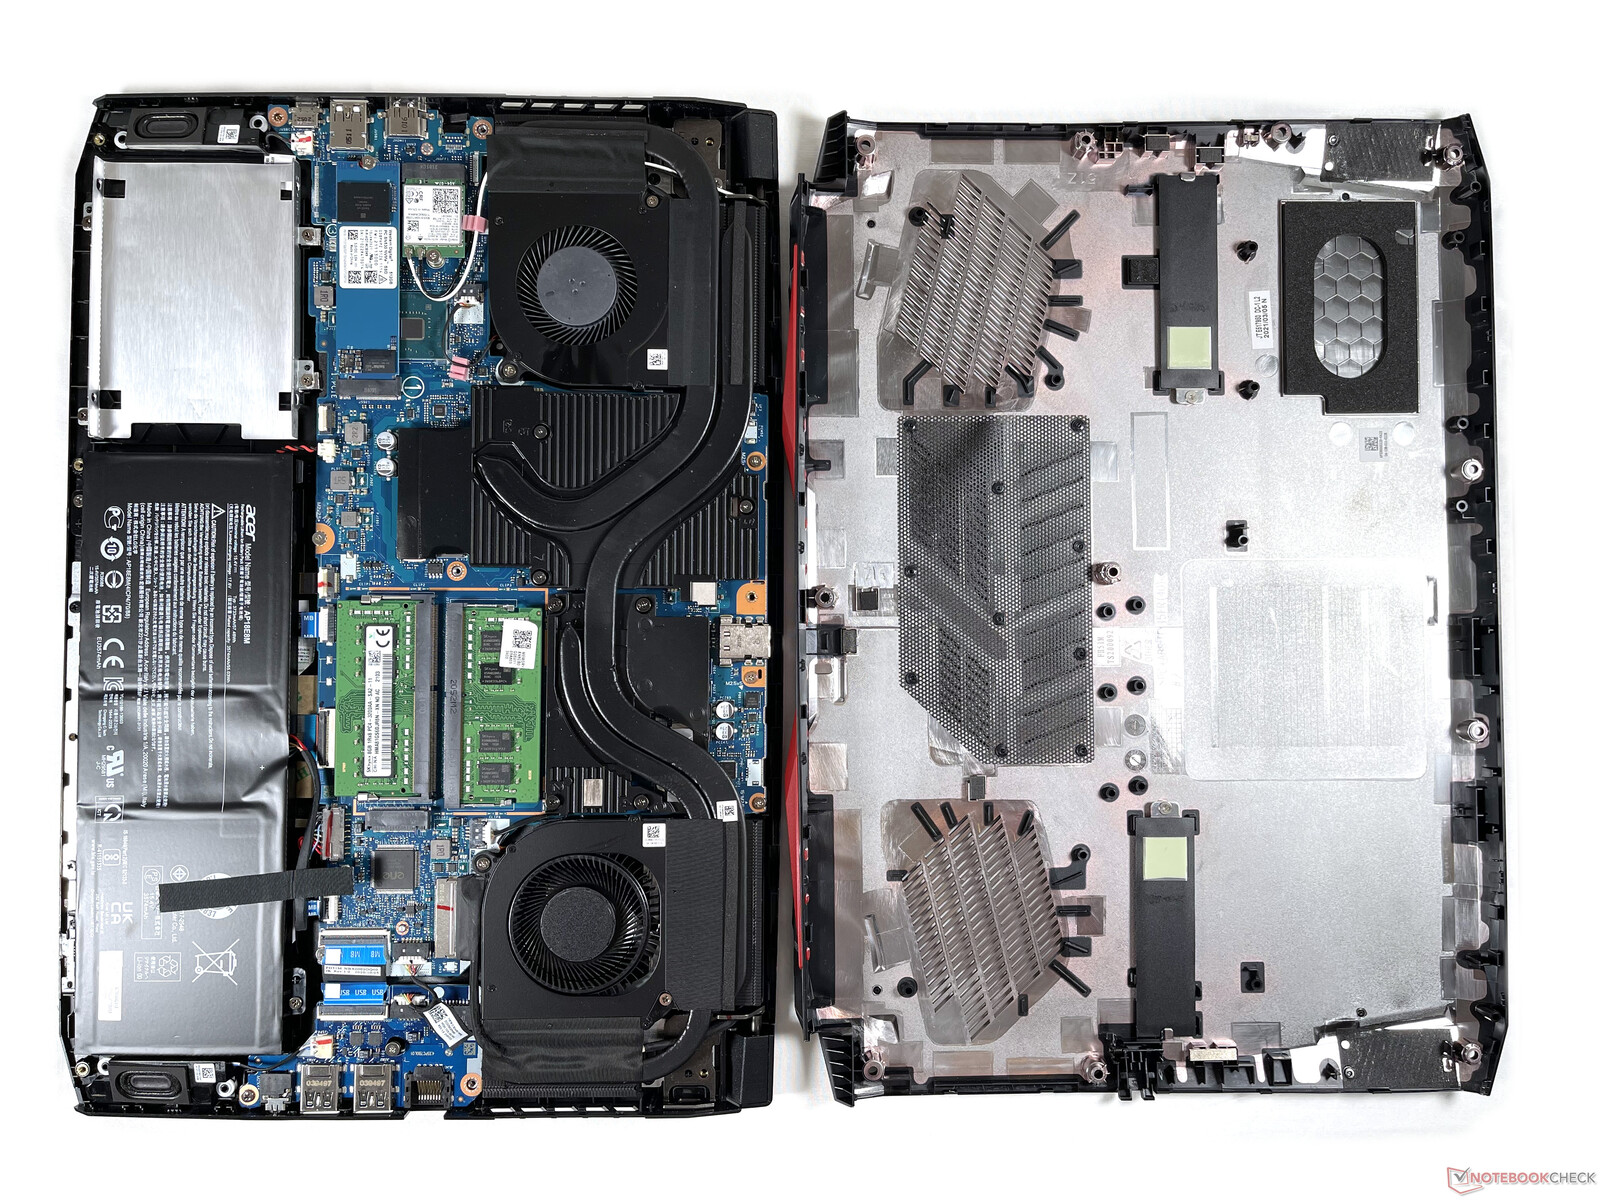
To get to the internal components, users will have to undo 11 screws on the bottom. Once the device is open, users will get access to the two M.2 slots, the replaceable Wi-Fi module, the battery and the fans. As you can see from the image below, there is a bay for a 2.5-inch drive, but there is no SATA connector.
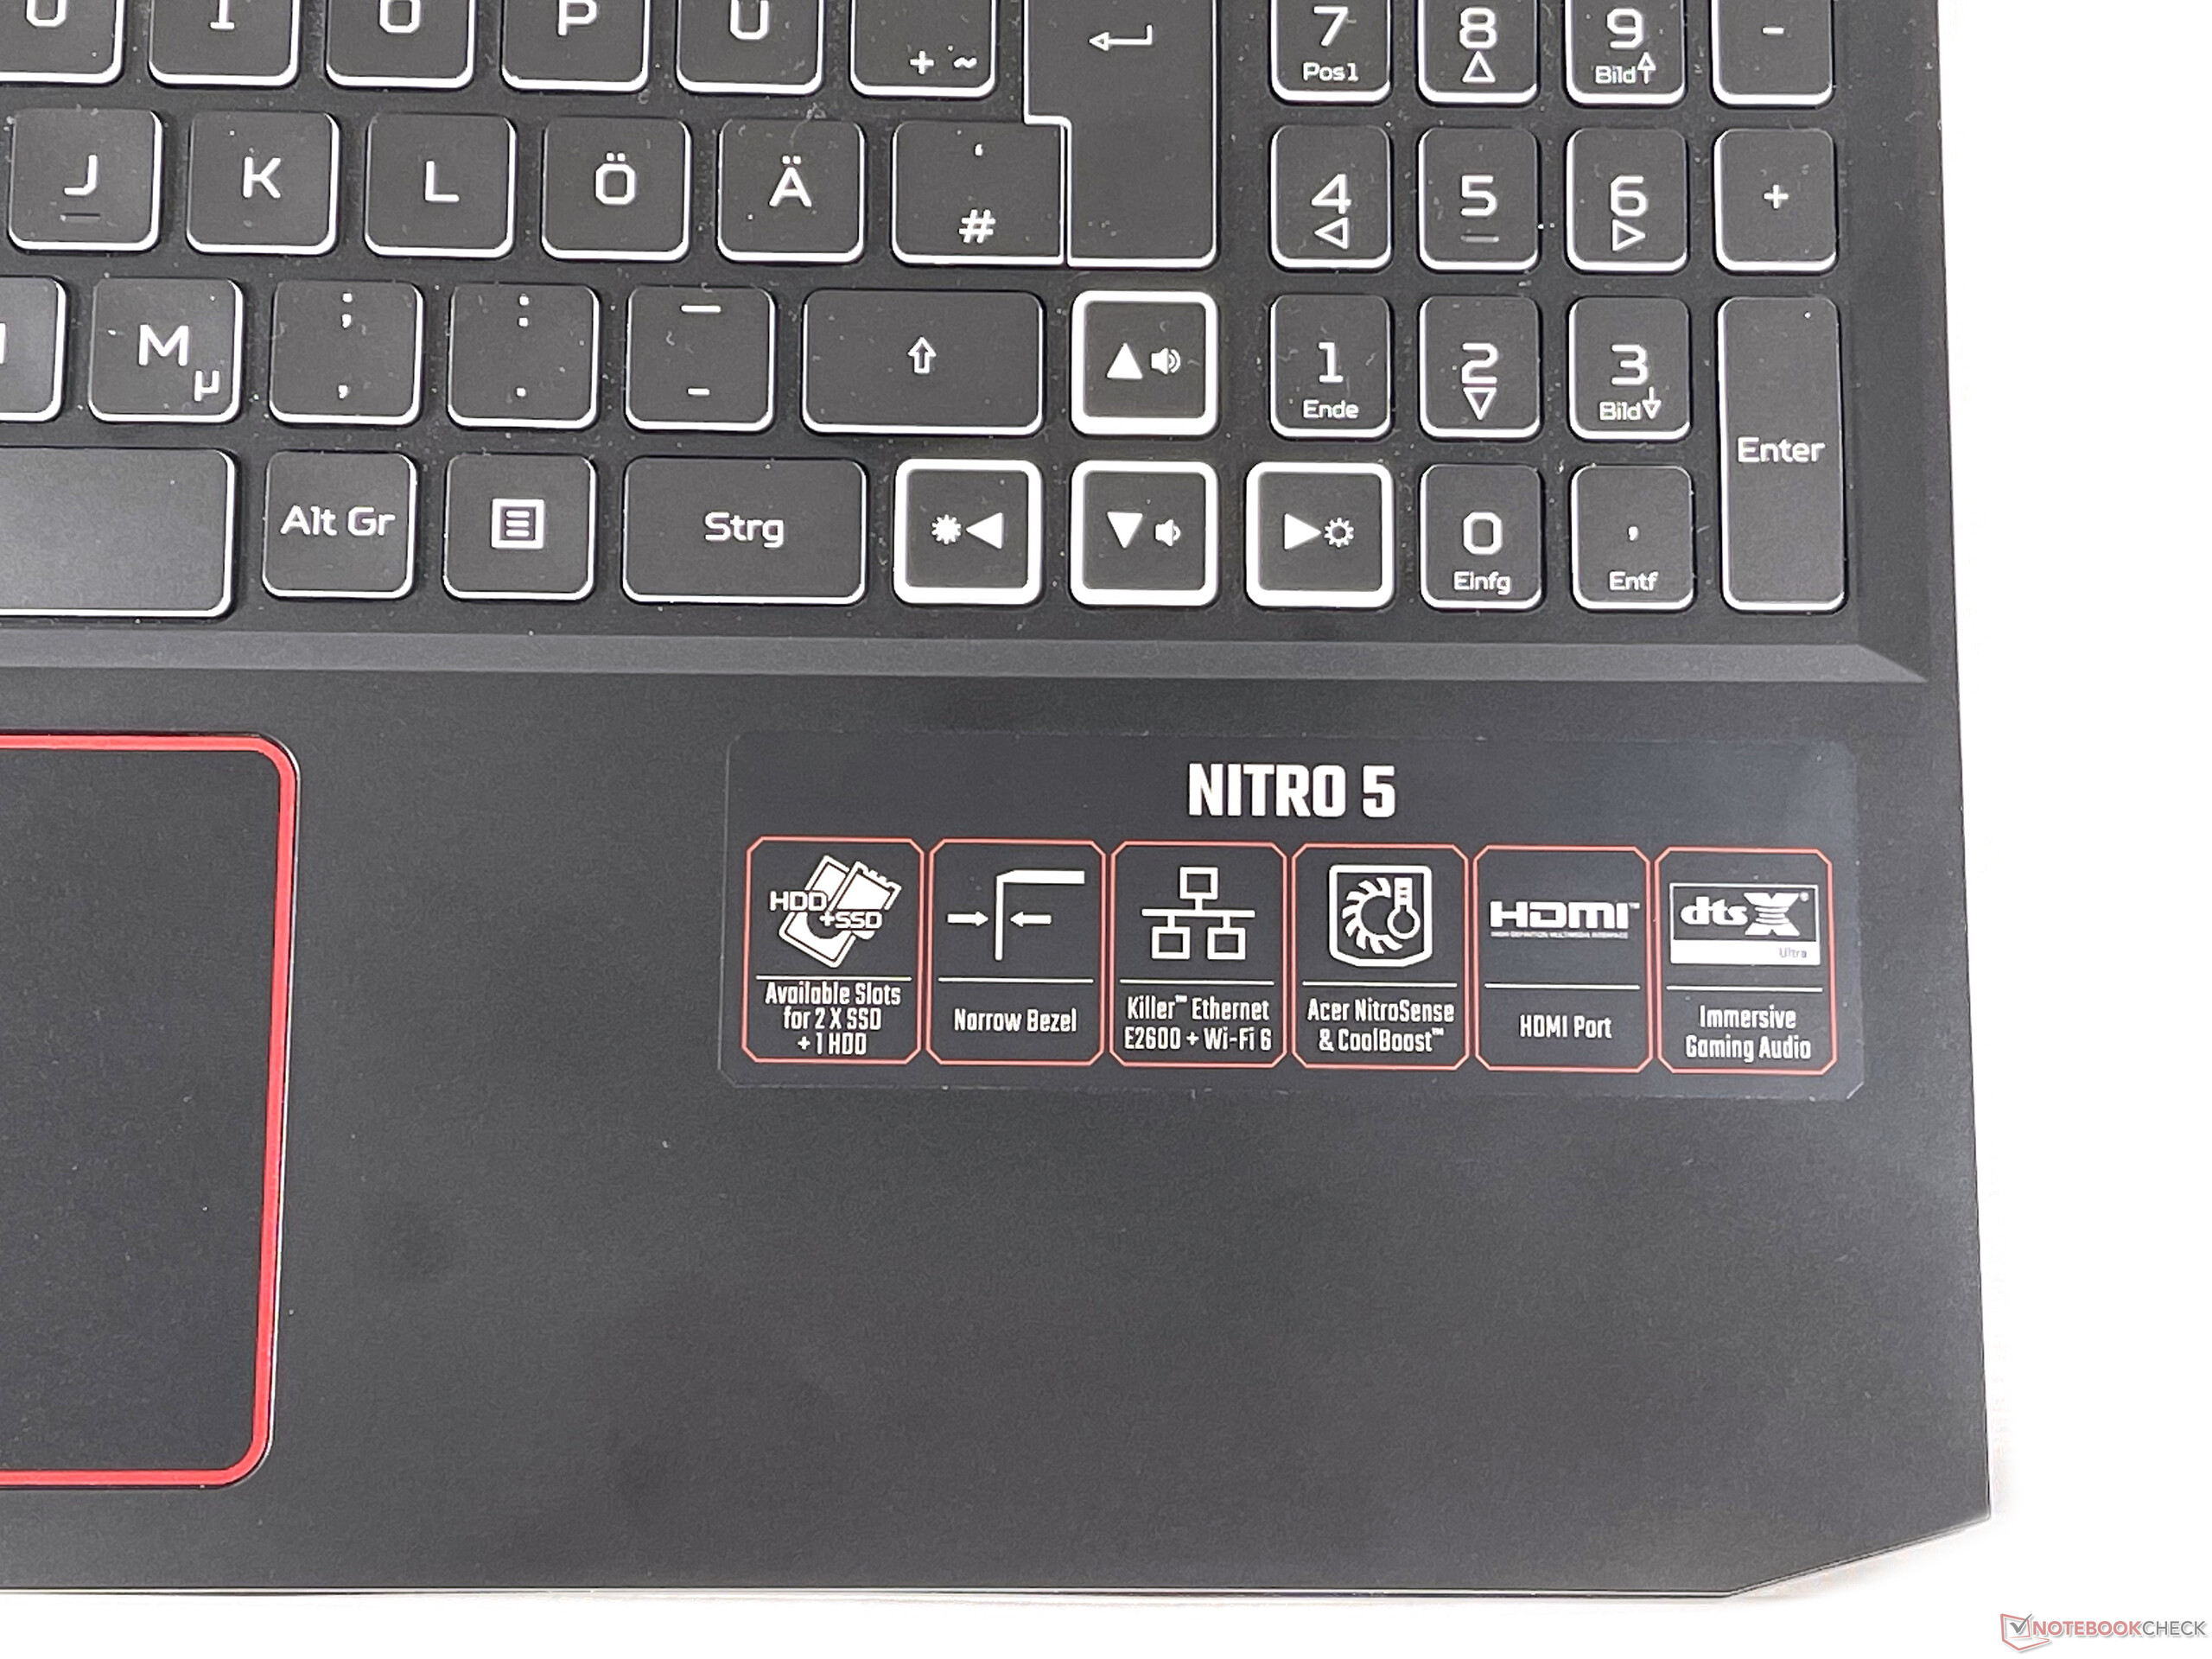
Input Devices - Nitro 5 with usable peripherals
Keyboard
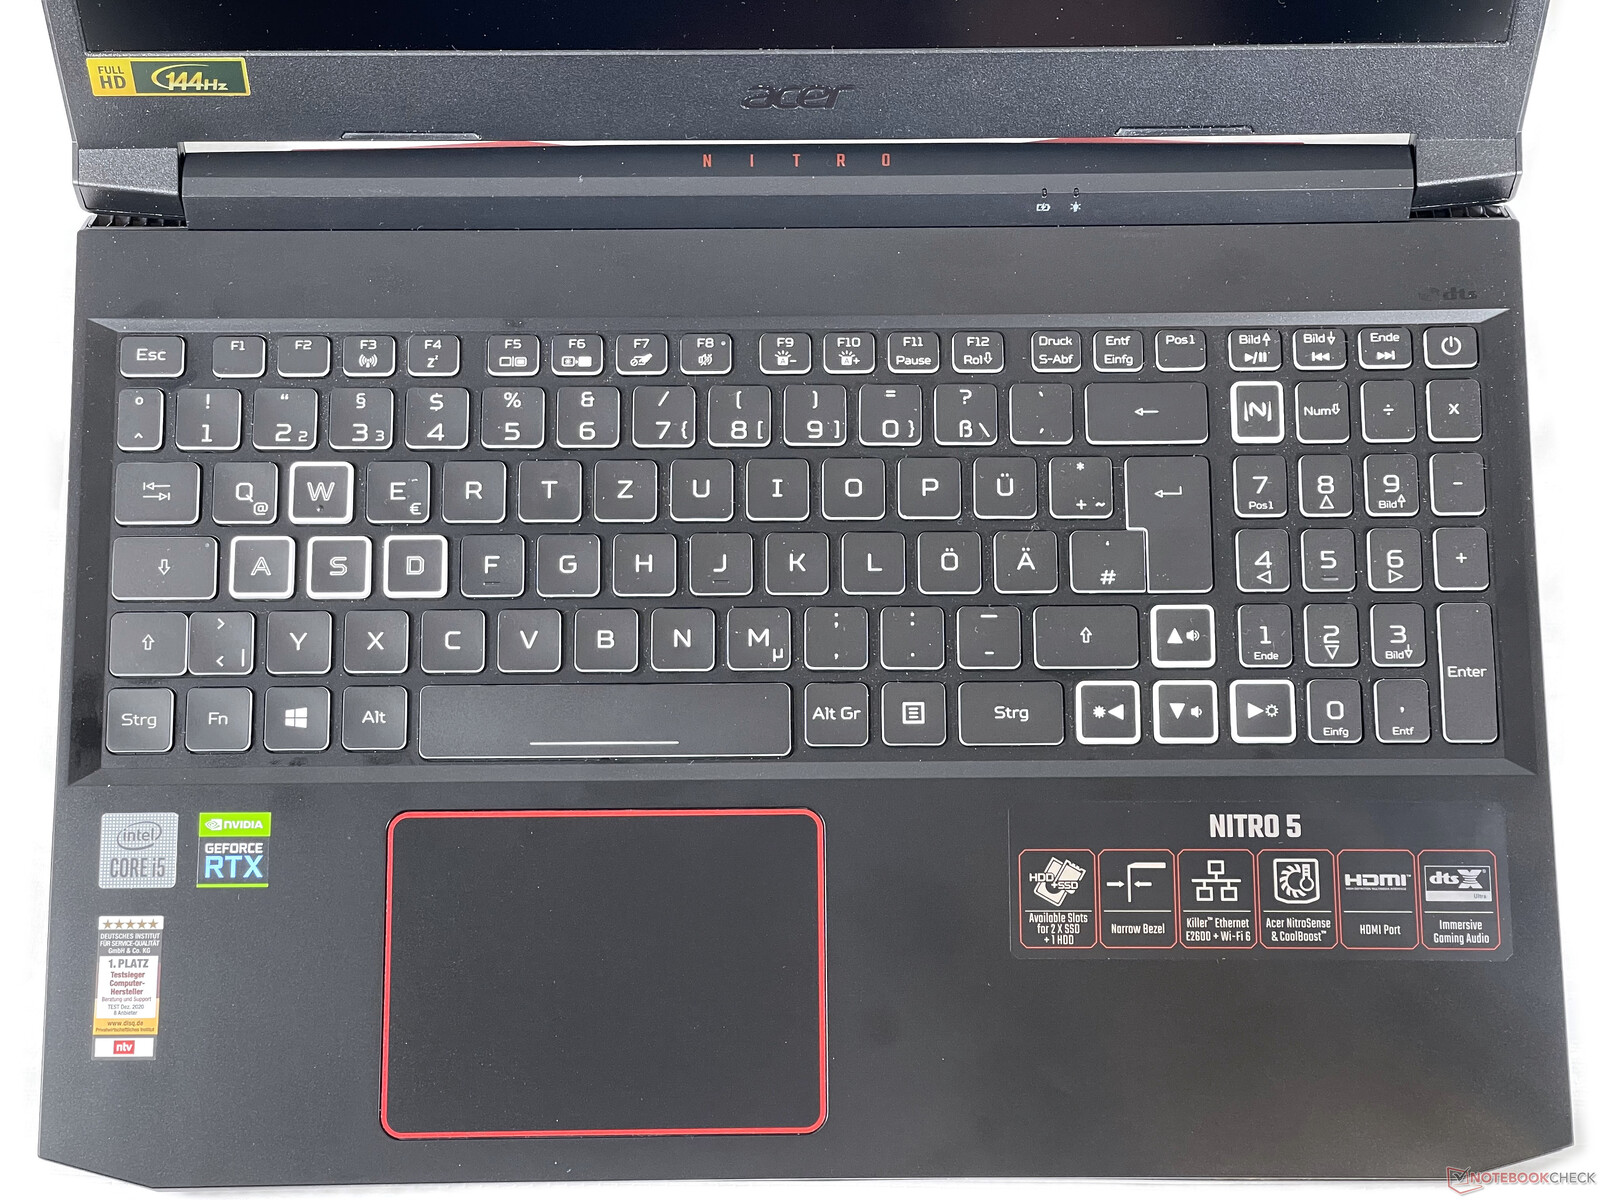
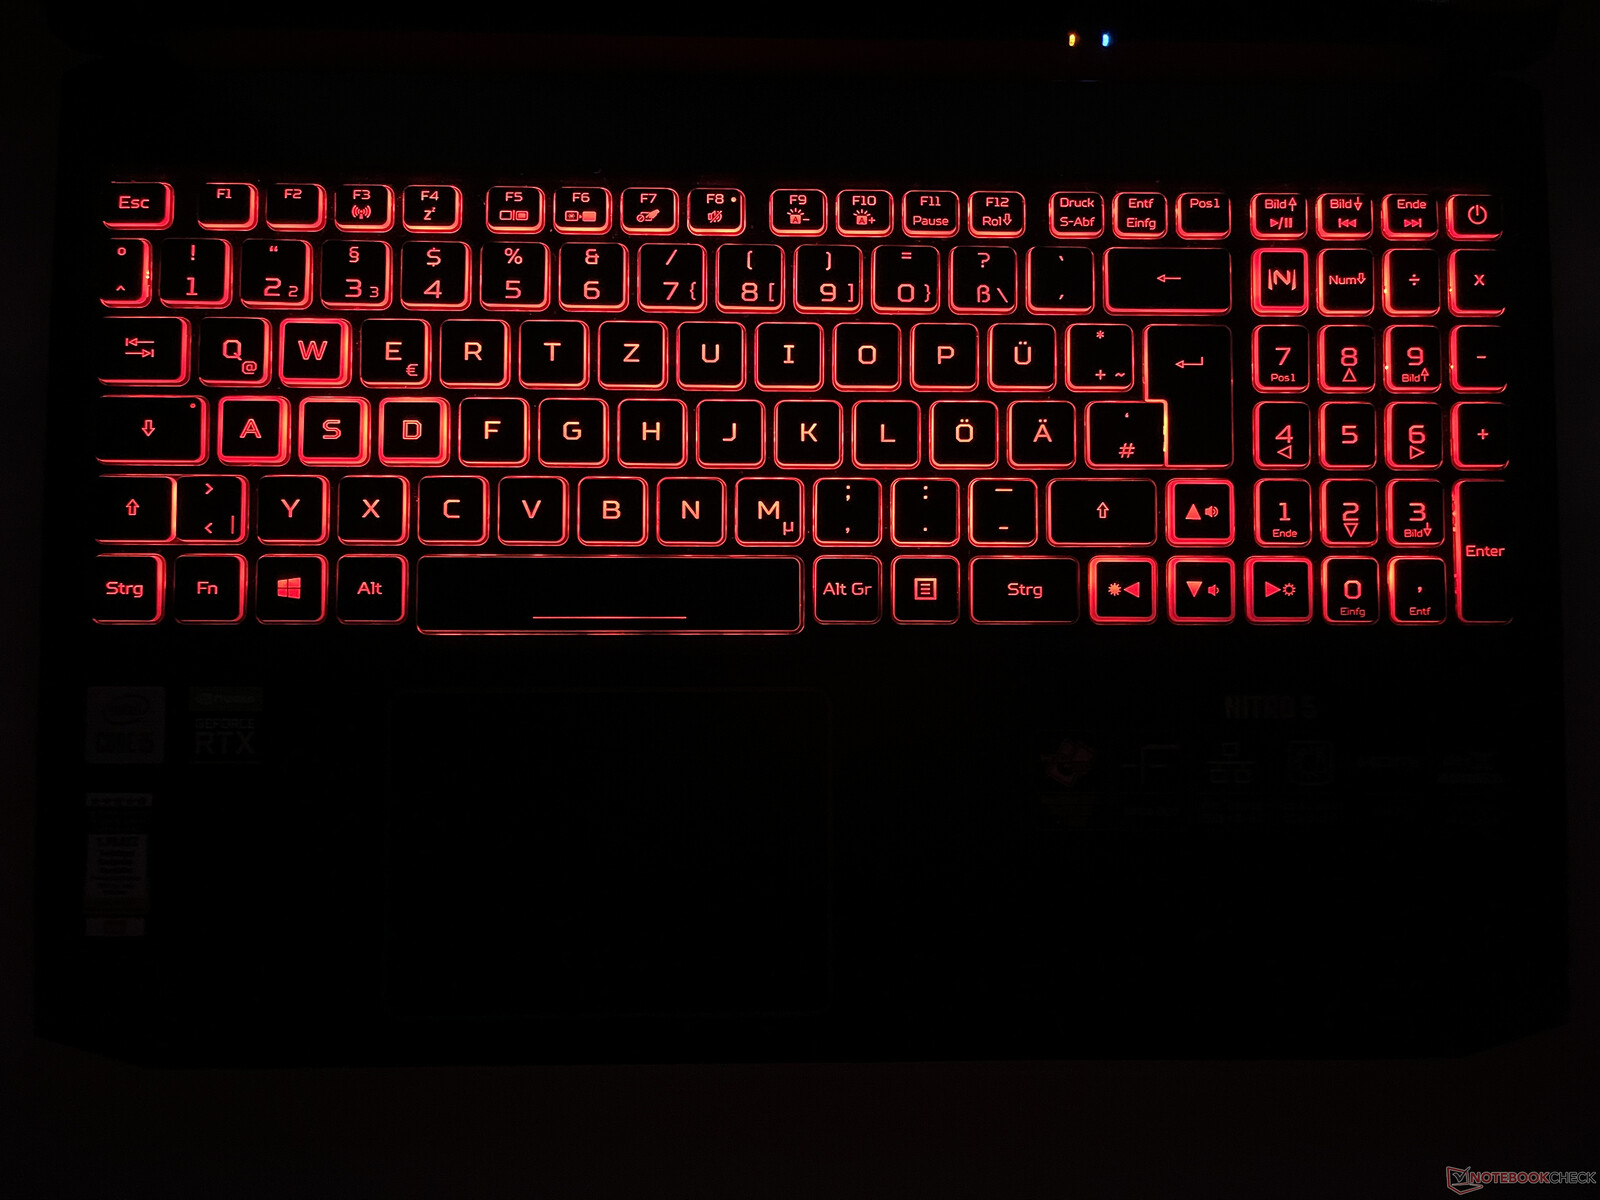
The keyboard features an RBG backlight with four brightness levels, which can be cycled through in the Nitrosense utility. The keys offer a short travel distance and very little resistance. The keyboard does not produce a lot of noise when typing, which is why it can be used in quiet environments. The keyboard is not suited for long typing sessions. Moreover, the keys of the numeric pad are too small.
Touchpad
The Acer Nitro 5 AN515-44 featured the same touchpad as our current review device. You can learn more about this touchpad here.
Display - Fast, good 144-Hz panel

The Acer Nitro 5 has a 15.6-inch display with a native resolution of 1920x1080 pixels and a refresh rate of 144 Hz. The display is fit for competitive titles. Those who want a 165-Hz 1440p screen or a 240-Hz 1080p display will have to pay a significant premium.
The brightness is on a very good level when compared to the rest of the competition. The brightness distribution is also quite decent. Our panel does not exhibit an excessive amount of backlight bleeding. The Schenker XMG Core 15 Ampere is the only device in our comparison chart that offers a higher screen brightness. The panel in the Schenker notebook also has a higher resolution (2560x1440).
| |||||||||||||||||||||||||
Brightness Distribution: 88 %
Center on Battery: 288 cd/m²
Contrast: 1371:1 (Black: 0.21 cd/m²)
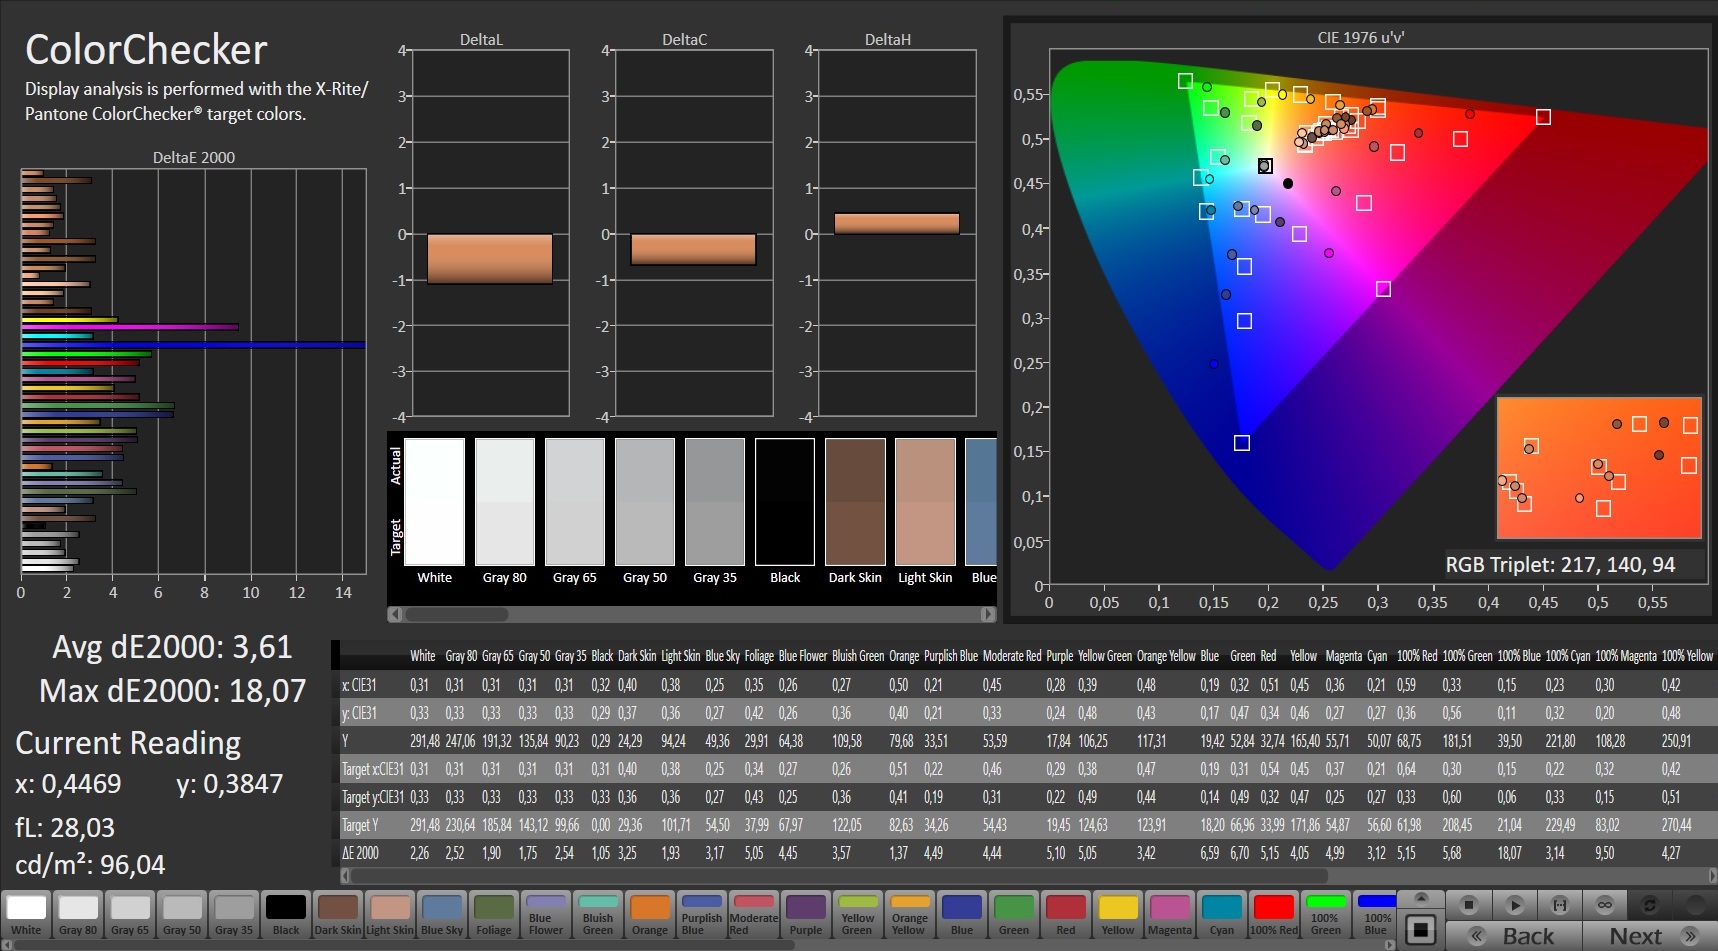
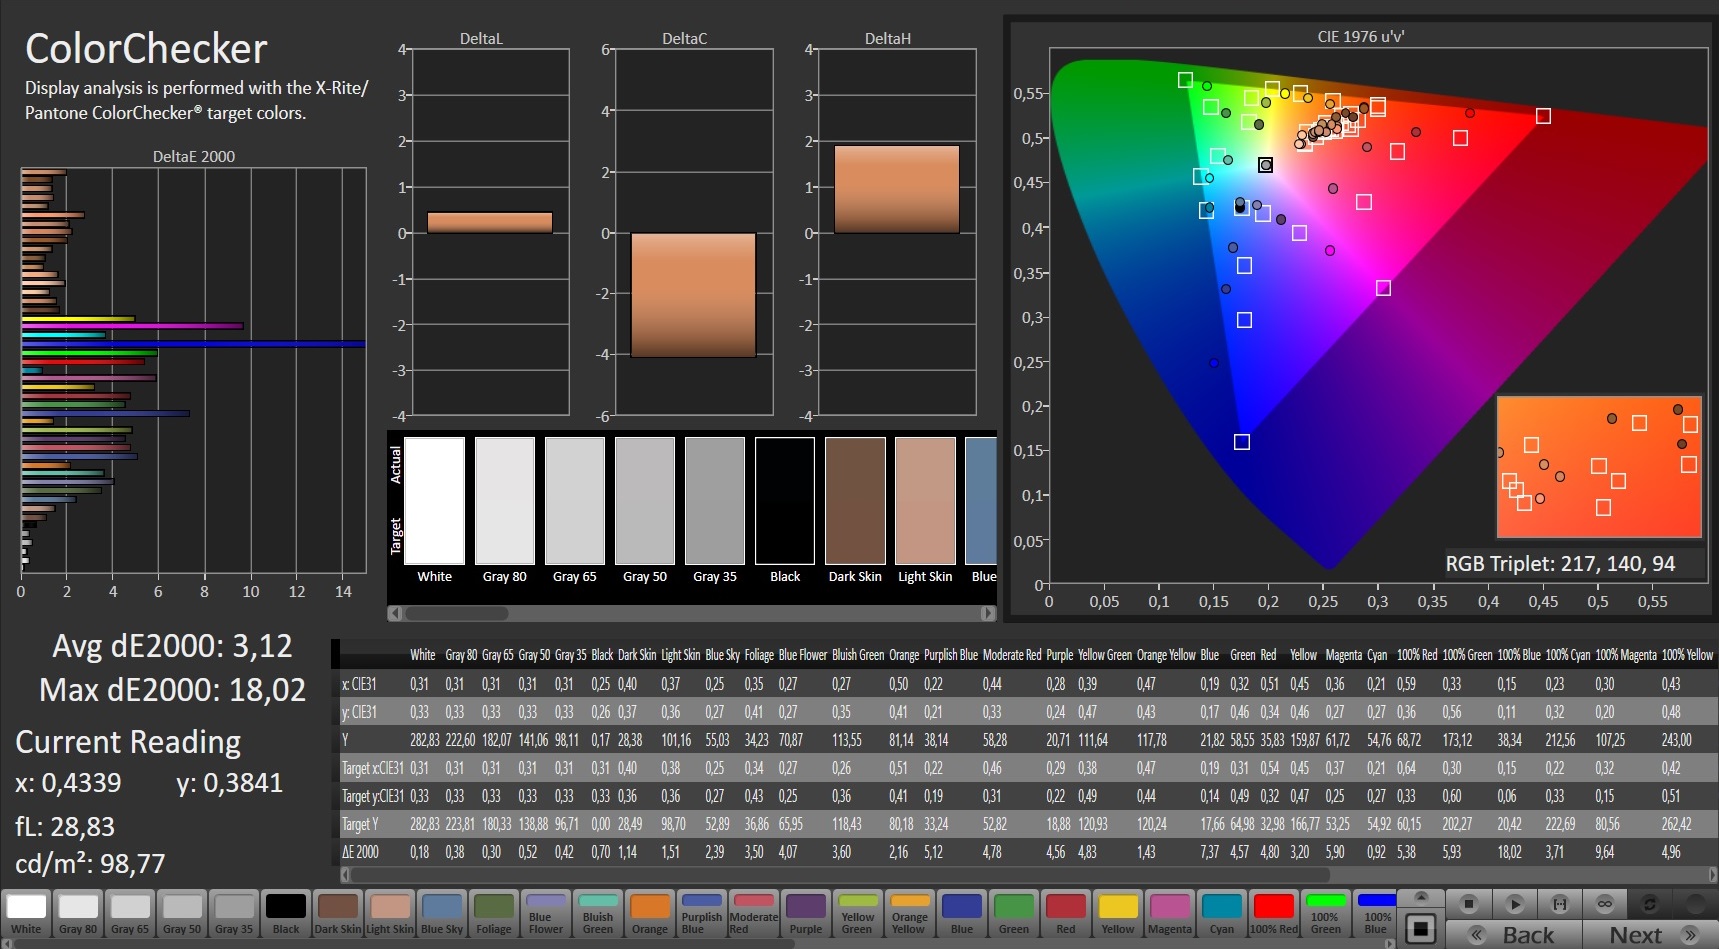
ΔE Color 3.61 | 0.5-29.43 Ø5, calibrated: 3.12
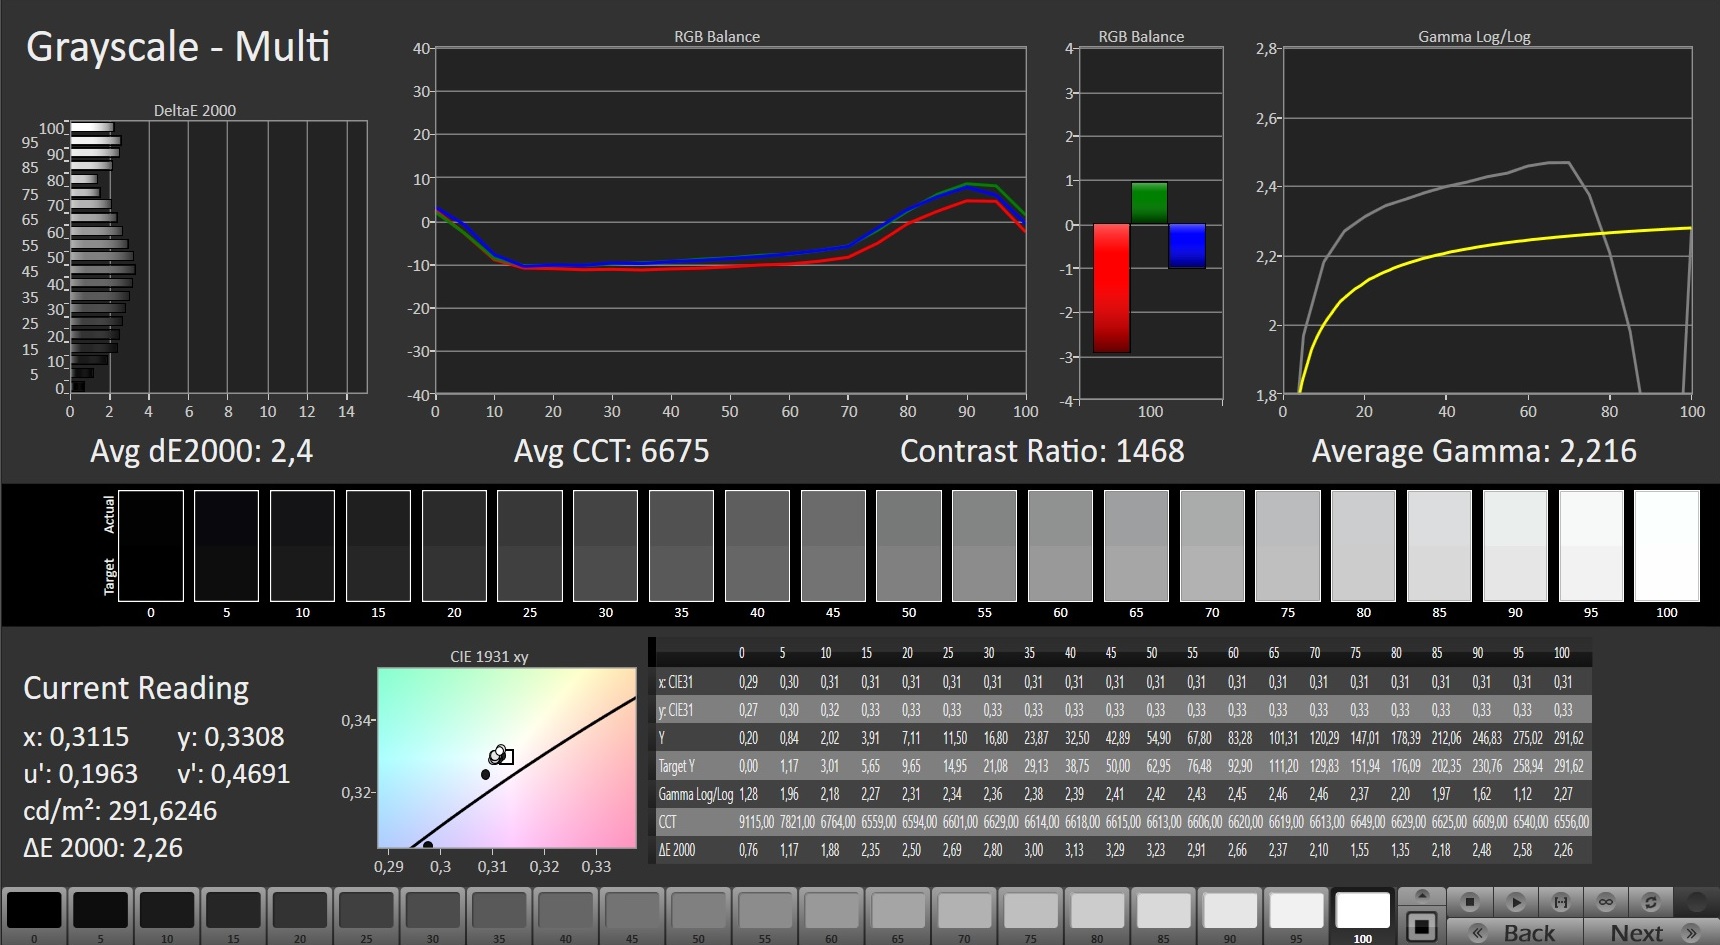
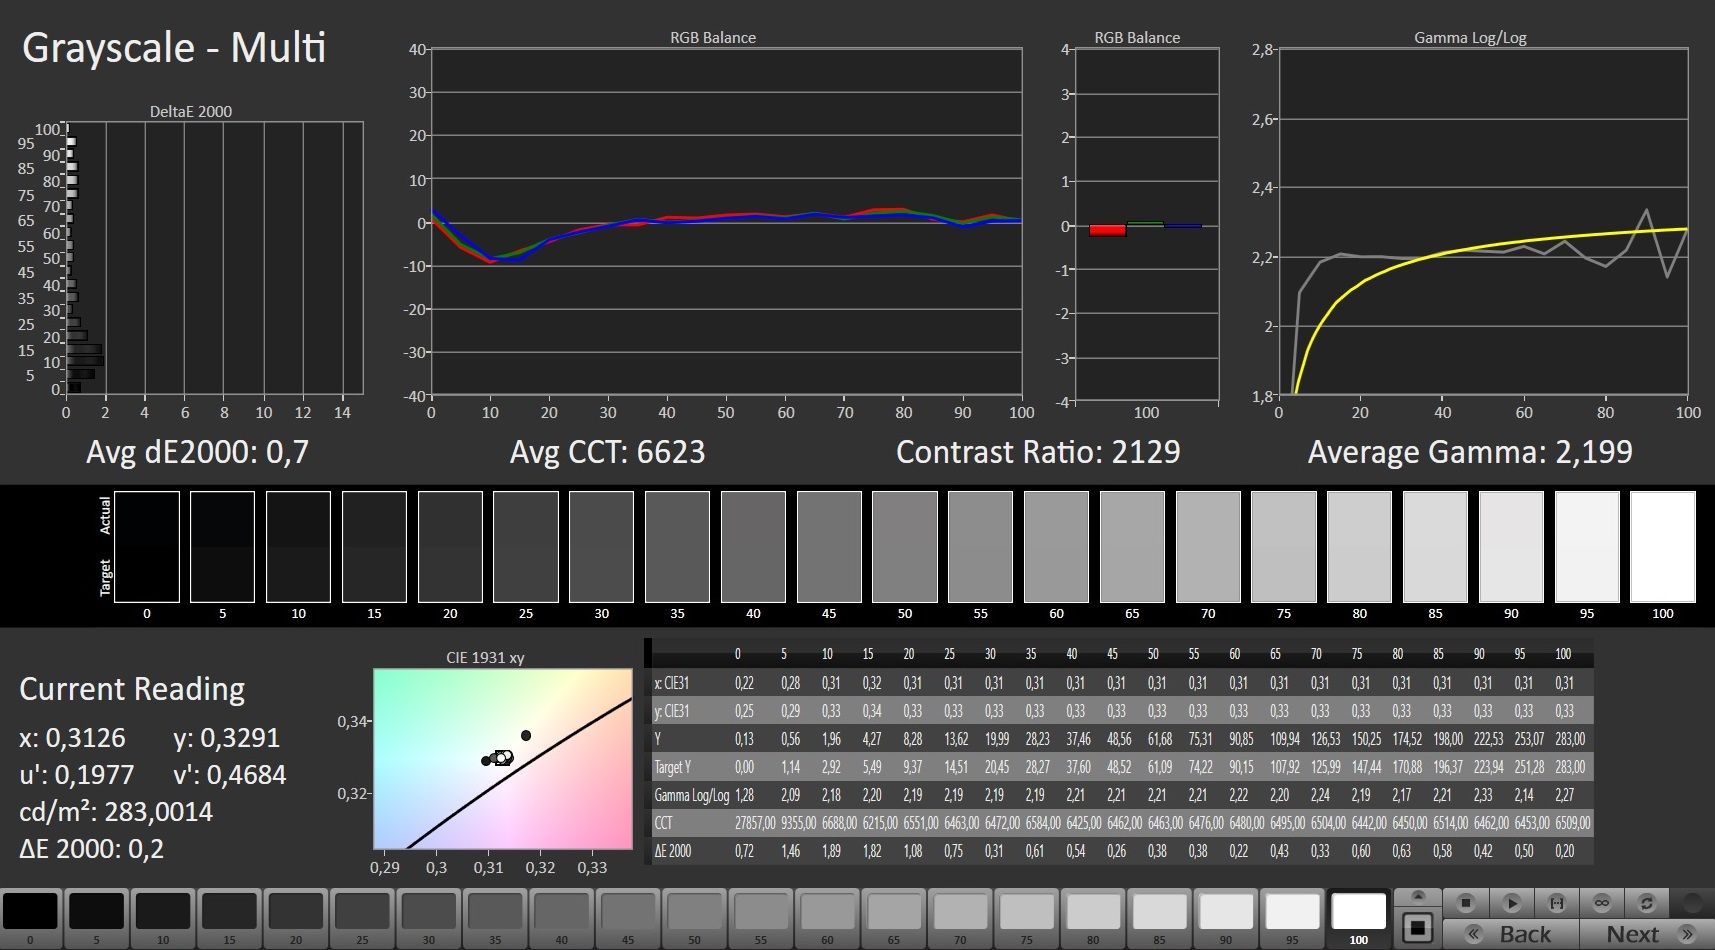
ΔE Greyscale 2.4 | 0.57-98 Ø5.3
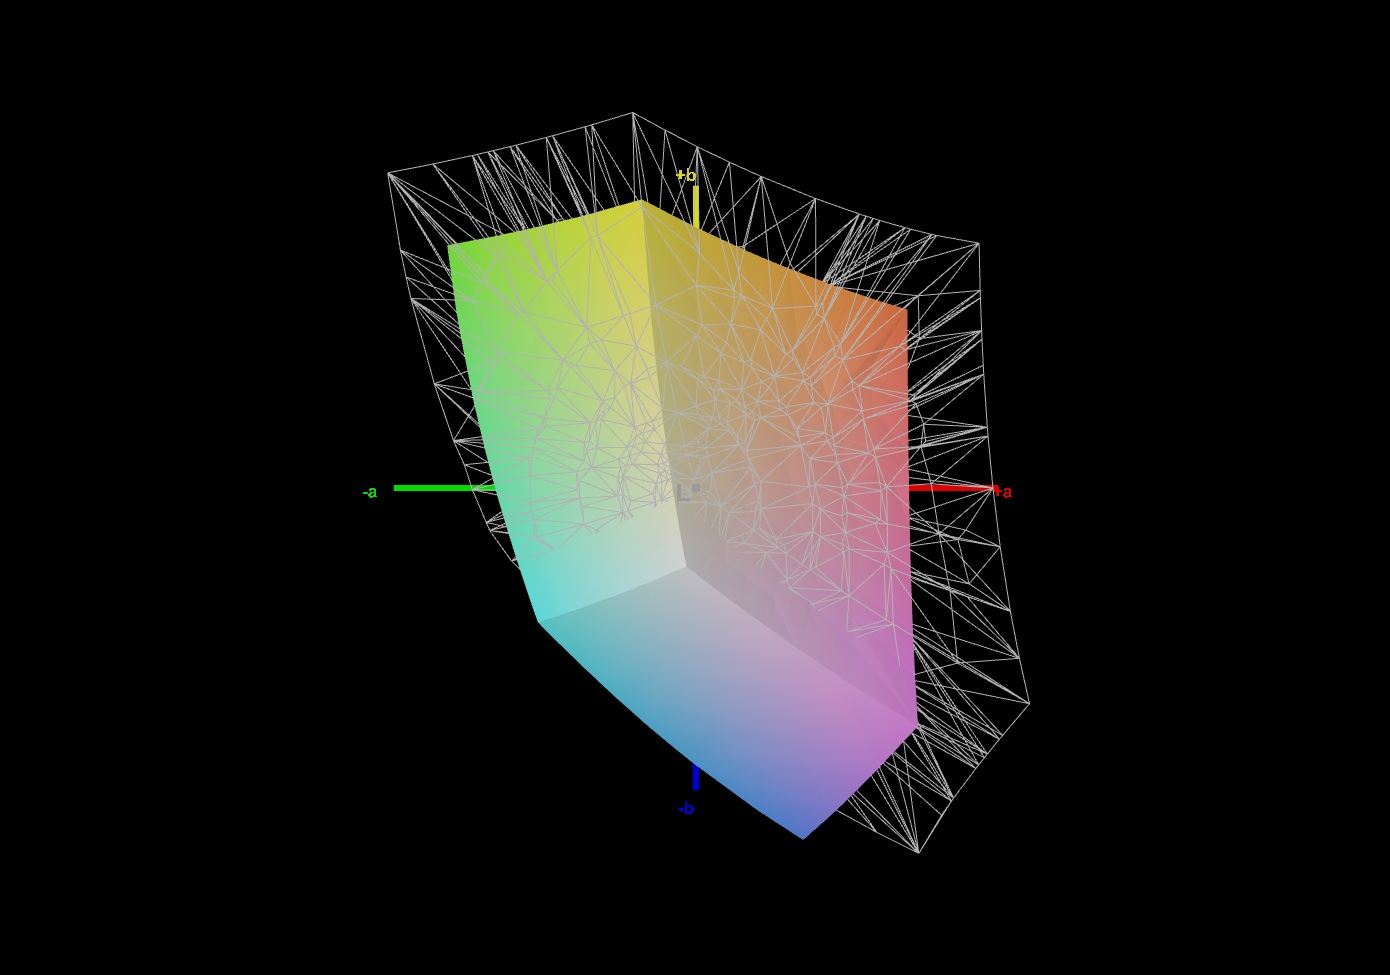
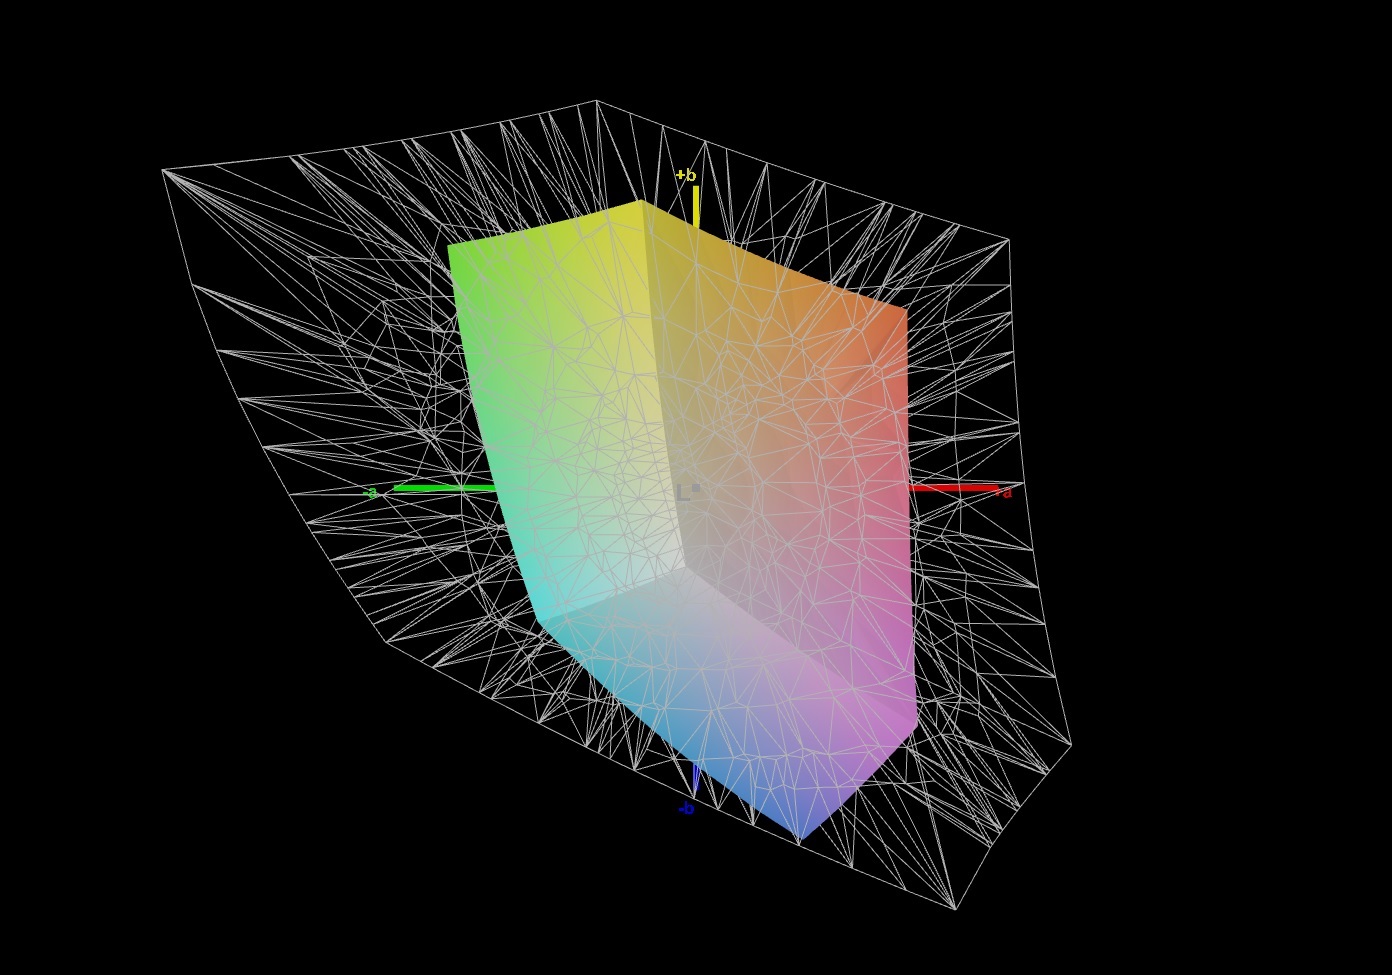
62% sRGB (Argyll 1.6.3 3D)
44% AdobeRGB 1998 (Argyll 1.6.3 3D)
44.02% AdobeRGB 1998 (Argyll 2.2.0 3D)
63.5% sRGB (Argyll 2.2.0 3D)
42.54% Display P3 (Argyll 2.2.0 3D)
Gamma: 2.216
| Acer Aspire Nitro 5 AN515-55-57GF Chi Mei CMN N156HRA-EA1, IPS, 1920x1080, 15.60 | MSI GF65 Thin 10UE AU Optronics B156HAN08.4, IPS, 1920x1080, 15.60 | HP Omen 15-en0375ng BOE0852, IPS, 1920x1080, 15.60 | SCHENKER XMG Core 15 Ampere BOE CQ NE156QHM-NY2, IPS, 2560x1440, 15.60 | Asus TUF Dash F15 FX516PR LQ156M1JW26 (SHP1532), IPS, 1920x1080, 15.60 | Acer Nitro 5 AN515-44-R5FT Panda LM156LF-2F01 (NCP004D), IPS, 1920x1080, 15.60 | |
|---|---|---|---|---|---|---|
| Display | -11% | -8% | 60% | 55% | -3% | |
| Display P3 Coverage | 42.54 | 37.65 -11% | 39.12 -8% | 69.8 64% | 66.9 57% | 41.16 -3% |
| sRGB Coverage | 63.5 | 56.3 -11% | 57.6 -9% | 98.8 56% | 98.1 54% | 61.8 -3% |
| AdobeRGB 1998 Coverage | 44.02 | 38.9 -12% | 40.42 -8% | 70.7 61% | 67.9 54% | 42.56 -3% |
| Response Times | -23% | 10% | 56% | 61% | -25% | |
| Response Time Grey 50% / Grey 80% * | 33.8 ? | 36.8 ? -9% | 30.4 ? 10% | 14.8 ? 56% | 12 ? 64% | 40.8 ? -21% |
| Response Time Black / White * | 23.2 ? | 31.6 ? -36% | 20.8 ? 10% | 10.4 ? 55% | 10 ? 57% | 30 ? -29% |
| PWM Frequency | 200 ? | 23580 ? | ||||
| Screen | -17% | -15% | 32% | 18% | -9% | |
| Brightness middle | 288 | 266.5 -7% | 297 3% | 347 20% | 286 -1% | 287 0% |
| Brightness | 262 | 262 0% | 275 5% | 328 25% | 275 5% | 271 3% |
| Brightness Distribution | 88 | 91 3% | 88 0% | 89 1% | 91 3% | 88 0% |
| Black Level * | 0.21 | 0.18 14% | 0.33 -57% | 0.27 -29% | 0.25 -19% | 0.25 -19% |
| Contrast | 1371 | 1481 8% | 900 -34% | 1285 -6% | 1144 -17% | 1148 -16% |
| Colorchecker dE 2000 * | 3.61 | 5.33 -48% | 4.54 -26% | 1.66 54% | 2.43 33% | 4.77 -32% |
| Colorchecker dE 2000 max. * | 18.07 | 18.28 -1% | 18.92 -5% | 3.03 83% | 6.33 65% | 17.15 5% |
| Colorchecker dE 2000 calibrated * | 3.12 | 4.36 -40% | 4.66 -49% | 1.23 61% | 0.83 73% | 3.73 -20% |
| Greyscale dE 2000 * | 2.4 | 4.5 -88% | 2.1 12% | 1.6 33% | 3.5 -46% | 2.7 -13% |
| Gamma | 2.216 99% | 2.35 94% | 2.066 106% | 2.278 97% | 2.32 95% | 2.115 104% |
| CCT | 6675 97% | 6289 103% | 6291 103% | 6430 101% | 7145 91% | 7187 90% |
| Color Space (Percent of AdobeRGB 1998) | 44 | 35.6 -19% | 40 -9% | 71 61% | 68 55% | 43 -2% |
| Color Space (Percent of sRGB) | 62 | 55.8 -10% | 58 -6% | 94 52% | 91 47% | 61 -2% |
| Total Average (Program / Settings) | -17% /
-17% | -4% /
-11% | 49% /
40% | 45% /
30% | -12% /
-10% |
* ... smaller is better
Both the contrast ratio (1371:1) and the black value (0.21 cd/m²) are very good. Only the MSI GF65 Thin 10UE does better here. The Nitro 5 still manages to beat the MSI GF65 in terms of colour reproduction, though. Nevertheless, the screen of the Nitro 5 is not suitable for professional applications, because it only manages to cover 62% of sRGB and 44% of AdobeRGB. Both the Schenker XMG Core 15 and the Asus TUF Dash F15 have significantly more colour-accurate screens, but they cost more money.

The display of the Nitro 5 is hard to read outside on sunny days because it has a brightness of only 260 cd/m². However, in all other situations, the screen should be legible, thanks to a matte surface.
Display Response Times
| ↔ Response Time Black to White | ||
|---|---|---|
| 23.2 ms ... rise ↗ and fall ↘ combined | ↗ 13.2 ms rise | 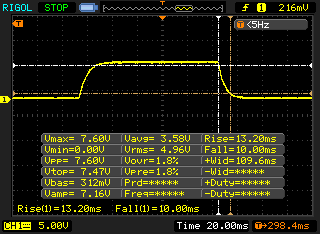 |
| ↘ 10 ms fall | ||
| The screen shows good response rates in our tests, but may be too slow for competitive gamers. In comparison, all tested devices range from 0.1 (minimum) to 240 (maximum) ms. » 47 % of all devices are better. This means that the measured response time is similar to the average of all tested devices (21.5 ms). | ||
| ↔ Response Time 50% Grey to 80% Grey | ||
| 33.8 ms ... rise ↗ and fall ↘ combined | ↗ 16.4 ms rise | 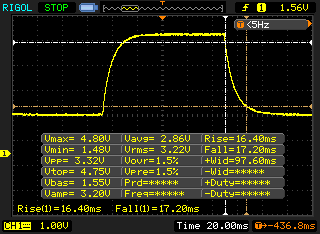 |
| ↘ 17.4 ms fall | ||
| The screen shows slow response rates in our tests and will be unsatisfactory for gamers. In comparison, all tested devices range from 0.2 (minimum) to 636 (maximum) ms. » 40 % of all devices are better. This means that the measured response time is similar to the average of all tested devices (33.8 ms). | ||
Screen Flickering / PWM (Pulse-Width Modulation)
| Screen flickering / PWM not detected |  | ||
In comparison: 53 % of all tested devices do not use PWM to dim the display. If PWM was detected, an average of 17933 (minimum: 5 - maximum: 3846000) Hz was measured. | |||
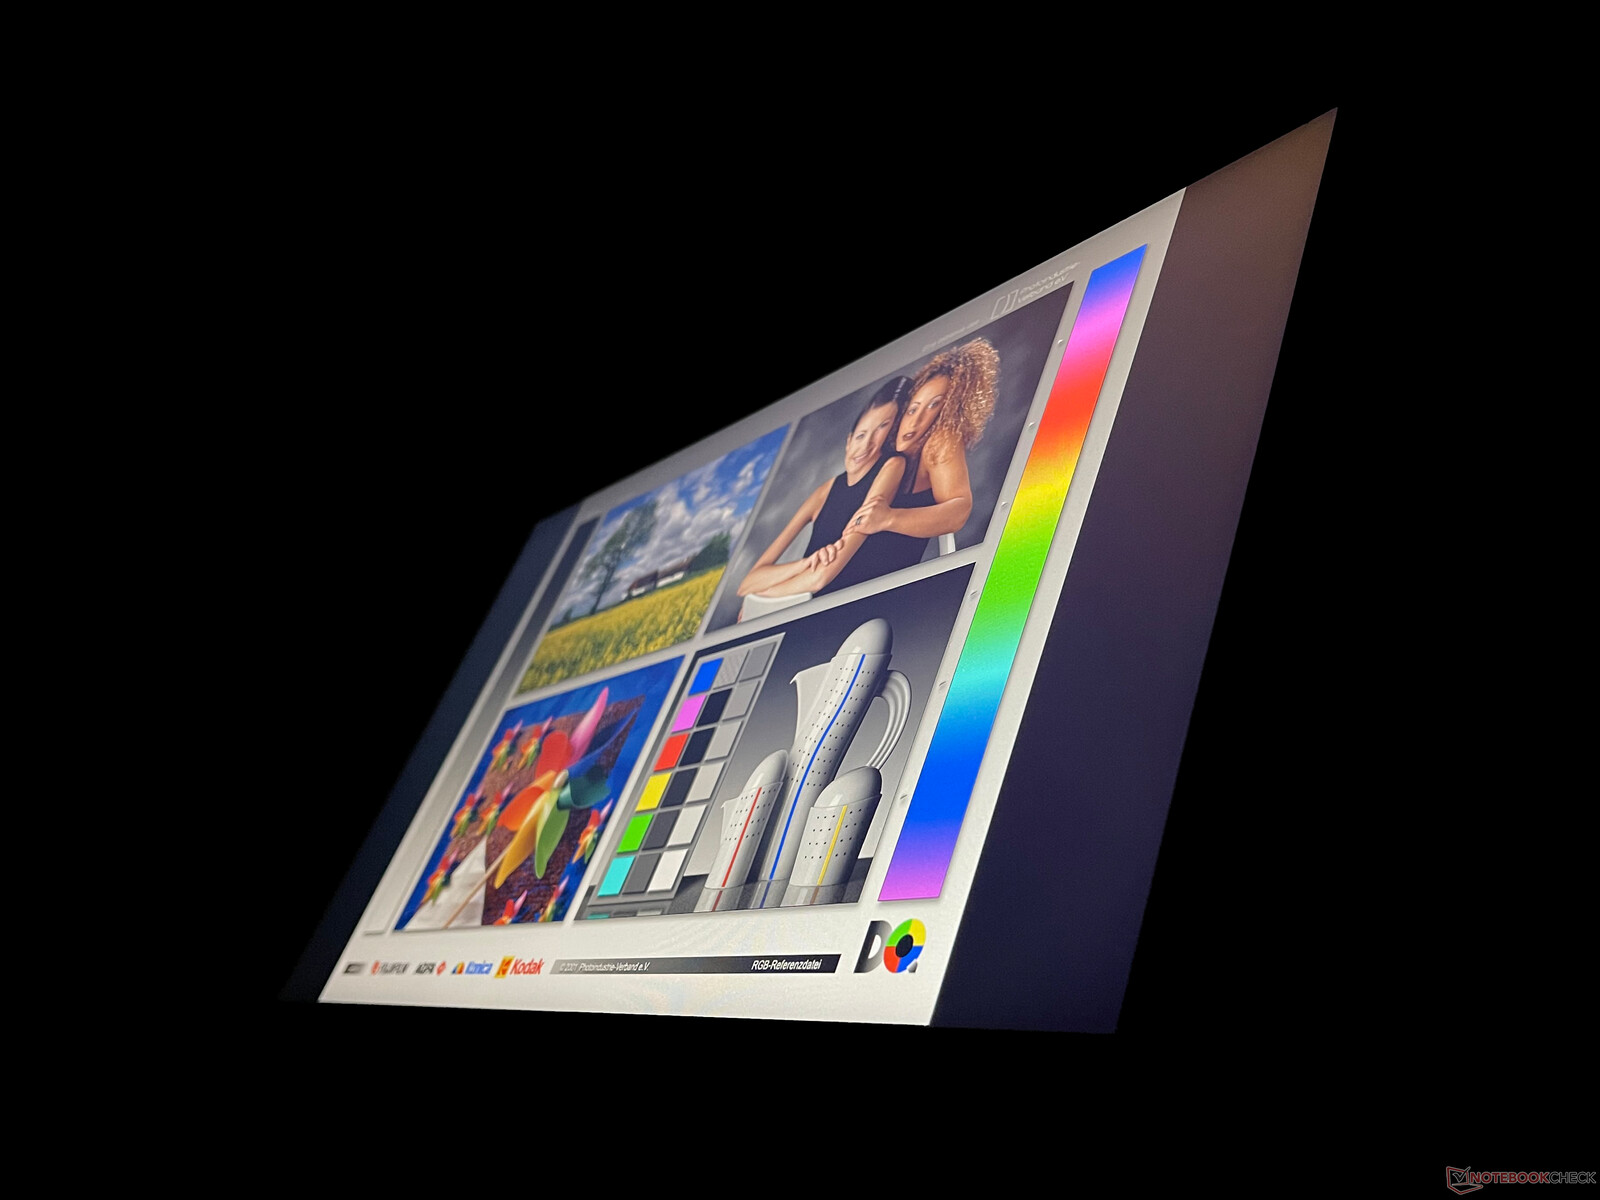
The IPS screen has very wide viewing angles. However, the brightness falls slightly when it is viewed at acute angles.
Performance - RTX 3060 is the main feature
Our review device comes with the Intel Core i5-10300H, the Nvidia GeForce RTX 3060 and 16 GB of DDR4 dual-channel RAM. Our configuration of the Nitro 5 features a 512 GB NVMe SSD. In Europe, there is also an alternative configuration with the hexa-core Intel Core i7-10750H and the RTX 3050/RTX 3050 Ti. Our review device is primarily intended for gaming because it comes with a mid-range CPU and a high-end GPU. Buyers should also be aware of the fact that not all configurations come with Windows 10 preinstalled. For instance, Windows 10 was not preinstalled on our review device.
Processor
The Core i5-10300H is a hexa-core Comet Lake-based processor, which was manufactured on the 14-nm node. However, nowadays buyers can get Intel’s 10-nm CPUs, which offer a big boost in performance. Howbeit, the Core i5-10300H is still a very capable gaming processor.
In our Cinebench R15 loop, the CPU was able to achieve very stable, albeit rather low, clock rates. The predecessor model with the AMD Ryzen 5 4600H exhibited similar behaviour in this test. Nevertheless, the Ryzen 5 4600H in the Nitro 5 AN515-44 is 57% faster than the Core i5-10300H in our current review device in the CR15 loop. When running on battery power, the CPU performance of the Nitro 5 AN515-55 drops significantly. When plugged in, the Nitro 5 AN515-55 achieved a multi-core score of 777 points in Cinebench R15. However, when running on battery power, it only got a multi-core score of 504 points.
In the productivity benchmarks, the Core i5-10300H was trounced by the competing laptops with better CPUs. In all of our benchmarks, the Core i5-10300H performed as expected.
* ... smaller is better
System Performance
Because it does not have a very powerful CPU, the Nitro 5 achieves mediocre results in our system benchmarks. Nevertheless, in day-to-day use, the system feels very responsive and applications start very quickly.
| PCMark 8 Home Score Accelerated v2 | 5013 points | |
| PCMark 8 Work Score Accelerated v2 | 5812 points | |
| PCMark 10 Score | 5117 points | |
Help | ||
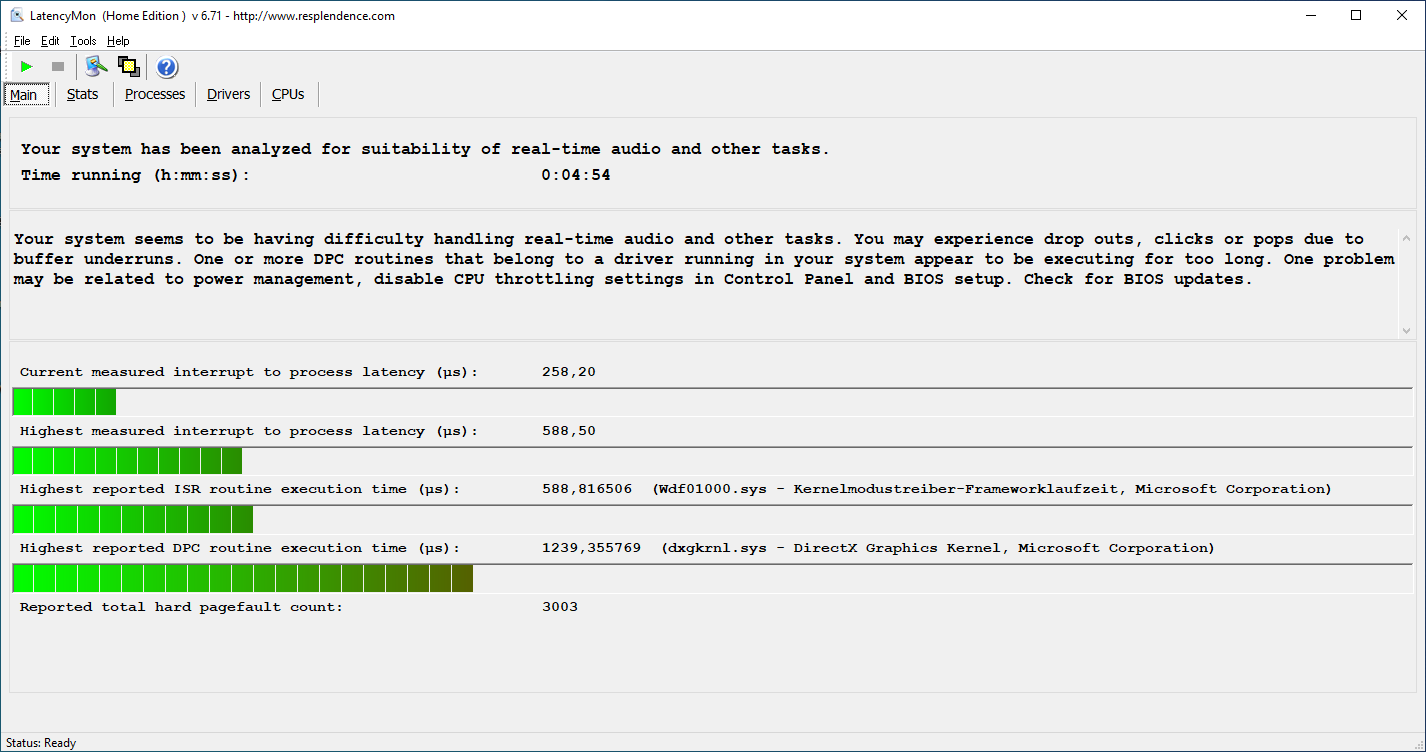
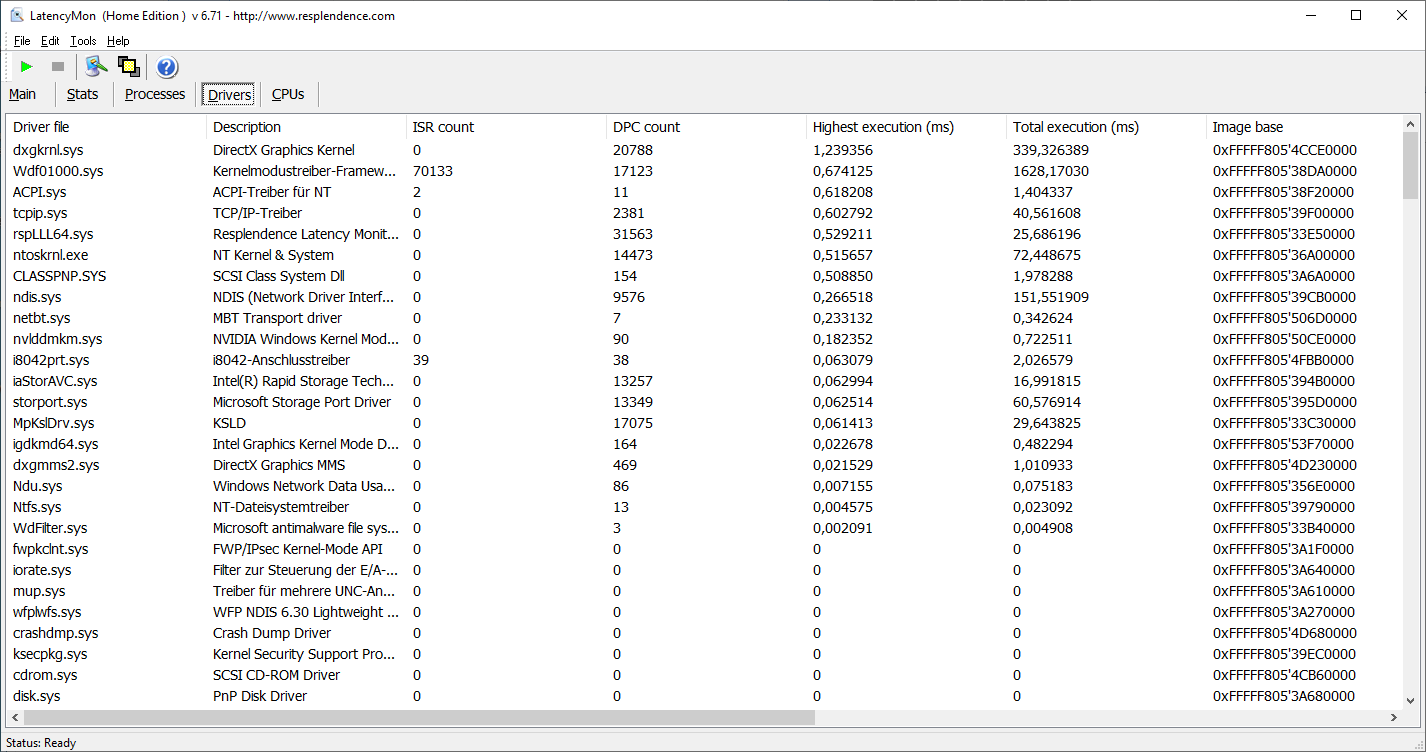
DPC Latencies
According to our DPC latency test, the Nitro 5 is not fit for work with real-time audio and video.
| DPC Latencies / LatencyMon - interrupt to process latency (max), Web, Youtube, Prime95 | |
| Asus TUF Dash F15 FX516PR | |
| Acer Nitro 5 AN515-44-R5FT | |
| MSI GF65 Thin 10UE | |
| HP Omen 15-en0375ng | |
| Acer Aspire Nitro 5 AN515-55-57GF | |
| SCHENKER XMG Core 15 Ampere | |
* ... smaller is better
Storage Devices
Our review device features a 512 GB NVMe SSD from Western Digital. However, other models come with a 1 TB SSD. In the storage benchmarks, the 512 GB SSD performs worse than the competition in almost all areas. The 4K read speed is the only exception. All in all, the SSD is fast enough to provide a very good user experience.
You can find out how the SSD in our review device stacks up against other storage devices on our HDD/SSD Benchmarks page.
| Acer Aspire Nitro 5 AN515-55-57GF WDC PC SN530 SDBPNPZ-512G | MSI GF65 Thin 10UE Samsung SSD PM981 MZVLB1T0HALR | HP Omen 15-en0375ng WDC PC SN730 SDBPNTY-512G | SCHENKER XMG Core 15 Ampere Samsung SSD 970 EVO Plus 1TB | Asus TUF Dash F15 FX516PR SK Hynix HFM001TD3JX013N | Acer Nitro 5 AN515-44-R5FT SK Hynix BC511 HFM512GDJTNI | Average WDC PC SN530 SDBPNPZ-512G | |
|---|---|---|---|---|---|---|---|
| CrystalDiskMark 5.2 / 6 | 25% | 24% | 42% | 10% | -17% | 8% | |
| Write 4K | 118 | 157.3 33% | 119.6 1% | 139.1 18% | 129.6 10% | 94.7 -20% | 170.1 ? 44% |
| Read 4K | 48.5 | 46.69 -4% | 47.4 -2% | 47.59 -2% | 44.71 -8% | 38.91 -20% | 49.4 ? 2% |
| Write Seq | 1828 | 2389 31% | 2677 46% | 2917 60% | 1929 6% | 1056 -42% | 1731 ? -5% |
| Read Seq | 1530 | 2196 44% | 2220 45% | 2586 69% | 2035 33% | 1183 -23% | 1643 ? 7% |
| Write 4K Q32T1 | 400 | 407.6 2% | 427.4 7% | 511 28% | 425.9 6% | 445.3 11% | 453 ? 13% |
| Read 4K Q32T1 | 493 | 519 5% | 549 11% | 571 16% | 433.4 -12% | 477.7 -3% | 488 ? -1% |
| Write Seq Q32T1 | 1828 | 2401 31% | 2706 48% | 3263 79% | 1390 -24% | 1063 -42% | 1791 ? -2% |
| Read Seq Q32T1 | 2128 | 3344 57% | 2869 35% | 3567 68% | 3505 65% | 2154 1% | 2272 ? 7% |
| AS SSD | 96% | 90% | 127% | 53% | 18% | 19% | |
| Seq Read | 1479 | 3002 103% | 2255 52% | 2829 91% | 2671 81% | 1504 2% | 1862 ? 26% |
| Seq Write | 1715 | 2420 41% | 2129 24% | 2646 54% | 1501 -12% | 1064 -38% | 1392 ? -19% |
| 4K Read | 27.8 | 48.46 74% | 49.5 78% | 54.8 97% | 39.65 43% | 51.5 85% | 42.1 ? 51% |
| 4K Write | 106 | 114.3 8% | 175.1 65% | 179.1 69% | 69 -35% | 123.2 16% | 163.8 ? 55% |
| 4K-64 Read | 406 | 1873 361% | 1463 260% | 1734 327% | 1209 198% | 703 73% | 813 ? 100% |
| 4K-64 Write | 1119 | 1882 68% | 2061 84% | 2396 114% | 1650 47% | 730 -35% | 876 ? -22% |
| Access Time Read * | 0.128 | 0.045 65% | 0.138 -8% | 0.033 74% | 0.093 27% | 0.064 50% | 0.07875 ? 38% |
| Access Time Write * | 0.04 | 0.101 -153% | 0.022 45% | 0.021 47% | 0.055 -38% | 0.031 22% | 0.08225 ? -106% |
| Score Read | 581 | 2221 282% | 1738 199% | 2072 257% | 1516 161% | 905 56% | 1041 ? 79% |
| Score Write | 1396 | 2238 60% | 2449 75% | 2839 103% | 1869 34% | 960 -31% | 1179 ? -16% |
| Score Total | 2294 | 5565 143% | 5075 121% | 5965 160% | 4105 79% | 2321 1% | 2738 ? 19% |
| Total Average (Program / Settings) | 61% /
66% | 57% /
62% | 85% /
91% | 32% /
35% | 1% /
3% | 14% /
14% |
* ... smaller is better

Continuous read speed: DiskSpd Read Loop, Queue Depth 8
Graphics Card
The Nvidia GeForce RTX 3060 (Mobile) is a high-end GPU, which is based on Nvidia’s new Ampere architecture. It offers a significant boost in performance when compared to last generation GPUs. It has 6 GB of GDDR6 video memory and an 85-W TGP.
The Schenker XMG Core 15 is outperforming the rest of the competition in the 3DMark benchmarks because it features an RTX 3060 with a 120-W TGP. The Nitro 5 beats its predecessor by more than 50% and can keep up with the 85-W RTX 3070 in the Asus TUF Dash F15 in certain benchmarks.
When running on battery power, there is a significant drop in GPU performance.
| 3DMark 11 Performance | 18128 points | |
| 3DMark Cloud Gate Standard Score | 29248 points | |
| 3DMark Fire Strike Score | 15376 points | |
| 3DMark Time Spy Score | 6529 points | |
Help | ||
Gaming Performance
Acer’s gaming laptop can handle all modern titles at 1080p on high settings. It can run some esports titles at 144 FPS. However, the RTX 3060 cannot achieve playable frame rates in Cyberpunk 2077 with RT effects enabled. Without DLSS, it can hit only 23 FPS on average. All in all, the RTX 3060 in the Nitro 5 is a capable gaming GPU.
| The Witcher 3 | |
| 1920x1080 High Graphics & Postprocessing (Nvidia HairWorks Off) | |
| Average of class Gaming (17.5 - 449, n=165, last 2 years) | |
| SCHENKER XMG Core 15 Ampere | |
| Average NVIDIA GeForce RTX 3060 Laptop GPU (81 - 186.8, n=41) | |
| MSI GF65 Thin 10UE | |
| Acer Aspire Nitro 5 AN515-55-57GF | |
| Asus TUF Dash F15 FX516PR | |
| HP Omen 15-en0375ng | |
| 1920x1080 Ultra Graphics & Postprocessing (HBAO+) | |
| Average of class Gaming (8.61 - 216, n=224, last 2 years) | |
| SCHENKER XMG Core 15 Ampere | |
| Average NVIDIA GeForce RTX 3060 Laptop GPU (58.2 - 91.5, n=48) | |
| Asus TUF Dash F15 FX516PR | |
| Acer Aspire Nitro 5 AN515-55-57GF | |
| MSI GF65 Thin 10UE | |
| HP Omen 15-en0375ng | |
In our gaming stress test with The Witcher 3, we saw a significant drop in performance halfway through. This was probably caused by some sort of system issue.
| low | med. | high | ultra | |
| GTA V (2015) | 171 | 162 | 130 | 74 |
| The Witcher 3 (2015) | 276 | 208 | 133 | 72.9 |
| Dota 2 Reborn (2015) | 139 | 122 | 116 | 113 |
| Final Fantasy XV Benchmark (2018) | 128 | 94.6 | 72.5 | |
| X-Plane 11.11 (2018) | 86 | 76.6 | 66.2 | |
| Far Cry 5 (2018) | 129 | 101 | 96 | 91 |
| Strange Brigade (2018) | 295 | 179 | 143 | 124 |
| Cyberpunk 2077 1.0 (2020) | 101 | 70.4 | 57.9 | 48.9 |
Emissions - Dynamic fan speed control
System Noise
When idle, the fans are inaudible. Under load, the fans ramp up slowly. They do not produce a lot of high-frequency noise, but they also do not sound particularly quiet. The fans take a while to ramp down. There are no abnormal noises such as coil whine to report.
Noise Level
| Idle |
| 25 / 30 / 33 dB(A) |
| Load |
| 46 / 50 dB(A) |
 | ||
30 dB silent 40 dB(A) audible 50 dB(A) loud |
||
min: | ||
Temperature
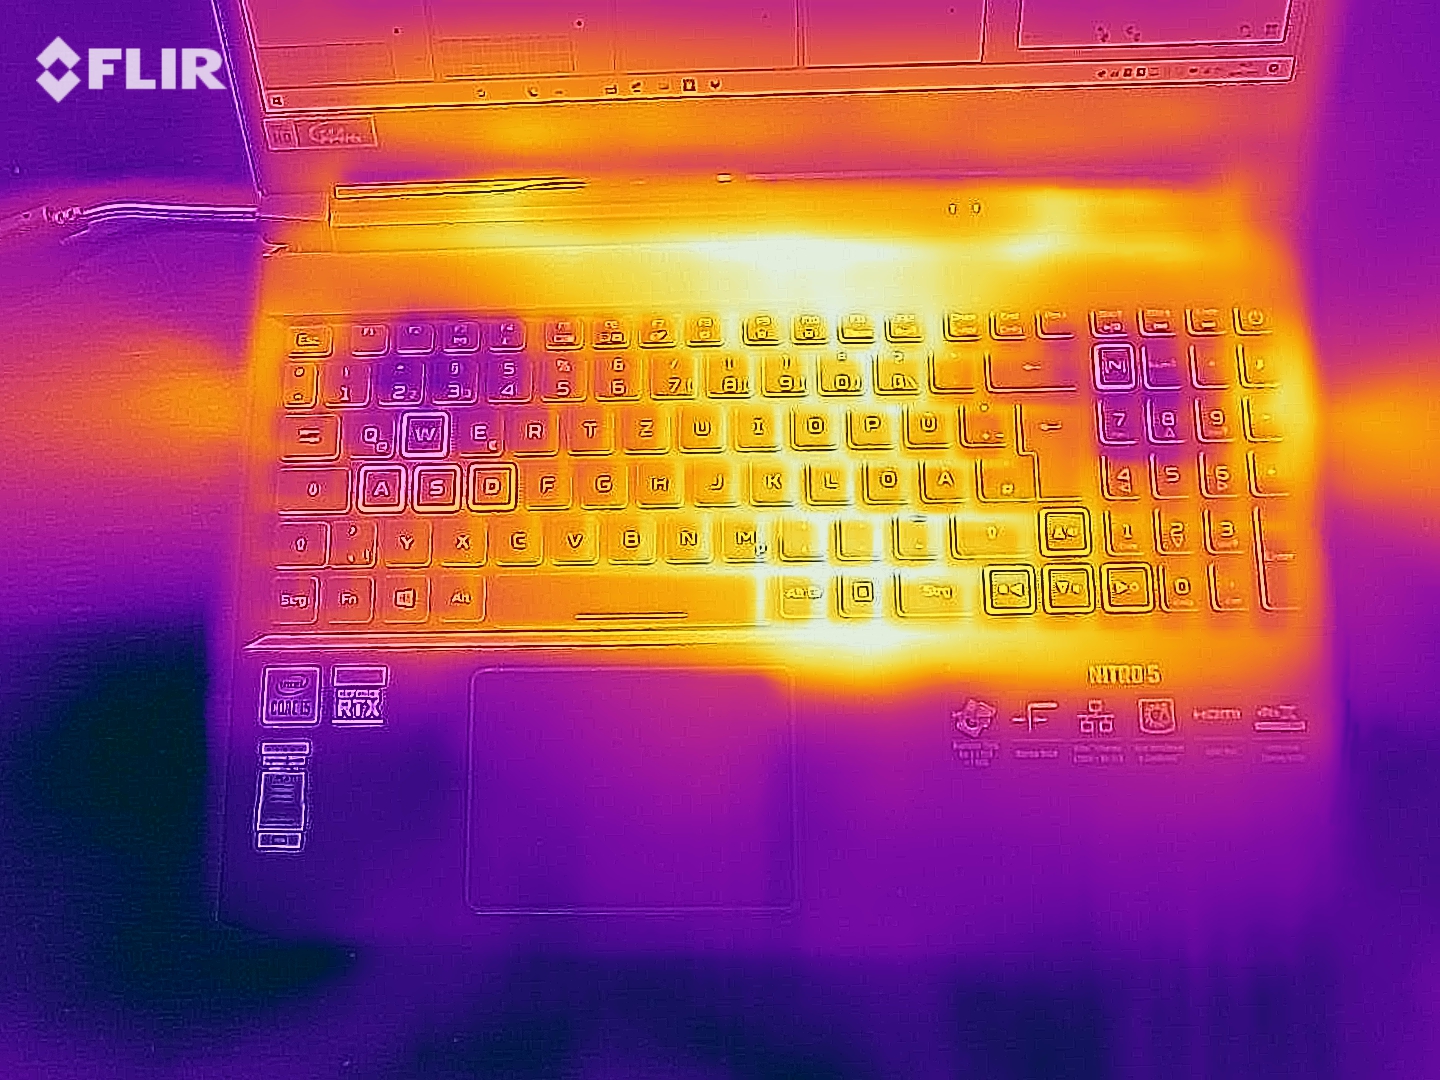
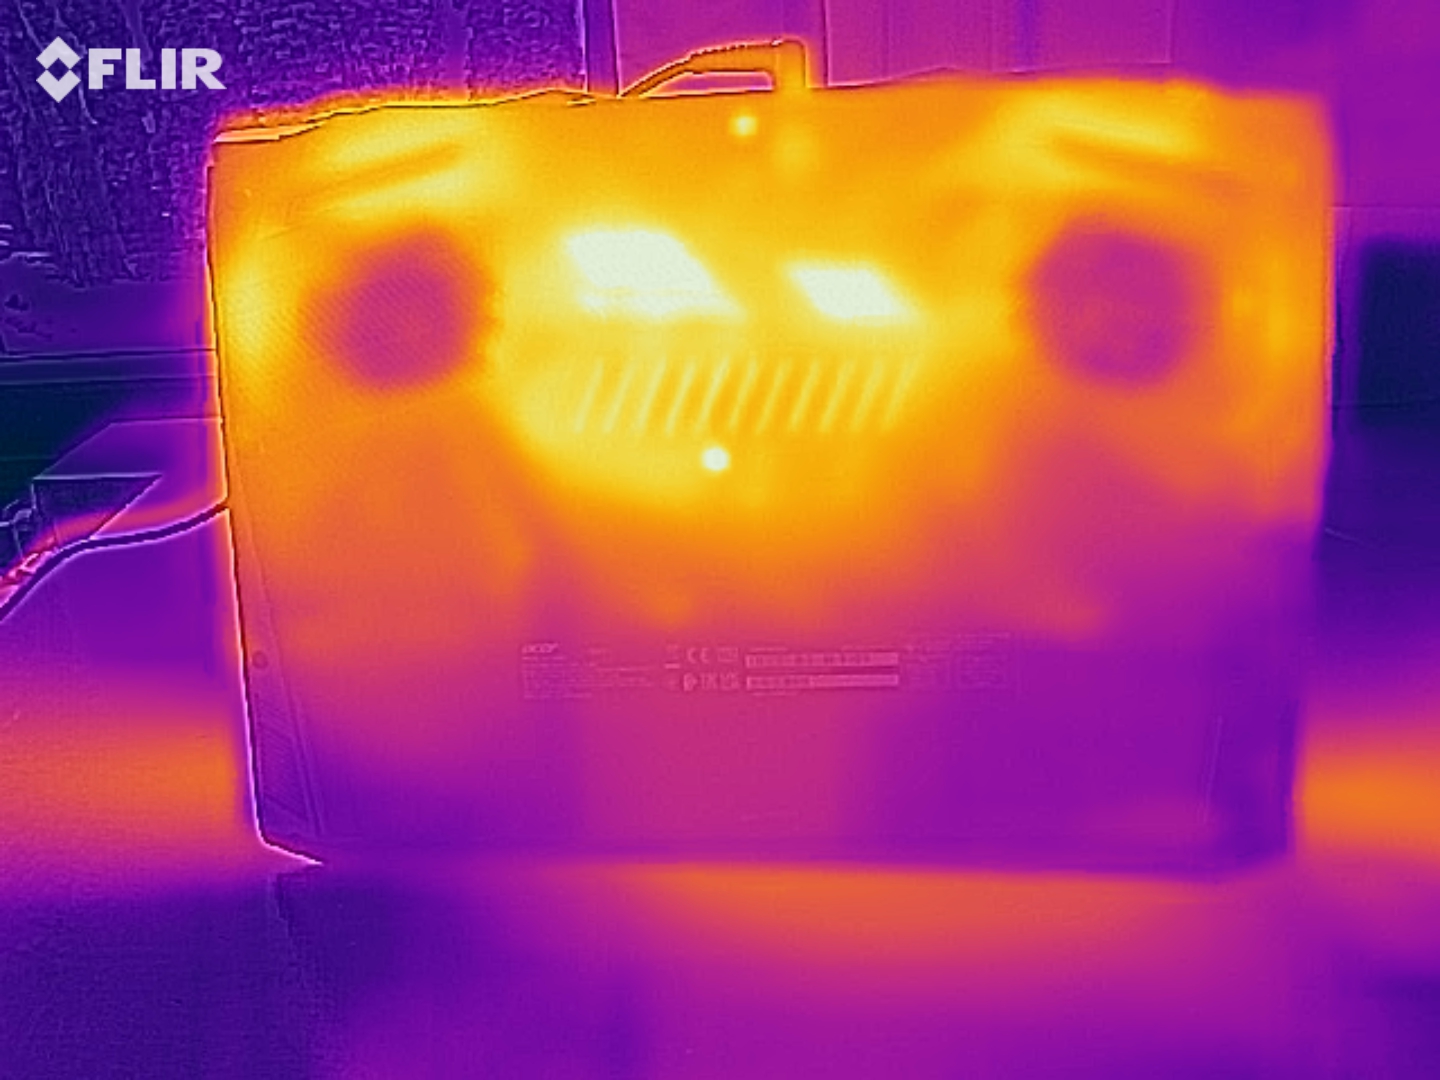
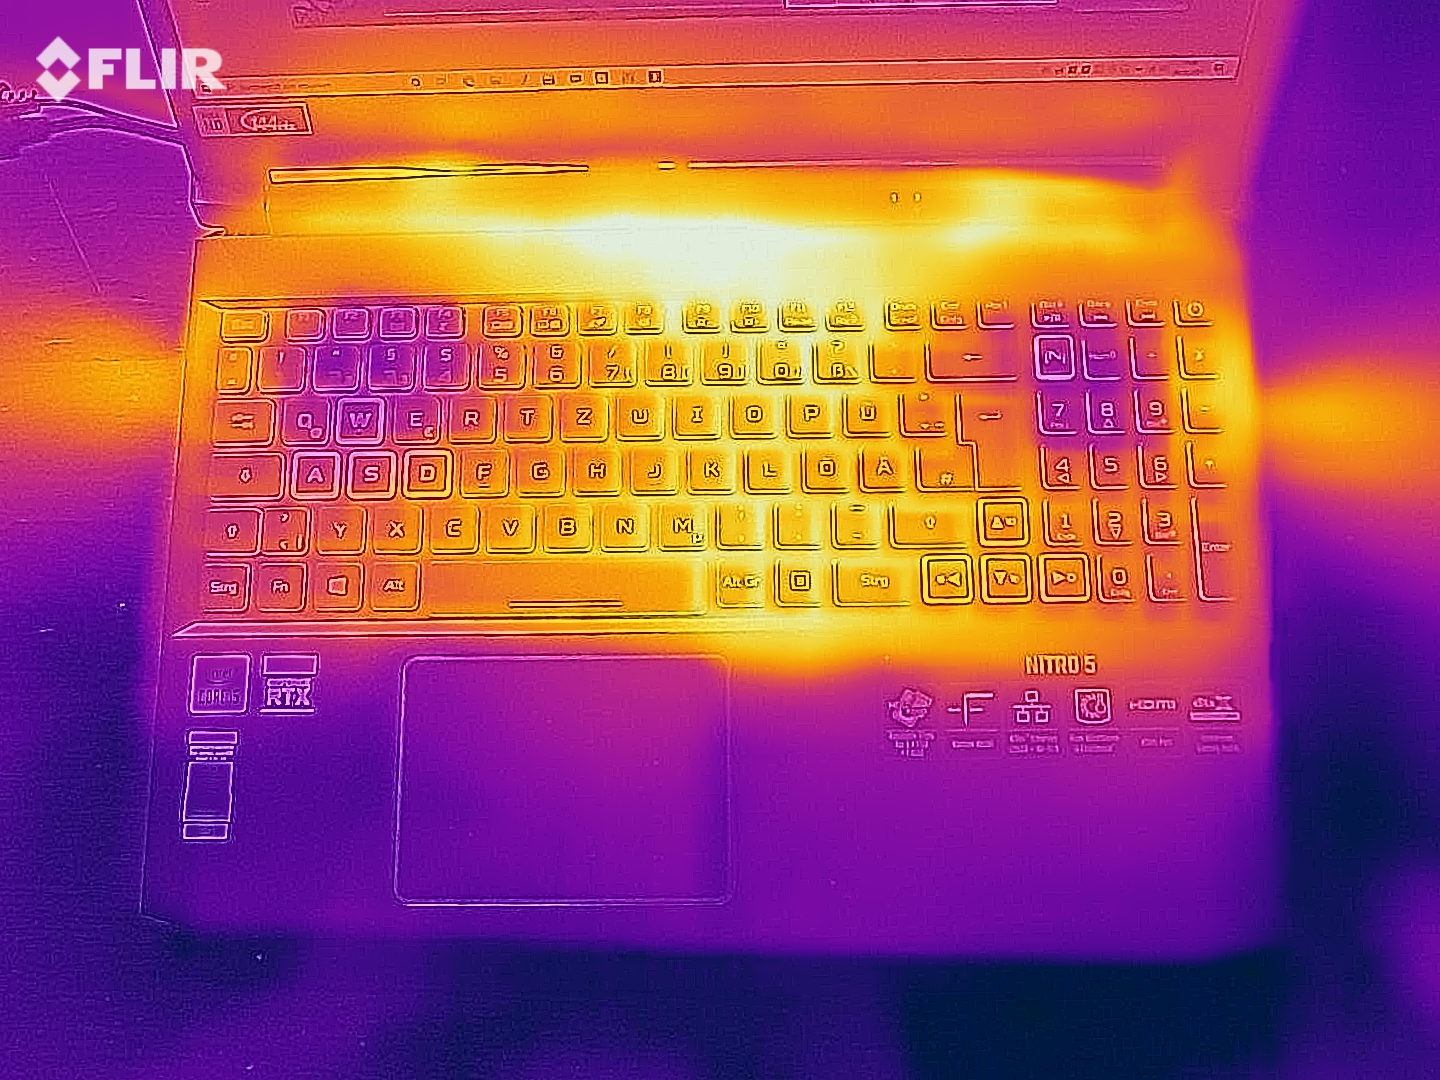
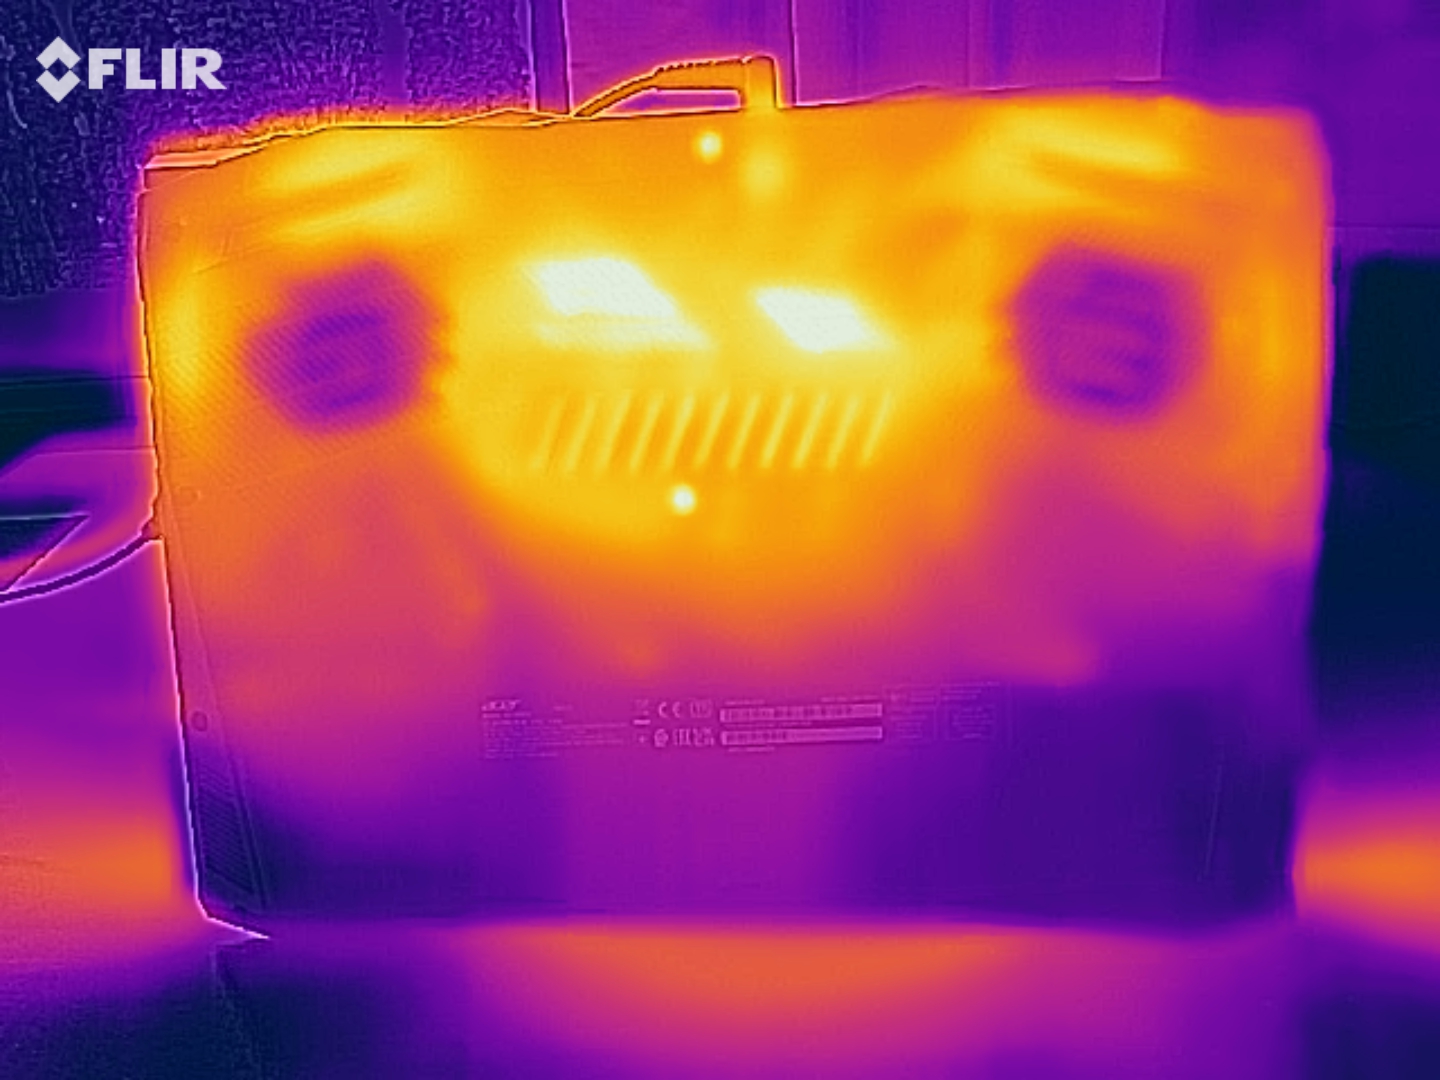
Under load, the underside of the device gets hottest (49-51 °C; 120.2-123.8 °F), especially in the area near the screen. We saw these surface temperatures during both our gaming stress test with The Witcher 3 and our stress test with Prime95 and FurMark. The right side and the middle of the wrist rest area reach up to 37 °C (98.6 °F), which is quite warm. However, the left side does not get as warm, peaking at only 28 °C (82.4 °F).
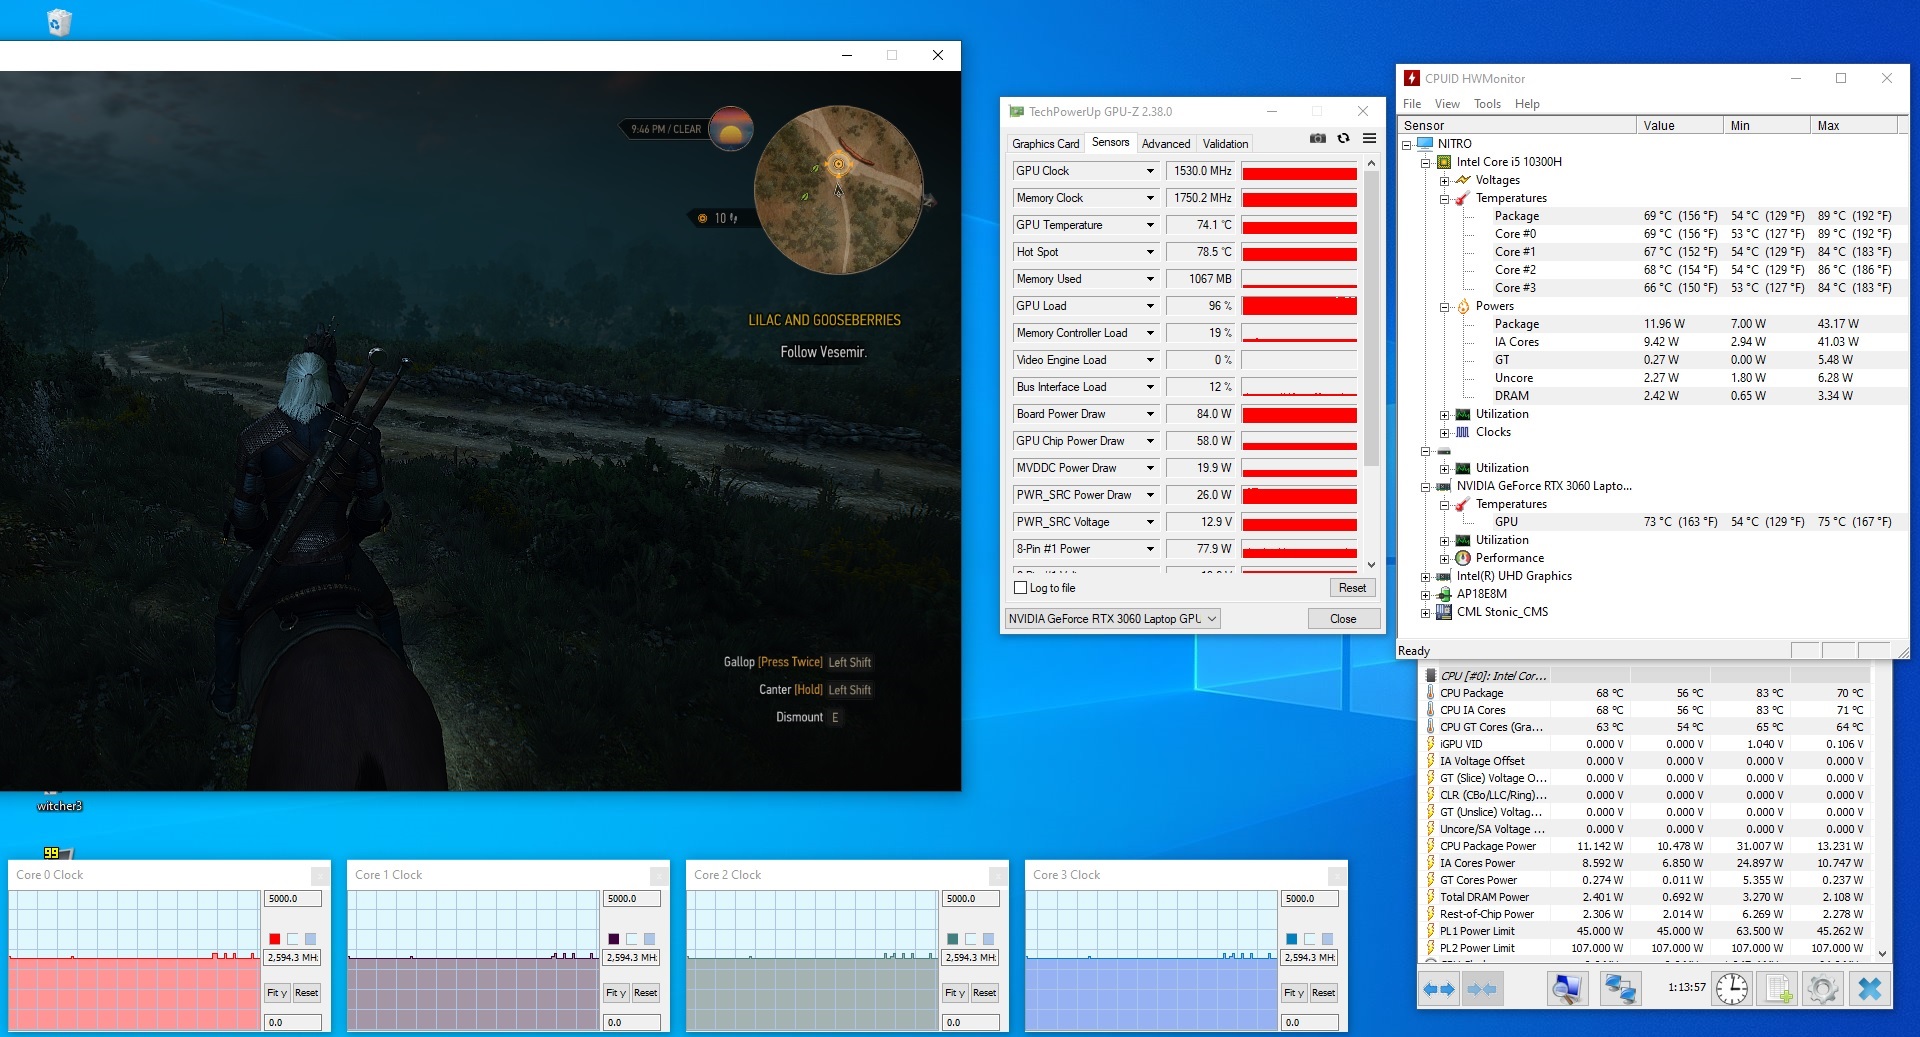
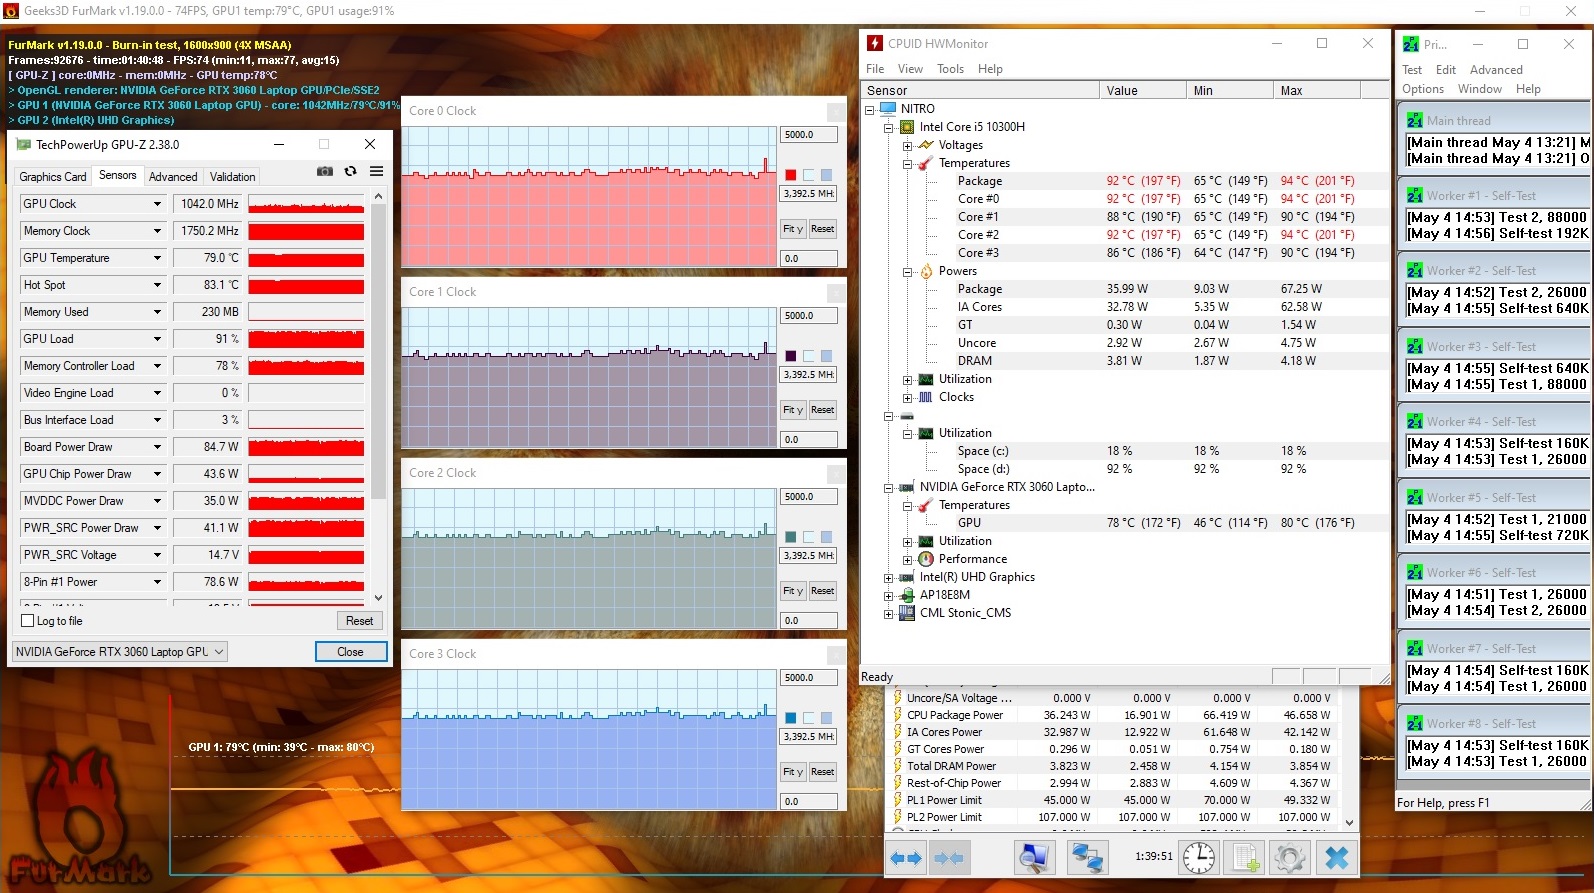
At the beginning of our stress test (Prime95 and FurMark running continuously for at least one hour), the processor operated at 4.2 GHz and the GPU ran at 1425 MHz. After a short while, the CPU hit 90 °C (194 °F) and started to throttle down to keep itself within the conservative operating range set by Acer. In the meantime, the GPU temperatures slowly climbed to 79 °C (174.2 °F). Eventually, the GPU clocks settled at around 800 MHz, occasionally spiking to 1400 MHz. Over the course of our stress test, the average CPU clock rate amounted to 3.4 GHz and the average GPU clock rate was 1040 MHz.
Note: The GPU frequency fluctuated between 200 and 1750 MHz during our stress test.
(-) The maximum temperature on the upper side is 49 °C / 120 F, compared to the average of 40.4 °C / 105 F, ranging from 21.2 to 68.8 °C for the class Gaming.
(-) The bottom heats up to a maximum of 51 °C / 124 F, compared to the average of 43.2 °C / 110 F
(+) In idle usage, the average temperature for the upper side is 25 °C / 77 F, compared to the device average of 33.8 °C / 93 F.
(-) Playing The Witcher 3, the average temperature for the upper side is 40.8 °C / 105 F, compared to the device average of 33.8 °C / 93 F.
(±) The palmrests and touchpad can get very hot to the touch with a maximum of 37 °C / 98.6 F.
(-) The average temperature of the palmrest area of similar devices was 28.9 °C / 84 F (-8.1 °C / -14.6 F).
Speakers
The Acer Nitro 5 AN515-55 comes with two 2-W speakers. They do not produce a lot of bass but still sound acceptable. The maximum volume is on a good level. Users can connect external audio devices via a USB port, the included 3.5-mm audio jack or Bluetooth.
Acer Aspire Nitro 5 AN515-55-57GF audio analysis
(±) | speaker loudness is average but good (76 dB)
Bass 100 - 315 Hz
(-) | nearly no bass - on average 15.9% lower than median
(±) | linearity of bass is average (9% delta to prev. frequency)
Mids 400 - 2000 Hz
(±) | higher mids - on average 9.7% higher than median
(±) | linearity of mids is average (9% delta to prev. frequency)
Highs 2 - 16 kHz
(+) | balanced highs - only 2% away from median
(+) | highs are linear (4.5% delta to prev. frequency)
Overall 100 - 16.000 Hz
(±) | linearity of overall sound is average (22.8% difference to median)
Compared to same class
» 79% of all tested devices in this class were better, 6% similar, 15% worse
» The best had a delta of 6%, average was 18%, worst was 132%
Compared to all devices tested
» 62% of all tested devices were better, 6% similar, 31% worse
» The best had a delta of 4%, average was 25%, worst was 134%
MSI GF65 Thin 10UE audio analysis
(±) | speaker loudness is average but good (80.7 dB)
Bass 100 - 315 Hz
(-) | nearly no bass - on average 19.6% lower than median
(-) | bass is not linear (16.1% delta to prev. frequency)
Mids 400 - 2000 Hz
(+) | balanced mids - only 3.2% away from median
(±) | linearity of mids is average (7.6% delta to prev. frequency)
Highs 2 - 16 kHz
(+) | balanced highs - only 3.6% away from median
(±) | linearity of highs is average (8.6% delta to prev. frequency)
Overall 100 - 16.000 Hz
(±) | linearity of overall sound is average (17.9% difference to median)
Compared to same class
» 52% of all tested devices in this class were better, 9% similar, 40% worse
» The best had a delta of 6%, average was 18%, worst was 132%
Compared to all devices tested
» 31% of all tested devices were better, 8% similar, 61% worse
» The best had a delta of 4%, average was 25%, worst was 134%
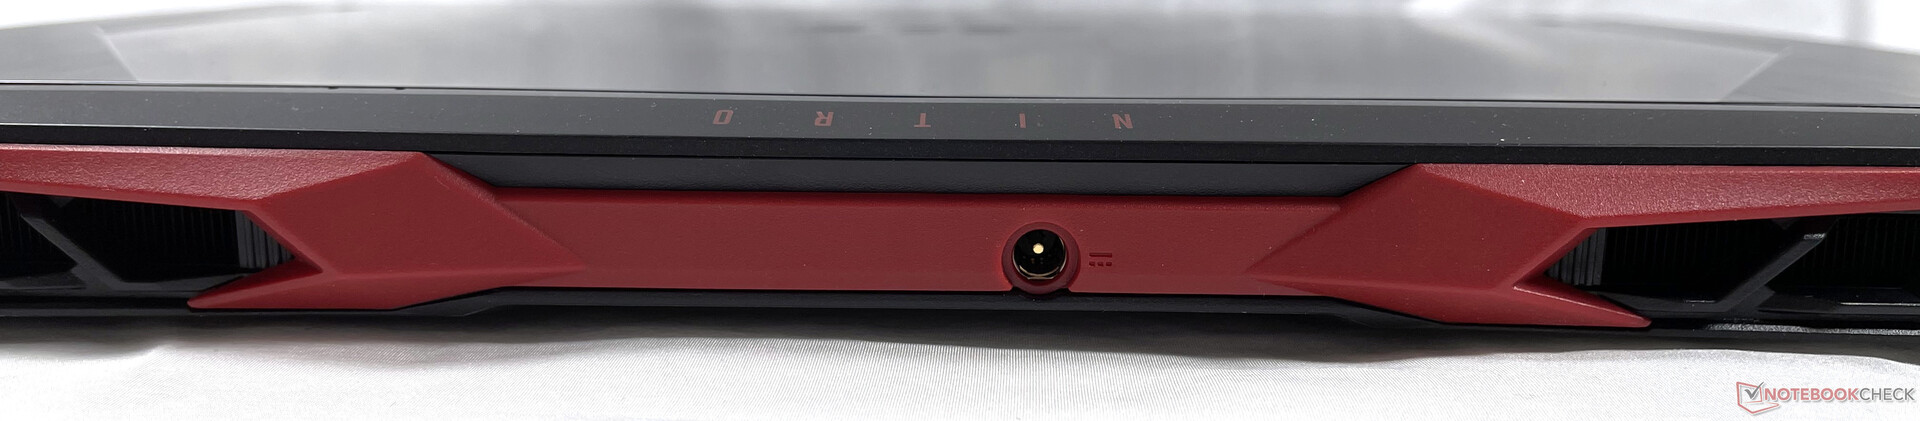
Energy Management - Small battery
Energy Consumption
When idle, the average power draw amounted to 9 W—a good result. The energy consumption peaked at 190 W. The rated output of the AC adapter is 180 W. We would like to point out that our measurements do not account for any efficiency losses that may be attributable to VRMs or any other components.
| Off / Standby | |
| Idle | |
| Load |
|
| Acer Aspire Nitro 5 AN515-55-57GF i5-10300H, GeForce RTX 3060 Laptop GPU | MSI GF65 Thin 10UE i7-10750H, GeForce RTX 3060 Laptop GPU | HP Omen 15-en0375ng R7 4800H, GeForce RTX 2060 Mobile | SCHENKER XMG Core 15 Ampere R7 4800H, GeForce RTX 3060 Laptop GPU | Asus TUF Dash F15 FX516PR i7-11370H, GeForce RTX 3070 Laptop GPU | Average of class Gaming | |
|---|---|---|---|---|---|---|
| Power Consumption | -15% | -10% | -51% | -22% | -91% | |
| Idle Minimum * | 5 | 5.4 -8% | 4 20% | 11 -120% | 9 -80% | 13.7 ? -174% |
| Idle Average * | 9 | 12.8 -42% | 9 -0% | 14 -56% | 11 -22% | 19.1 ? -112% |
| Idle Maximum * | 13 | 19.5 -50% | 22 -69% | 20 -54% | 16 -23% | 26.8 ? -106% |
| Load Average * | 84 | 86.6 -3% | 102 -21% | 94 -12% | 107 -27% | 110.9 ? -32% |
| Witcher 3 ultra * | 125 | 115.7 7% | 119 5% | 167 -34% | 121 3% | |
| Load Maximum * | 190 | 175.2 8% | 182 4% | 251 -32% | 162 15% | 250 ? -32% |
* ... smaller is better
Battery Life
The 57.5-Wh battery of the Nitro 5 lasted 5h and 43m in our Wi-Fi test and 1h 28m under load. In our video test (playing back an H.264 video on a loop), the Acer laptop lasted 6h and 9m. In our battery tests, the Nitro 5 achieved slightly above-average battery runtimes for a device with such a battery capacity.
| Acer Aspire Nitro 5 AN515-55-57GF i5-10300H, GeForce RTX 3060 Laptop GPU, 57.5 Wh | MSI GF65 Thin 10UE i7-10750H, GeForce RTX 3060 Laptop GPU, 51 Wh | HP Omen 15-en0375ng R7 4800H, GeForce RTX 2060 Mobile, 70.9 Wh | SCHENKER XMG Core 15 Ampere R7 4800H, GeForce RTX 3060 Laptop GPU, 62 Wh | Asus TUF Dash F15 FX516PR i7-11370H, GeForce RTX 3070 Laptop GPU, 76 Wh | Average of class Gaming | |
|---|---|---|---|---|---|---|
| Battery Runtime | -23% | 53% | -8% | 59% | 4% | |
| H.264 | 369 | 360 -2% | 399 ? 8% | |||
| WiFi v1.3 | 343 | 276 -20% | 628 83% | 348 1% | 544 59% | 368 ? 7% |
| Load | 88 | 65 -26% | 108 23% | 69 -22% | 84.2 ? -4% | |
| Reader / Idle | 667 | 1200 | 468 | 957 | 544 ? |
Pros
Cons
Verdict - Nitro 5 has an RTX 3060 and no significant weaknesses
The matte black plastic surfaces make the Nitro 5 appear quite subdued. However, thanks to its angular design, it does not look boring at all. The build quality is on a good level, and the input devices are usable. The selection of ports is not outstanding but it is good enough for a laptop in this price bracket. The Nitro 5 does not offer any premium features.
The main draw of the Nitro 5 is, undoubtedly, the Nvidia GeForce RTX 3060 (Mobile), which Acer put in its low-priced gaming laptop. The last-generation CPU is powerful enough to allow the RTX 3060 to reach its full potential when gaming. However, we would not recommend the Core i5-10300H to anyone who needs to use a lot of productivity applications. The subpar keyboard and the small battery capacity are our main points of criticism.
With the Nitro 5, Acer wanted to achieve a good price-to-performance ratio by using an RTX 3060. At the right price, the Nitro 5 is a great gaming laptop with no major weaknesses.
In most titles, the CPU does not play a very significant role. The Nitro 5 can easily handle the latest games. The 144-Hz screen is good enough for gaming. However, it is not suitable for professional applications because of the poor colour space coverage. Even though there is a whole lot of competition in the lower mid-range segment, Acer managed to deliver an impressive gaming laptop, which covers the basics very well.
Price and Availability
The Acer Nitro 5 AN515-55 with an RTX 3060, an Intel Core i7-10750H and Windows 10 currently retails for $1299.99 on Acer’s website.
Acer Aspire Nitro 5 AN515-55-57GF
-
05/22/2021 v7
Marius Schell
More articles related to this device
Acer Aspire Nitro 5 AN515-55-57GF (Nitro 5 AN515 Series)Related Articles


Pricecompare

