 Deutsch
 English
 Español
 Français
 Italiano
 Nederlands
 Polski
 Português
 Русский
 Türkçe
 Svenska
 Chinese
 Magyar
Acer Aspire 5 A514 Laptop Review: Not Intel Comet Lake at its Best
The Aspire series is home to Acer's budget to mid-range laptops in contrast to the higher-end Swift series. It's divided into the Aspire 1 lineup of netbooks, Aspire 3 lineup of budget multimedia laptops, Aspire 5 lineup of mid-range multimedia laptops, and the Aspire 7 lineup of budget gaming laptops.
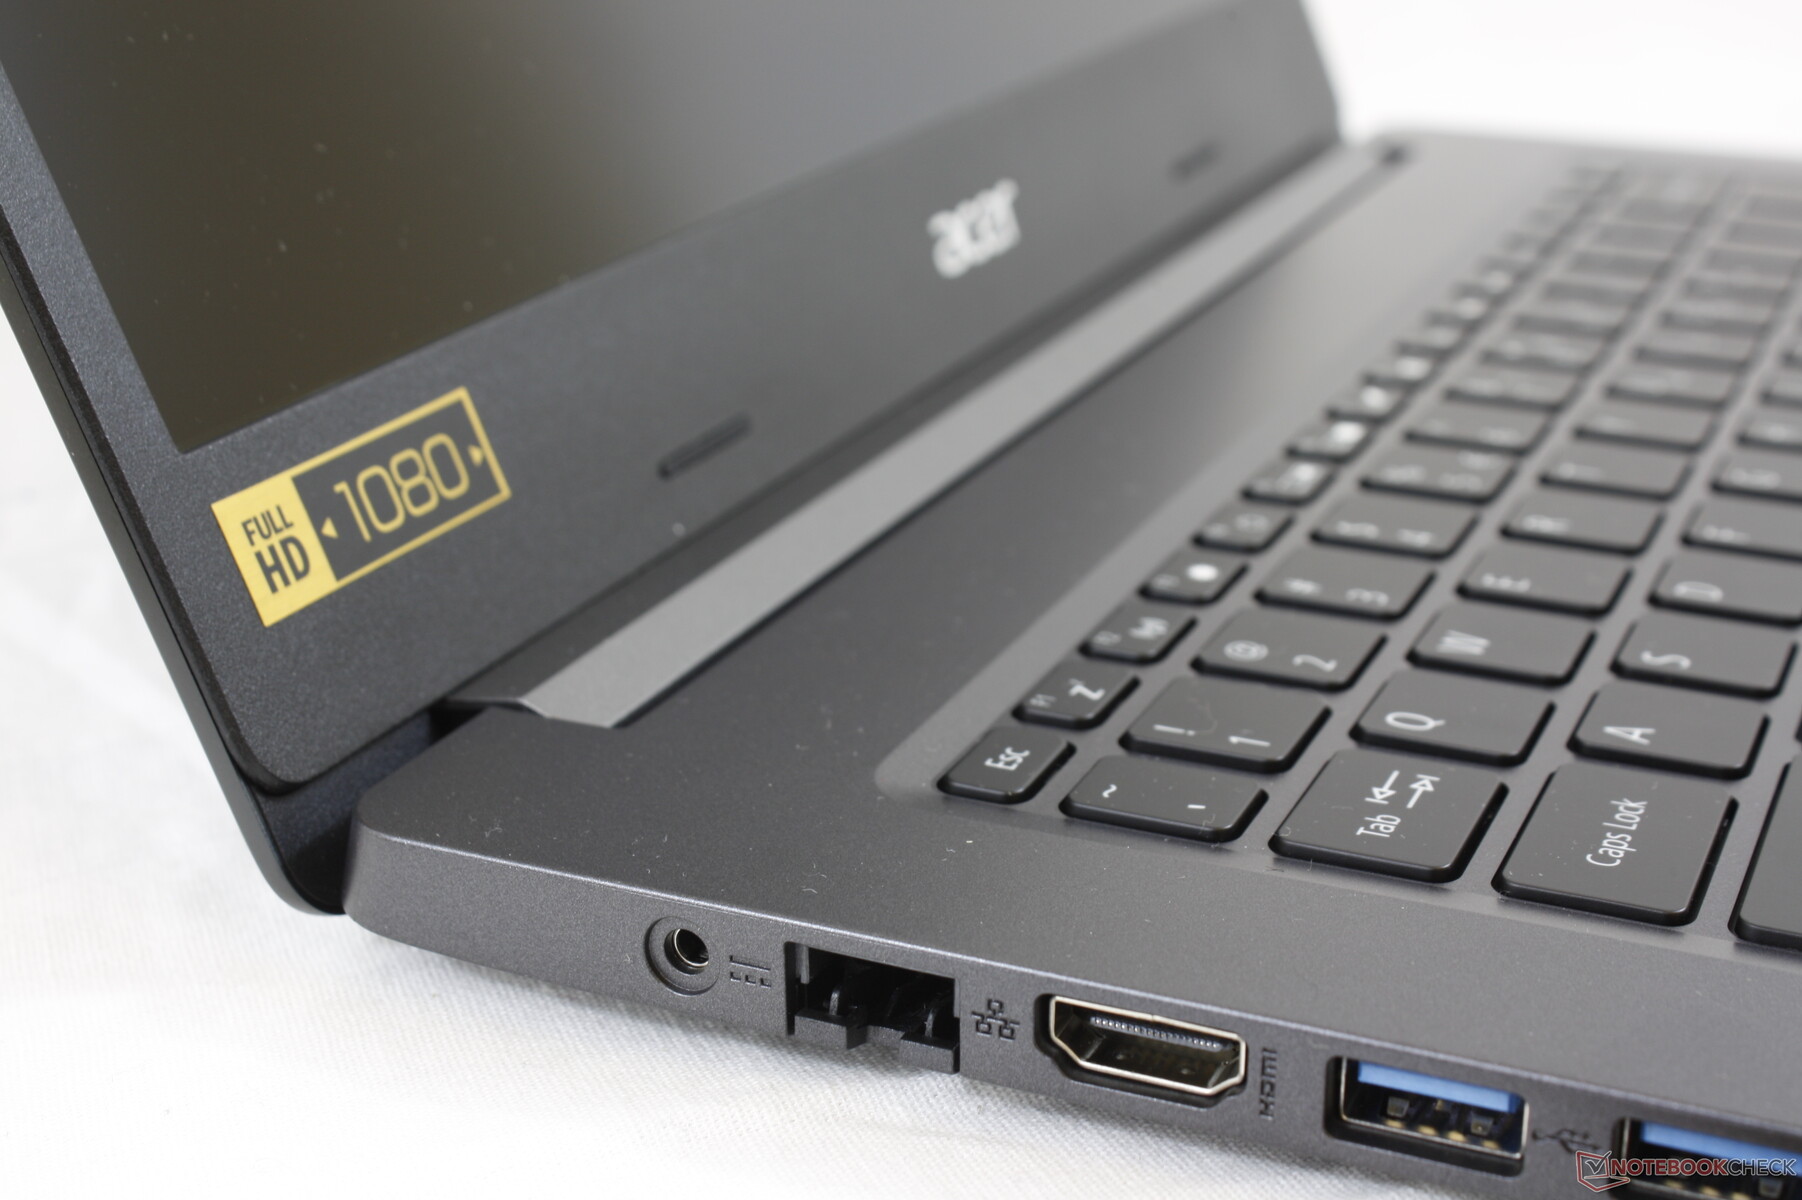
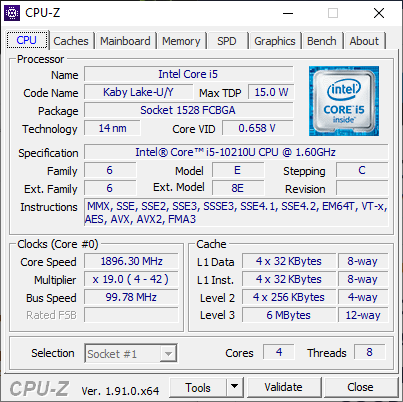
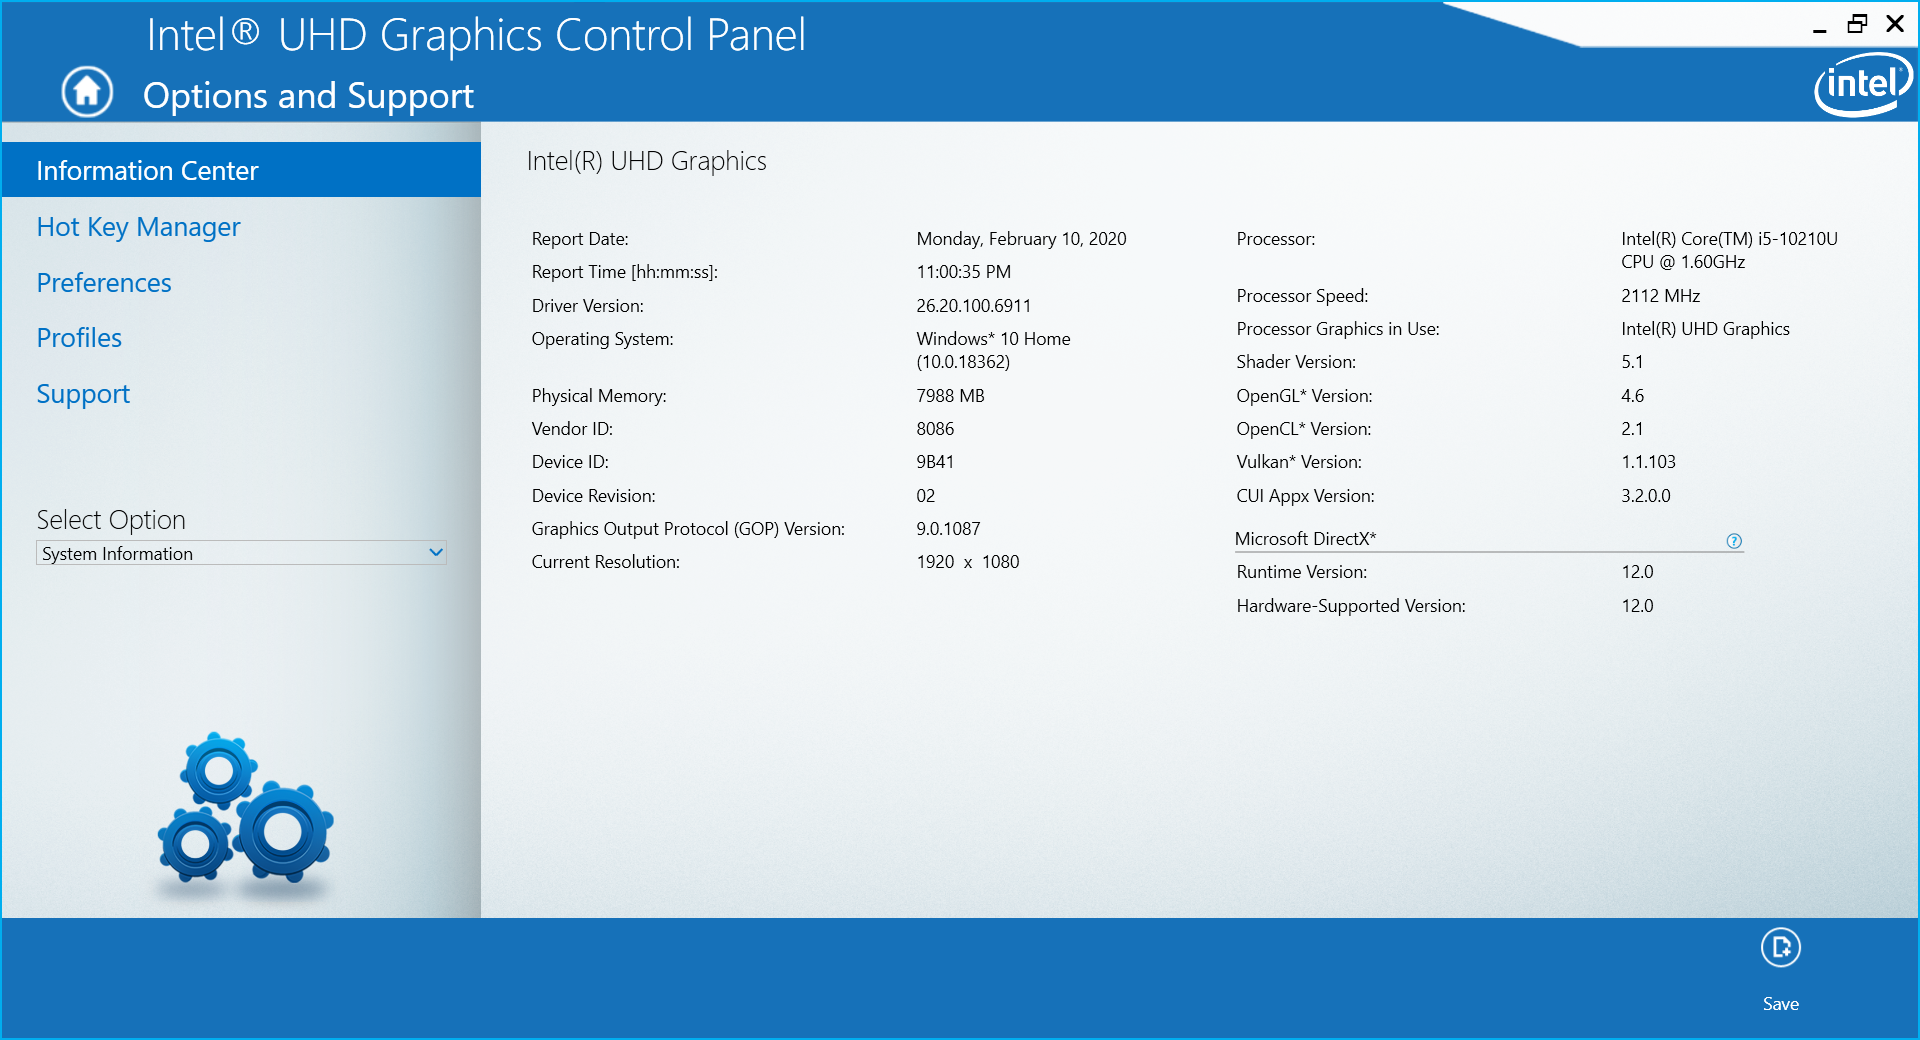
The test unit here can be found online for $700 and it comes equipped with Intel's latest 10th gen Comet Lake-U Core i5-10210U CPU to succeed the older Kaby Lake-R Core i5-8250U and Whiskey Lake-U Core i5-8265U processors. The Aspire 5 A514-52G SKUs includes discrete GeForce MX250 graphics while our A514-52 configuration does not. The FHD display is otherwise fixed across all 14-inch configurations.
Direct competitors include budget to mid-range multimedia subnotebooks like the Walmart Motile, Asus VivoBook 14, Dell Inspiron 14, HP Pavilion 14, or the Lenovo IdeaPad S540.
More Acer reviews:
Rating | Date | Model | Weight | Height | Size | Resolution | Best Price |
|---|---|---|---|---|---|---|---|
| 79.2 % | 02/2020 | Acer Aspire 5 A514-52 i5-10210U, UHD Graphics 620 | 1.7 kg | 17.95 mm | 14.00" | 1920x1080 | |
| 83.7 % | 09/2019 | Asus VivoBook 14 X403FA i5-8265U, UHD Graphics 620 | 1.3 kg | 16.5 mm | 14.00" | 1920x1080 | |
| 80.9 % | 01/2020 | MSI Modern 14 A10RB-459US i5-10210U, GeForce MX250 | 1.2 kg | 16 mm | 14.00" | 1920x1080 | |
| 74.5 % | 01/2020 | Dell Inspiron 14 3493-4KWCF i7-1065G7, GeForce MX230 | 1.8 kg | 21 mm | 14.00" | 1920x1080 | |
| 77.7 % | 11/2019 | Walmart Motile M142 R5 3500U, Vega 8 | 1.1 kg | 18 mm | 14.00" | 1920x1080 |
Case
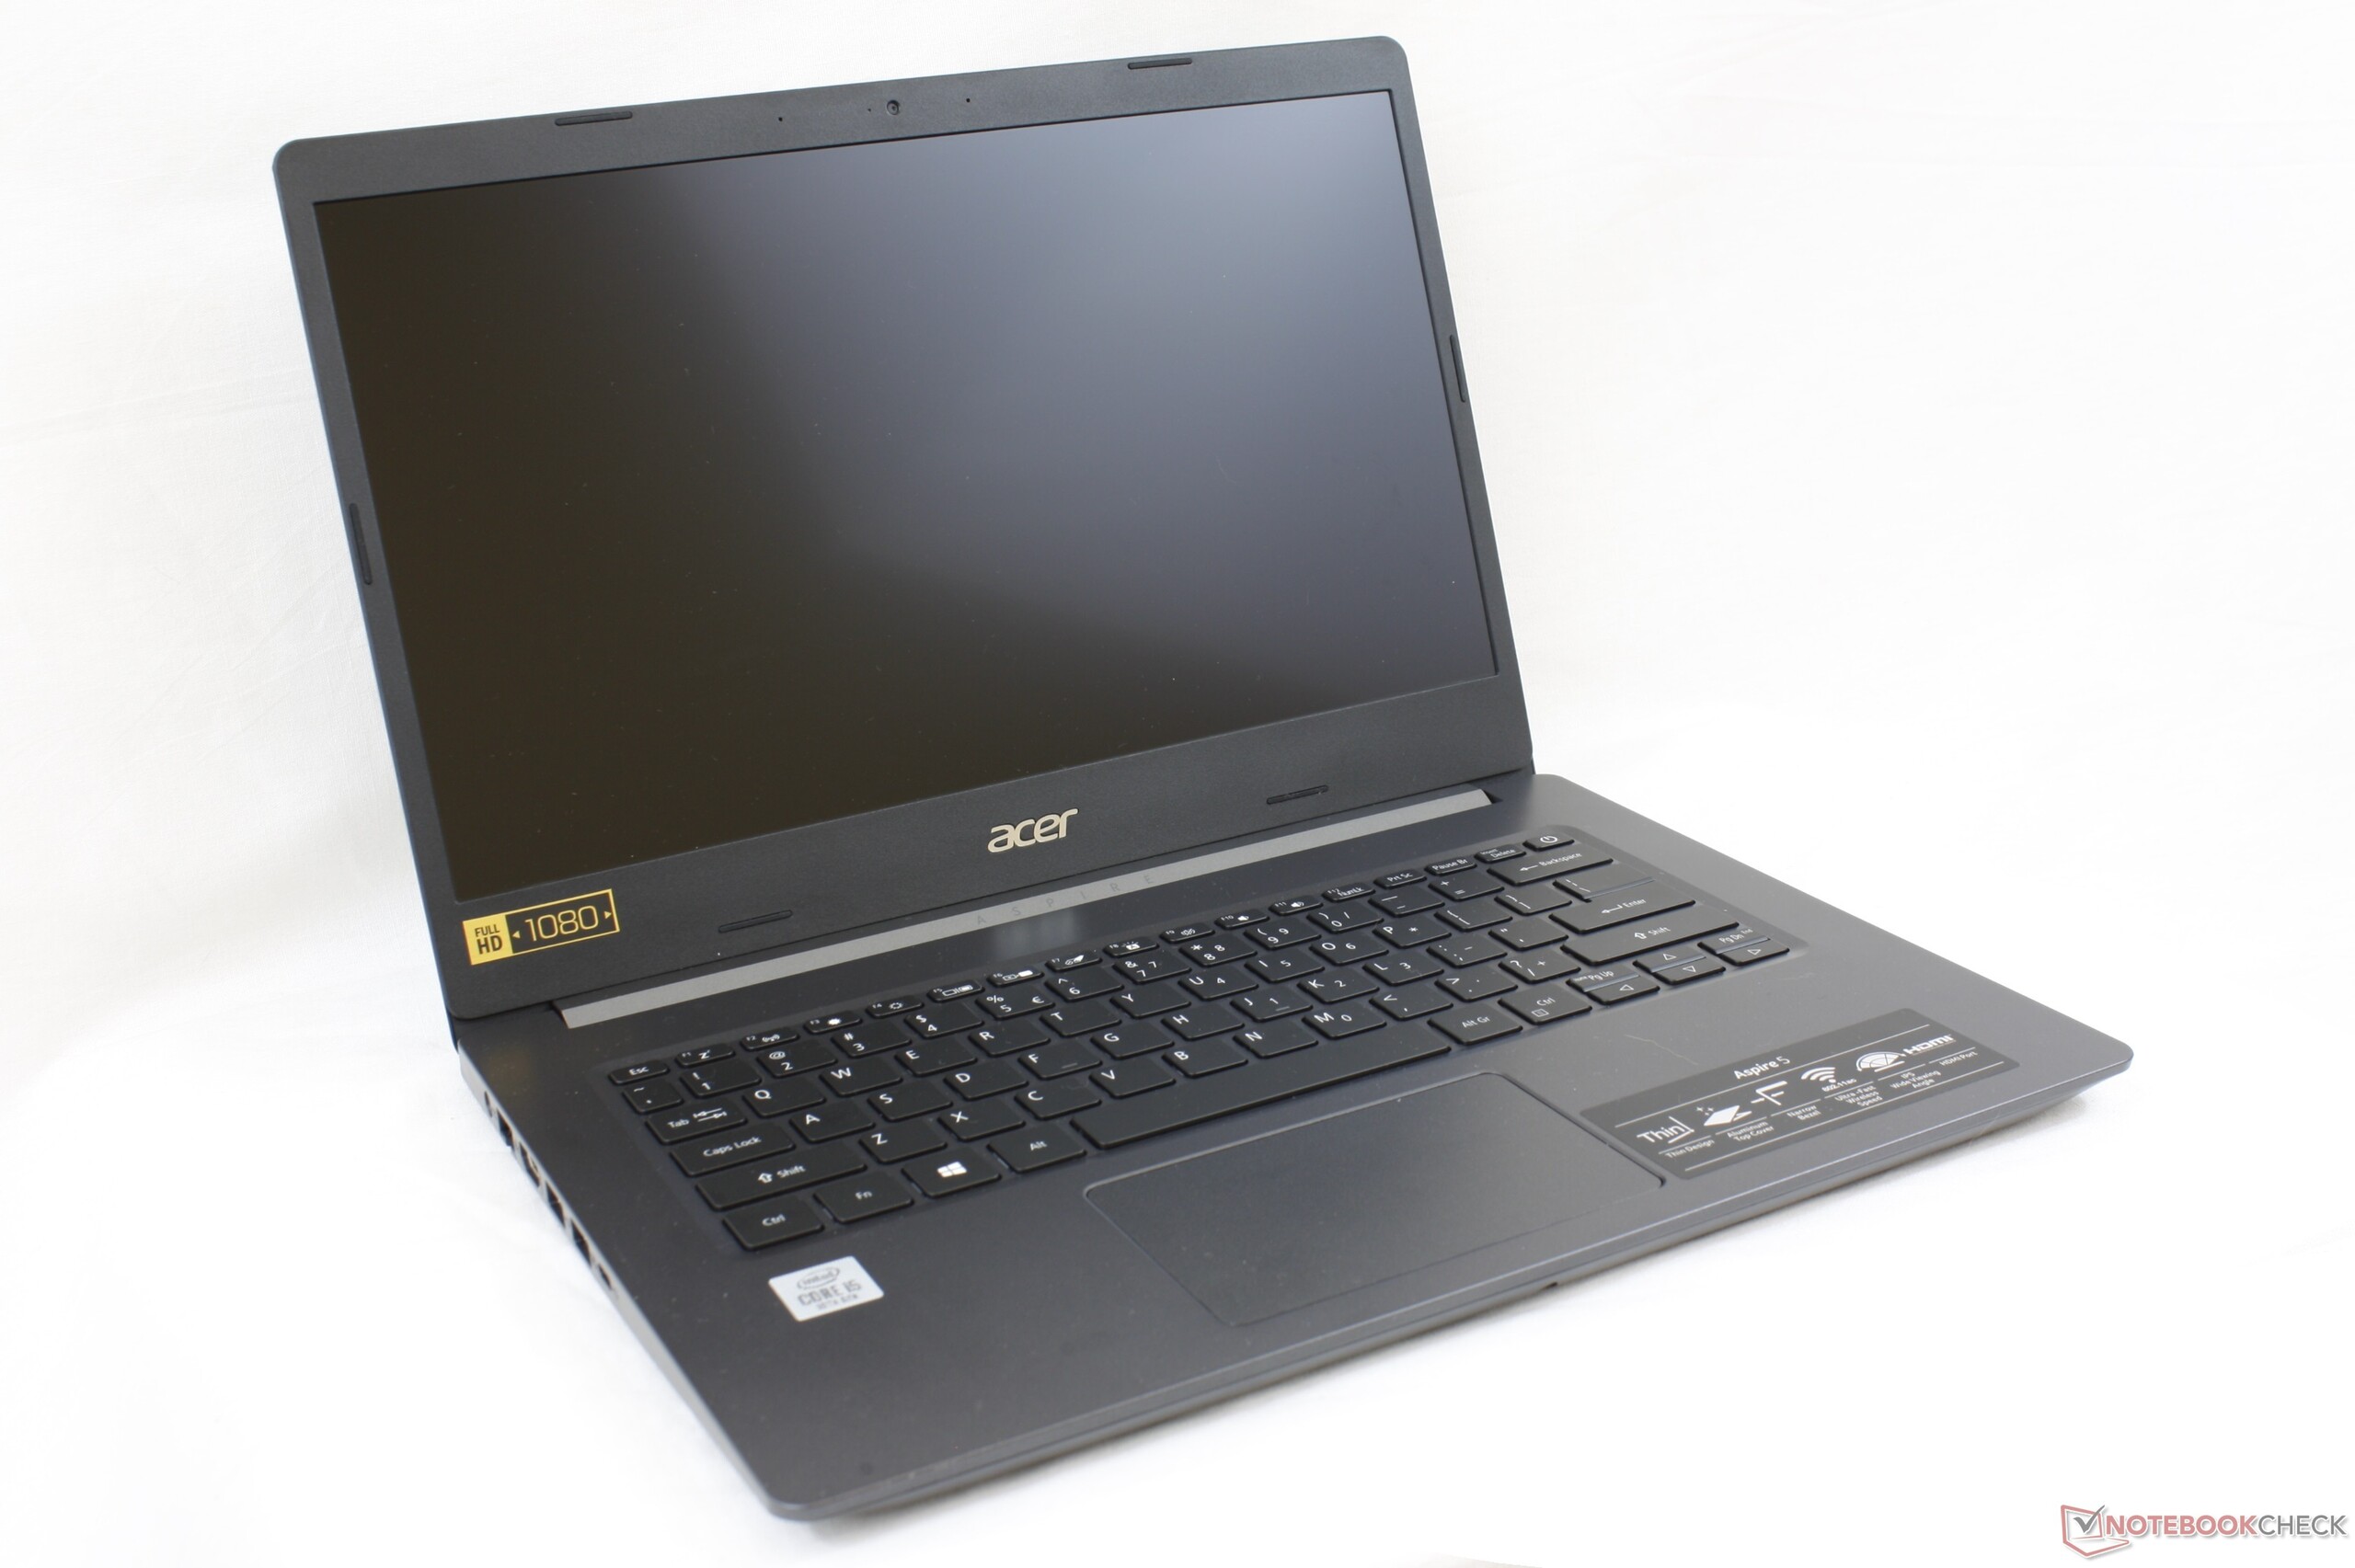
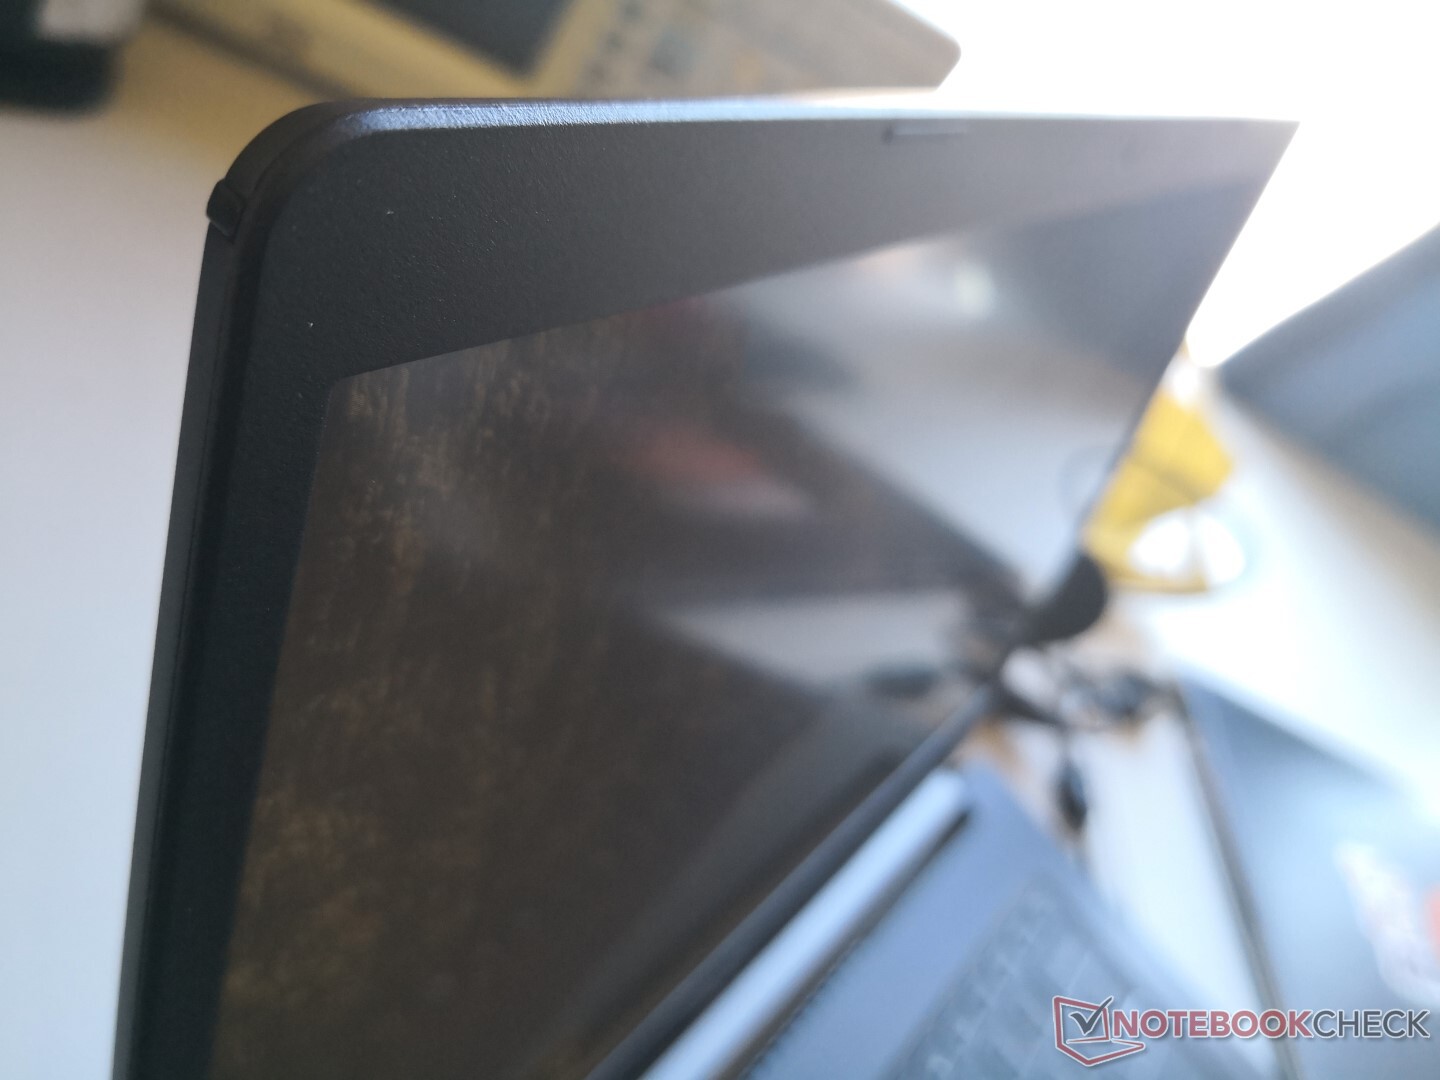
Unsurprisingly, the 14-inch Aspire 5 utilizes the same plastic chassis materials as the 15.6-inch Aspire 5 for an overall similar feel and impression. The outer lid in particular flexes more than we would like when twisting its corners or applying pressure down the outer center. We were hoping that the relatively thick display bezels would provide some additional rigidity, but that is not the case. The base also exhibits minor-but-audible creaking when attempting to twist its corners. For a budget laptop, however, these drawbacks are par for the course.
Overall chassis quality is still slightly better than both the VivoBook 14 and MateBook D as the keyboard deck feels firmer on the Acer. Hinge rigidity is uniform at all angles and stronger than expected with no teetering when typing.
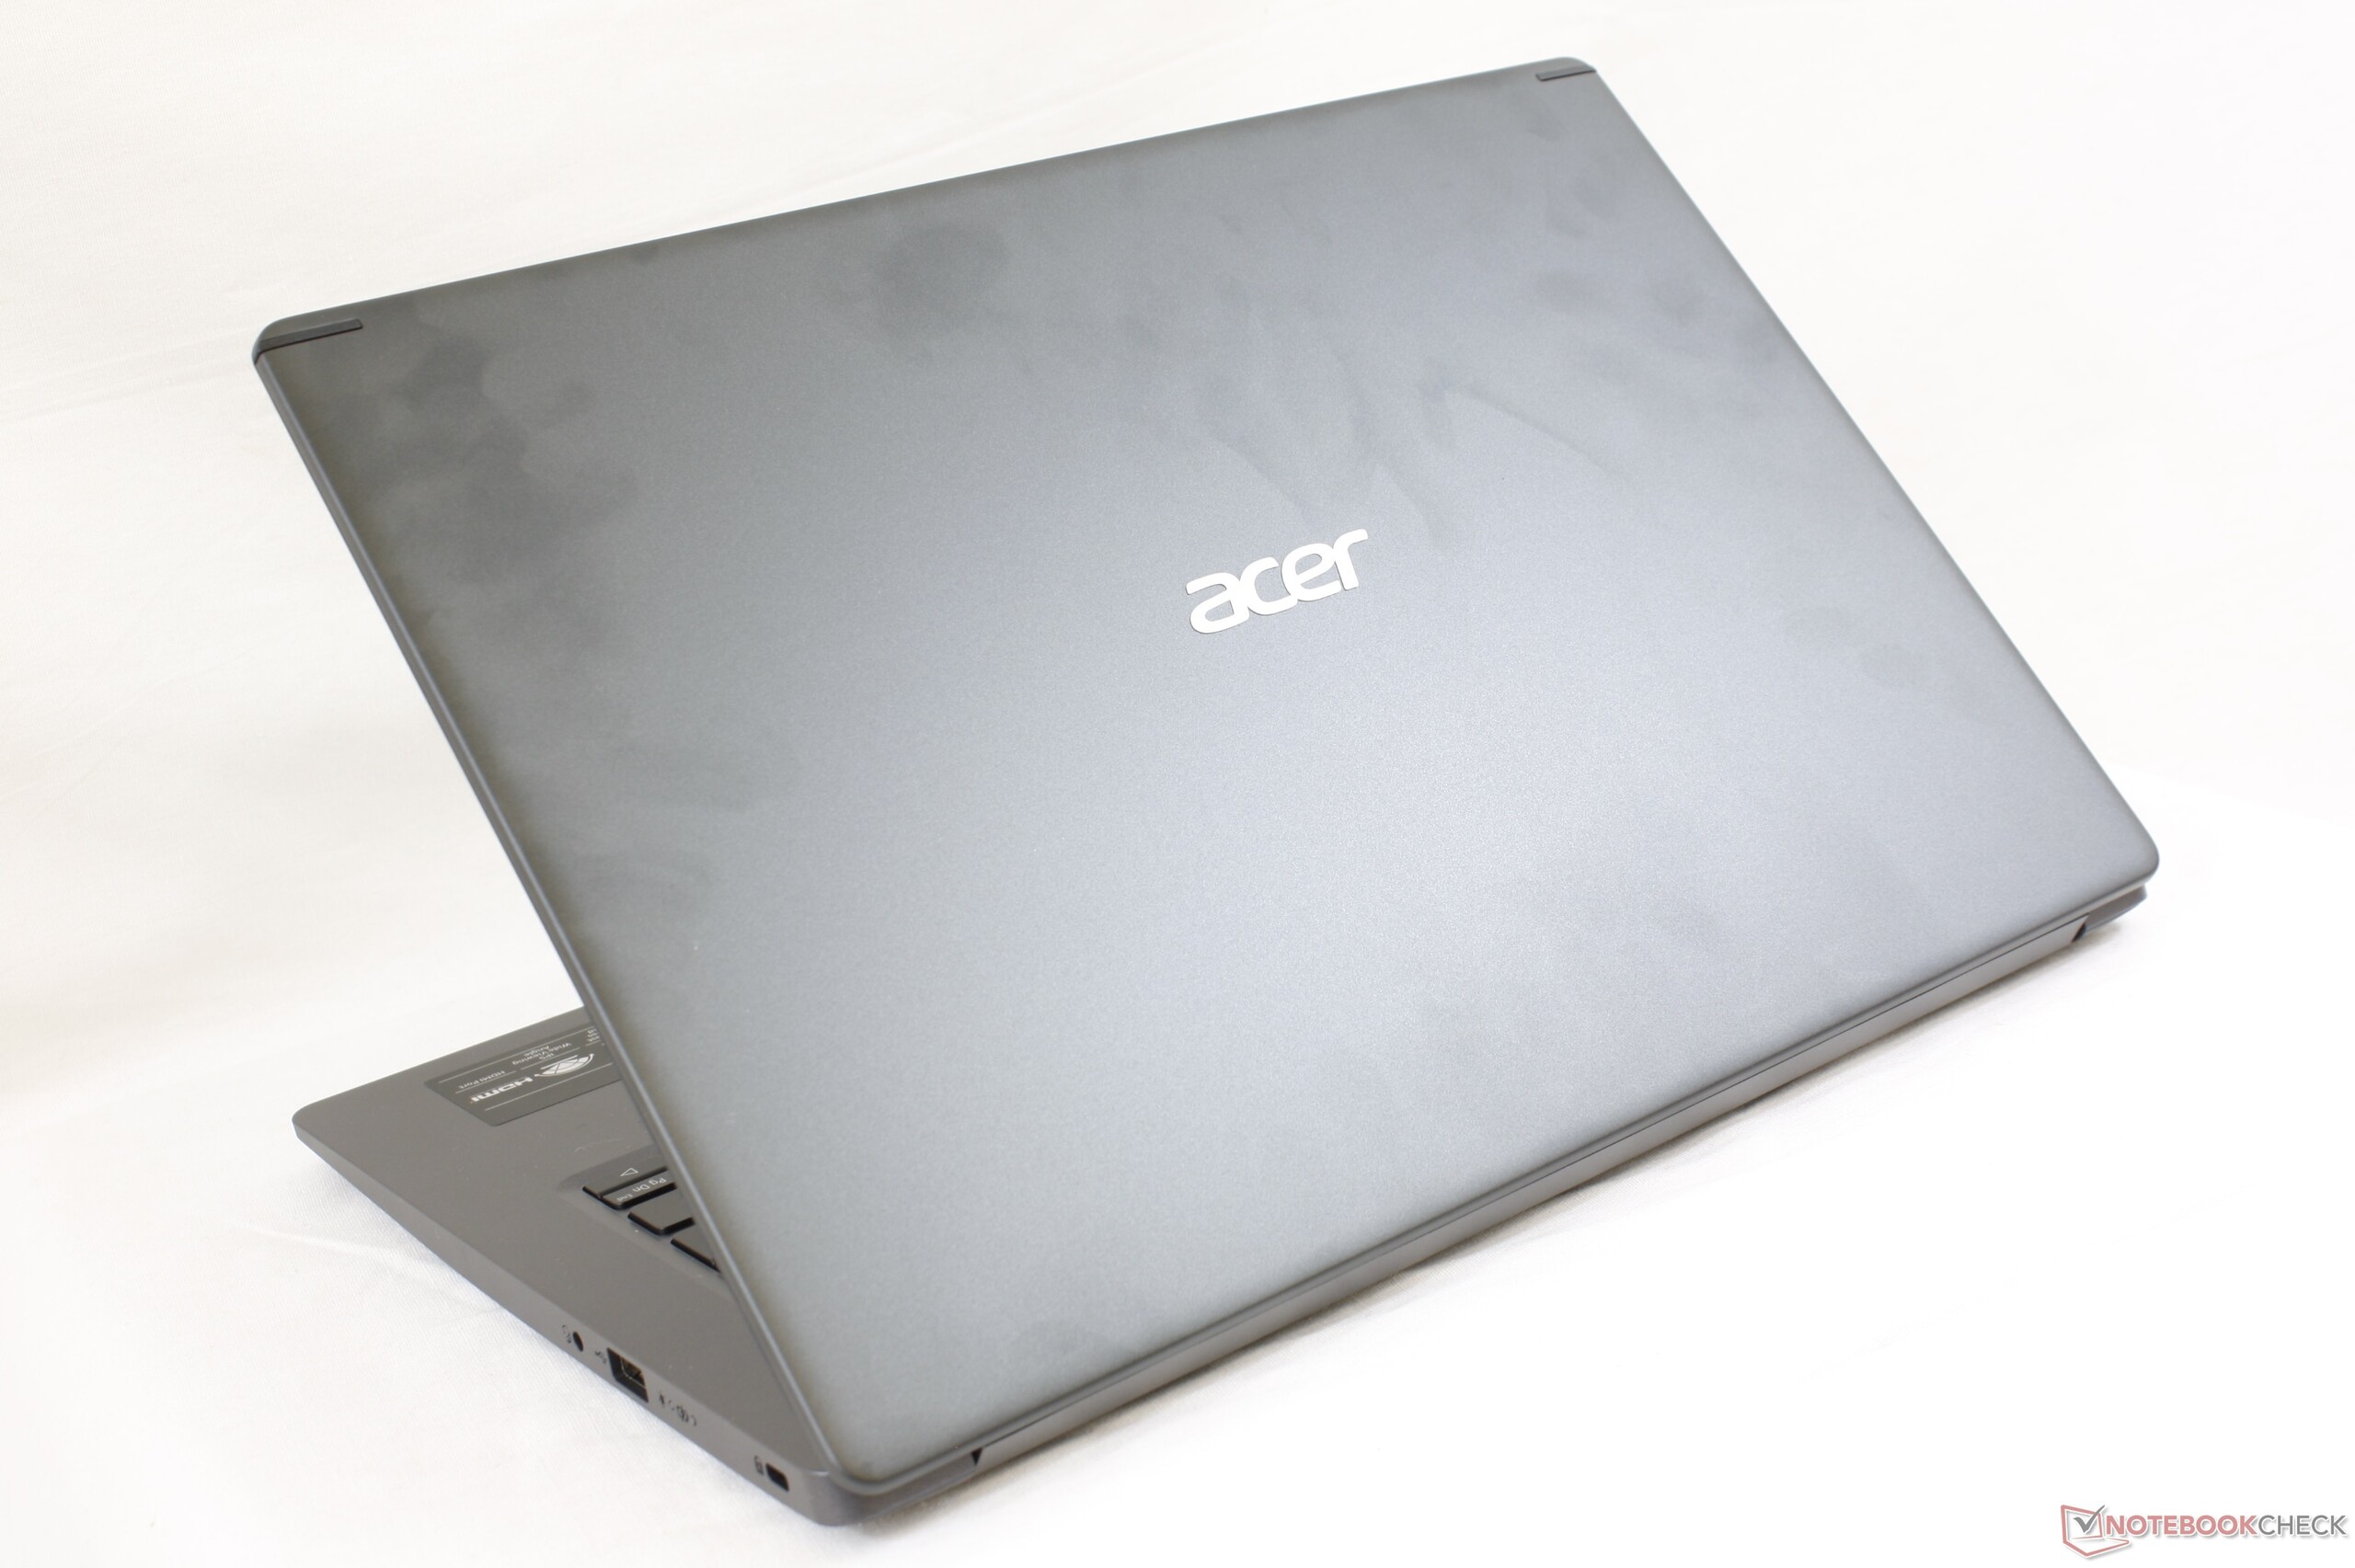
Because of the aforementioned thick bezels, the Aspire 5 is bigger and heavier than many of its competitors. The Asus VivoBook 14 and Walmart Motile, for example, are 400 g and 600 g lighter, respectively, to be easier to carry than our Acer. The Lenovo IdeaPad C340 convertible and Dell Inspiron 14 are each closer in weight and size.
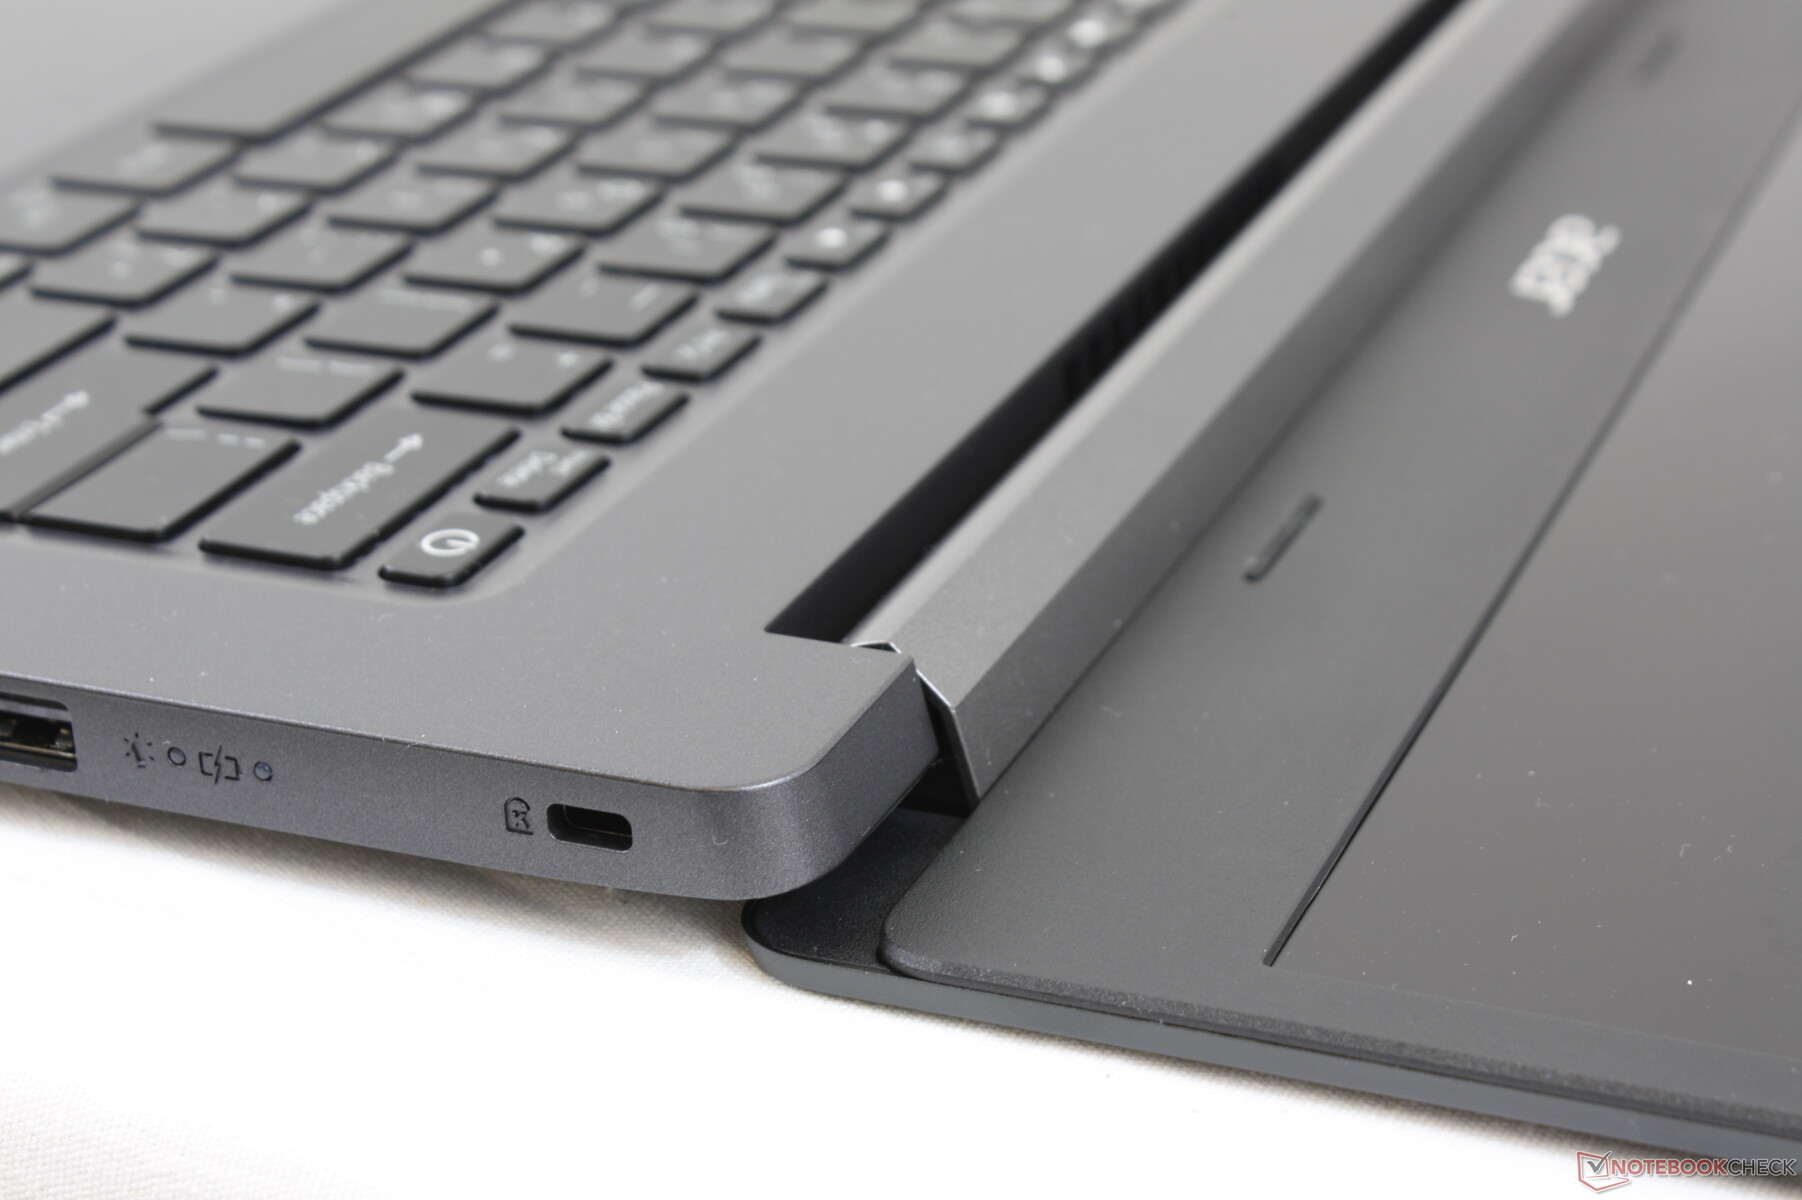
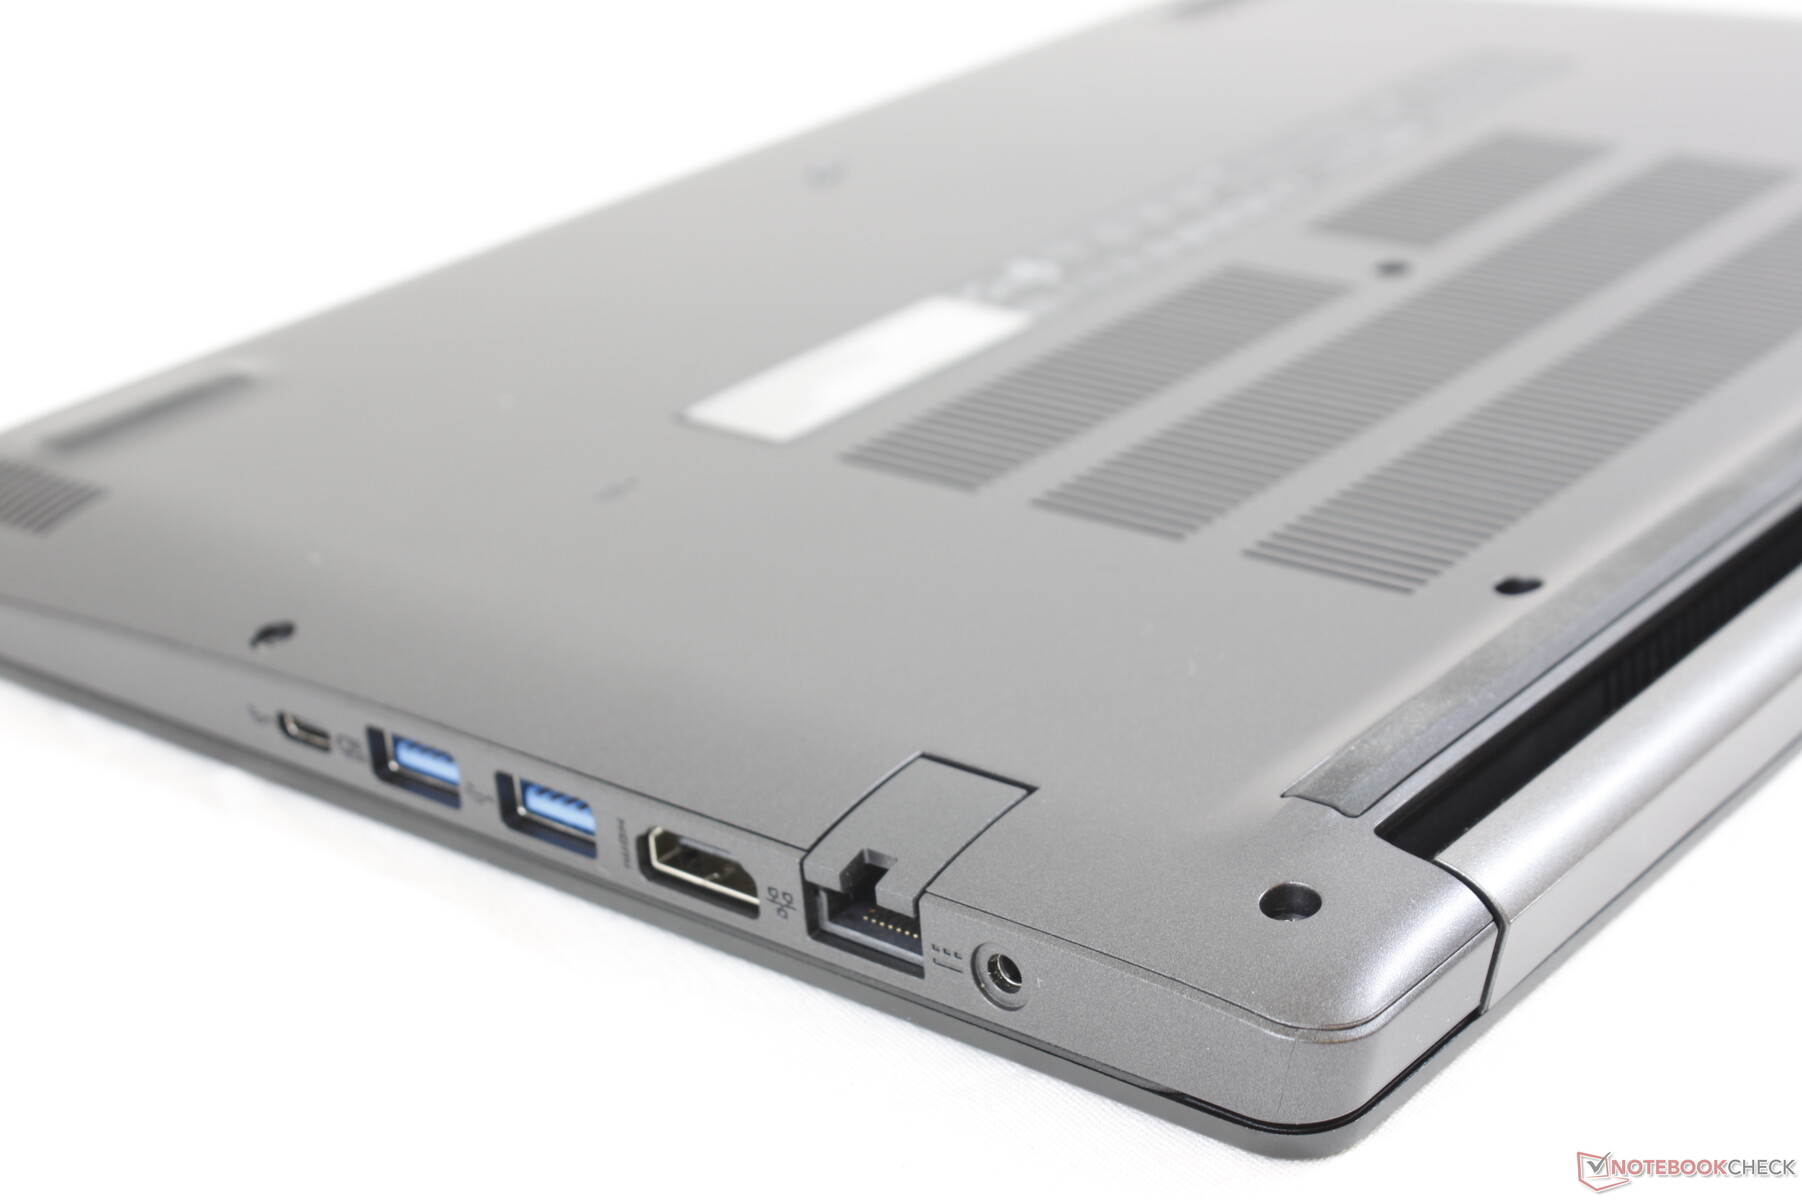
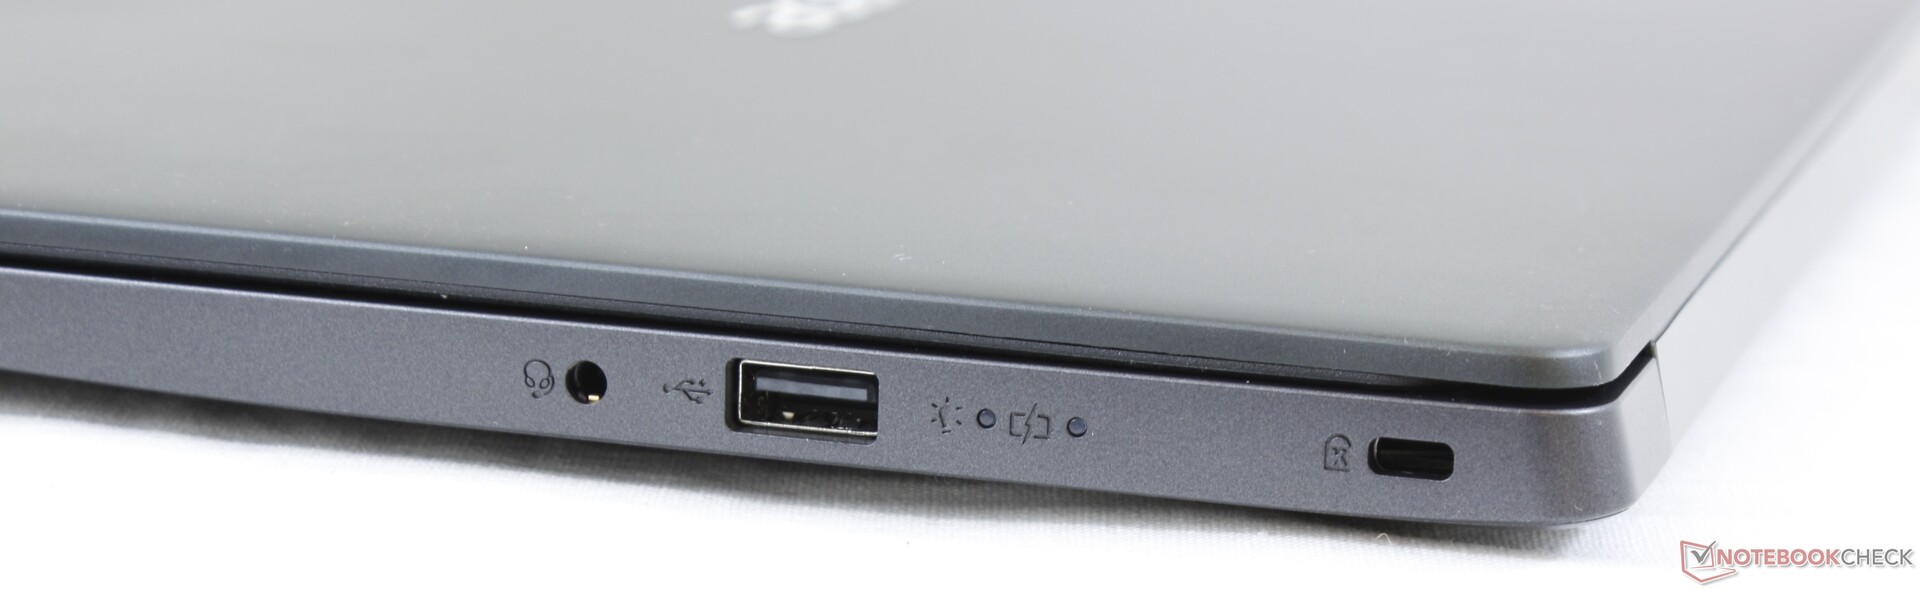
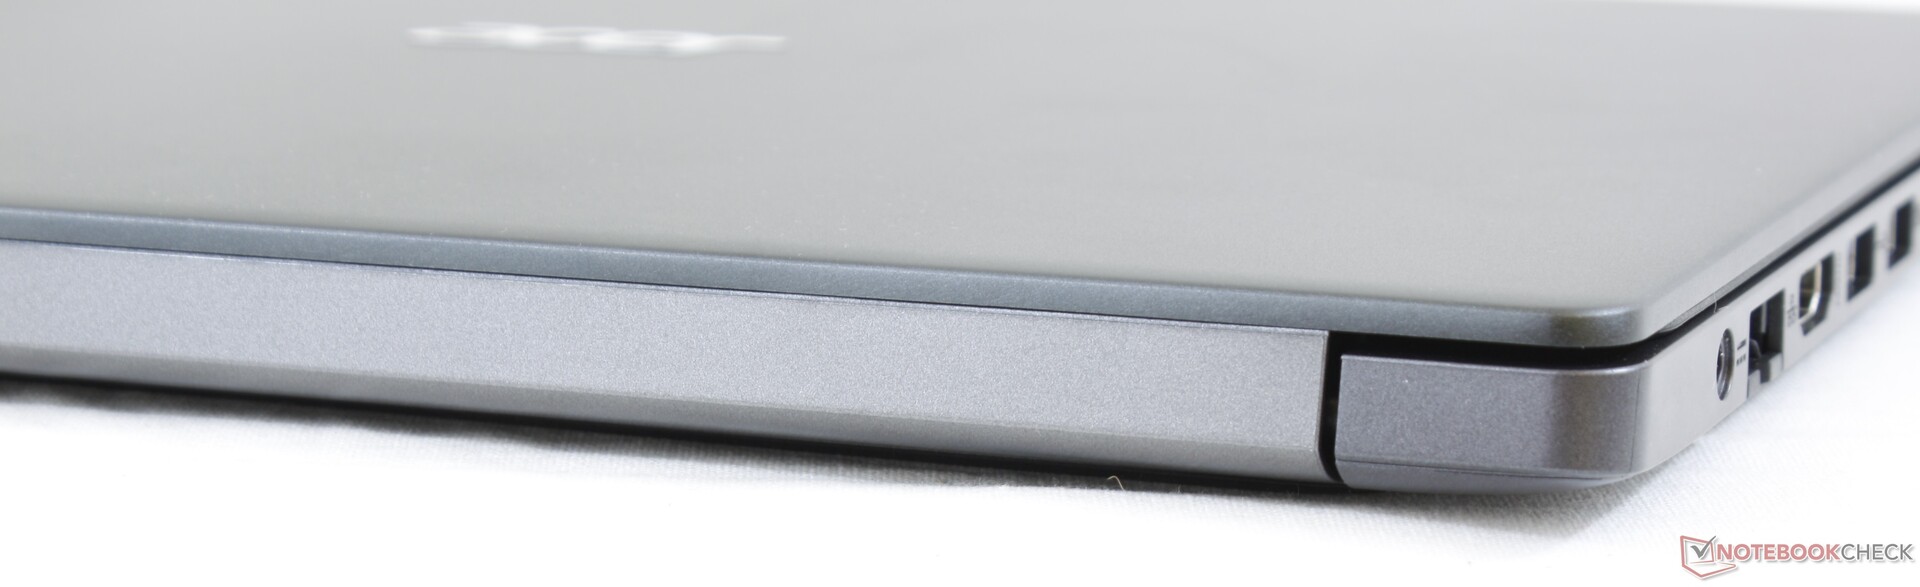
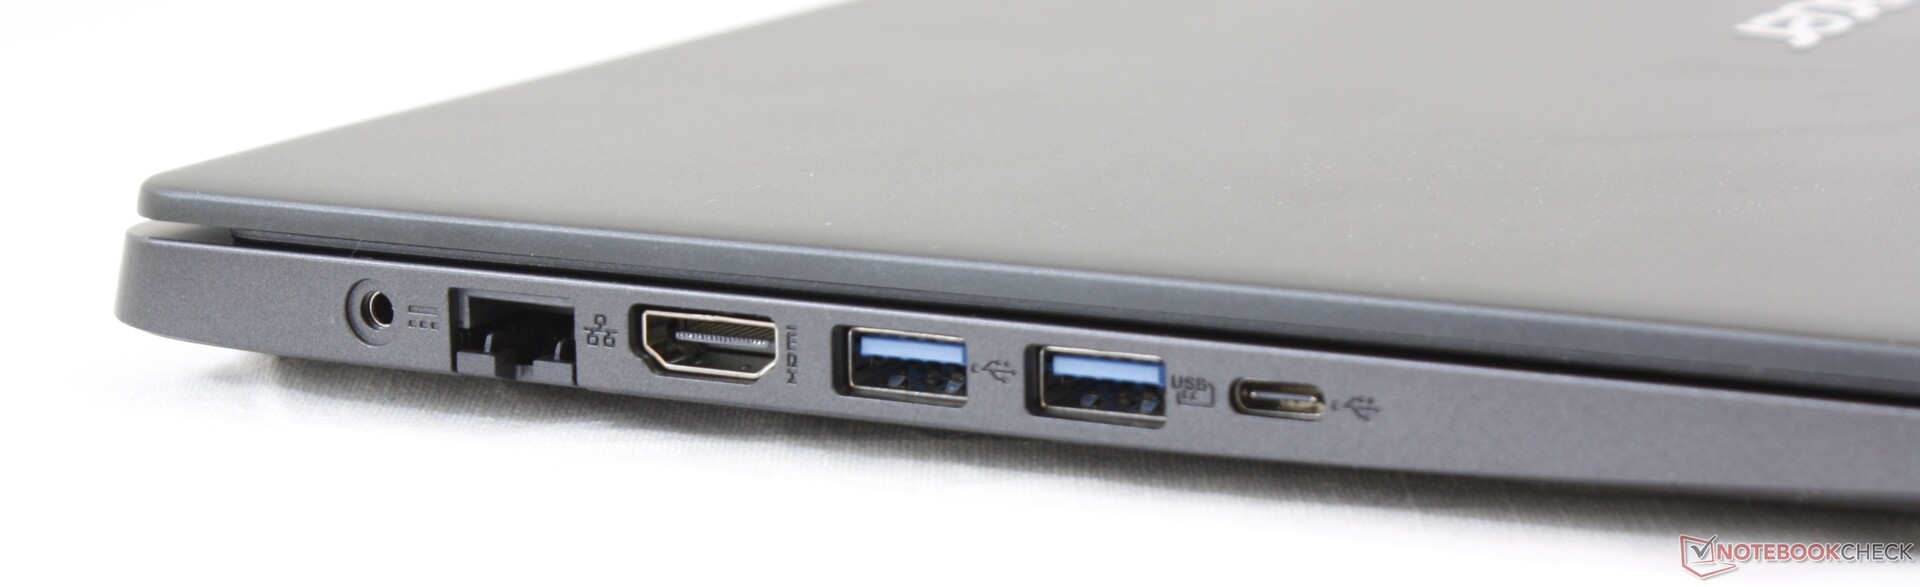
Connectivity
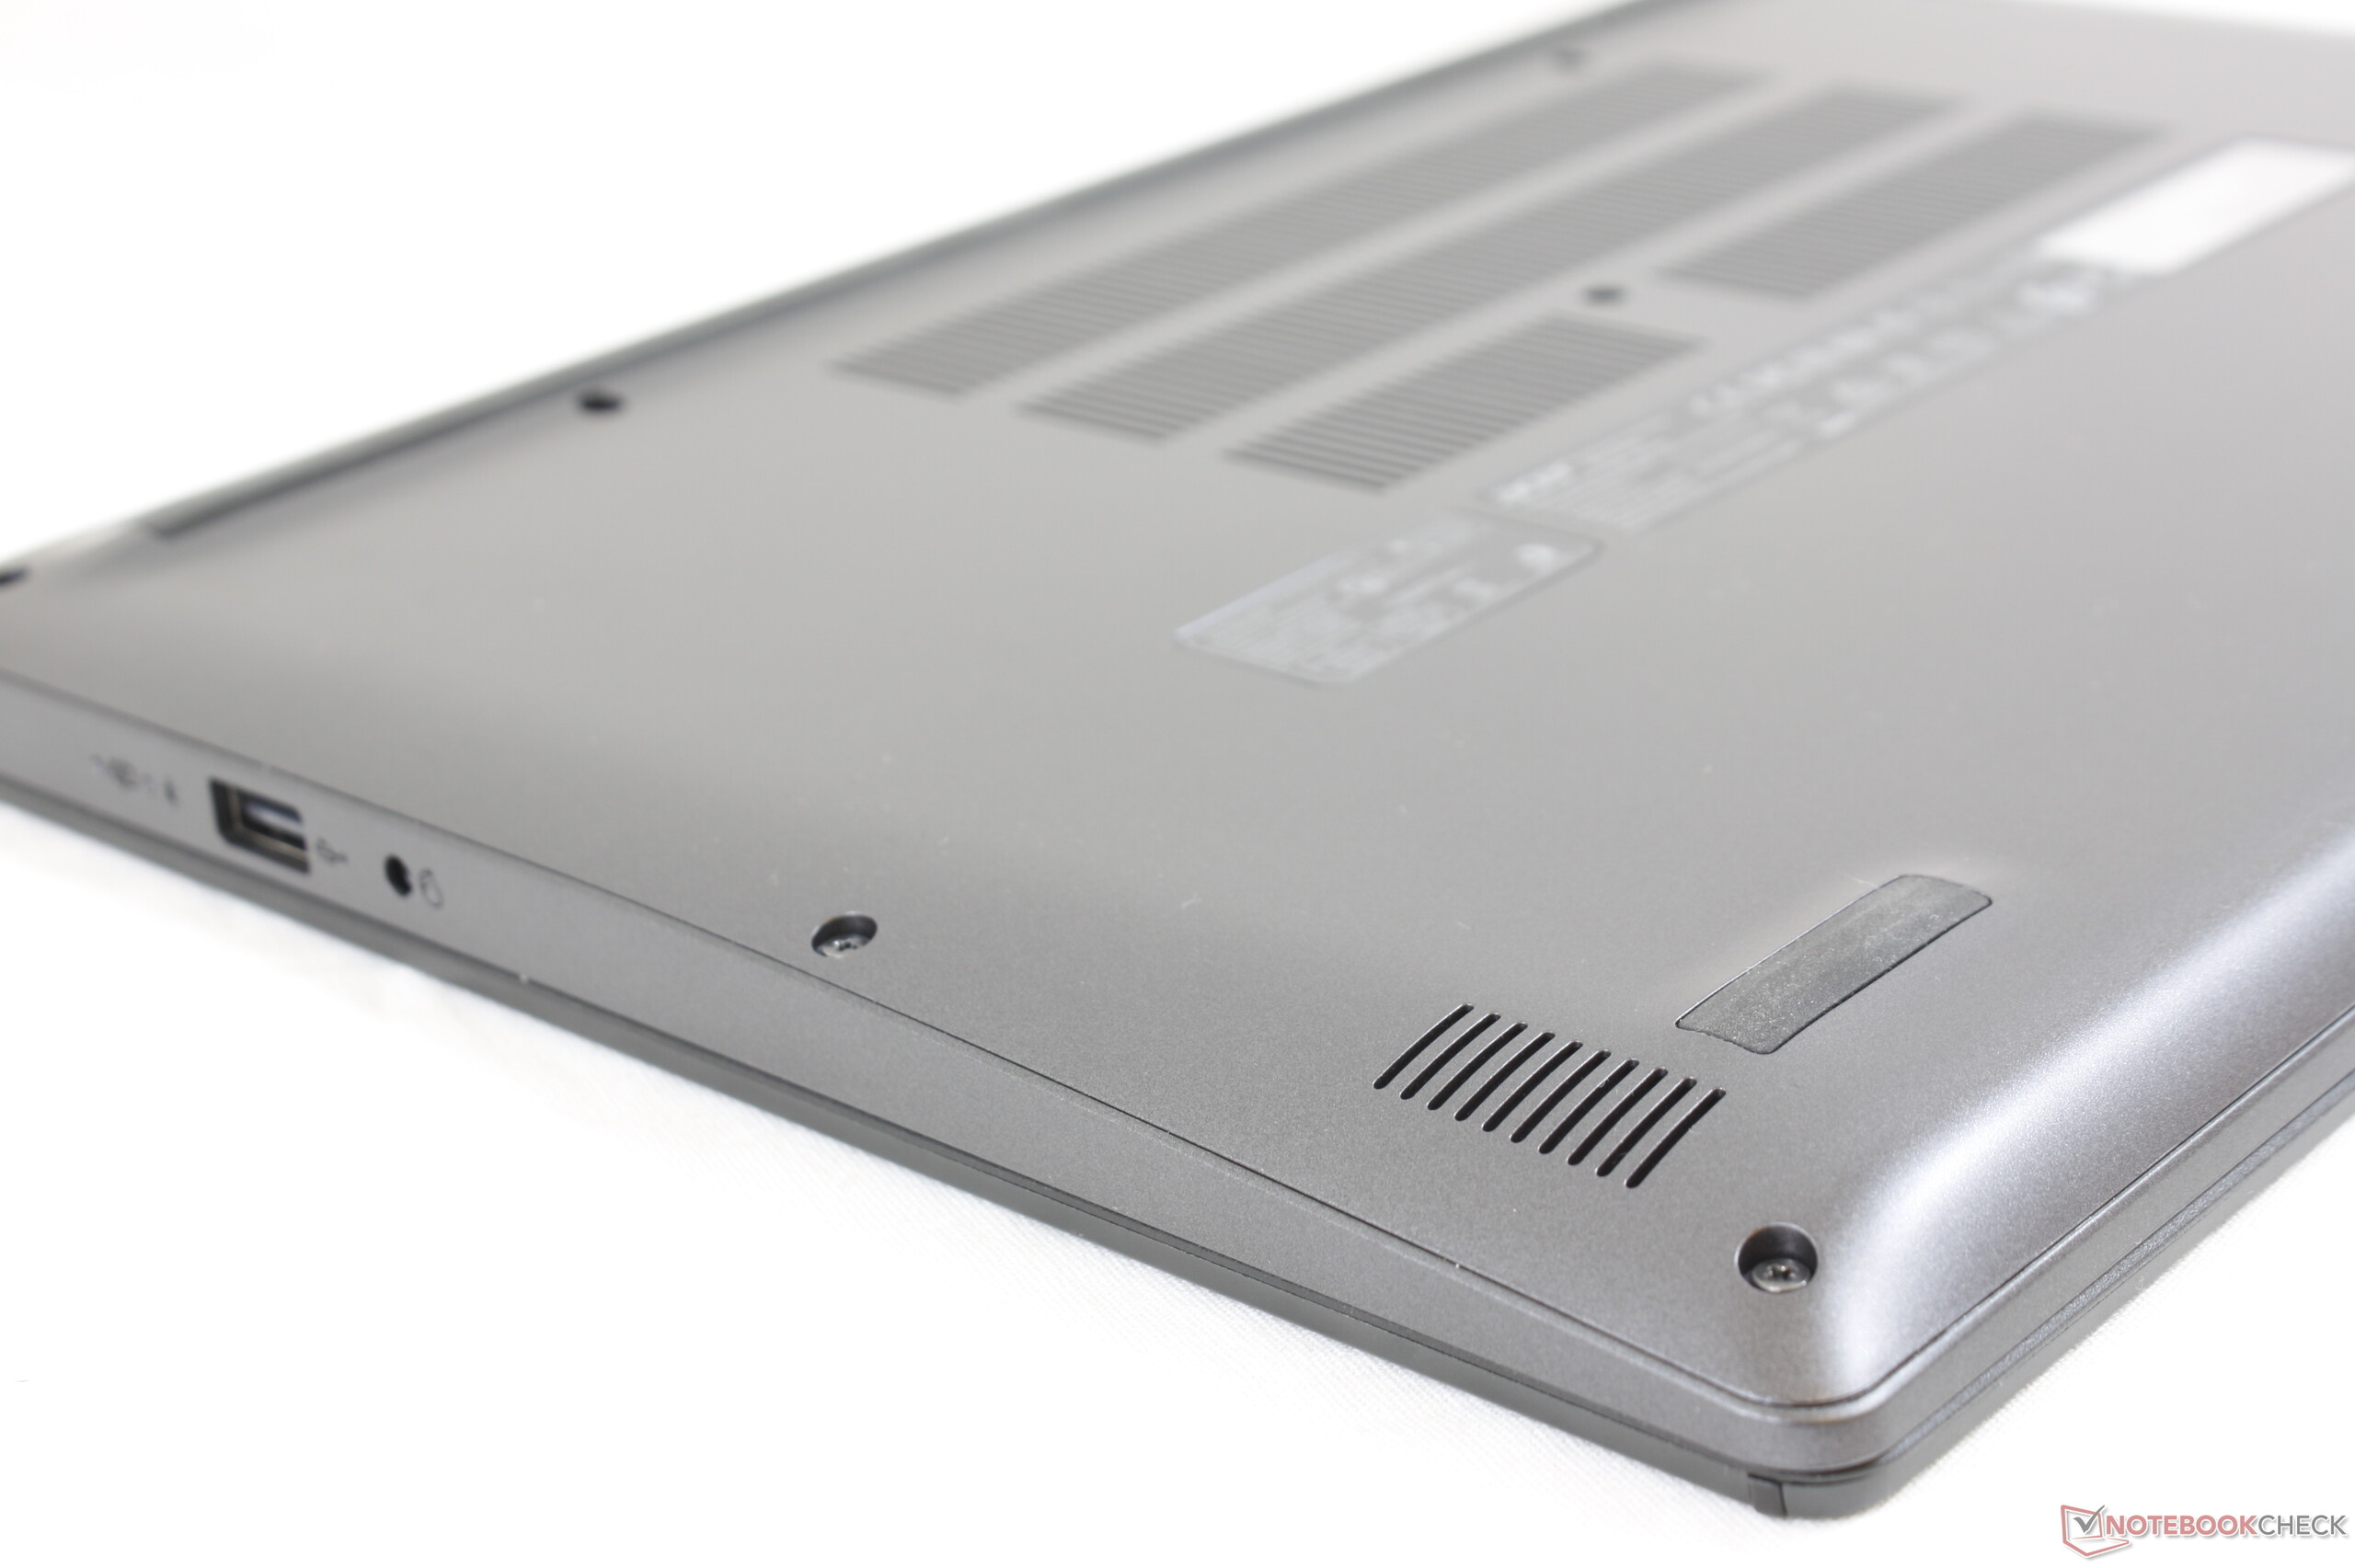
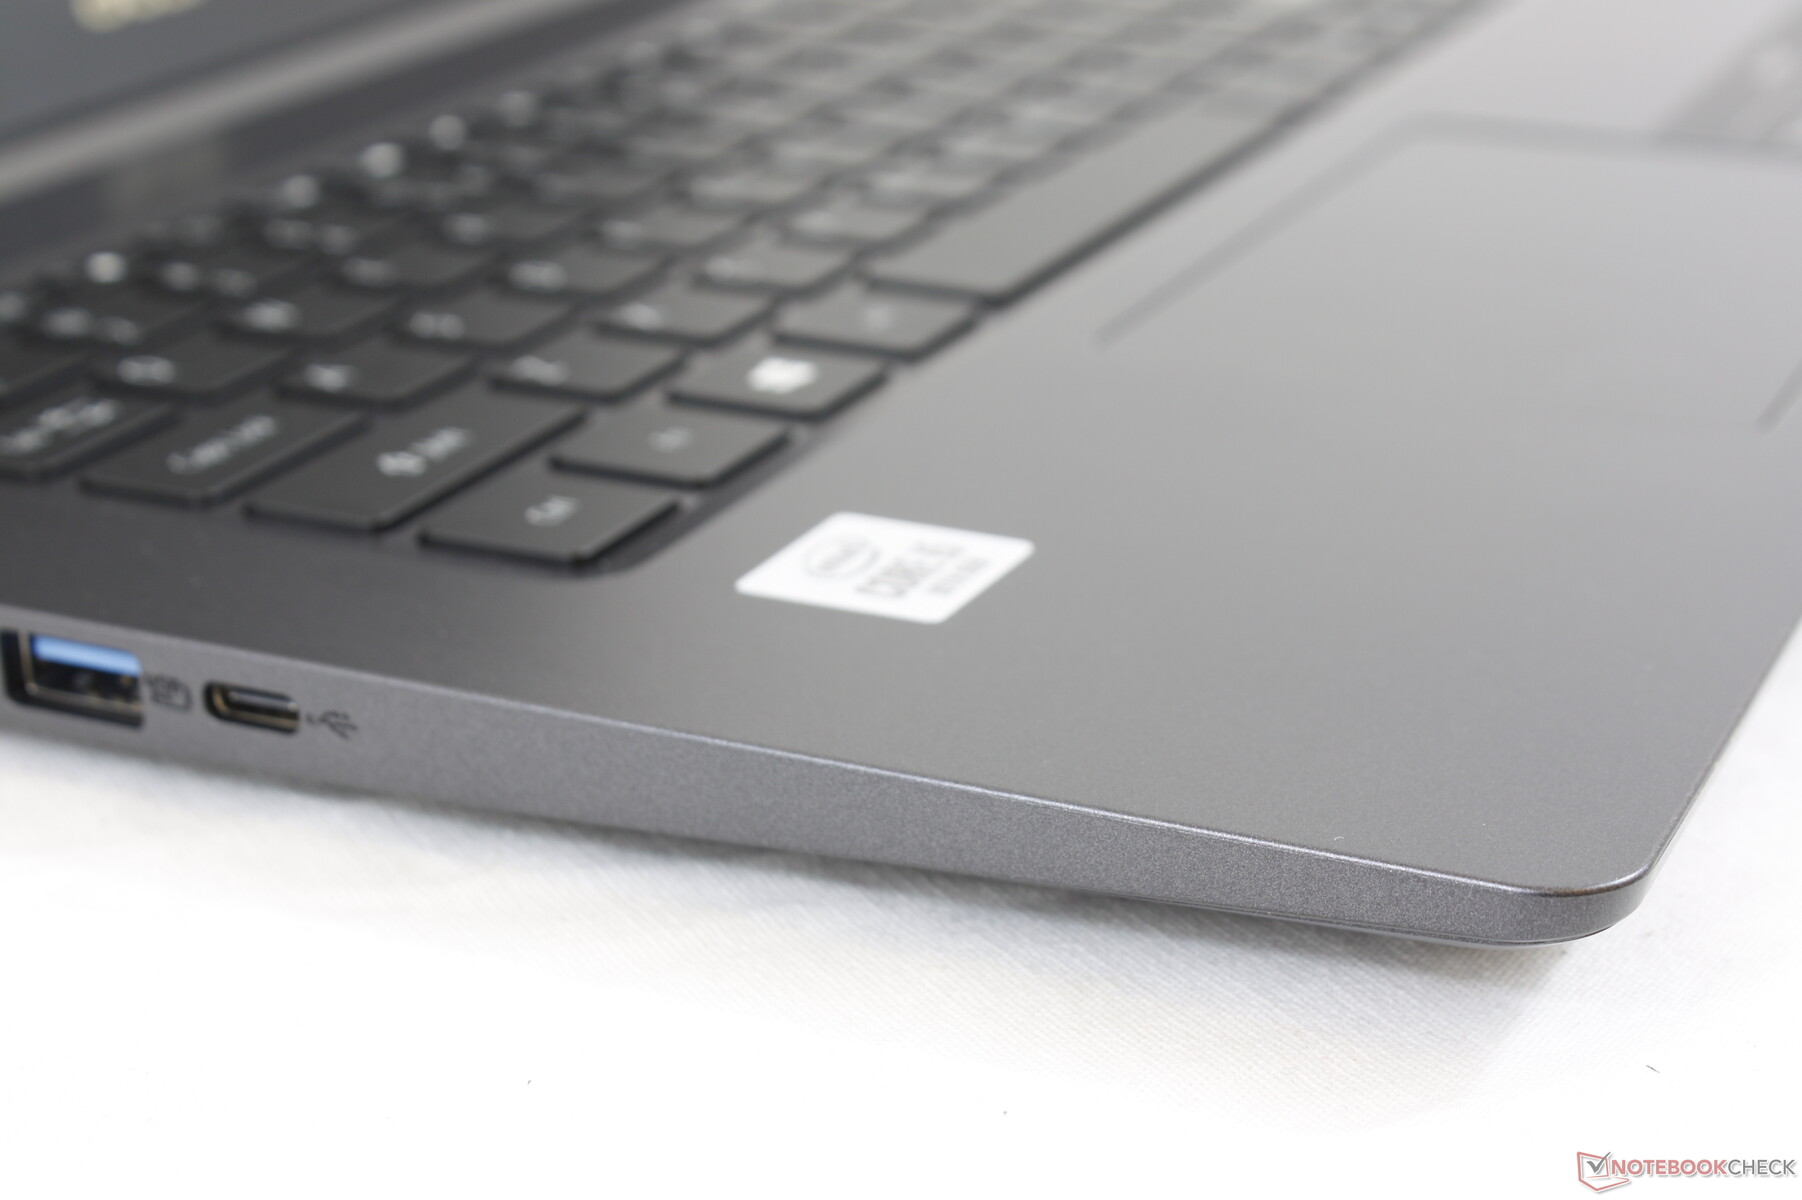
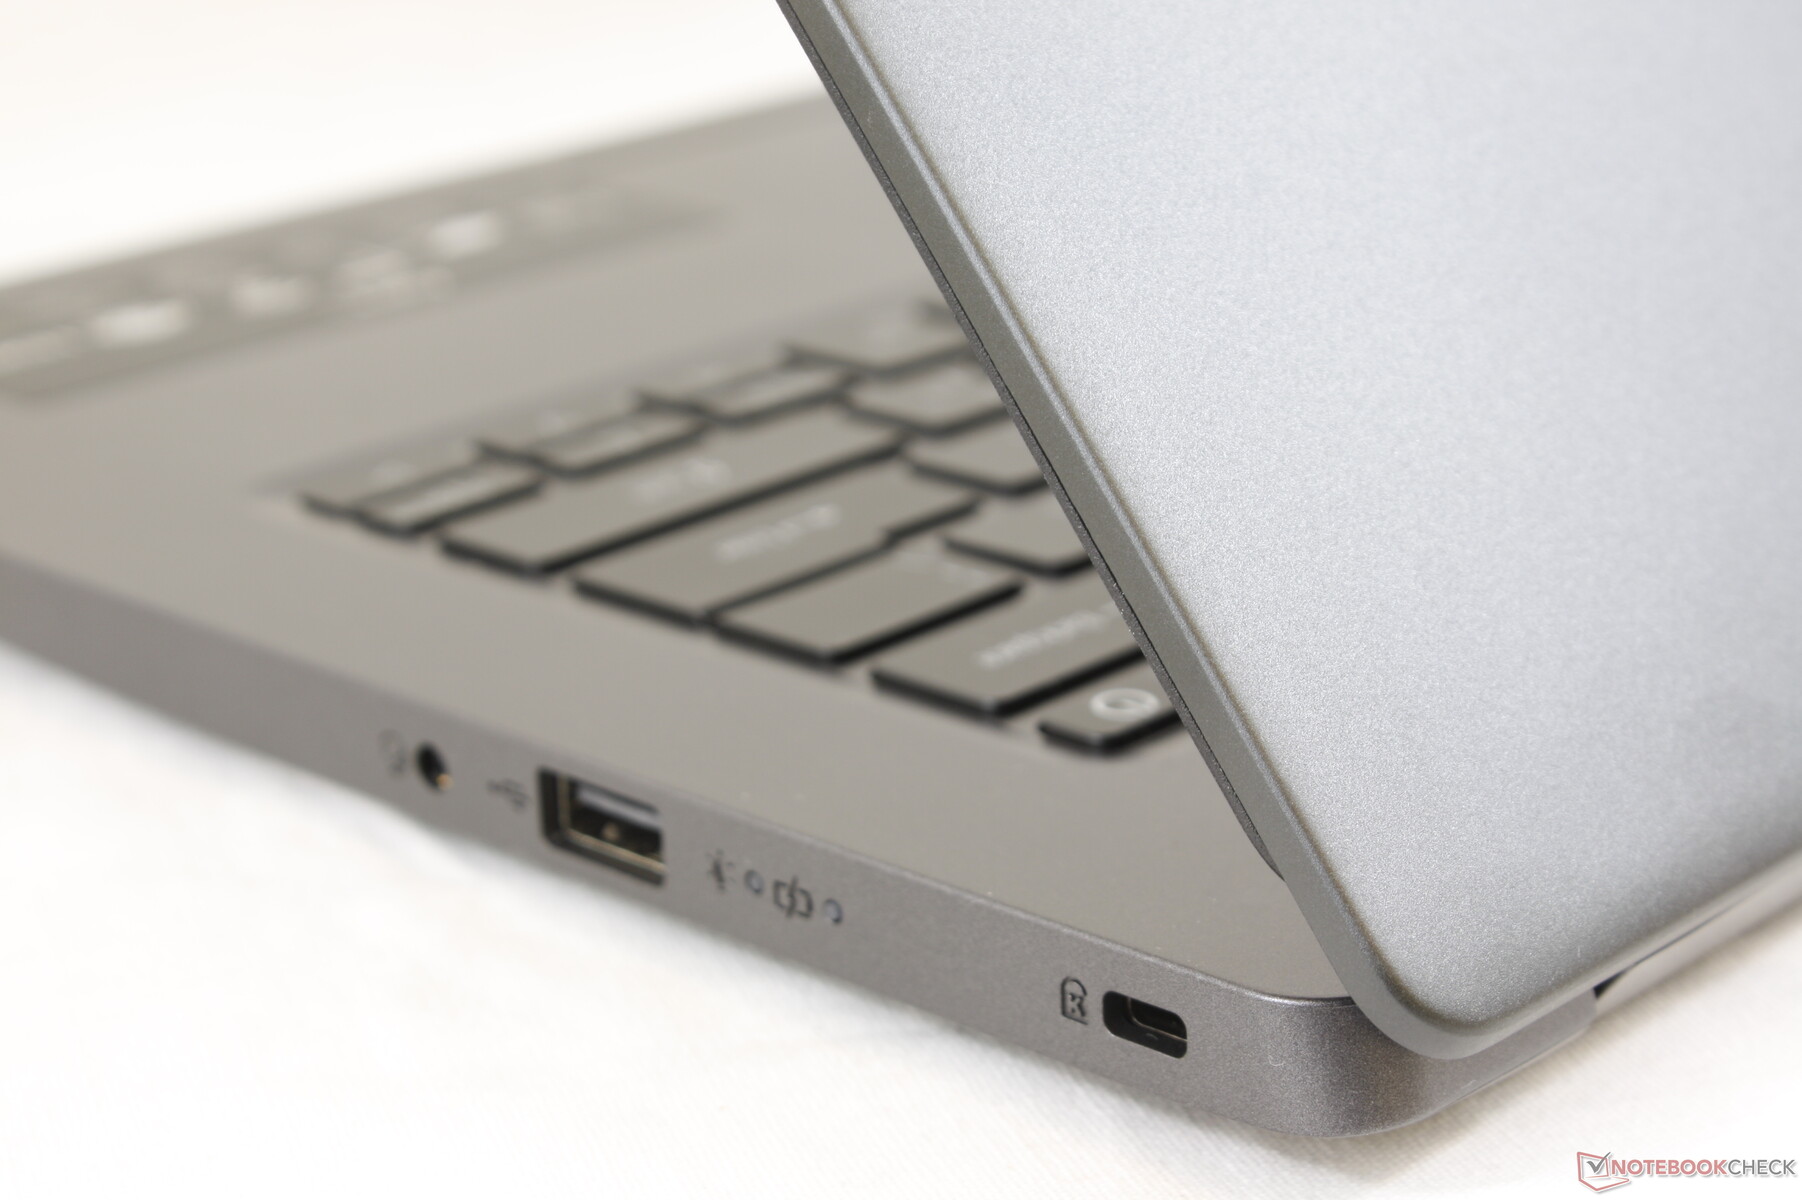
Port options are most similar to the Walmart Motile. Notable omissions are Thunderbolt 3 and the integrated SD card reader likely to save on production costs. The majority of the ports are packed tightly along the left edge for easy accessibility.
Communication
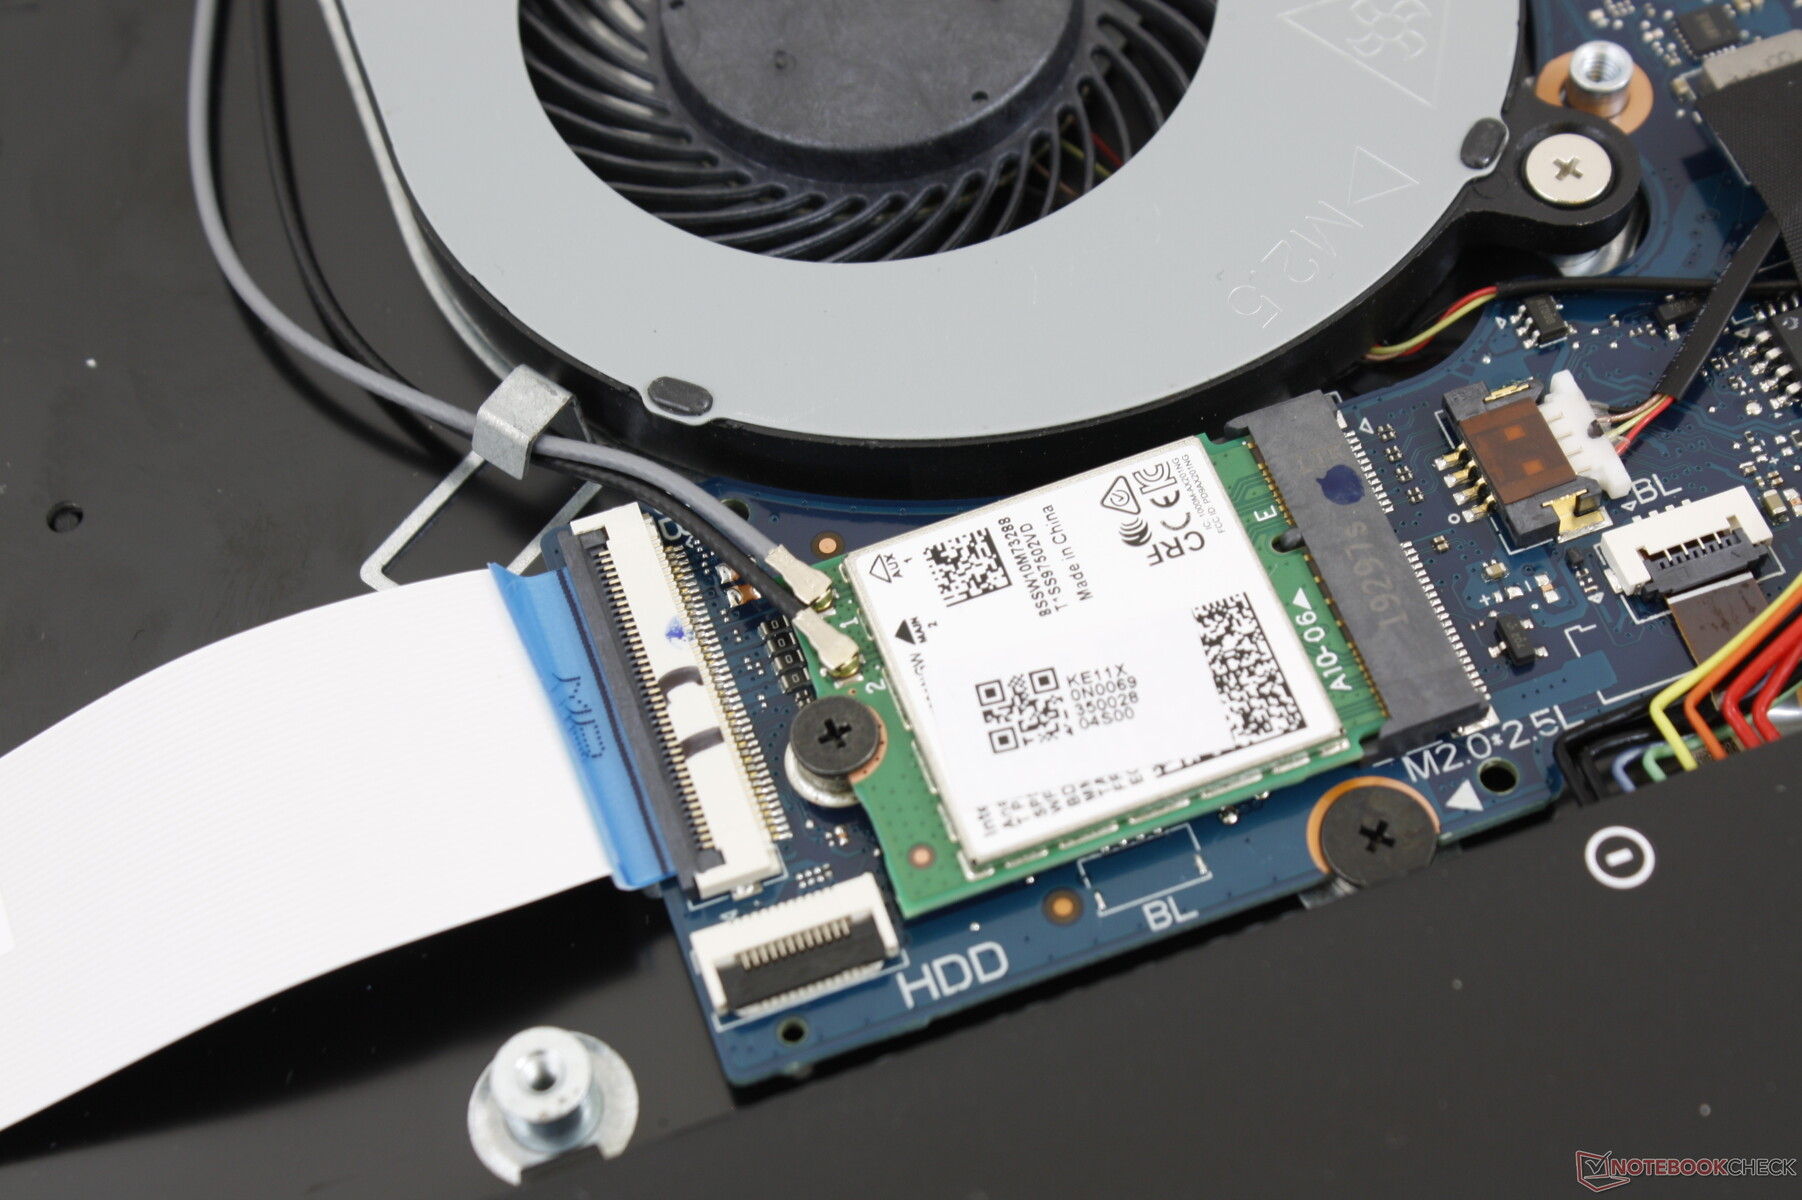
Our unit comes configured with an Intel AX201 for Wi-Fi 6 compatibility and integrated Bluetooth 5, but some SKUs may come with Wi-Fi 5 instead. Transfer rates average about 1.3 to 1.5 Gbps when standing one meter away from our Netgear RAX200 router and 2.5 Gbps server connection.
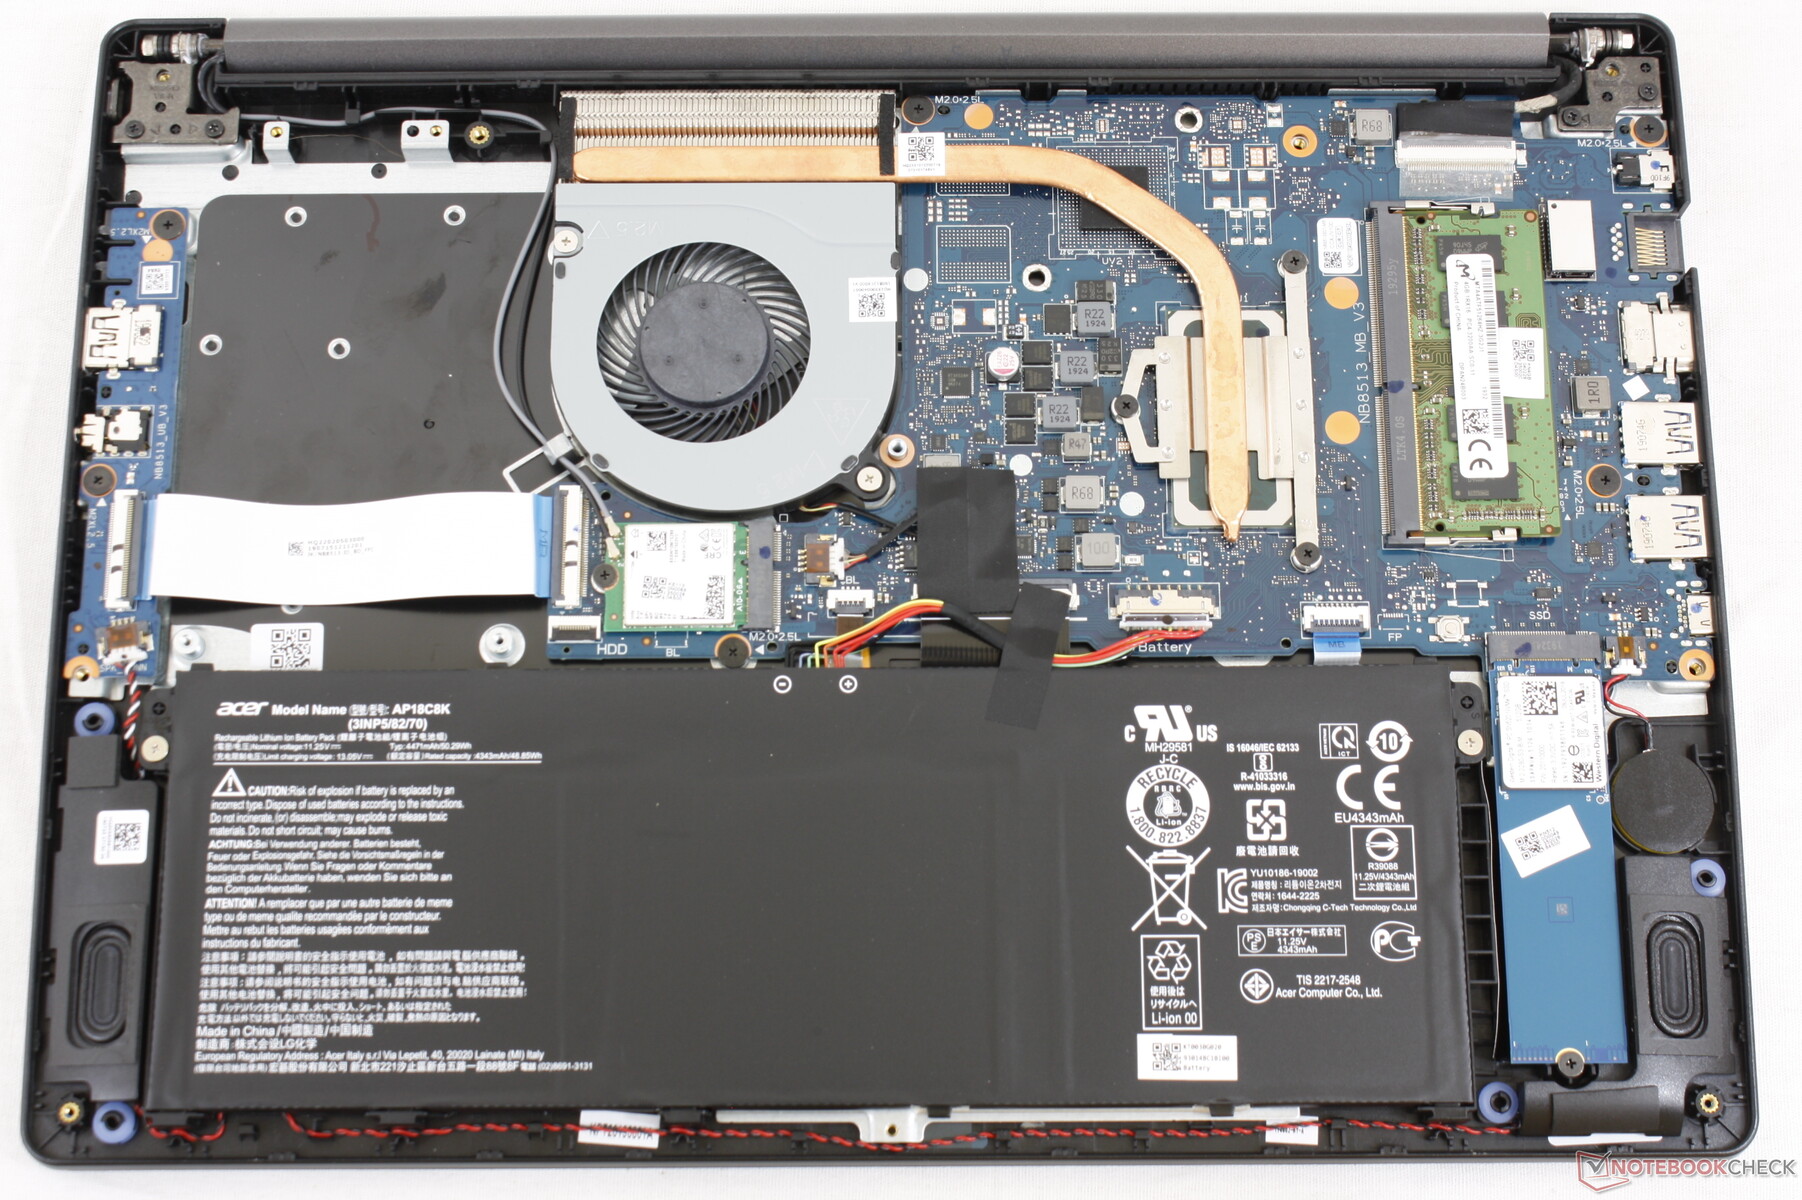
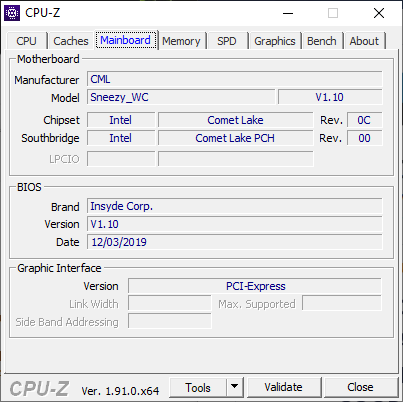
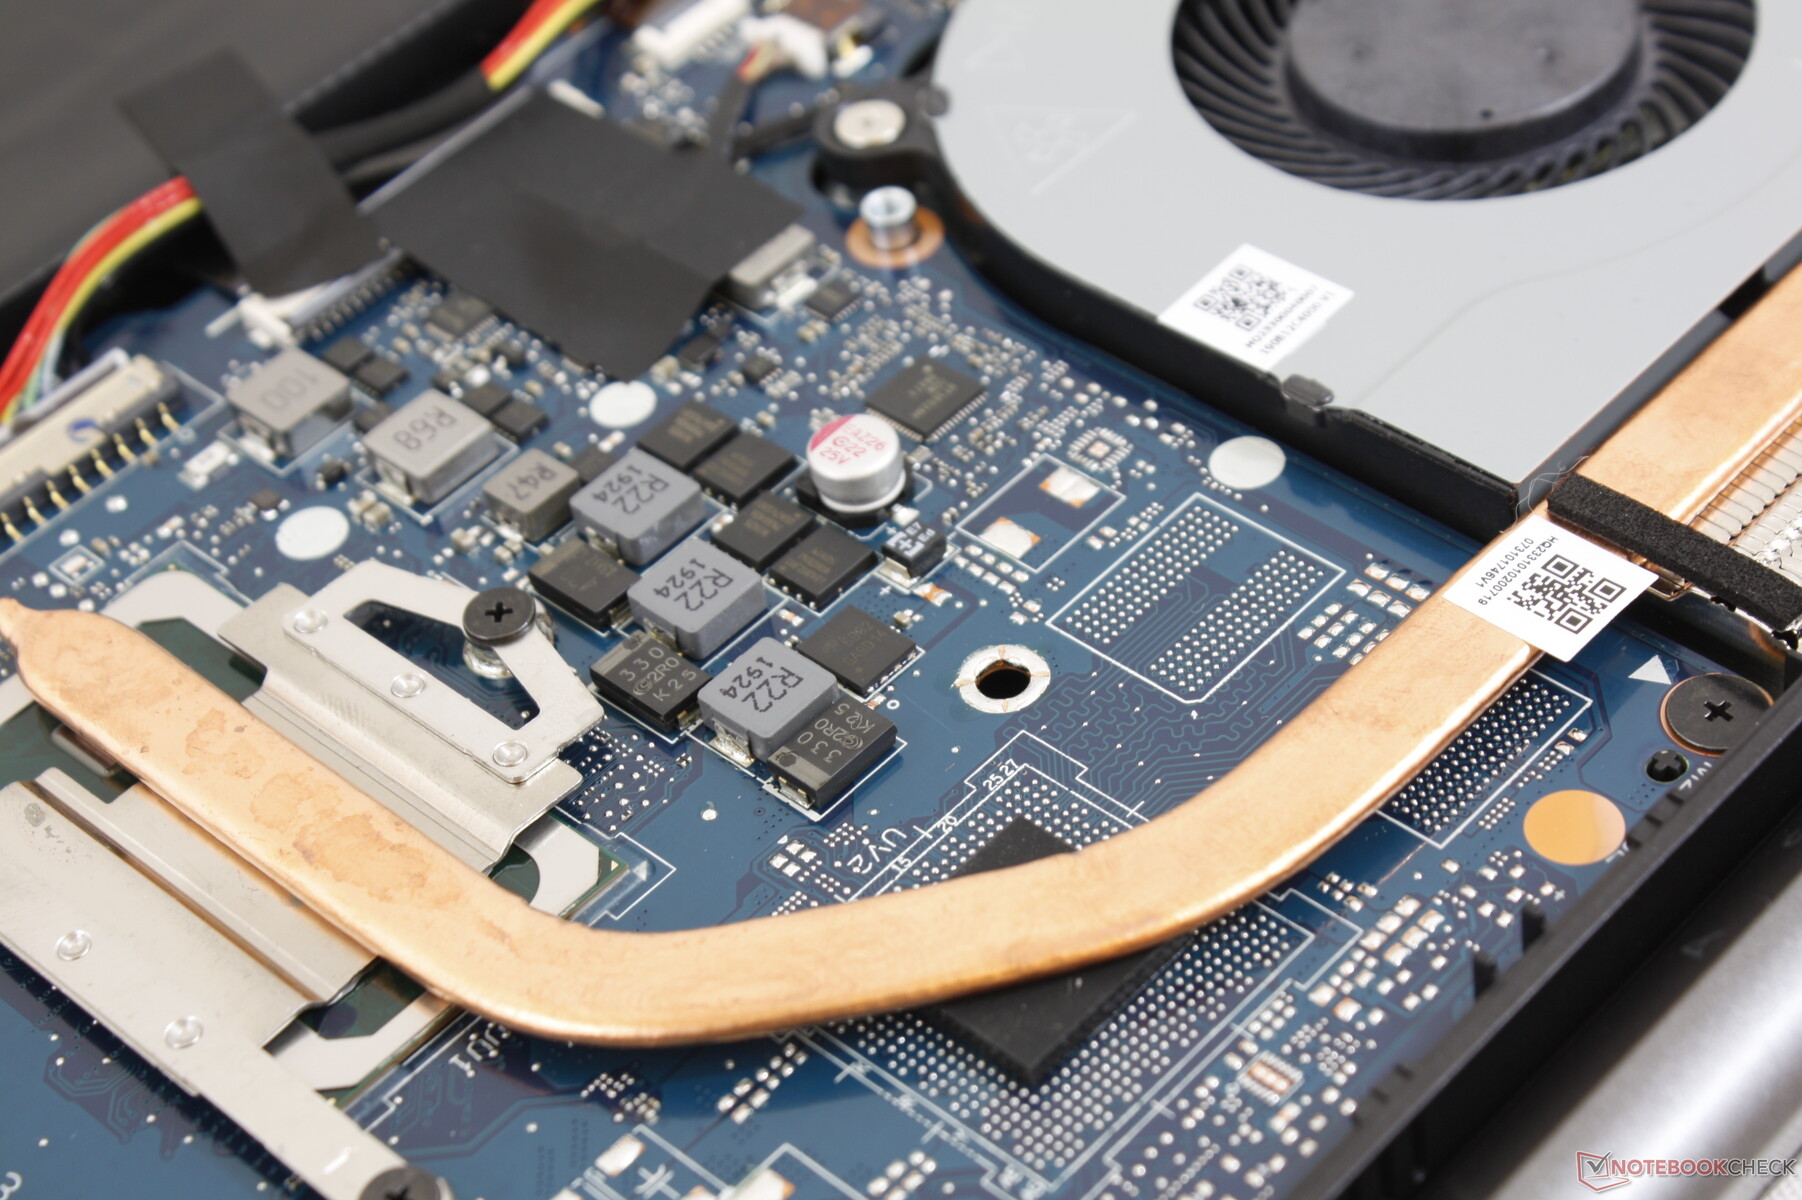
Maintenance
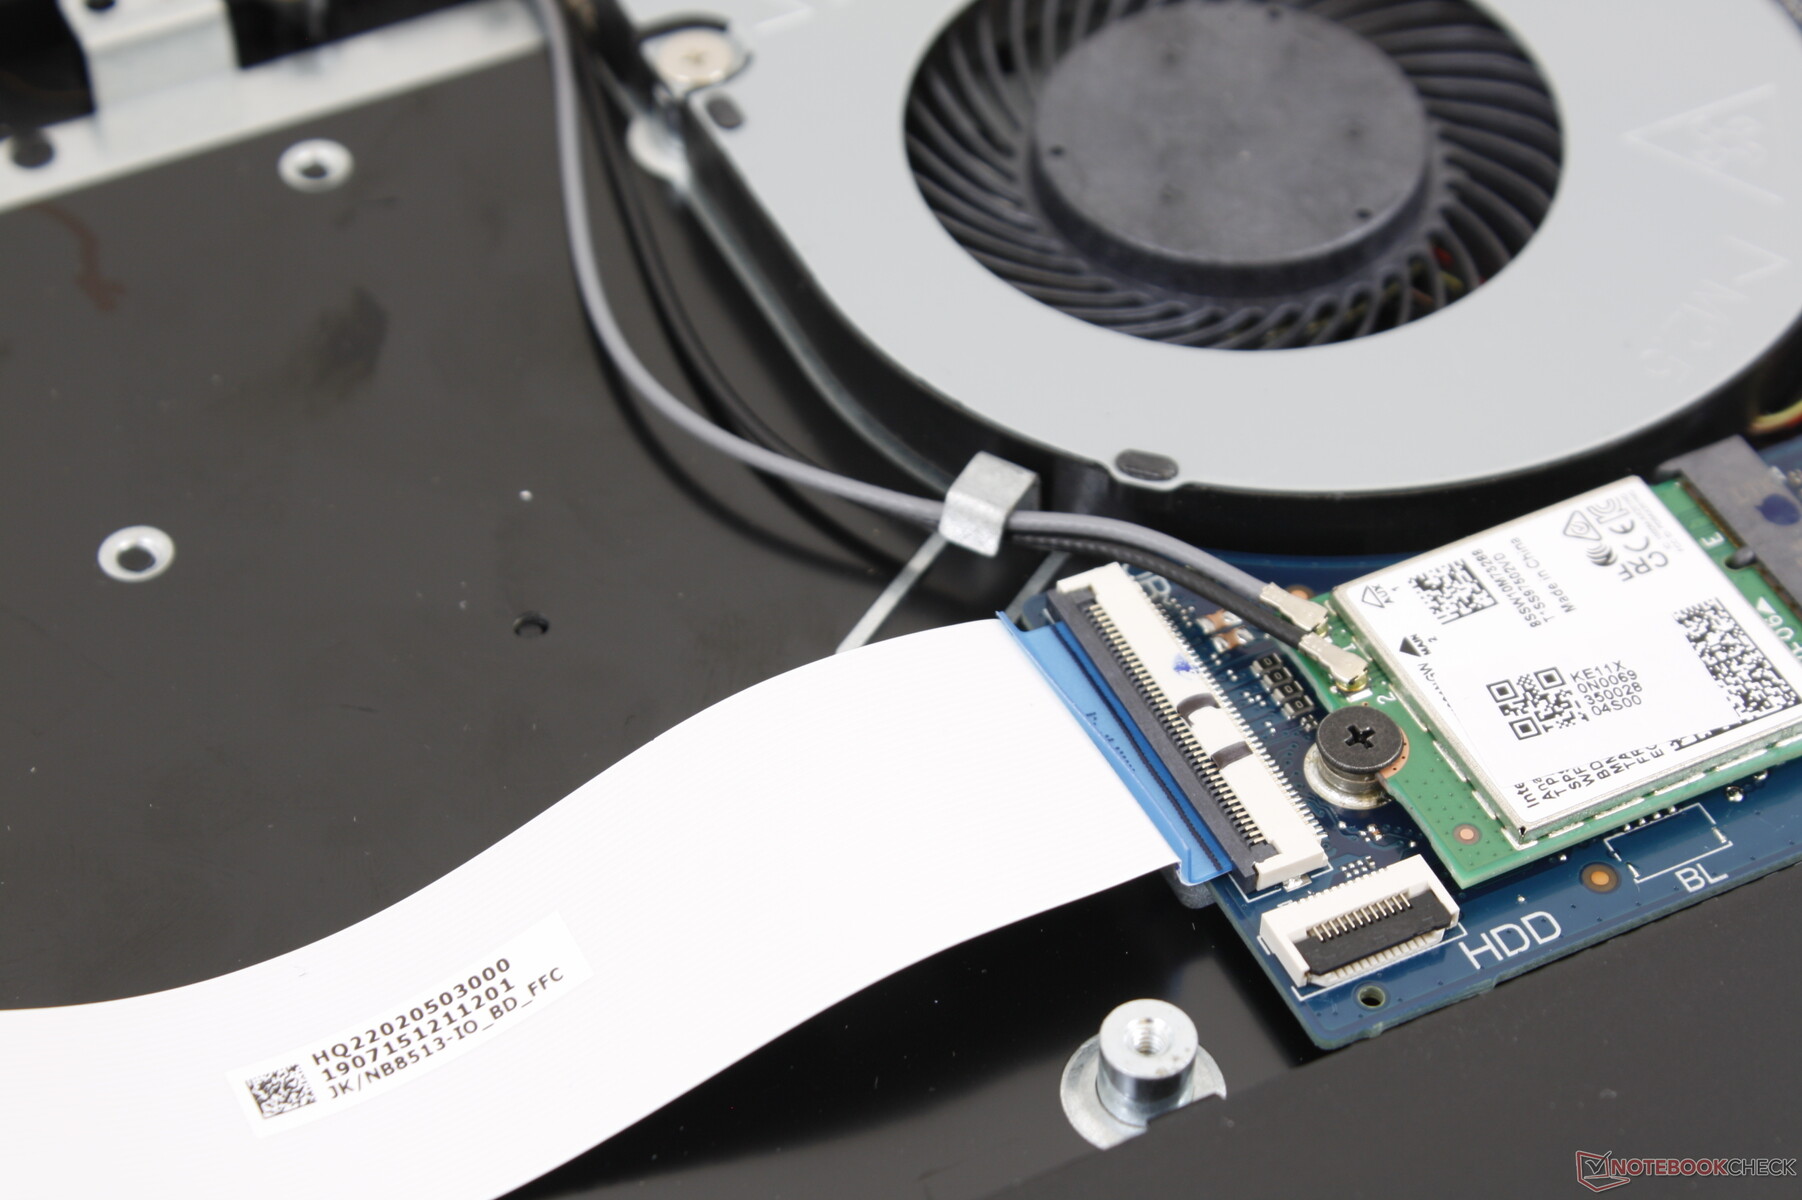
The bottom panel requires just a Philips screwdriver to remove for easier accessibility than most other laptops in this price range. The HP Pavilion x360 15, for example, has hidden screws to make servicing more difficult than it needs to be. Owners get direct access to two storage bays, one SODIMM slot, and the removable WLAN module.
Accessories and Warranty
A metal 2.5-inch SATA mounting bracket is included alongside screws and a ribbon cable. The standard one-year limited warranty applies.
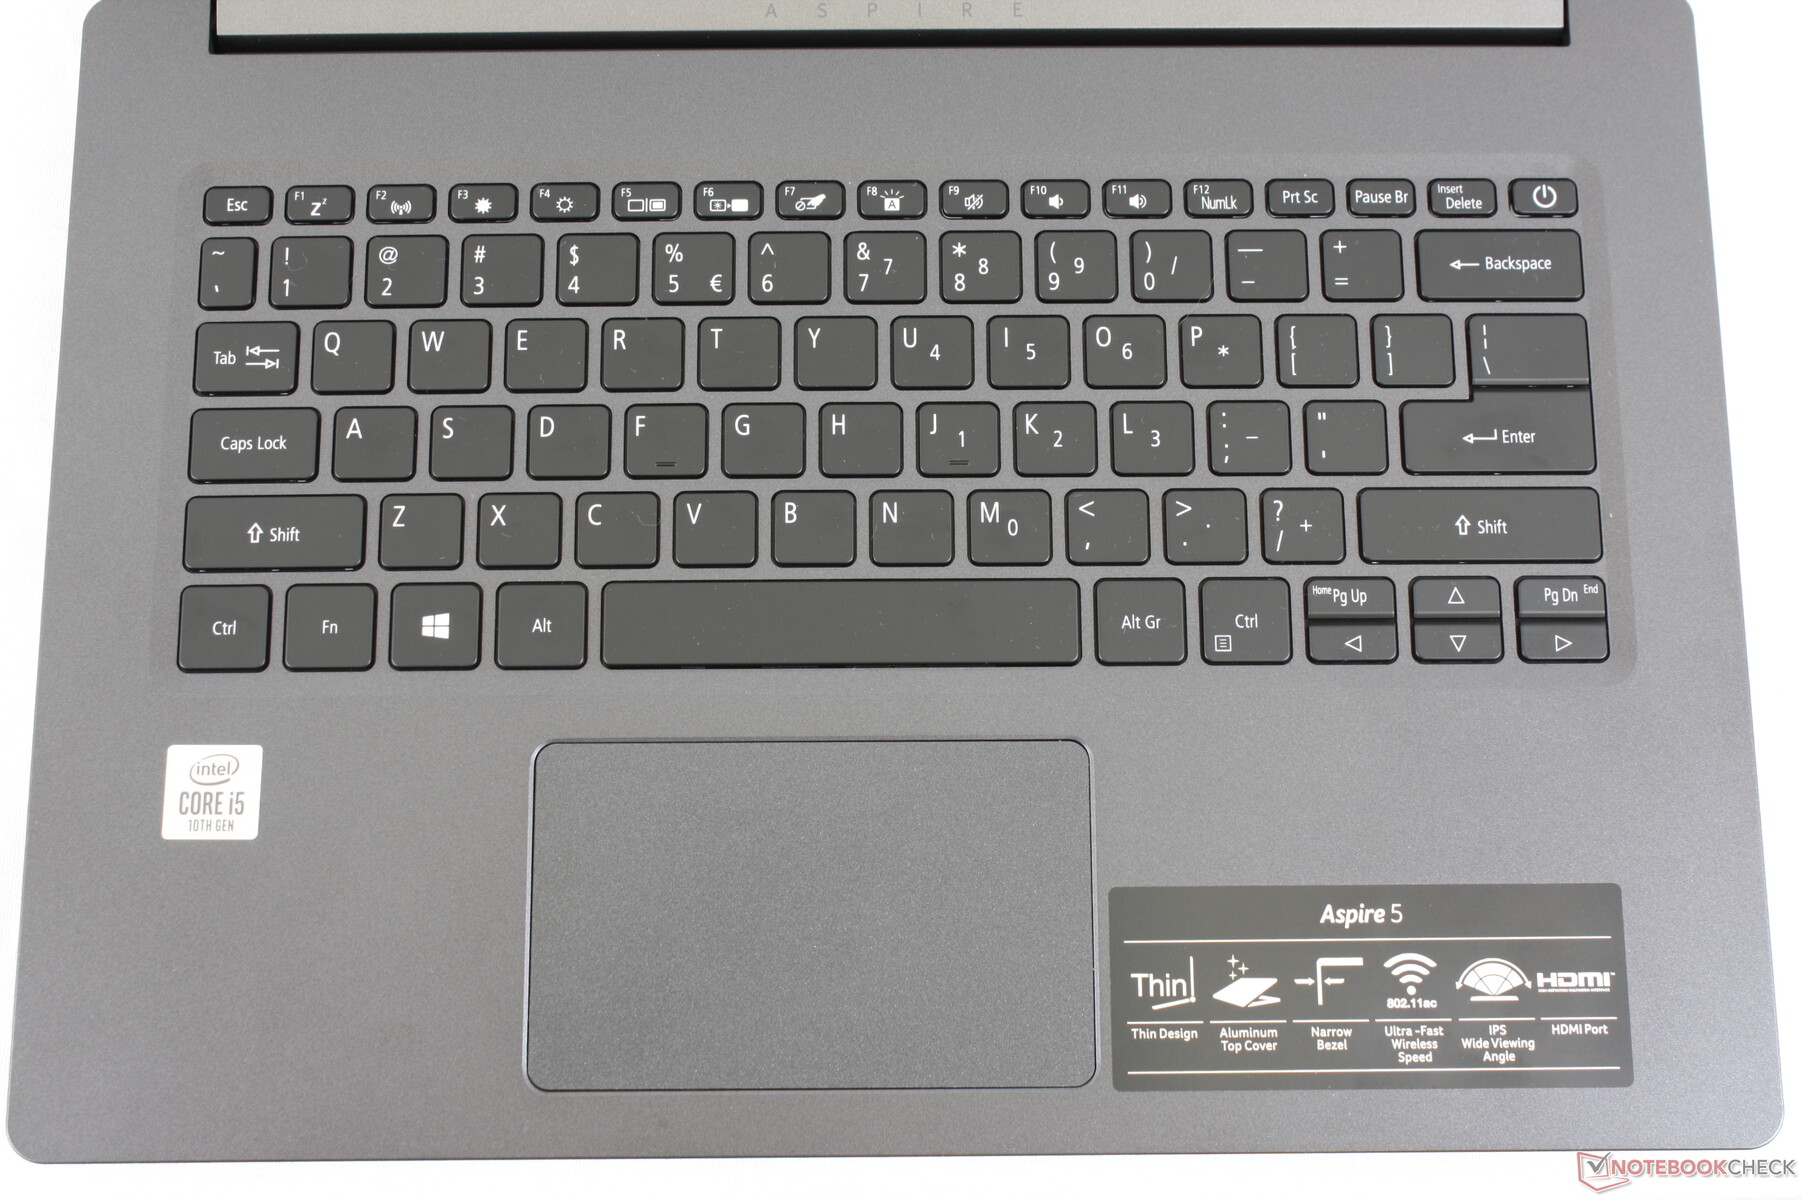
Input Devices
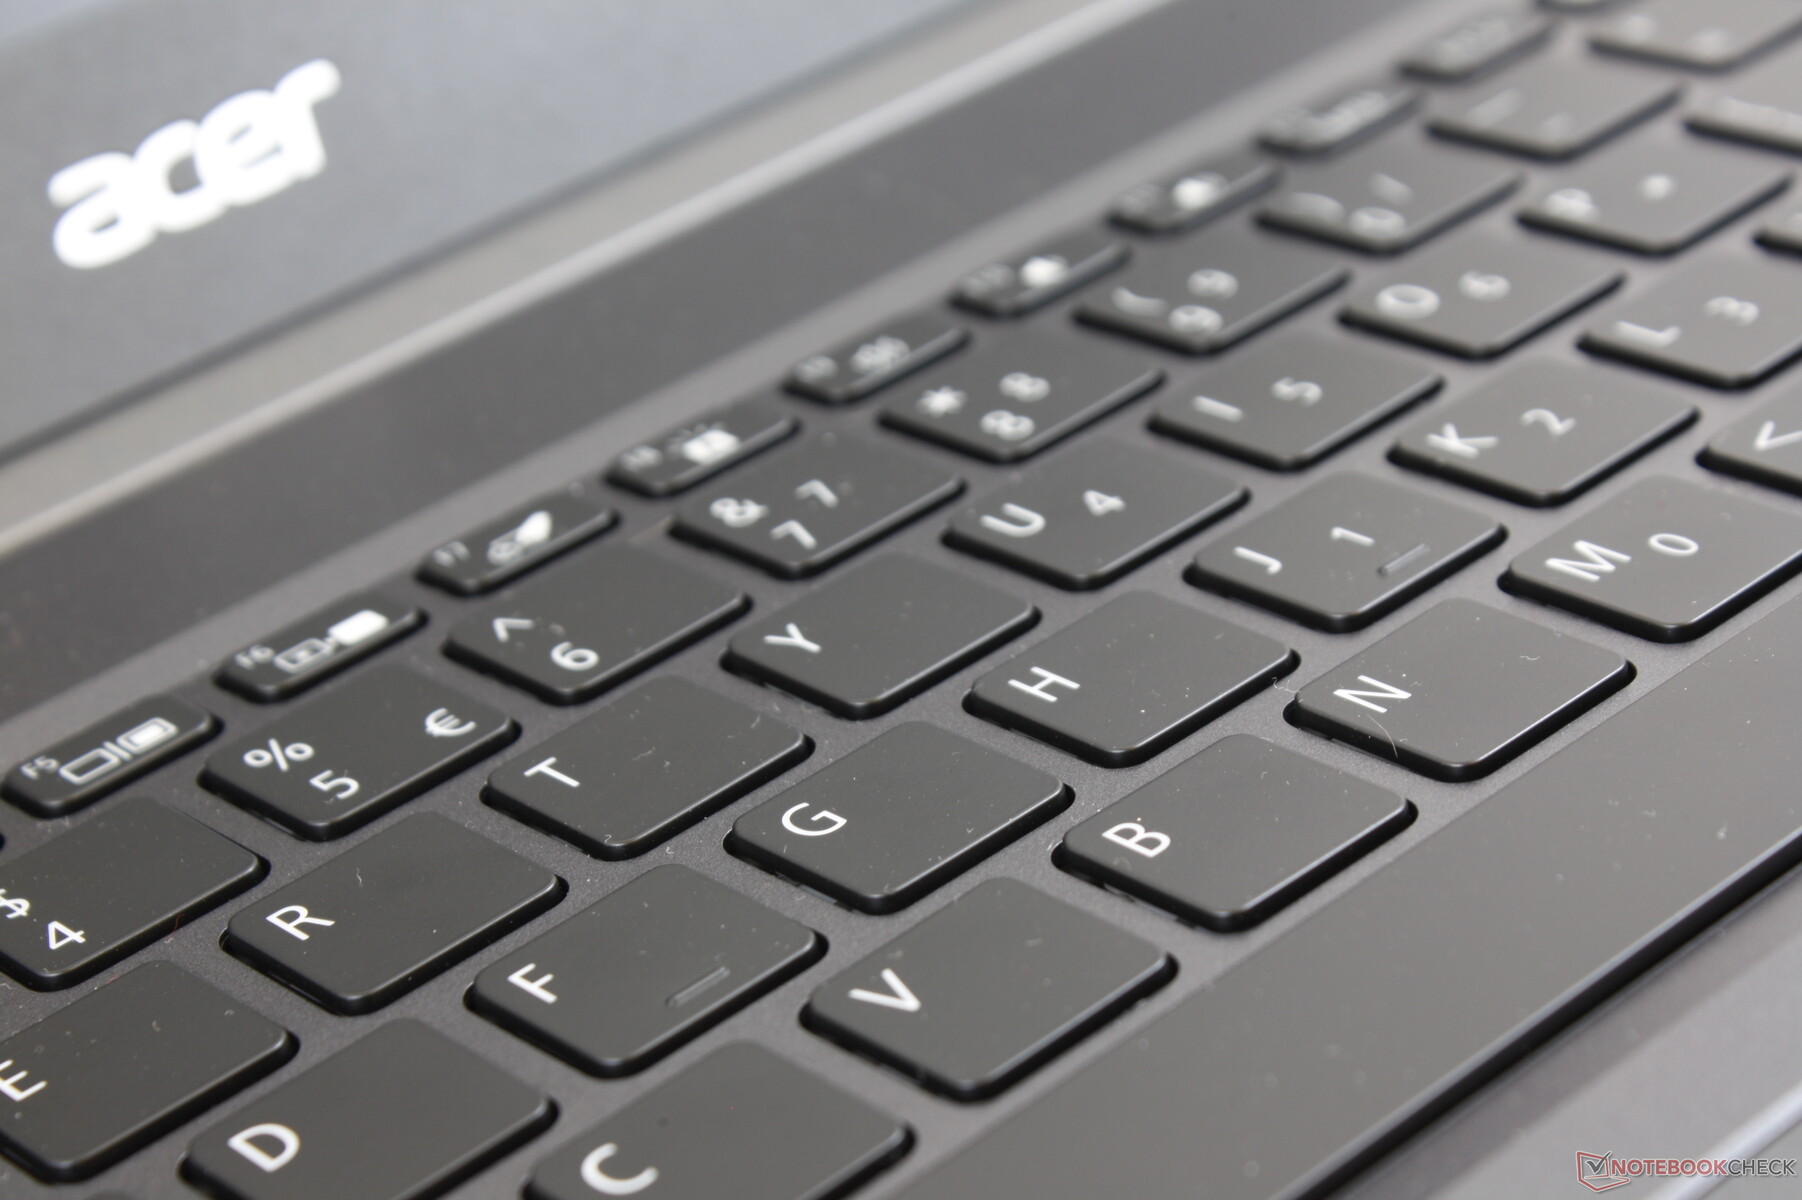
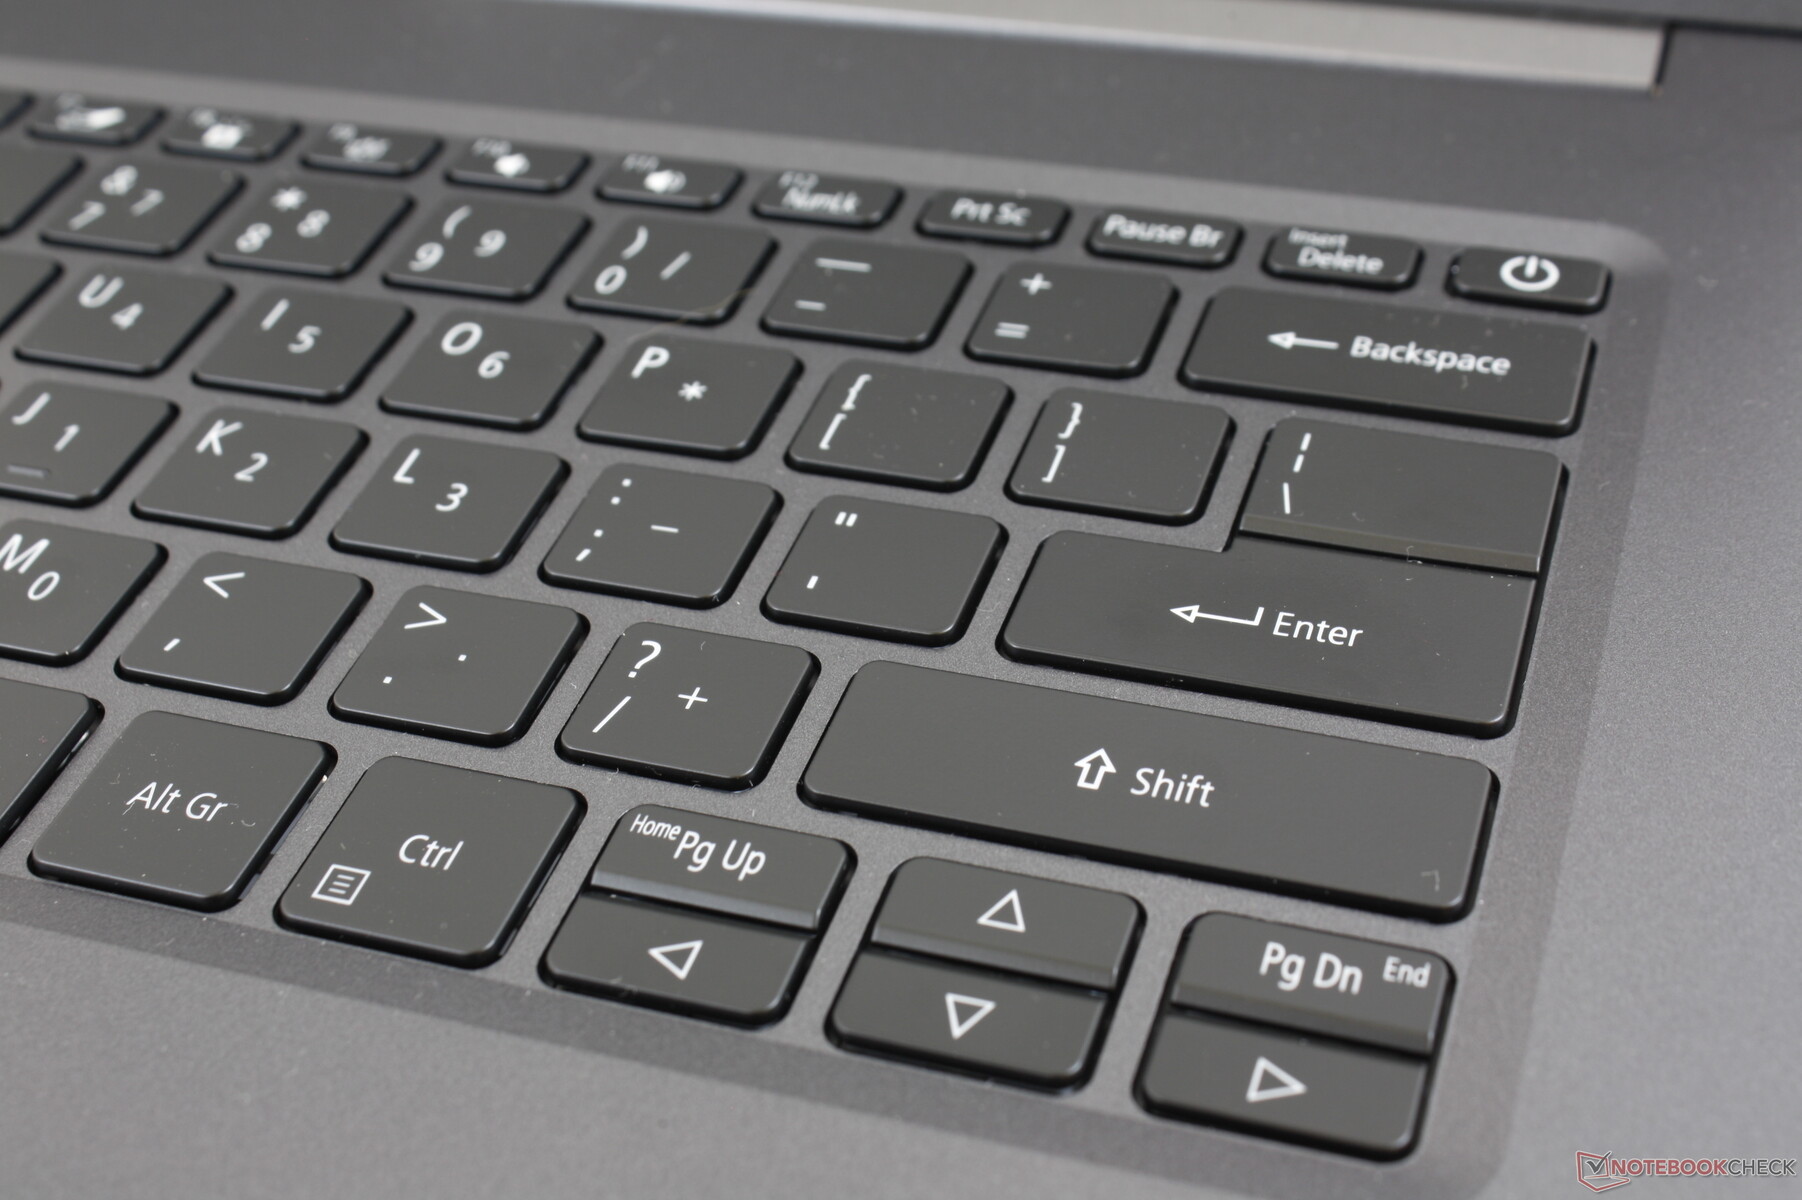
Keyboard
The backlit keyboard offers quieter clatter than expected to be a good fit if typing in noise-sensitive environments. The drawback to this is the shallow travel and spongier key feedback; keys on the VivoBook series, MateBook X series, or IdeaPad series all feel deeper and more satisfying to type on. If you plan on typing a lot, you'll have to get used to the weak key feedback of the Aspire 5.
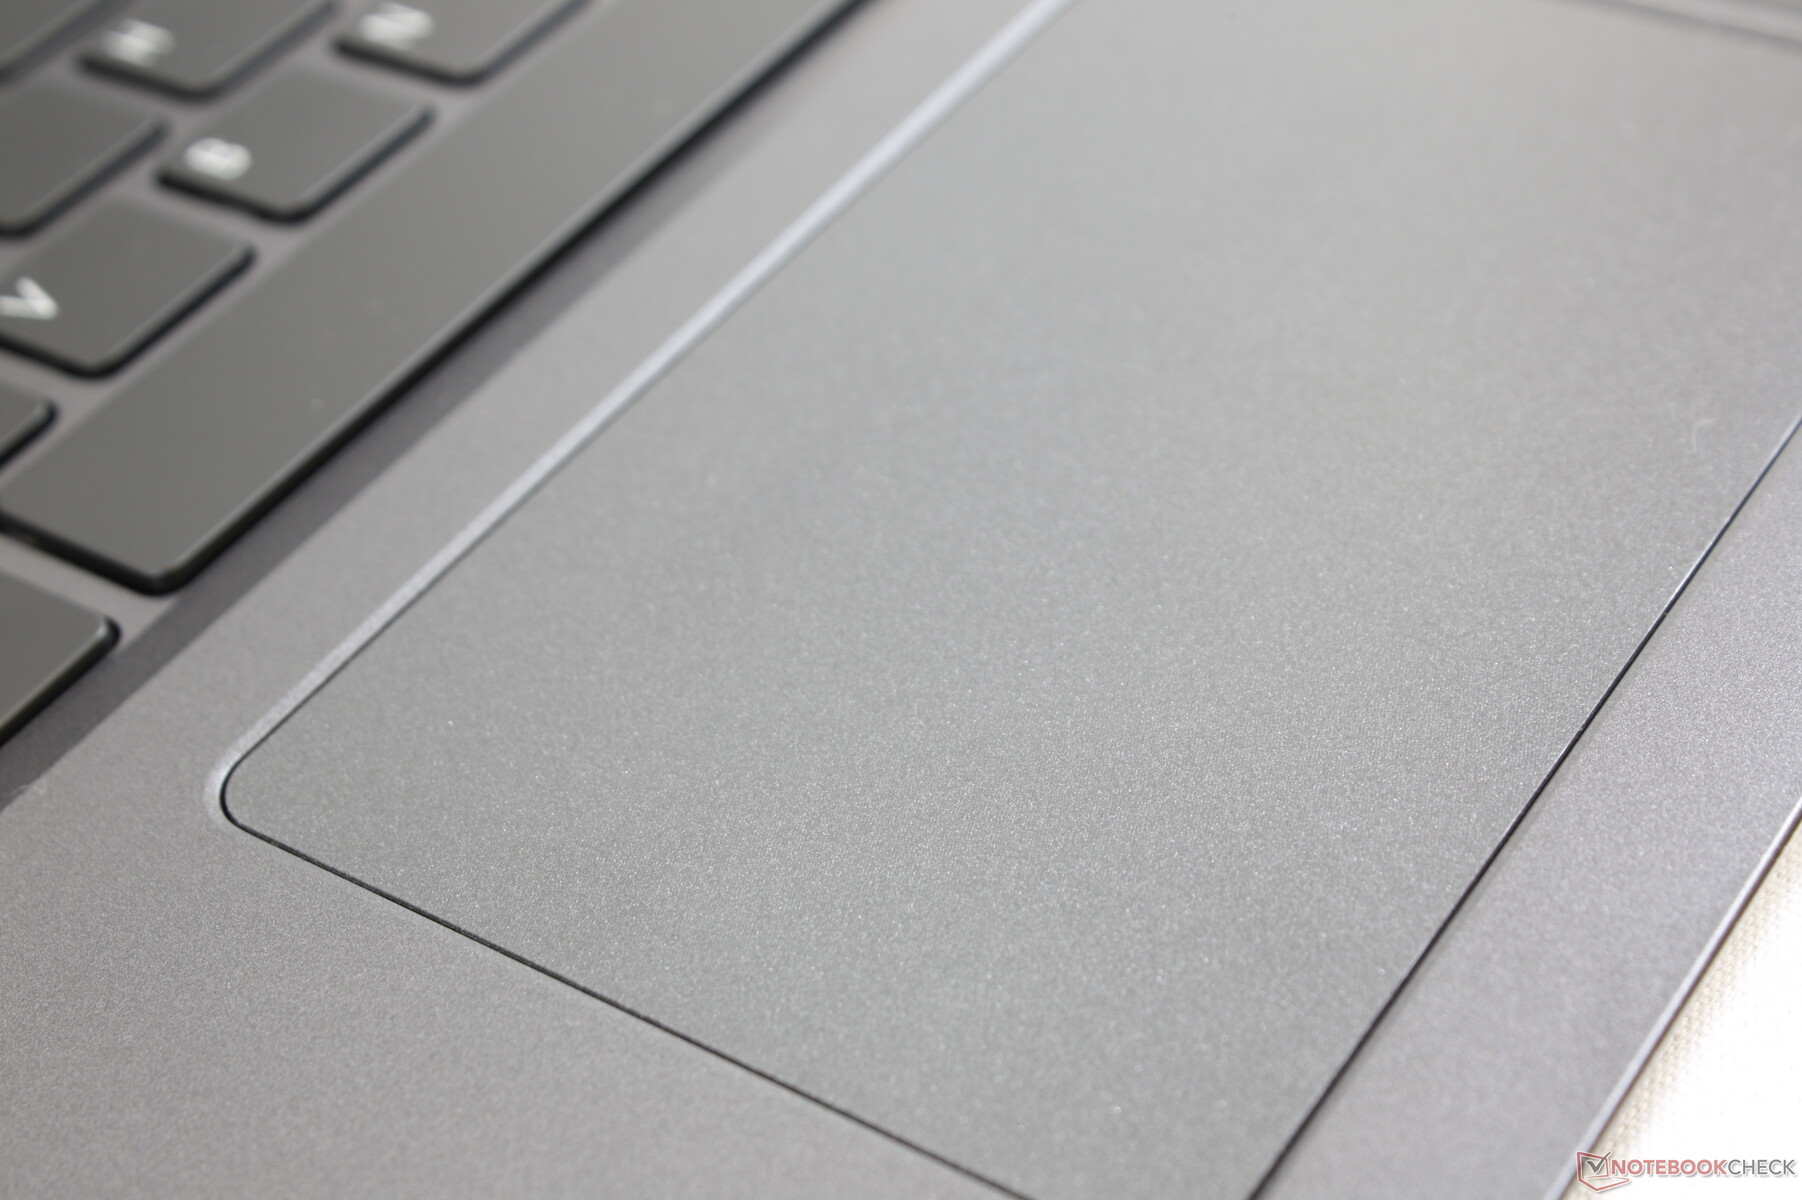
Touchpad
The Precision-enabled clickpad (10.5 x 6.5 cm) is smaller than the clickpads on both the Asus VivoBook Flip 14 (10.6 x 7.5 cm) and Walmart Motile (11.7 x 7.3 cm). Traction is smooth and reliable at most speeds with no cursor skipping issues. However, moving smoothly and accurately can be challenging at slower speeds since the finger tends to stick to the surface.
The integrated mouse keys are shallow in travel with relatively quiet and soft clicks. If you've used other inexpensive laptops in the past, then the clickpad on this Acer should be of no surprise. We much prefer dedicated mouse buttons instead for both improved accuracy and better one-handed usability.
Display
The Aspire 5 A514 uses the exact same Chi Mei N140HCA-EAC IPS panel as found on the Asus VivoBook 14 X403FA and Walmart Motile M142. Thus, all three systems share similar display response times, color reproduction, contrast ratios, and even brightness levels.
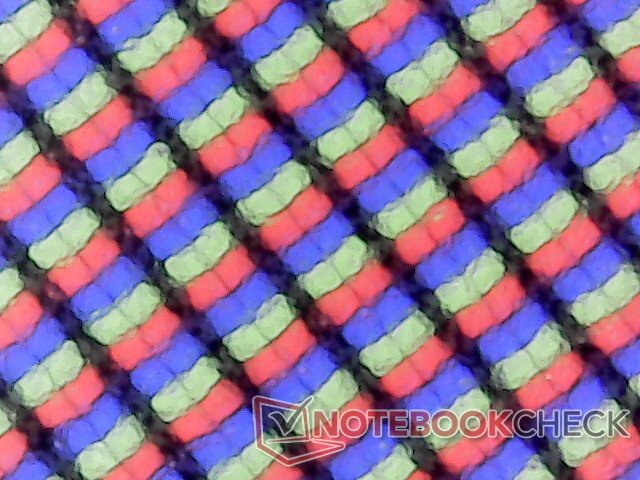
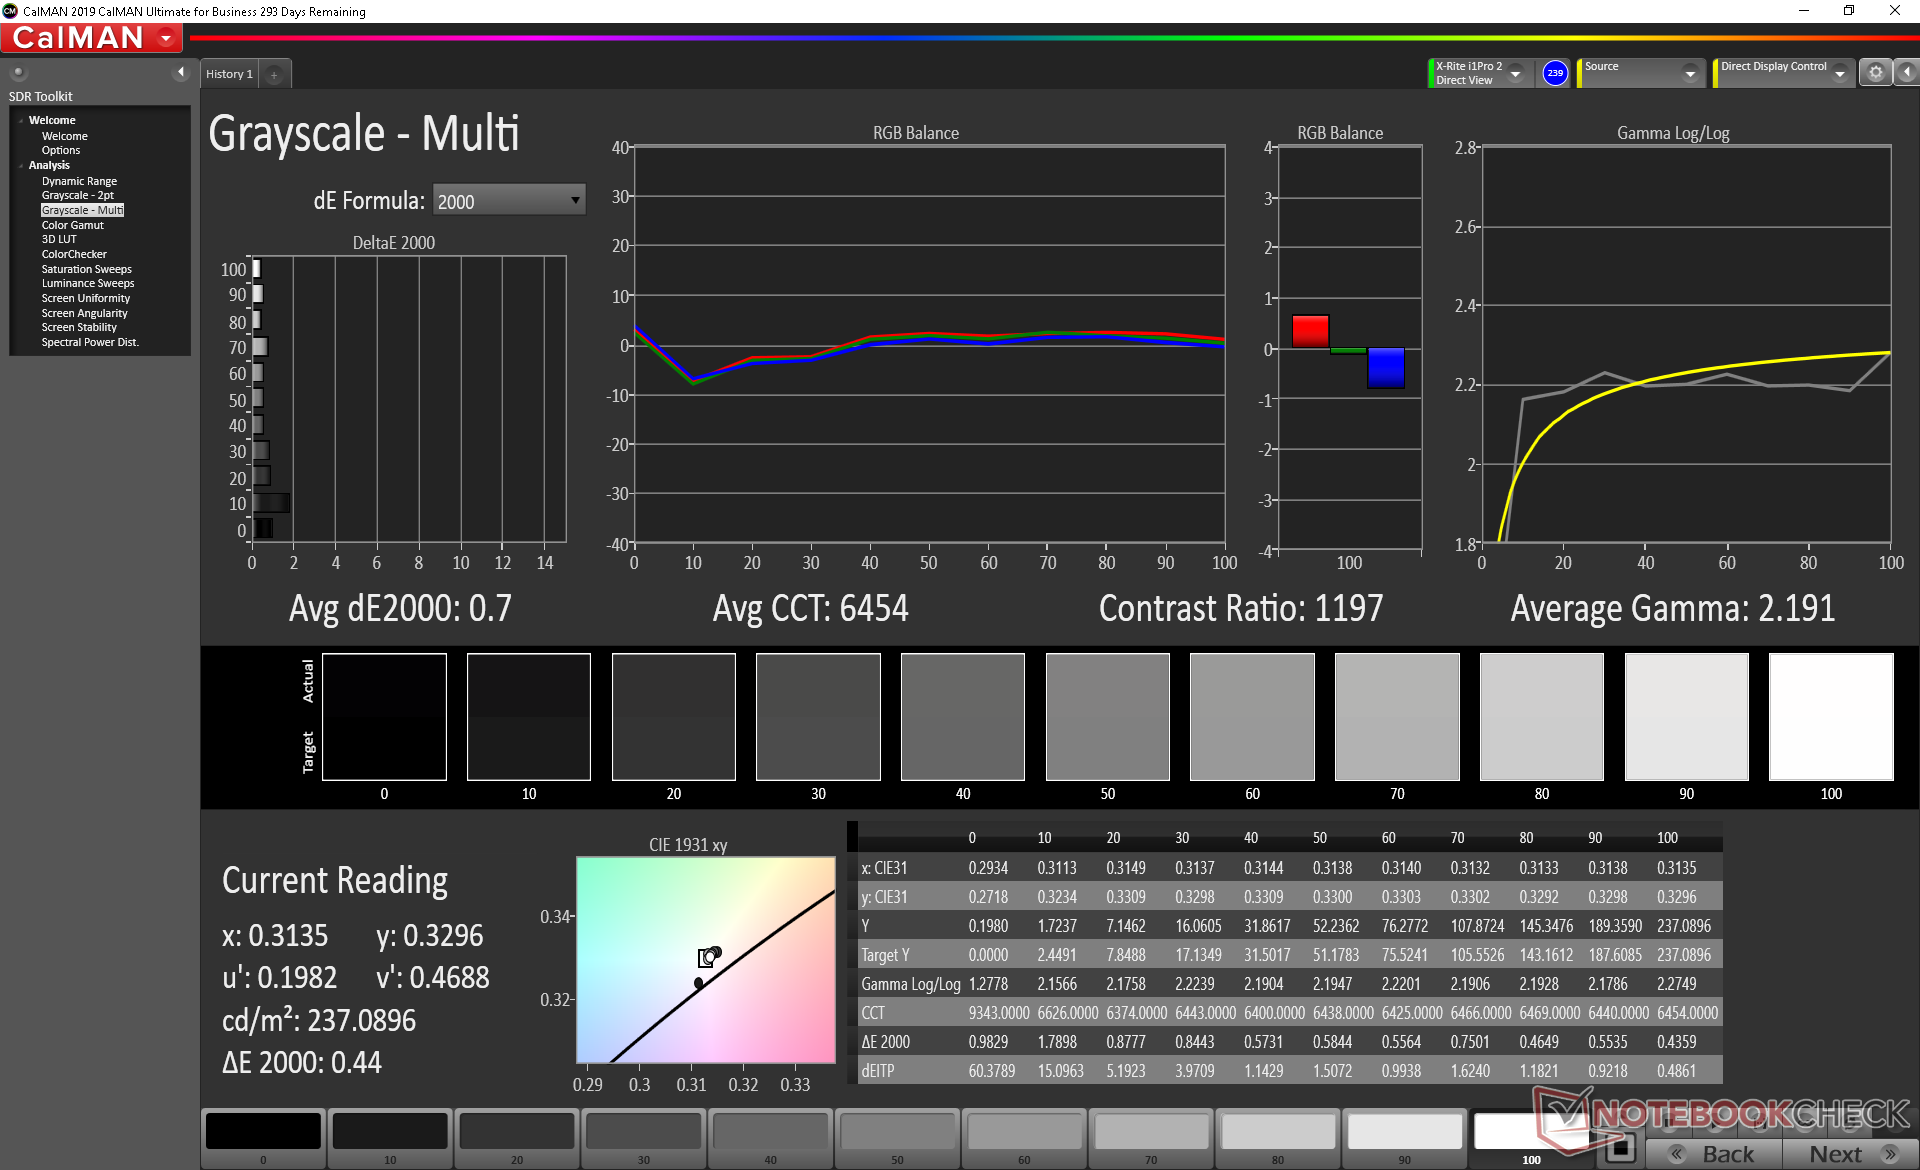
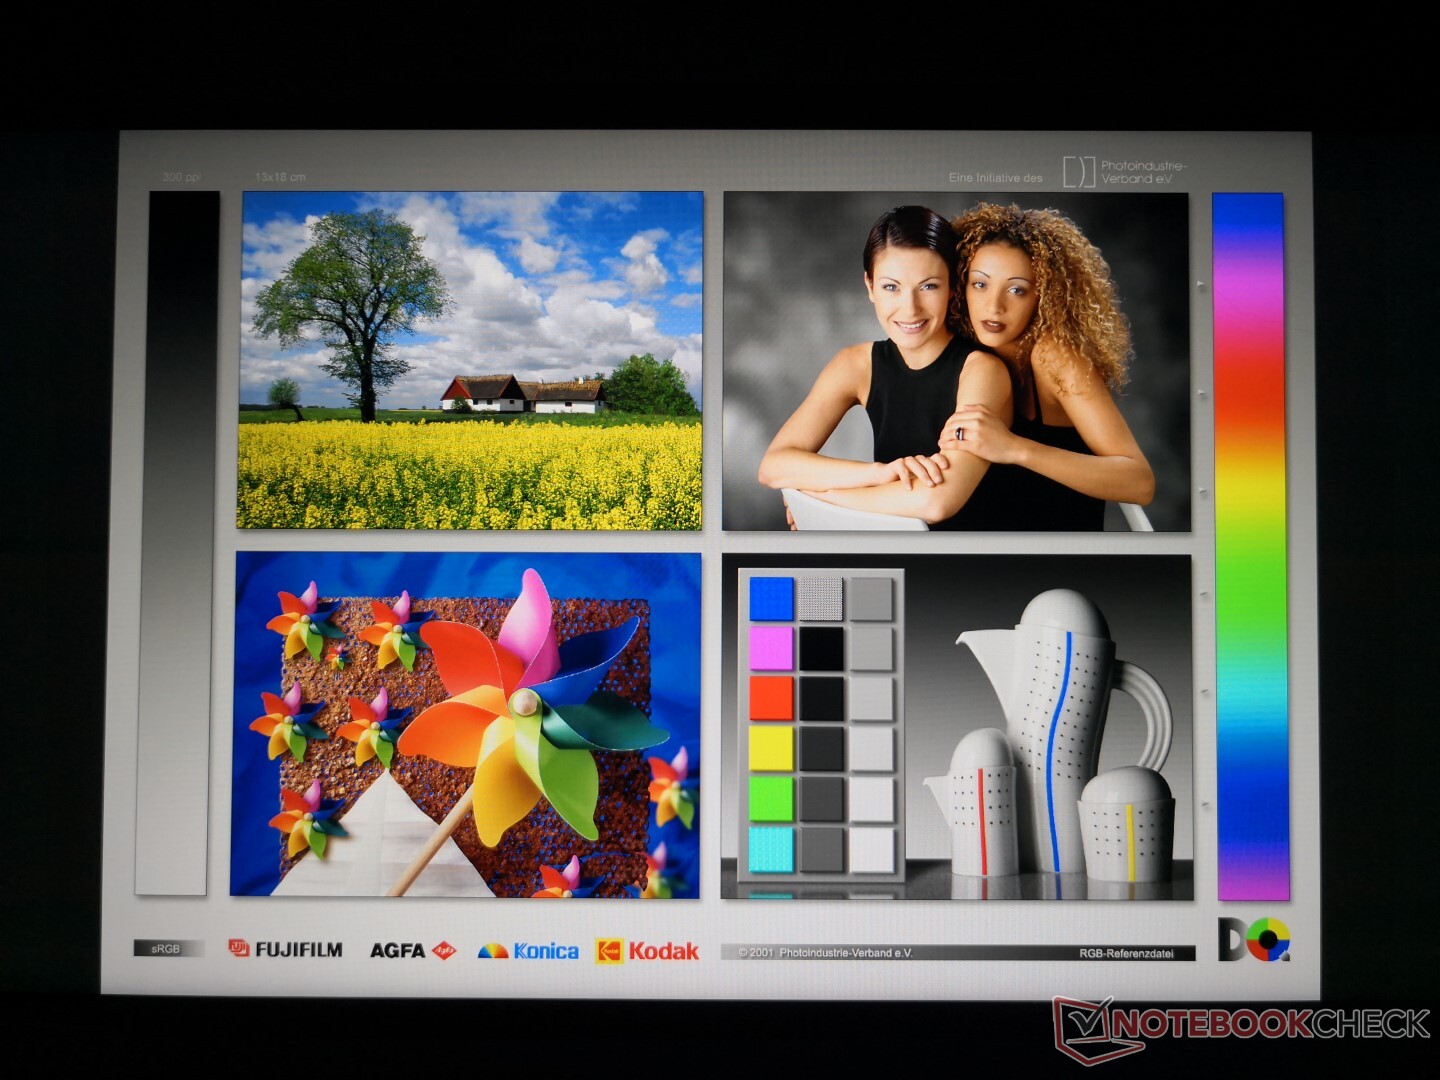
Display quality is good relative to the price. It doesn't suffer from the usual drawbacks found on most budget laptops like an overly cool color temperature or an extra-grainy matte overlay. Brightness and crispness are still a few steps below pricier alternatives like the XPS 13, Huawei MateBook 14, or the Asus ZenBook 14, but there's not much else to complain for its affordable category.

| |||||||||||||||||||||||||
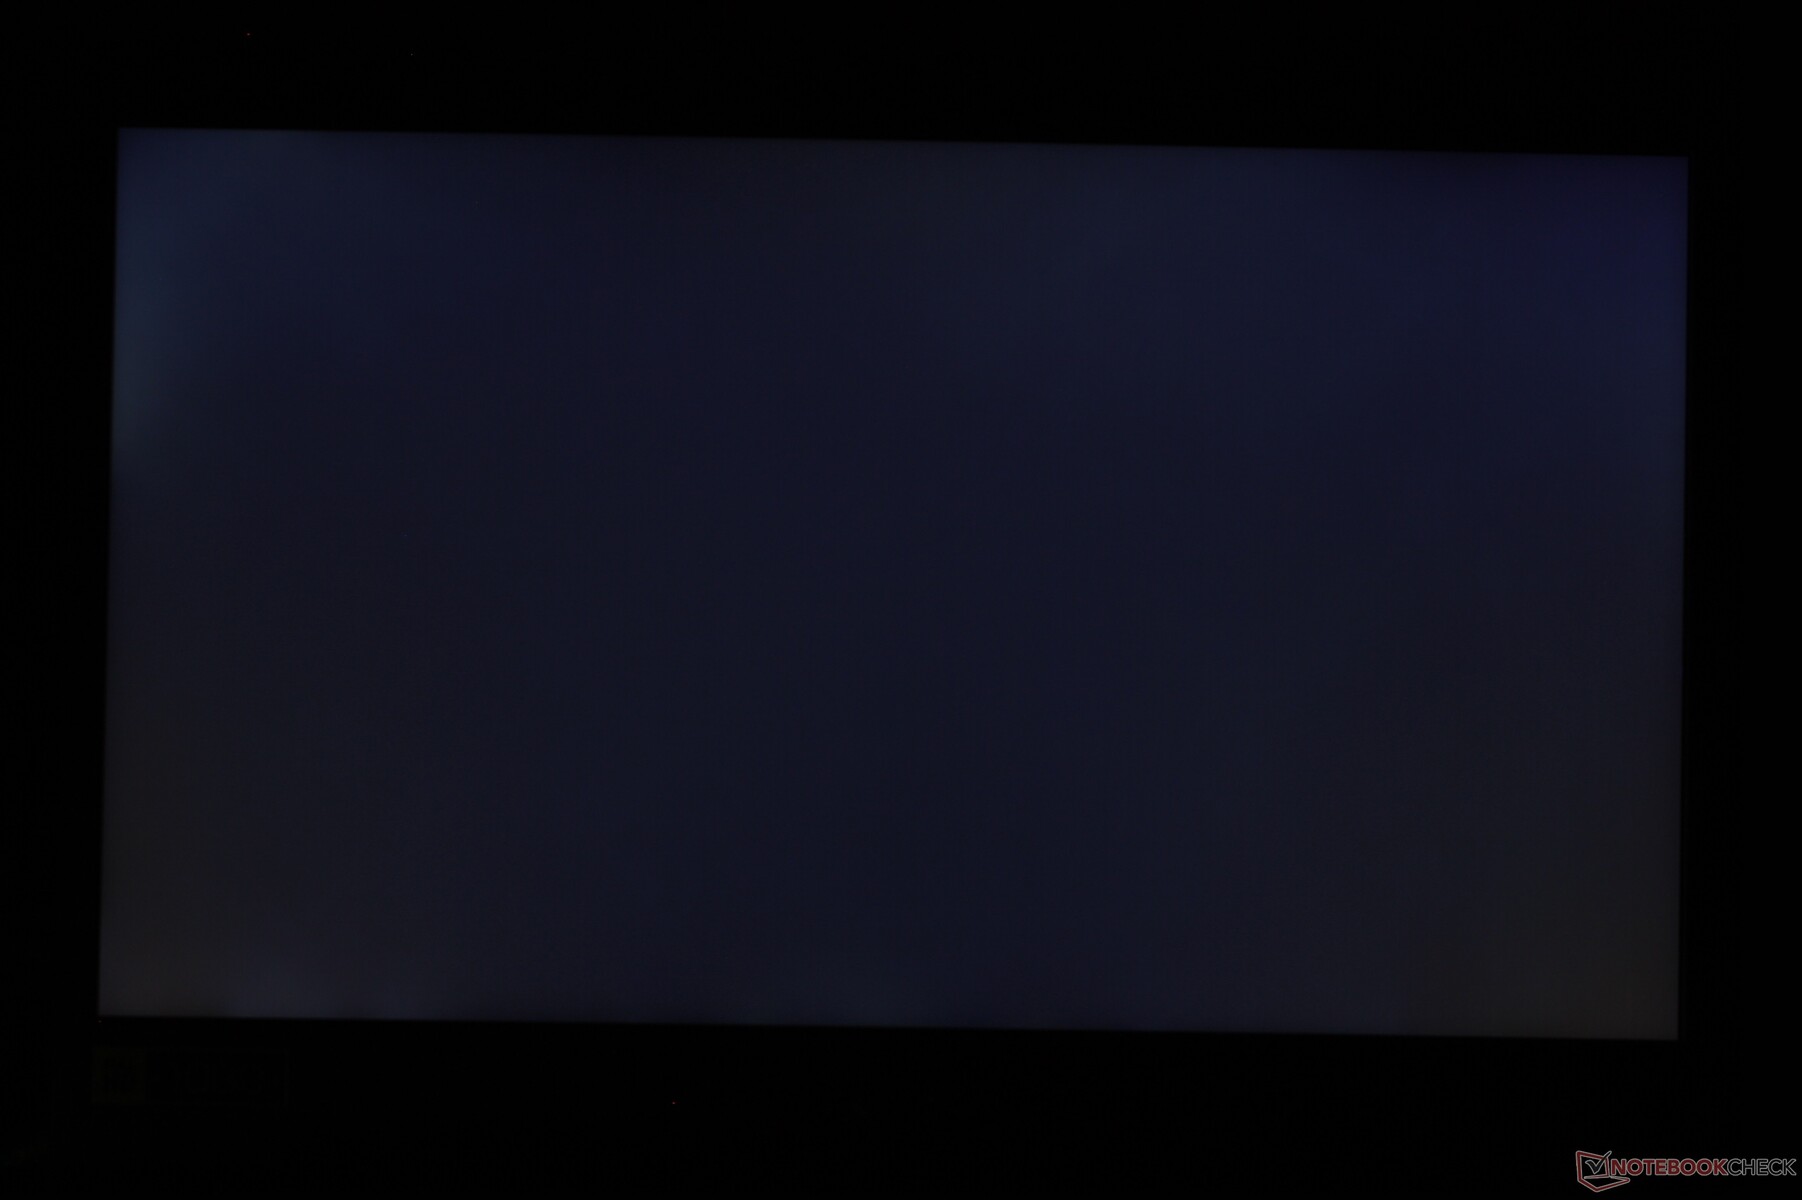
Brightness Distribution: 82 %
Center on Battery: 237.8 cd/m²
Contrast: 743:1 (Black: 0.32 cd/m²)
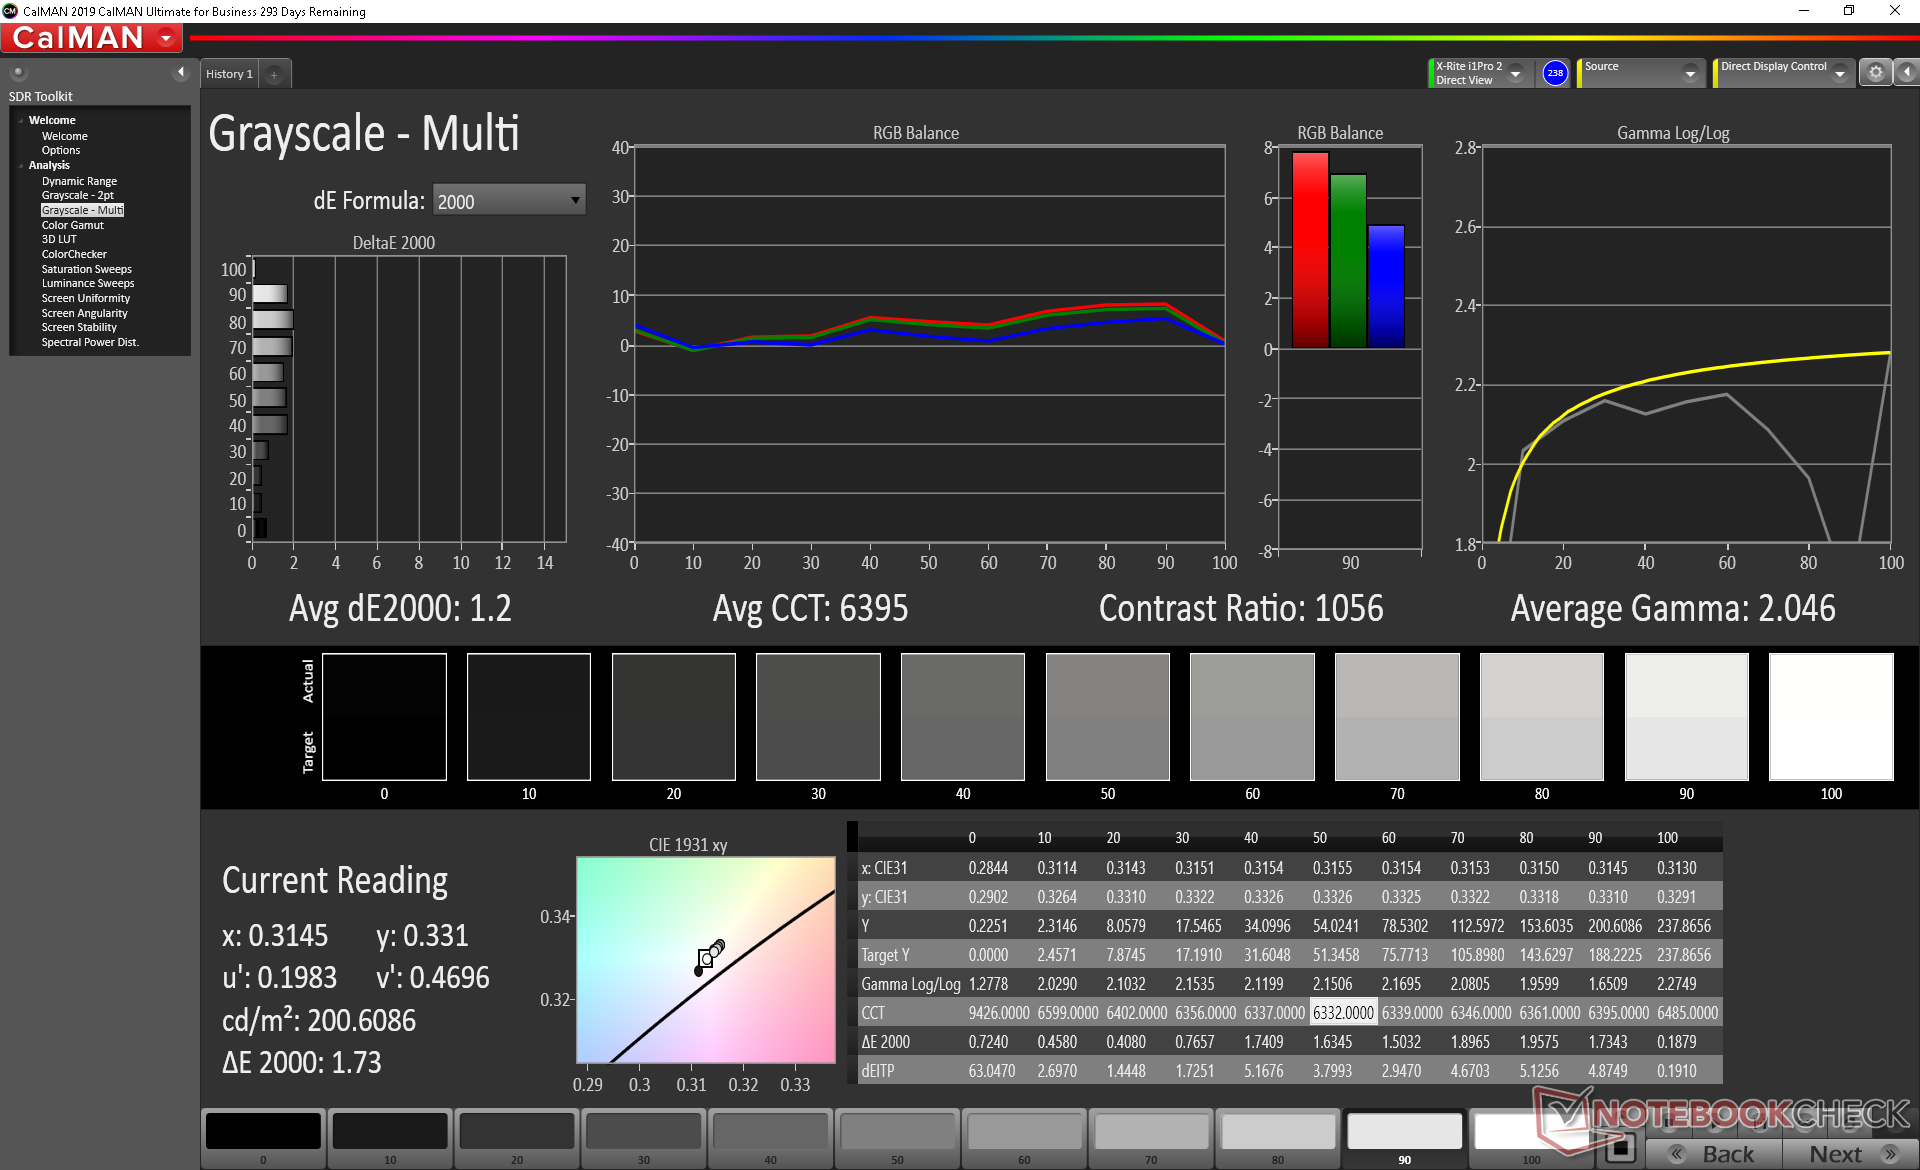
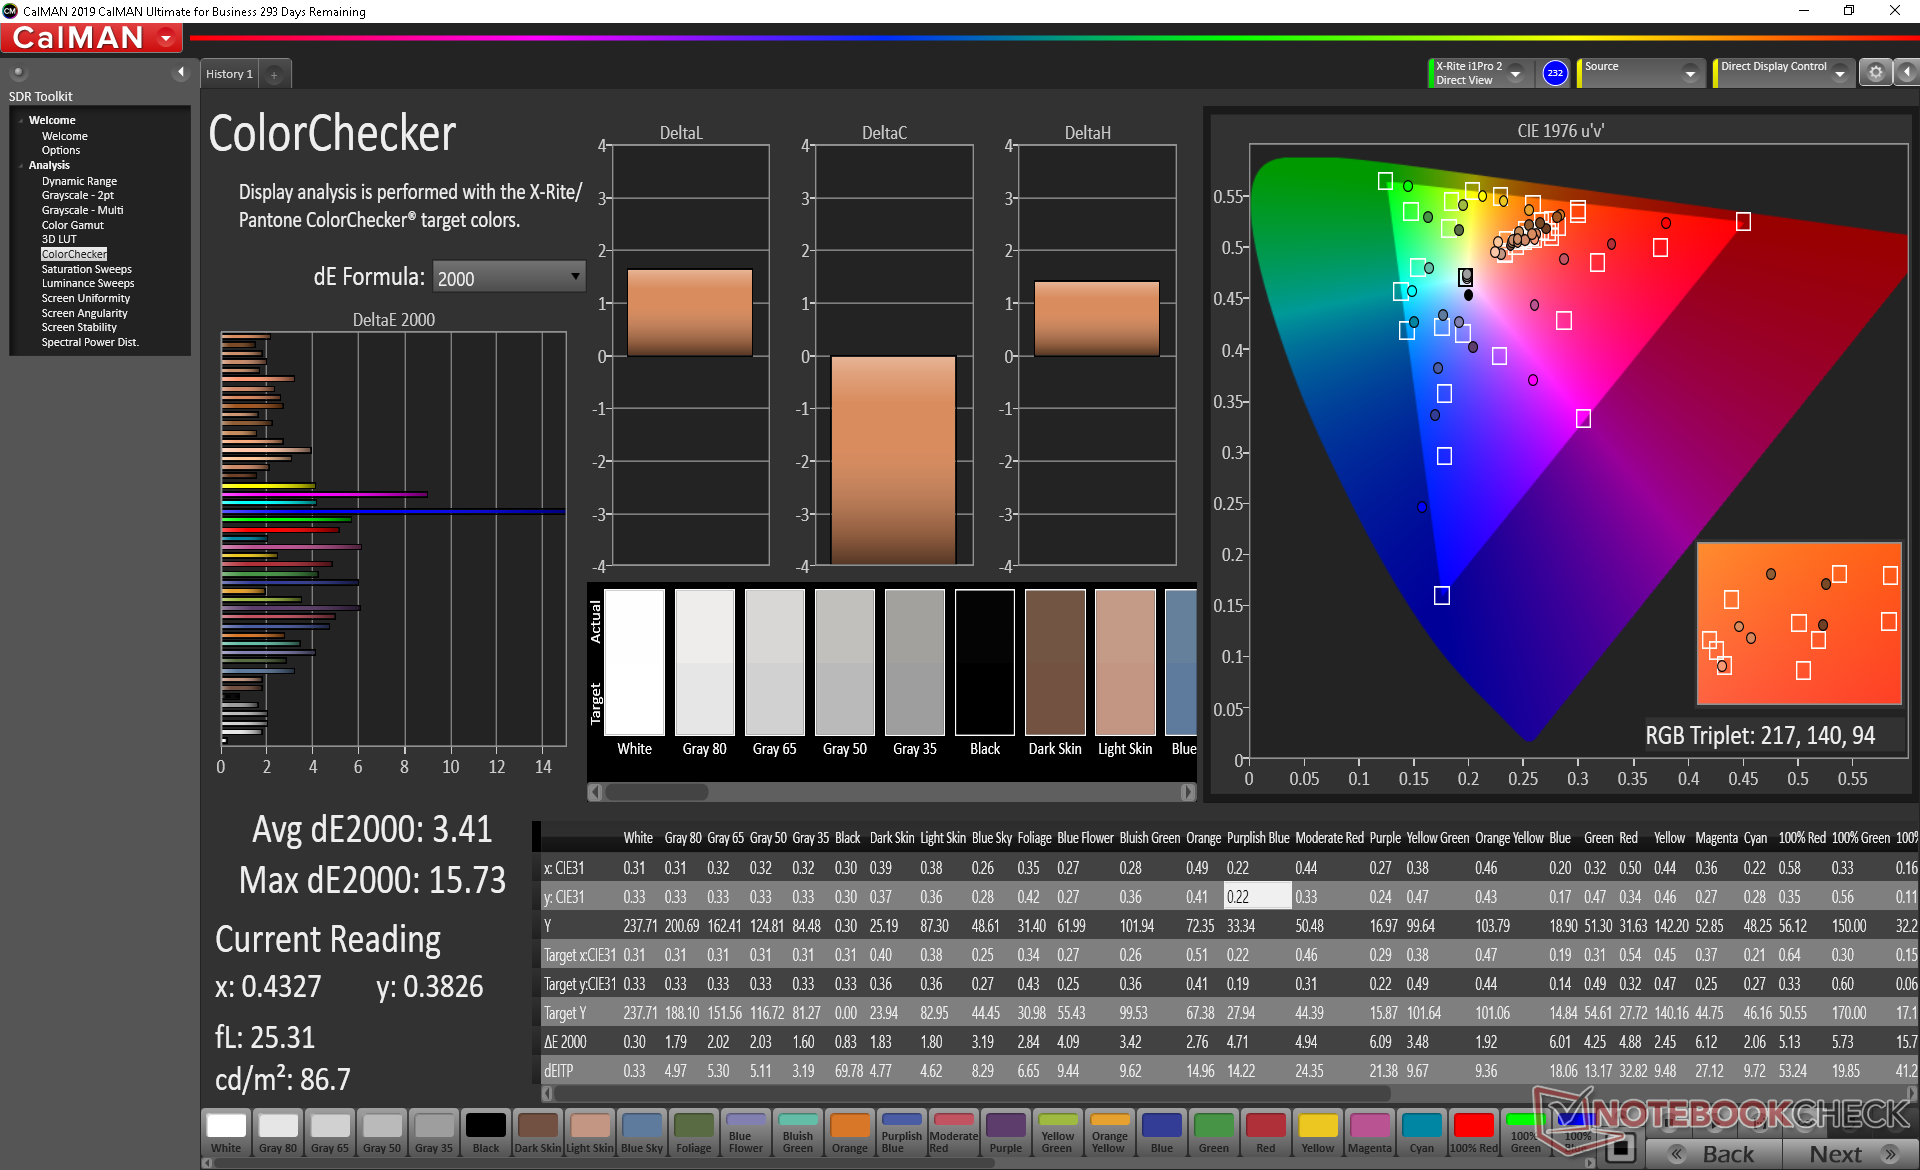
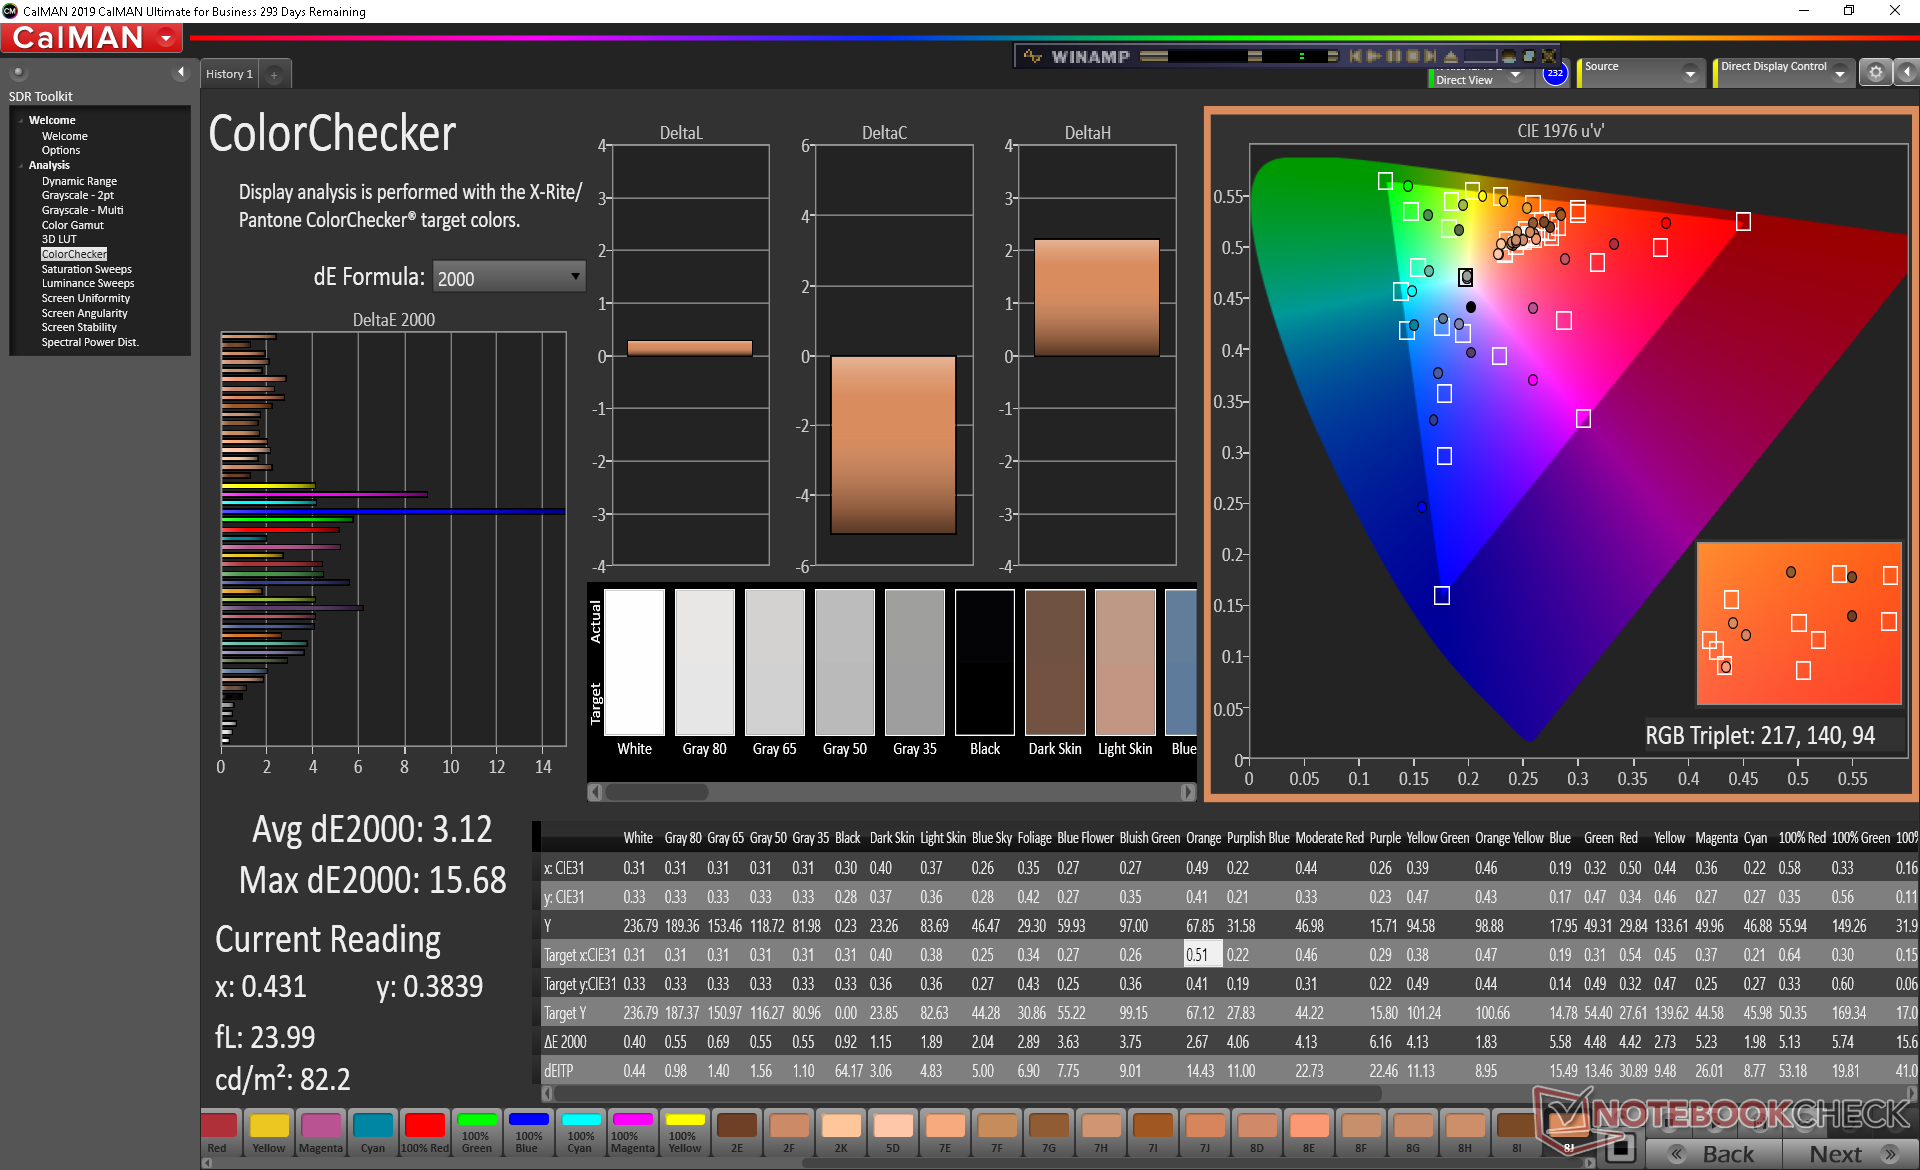
ΔE Color 3.41 | 0.5-29.43 Ø5, calibrated: 3.12
ΔE Greyscale 1.2 | 0.57-98 Ø5.3
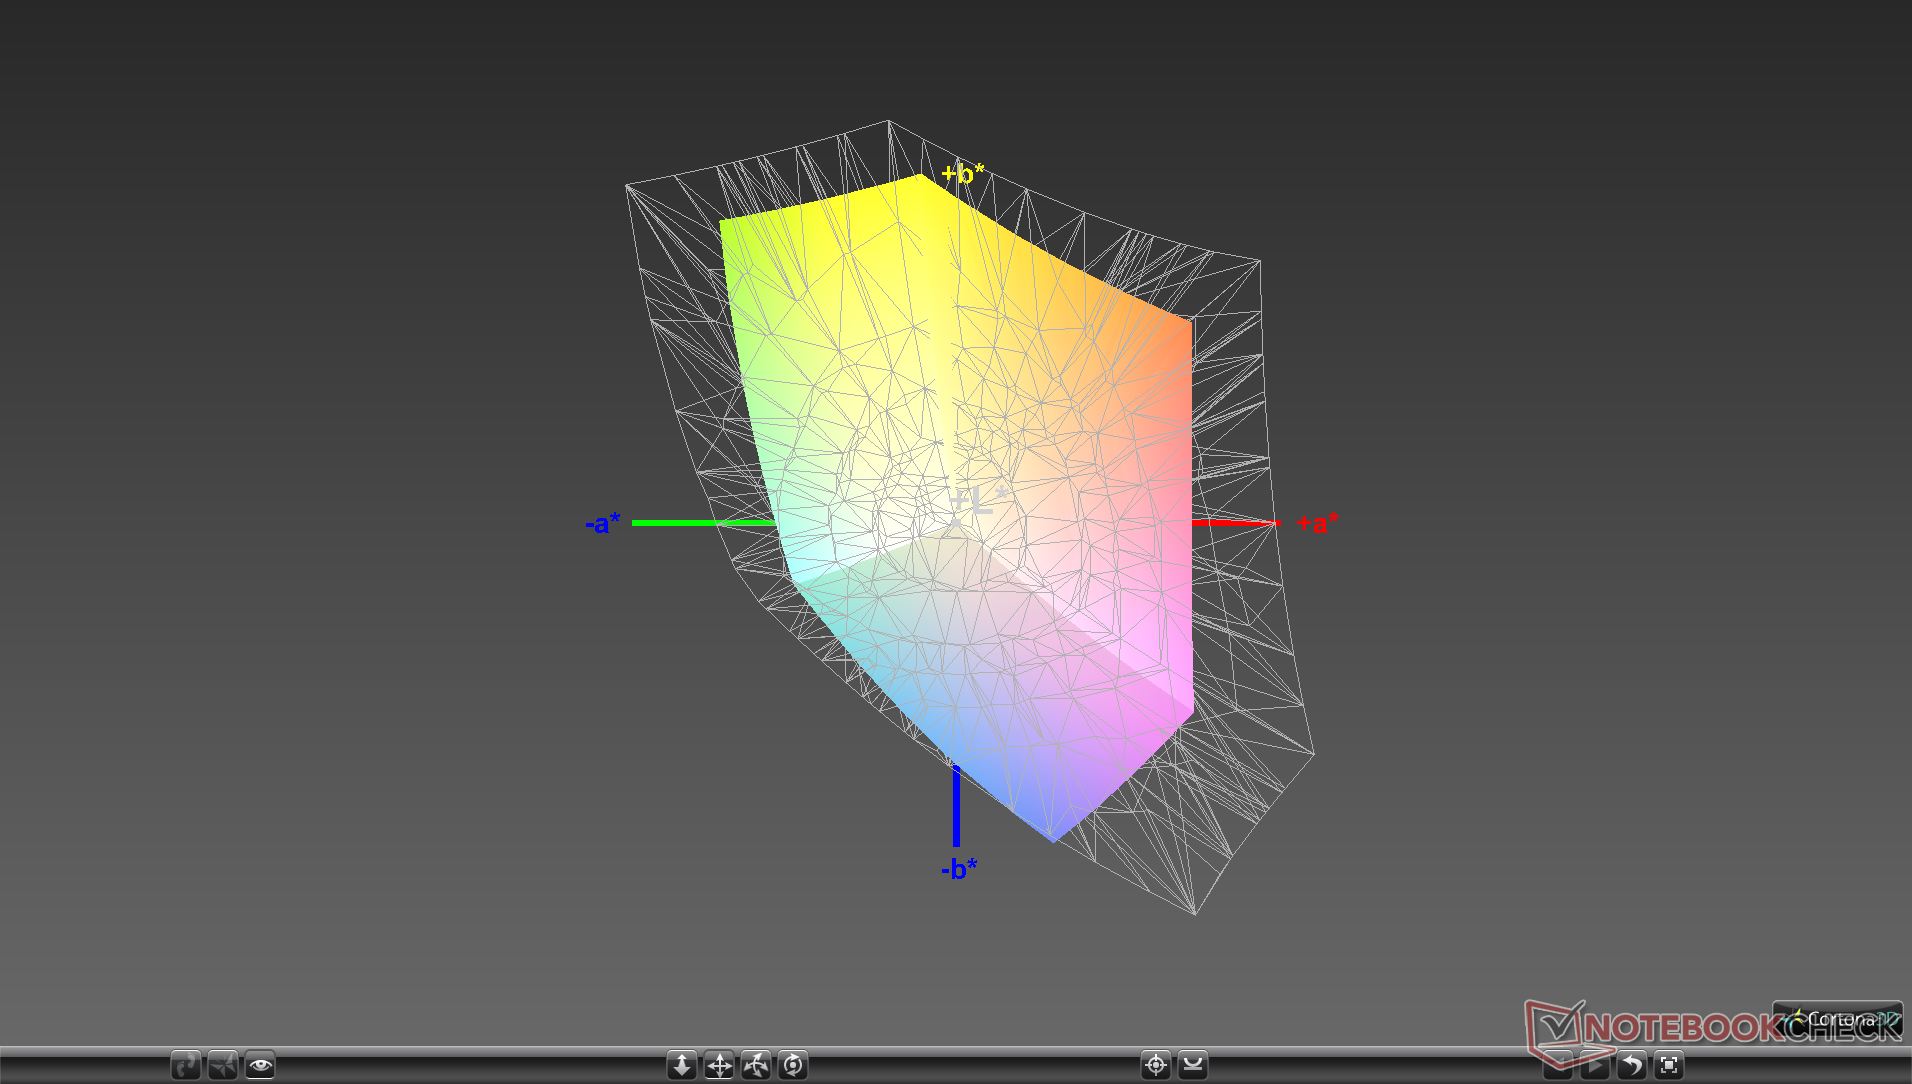
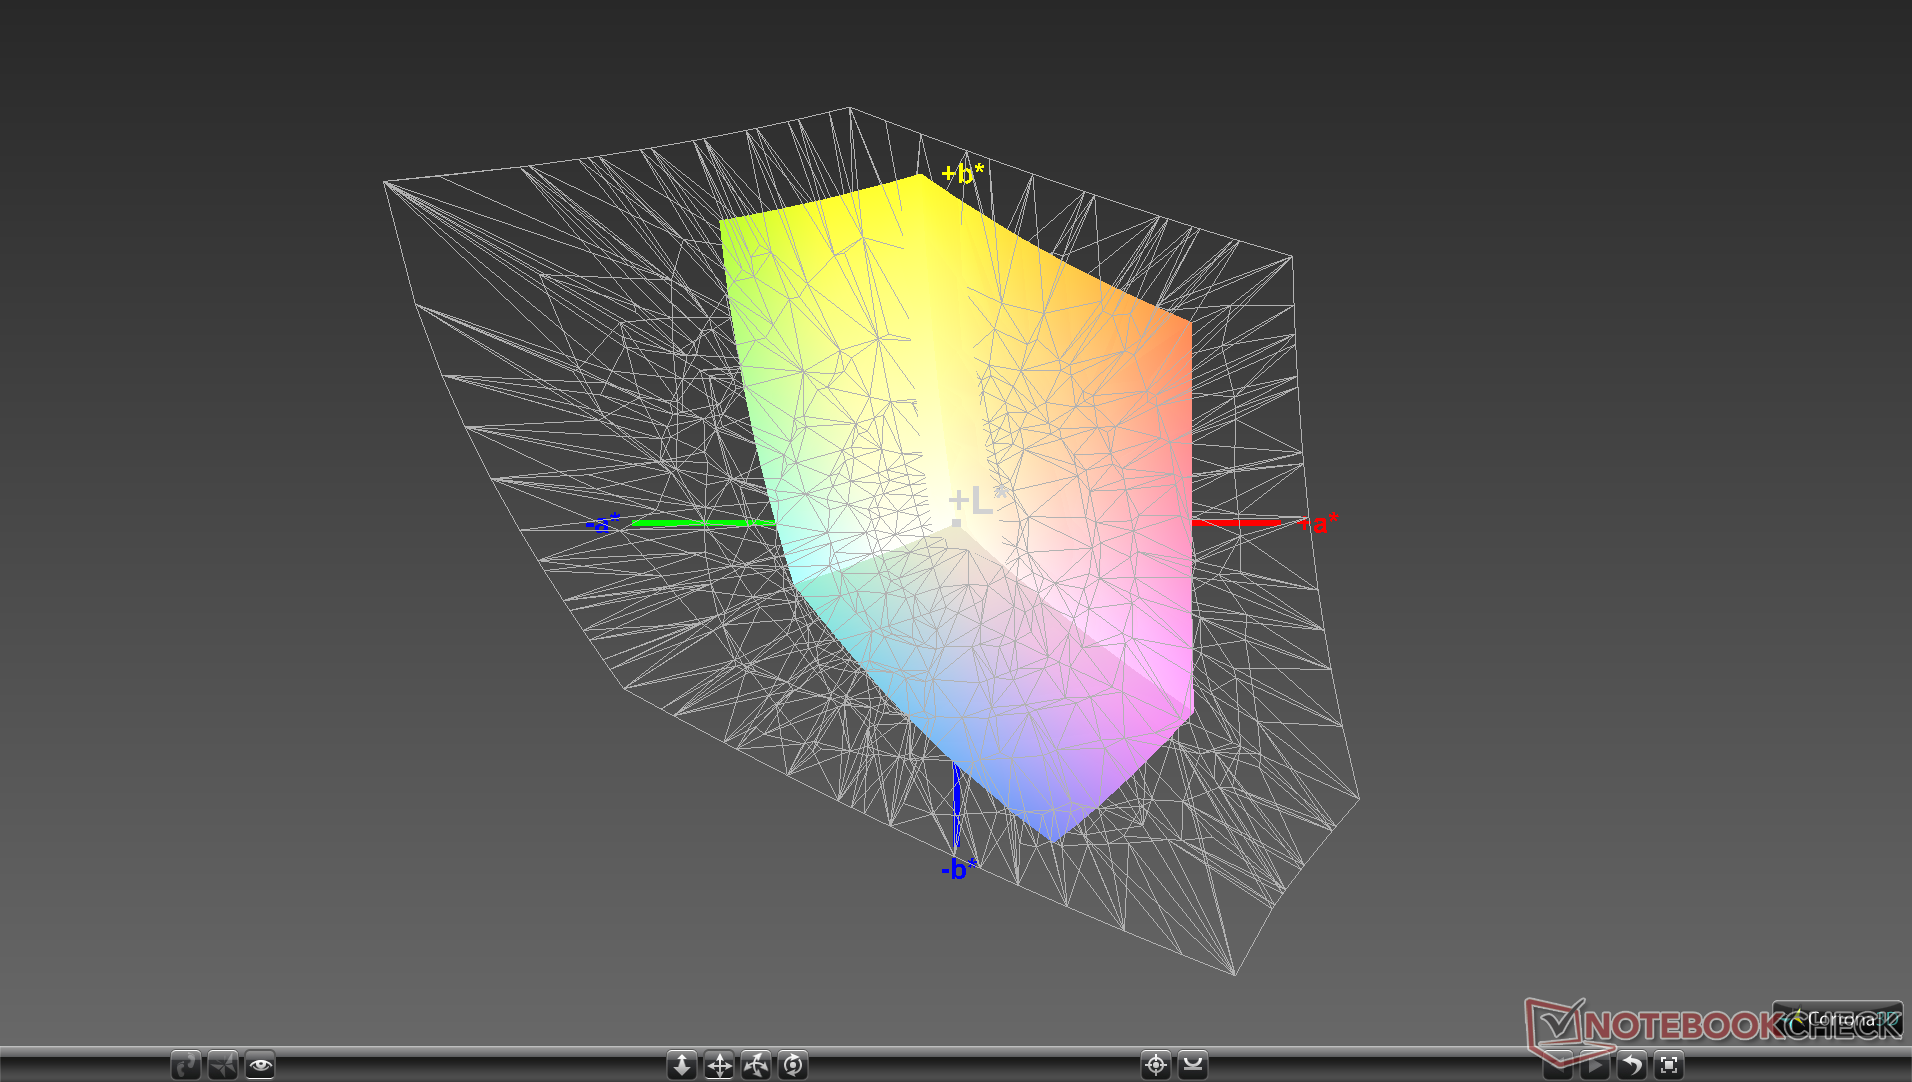
62.2% sRGB (Argyll 1.6.3 3D)
39.5% AdobeRGB 1998 (Argyll 1.6.3 3D)
42.78% AdobeRGB 1998 (Argyll 2.2.0 3D)
62.2% sRGB (Argyll 2.2.0 3D)
41.39% Display P3 (Argyll 2.2.0 3D)
Gamma: 2.05
| Acer Aspire 5 A514-52 Chi Mei N140HCA-EAC, IPS, 14.00, 1920x1080 | Asus VivoBook 14 X403FA Chi Mei N140HCA-EAC, IPS, 14.00, 1920x1080 | MSI Modern 14 A10RB-459US Chi Mei N140HCE-EN2, IPS, 14.00, 1920x1080 | Dell Inspiron 14 3493-4KWCF Chi Mei 140HCA, IPS, 14.00, 1920x1080 | Walmart Motile M142 Chi Mei N140HCA-EAC, IPS, 14.00, 1920x1080 | Lenovo Ideapad C340-14API 81N6004UGE BOE CQ NV140FHM-N48, IPS, 14.00, 1920x1080 | |
|---|---|---|---|---|---|---|
| Display | -1% | 53% | 1% | 1% | -5% | |
| Display P3 Coverage | 41.39 | 40.85 -1% | 64.2 55% | 41.84 1% | 41.95 1% | 39.63 -4% |
| sRGB Coverage | 62.2 | 61.1 -2% | 94.8 52% | 62.3 0% | 62.5 0% | 58.6 -6% |
| AdobeRGB 1998 Coverage | 42.78 | 42.25 -1% | 65.4 53% | 43.33 1% | 43.43 2% | 40.94 -4% |
| Response Times | 9% | 1% | -25% | 16% | -31% | |
| Response Time Grey 50% / Grey 80% * | 55.6 ? | 40.8 ? 27% | 39.2 ? 29% | 41 ? 26% | 35.2 ? 37% | 43 ? 23% |
| Response Time Black / White * | 27.6 ? | 27.2 ? 1% | 35.6 ? -29% | 31 ? -12% | 25.2 ? 9% | 32 ? -16% |
| PWM Frequency | 24510 ? | 24510 ? 0% | 25000 ? 2% | 2500 ? -90% | 25000 ? 2% | 208 ? -99% |
| Screen | -16% | 37% | -17% | -13% | -30% | |
| Brightness middle | 237.8 | 250 5% | 324.1 36% | 226 -5% | 240.3 1% | 285 20% |
| Brightness | 231 | 236 2% | 301 30% | 214 -7% | 233 1% | 273 18% |
| Brightness Distribution | 82 | 78 -5% | 87 6% | 92 12% | 82 0% | 87 6% |
| Black Level * | 0.32 | 0.27 16% | 0.22 31% | 0.17 47% | 0.27 16% | 0.4 -25% |
| Contrast | 743 | 926 25% | 1473 98% | 1329 79% | 890 20% | 713 -4% |
| Colorchecker dE 2000 * | 3.41 | 5 -47% | 1.63 52% | 5.21 -53% | 4.22 -24% | 5.62 -65% |
| Colorchecker dE 2000 max. * | 15.73 | 20.7 -32% | 4.25 73% | 22.15 -41% | 23.32 -48% | 17.22 -9% |
| Colorchecker dE 2000 calibrated * | 3.12 | 4.3 -38% | 1.42 54% | 4.43 -42% | 3.76 -21% | |
| Greyscale dE 2000 * | 1.2 | 2.4 -100% | 2.2 -83% | 3.27 -173% | 2.3 -92% | 3.97 -231% |
| Gamma | 2.05 107% | 2.05 107% | 2.26 97% | 2.36 93% | 2.39 92% | 2.28 96% |
| CCT | 6395 102% | 6697 97% | 6887 94% | 6538 99% | 6585 99% | 6848 95% |
| Color Space (Percent of AdobeRGB 1998) | 39.5 | 38.9 -2% | 60.2 52% | 40 1% | 39.9 1% | 38 -4% |
| Color Space (Percent of sRGB) | 62.2 | 61 -2% | 95 53% | 62 0% | 62.1 0% | 58 -7% |
| Total Average (Program / Settings) | -3% /
-9% | 30% /
33% | -14% /
-15% | 1% /
-6% | -22% /
-25% |
* ... smaller is better
Color space covers approximately 40 percent and 62 percent of the AdobeRGB and sRGB standards, respectively, to indicate a budget panel. The display on the pricier MSI Modern 14, for example, covers nearly all of sRGB for deeper and more accurate colors. You'll want to look beyond the Acer Aspire series if you intend to do a lot of video or photo editing.
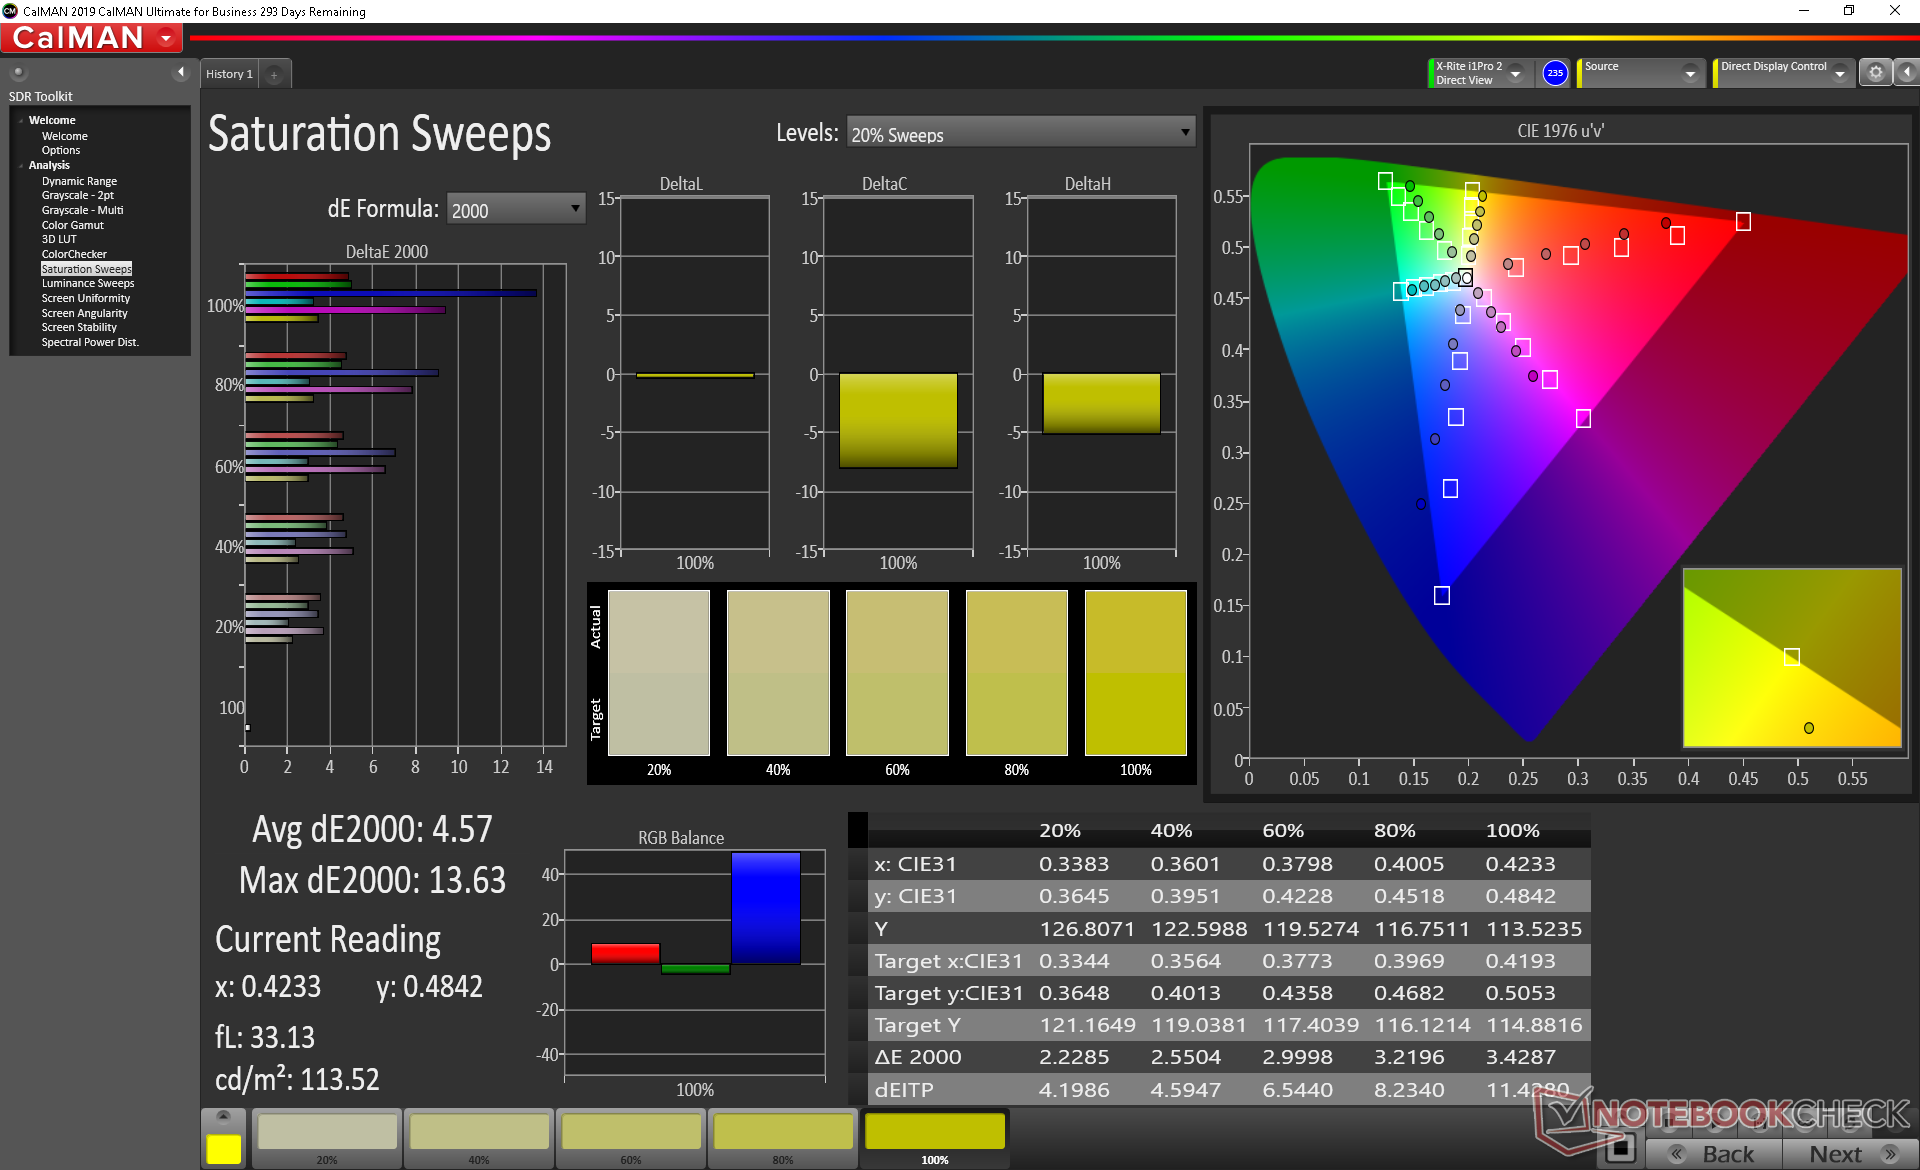
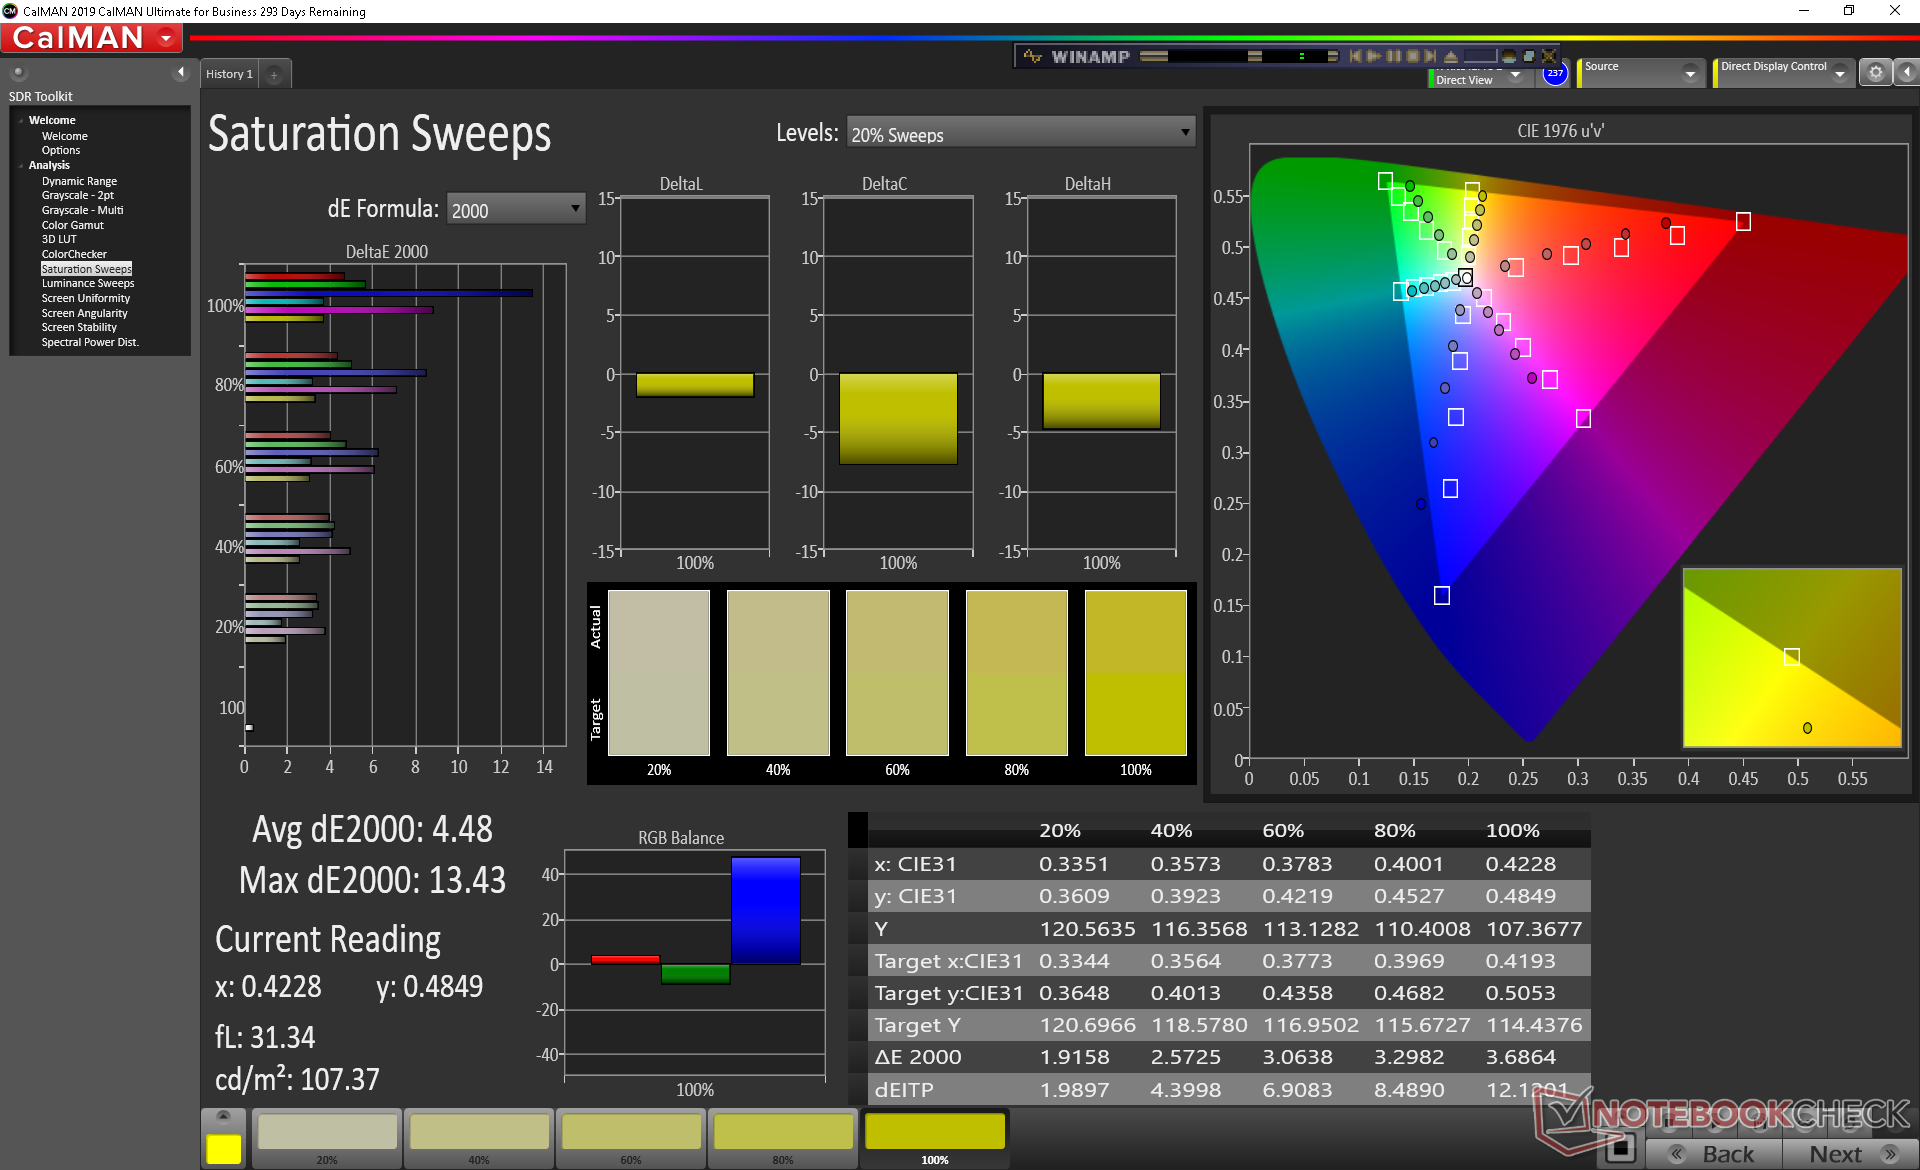
Further measurements with an X-Rite colorimeter reveal a well-calibrated display out of the box which is surprising for a budget to mid-range laptop. Average grayscale and color DeltaE values sit at just 1.2 and 4.57, respectively, and our own attempt to calibrate the display results in no major improvements. Nonetheless, colors still become increasingly inaccurate at higher saturation levels due to the limited color space mentioned above. Additionally, the panel seems to have issues accurately reproducing the color Blue as it appears Blue Violet instead.
Display Response Times
| ↔ Response Time Black to White | ||
|---|---|---|
| 27.6 ms ... rise ↗ and fall ↘ combined | ↗ 17.2 ms rise | 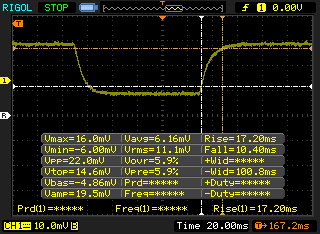 |
| ↘ 10.4 ms fall | ||
| The screen shows relatively slow response rates in our tests and may be too slow for gamers. In comparison, all tested devices range from 0.1 (minimum) to 240 (maximum) ms. » 66 % of all devices are better. This means that the measured response time is worse than the average of all tested devices (21.5 ms). | ||
| ↔ Response Time 50% Grey to 80% Grey | ||
| 55.6 ms ... rise ↗ and fall ↘ combined | ↗ 24.4 ms rise | 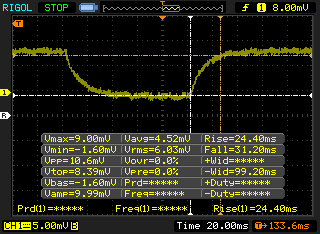 |
| ↘ 31.2 ms fall | ||
| The screen shows slow response rates in our tests and will be unsatisfactory for gamers. In comparison, all tested devices range from 0.2 (minimum) to 636 (maximum) ms. » 91 % of all devices are better. This means that the measured response time is worse than the average of all tested devices (33.7 ms). | ||
Screen Flickering / PWM (Pulse-Width Modulation)
| Screen flickering / PWM detected | 24510 Hz | ≤ 19 % brightness setting | 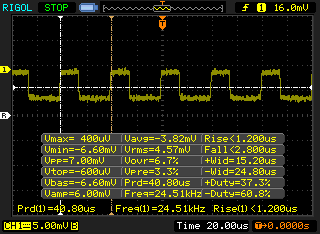 |
The display backlight flickers at 24510 Hz (worst case, e.g., utilizing PWM) Flickering detected at a brightness setting of 19 % and below. There should be no flickering or PWM above this brightness setting. The frequency of 24510 Hz is quite high, so most users sensitive to PWM should not notice any flickering. In comparison: 53 % of all tested devices do not use PWM to dim the display. If PWM was detected, an average of 17900 (minimum: 5 - maximum: 3846000) Hz was measured. | |||
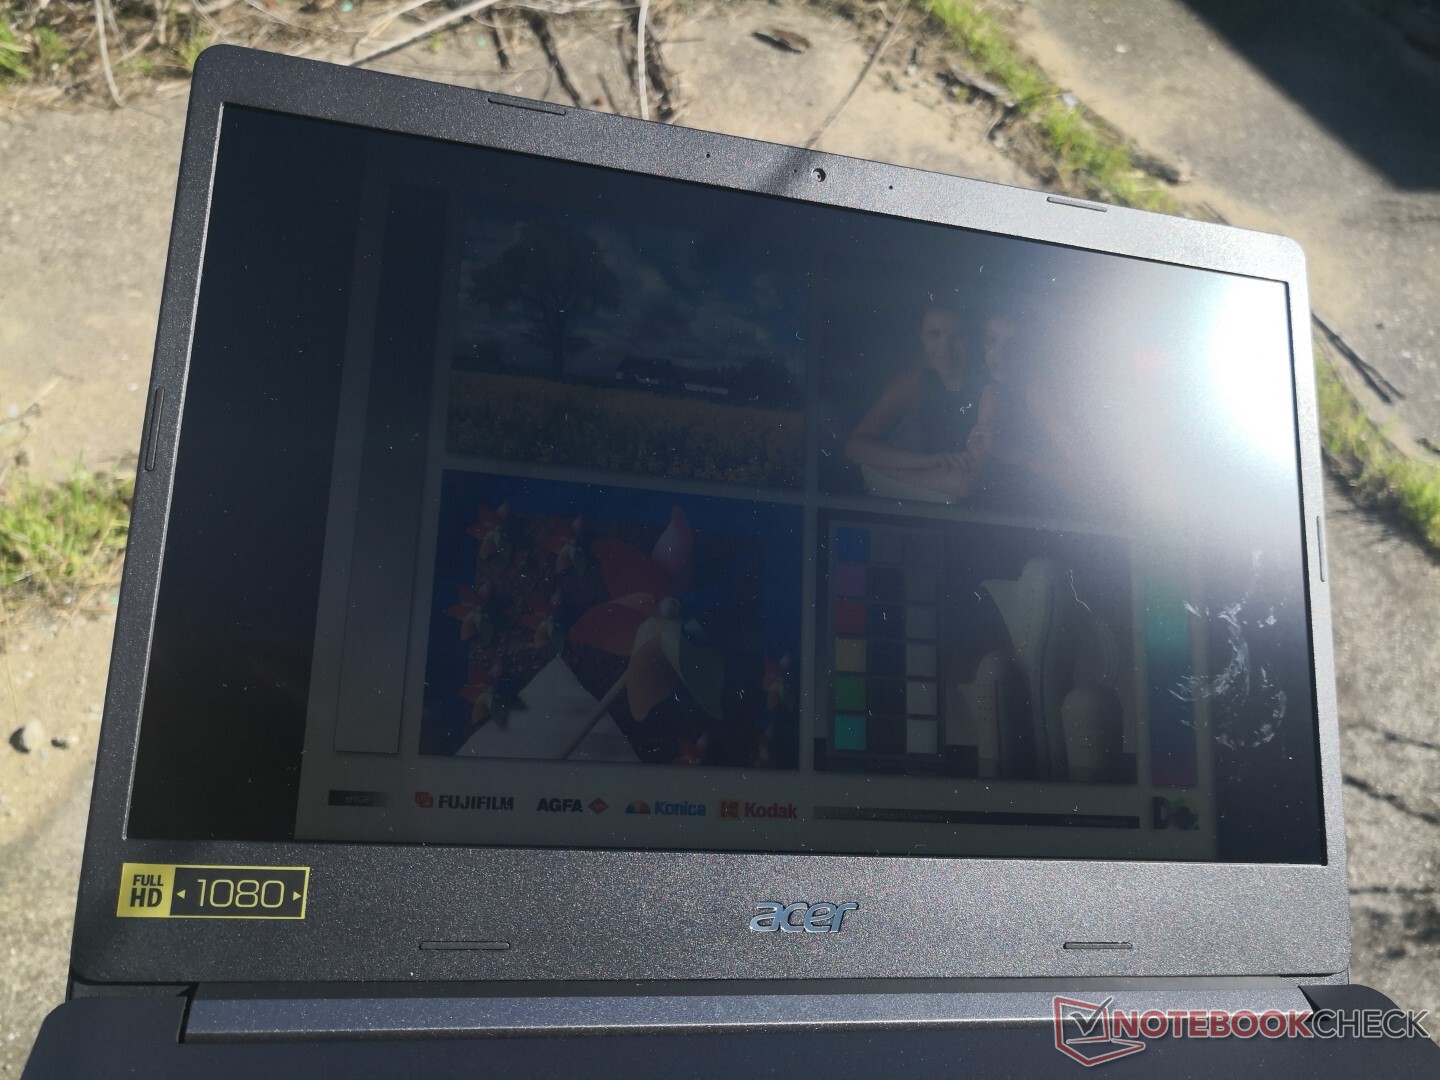
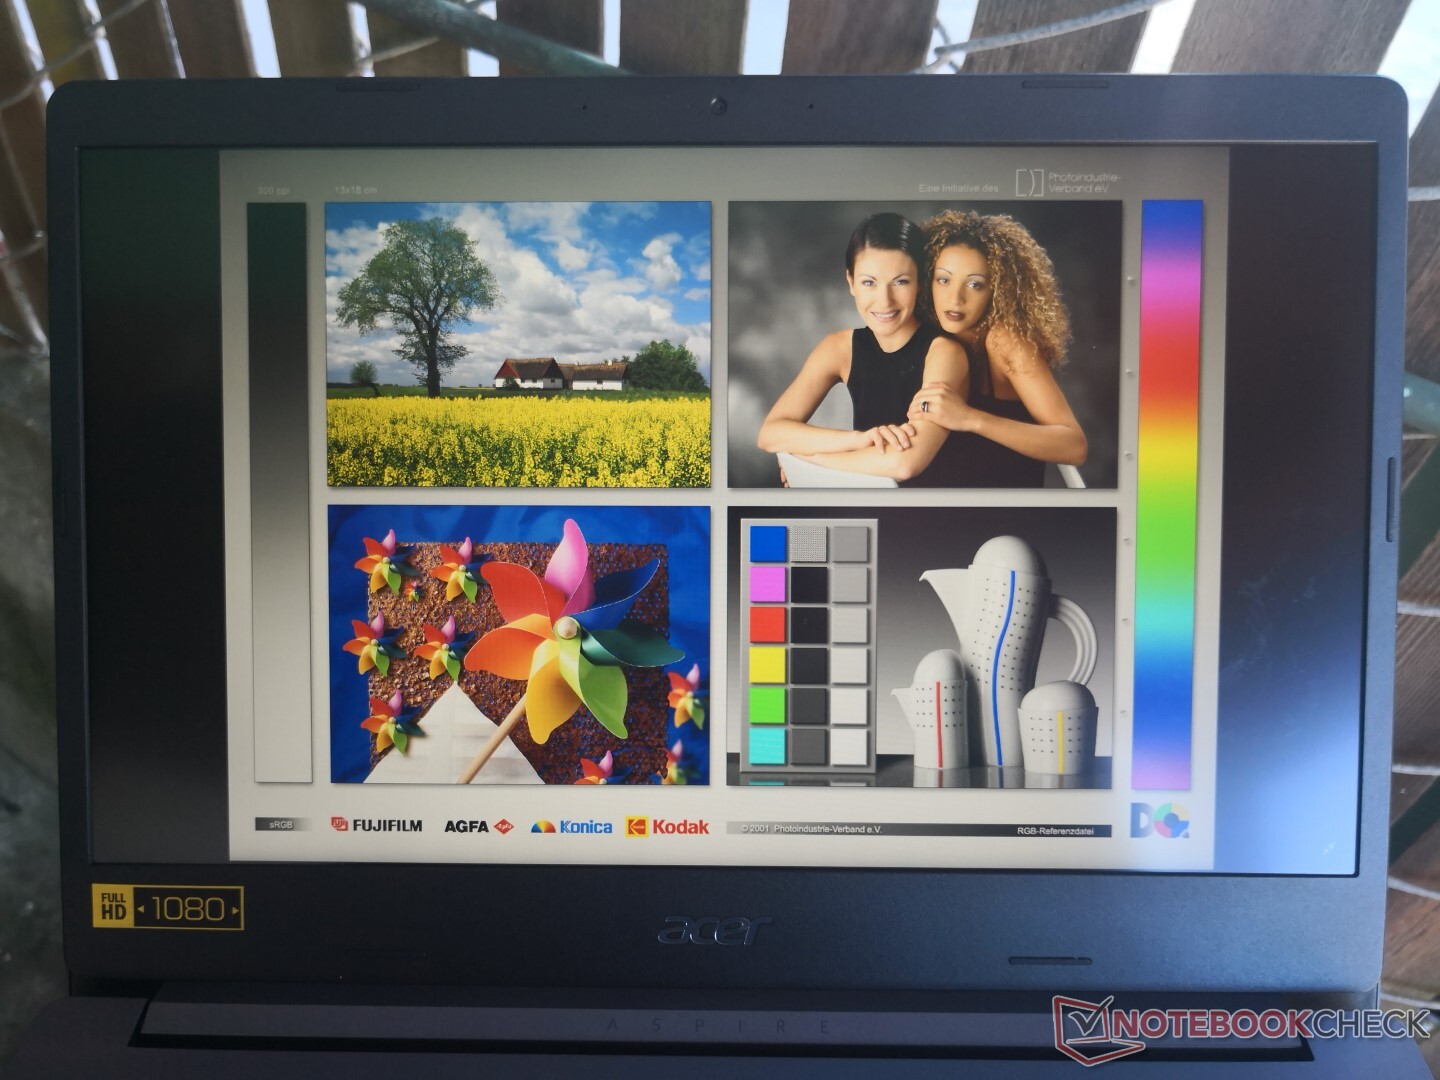
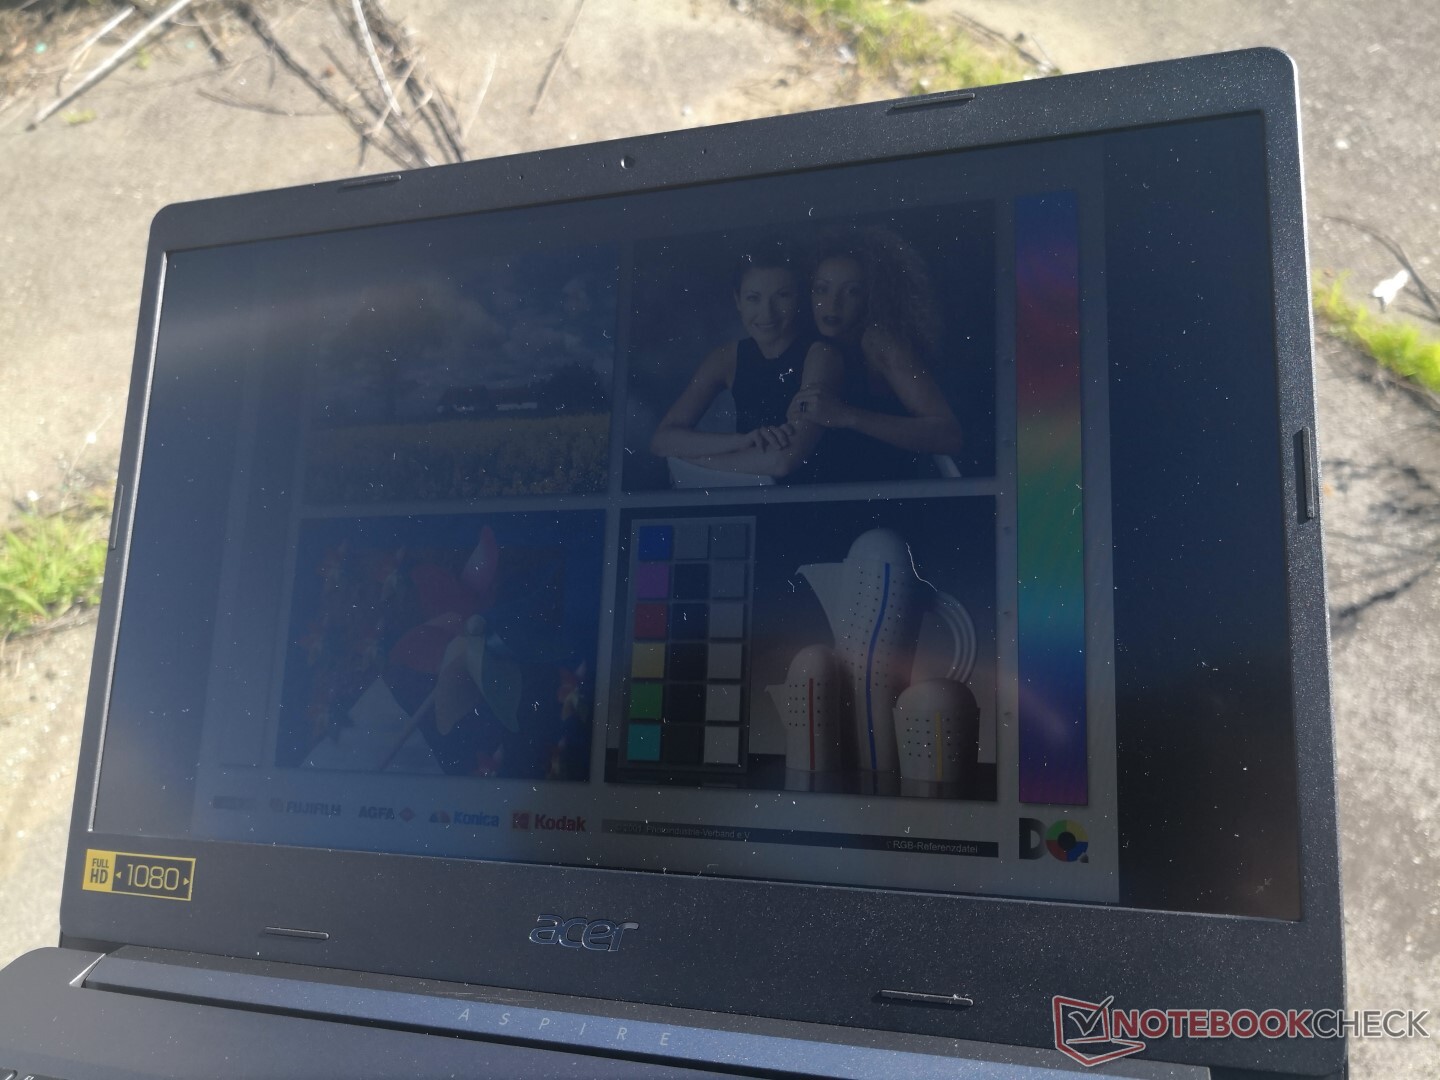
Outdoor visibility is poor especially when under sunlight. Though glare from the matte panel is minimal, colors will become washed out anyway since the display backlight was not designed for outdoor scenarios. You'll have to invest in pricier Ultrabooks with significantly brighter displays like the MacBook Pro, Samsung Notebook 9, HP EliteBook 1040, or the Dell XPS 13 where brightness can approach 500 nits or greater.
Performance
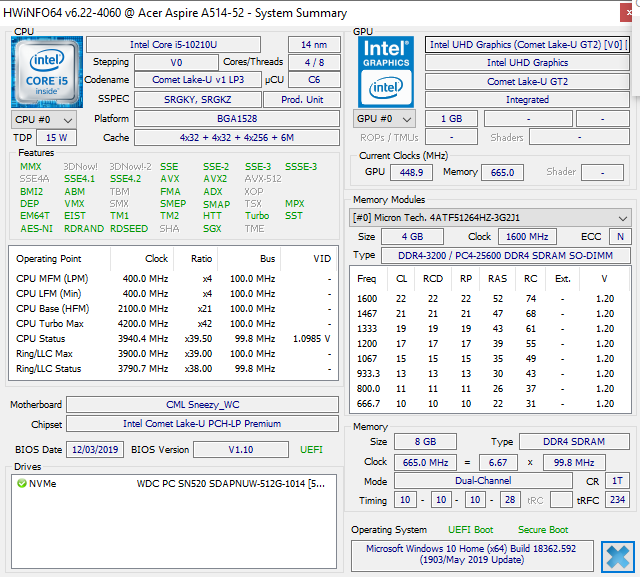
The Intel Core U-class CPUs and optional GeForce MX250 graphics target office and home users who mostly browse, stream, and multitask between common multimedia applications. SKUs with the faster quad-core Core i7-10510U are available, but there appears to be none with the hexa-core Core i7-10710U for now.
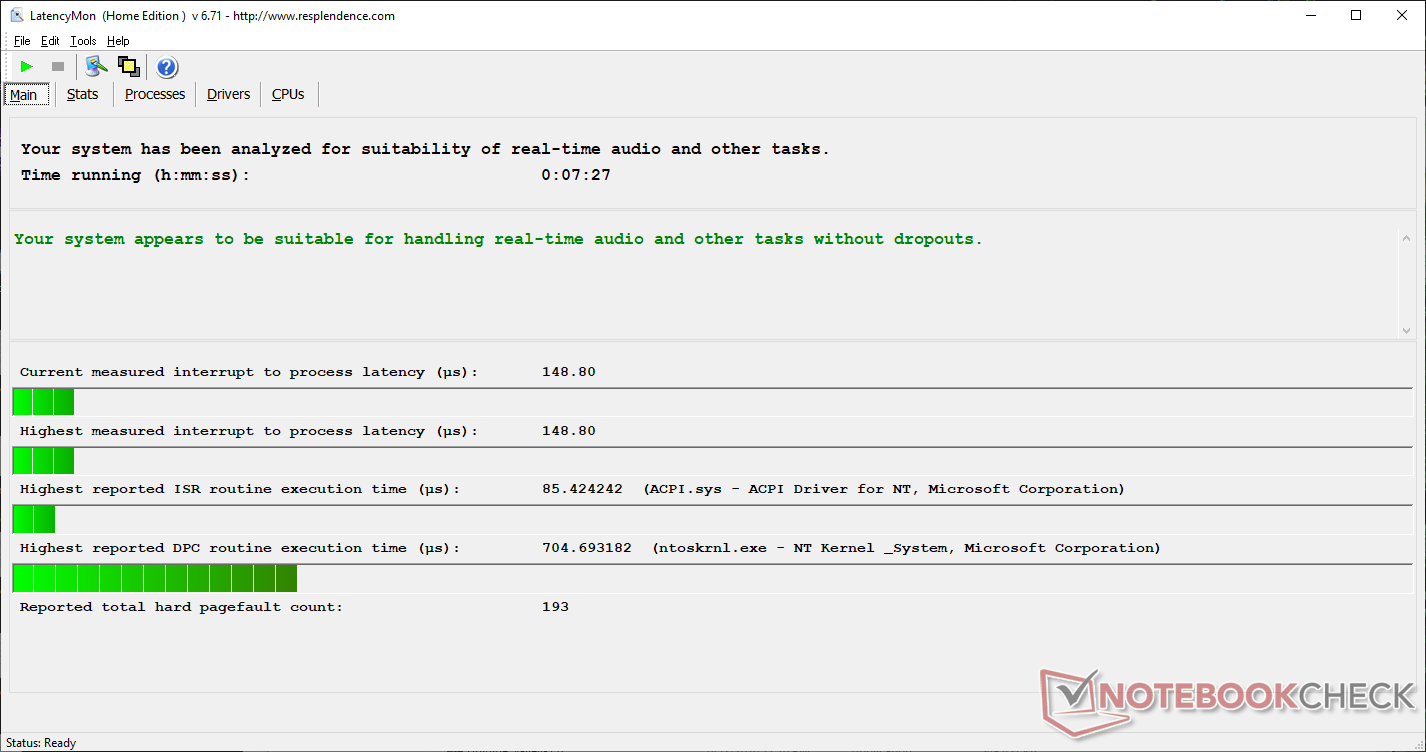
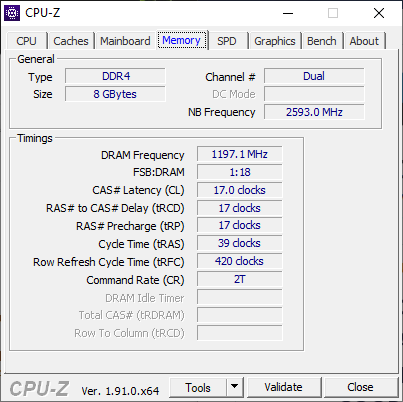
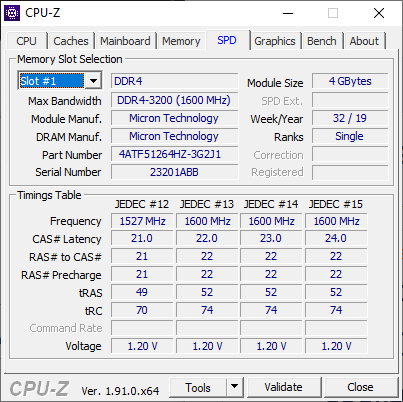
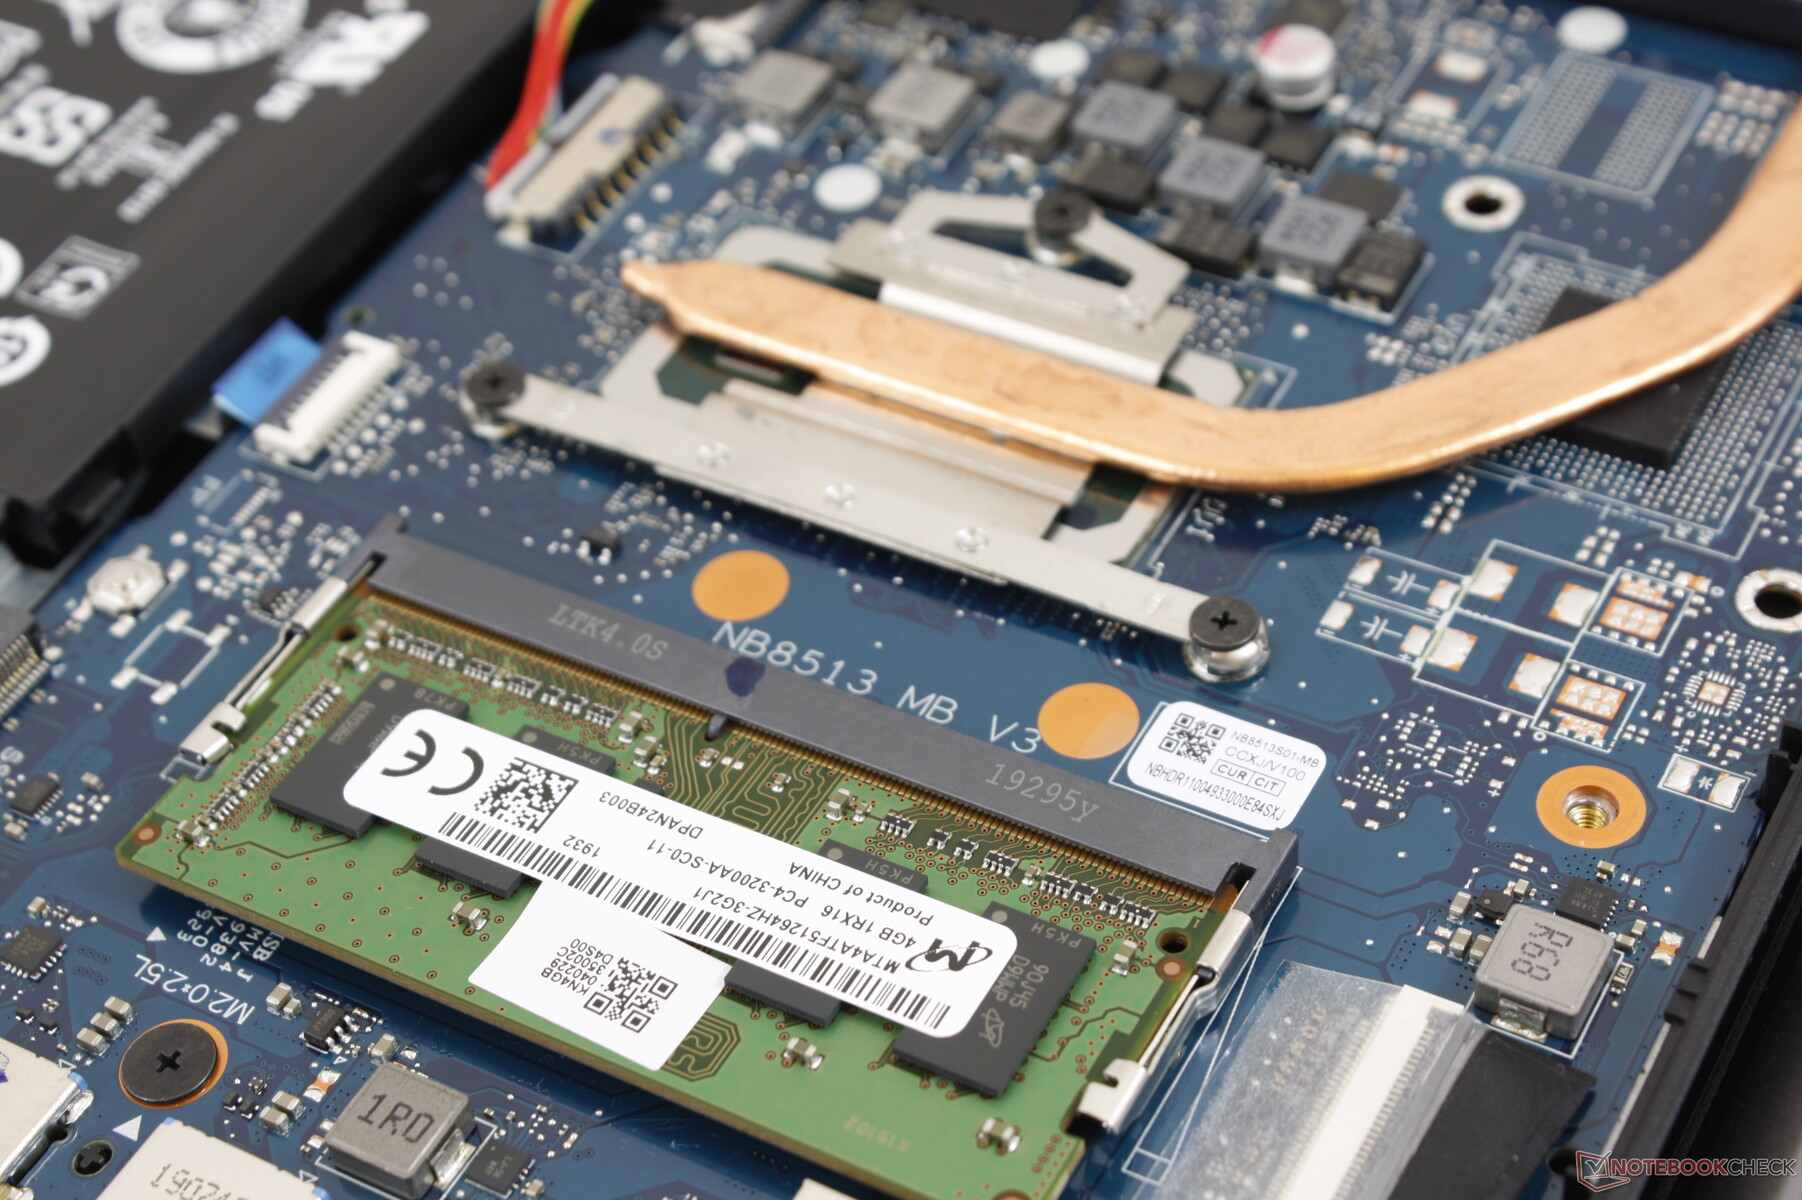
As for RAM, 4 GB comes soldered with 1x SODIMM slot for expansion. LatencyMon shows no recurring DPC latency issues unlike what we discovered on the HP Pavilion x360 15.
Note that all our tests below were performed on the default Acer power profile instead of the usual High Performance profile due to a performance bug detailed here. Running these tests on High Performance mode would have resulted in significantly lower scores across the board even after running Windows updates and Acer Care updates. We recommend avoiding the High Performance profile or else the CPU will throttle to just 500 MHz when stressed.
Processor
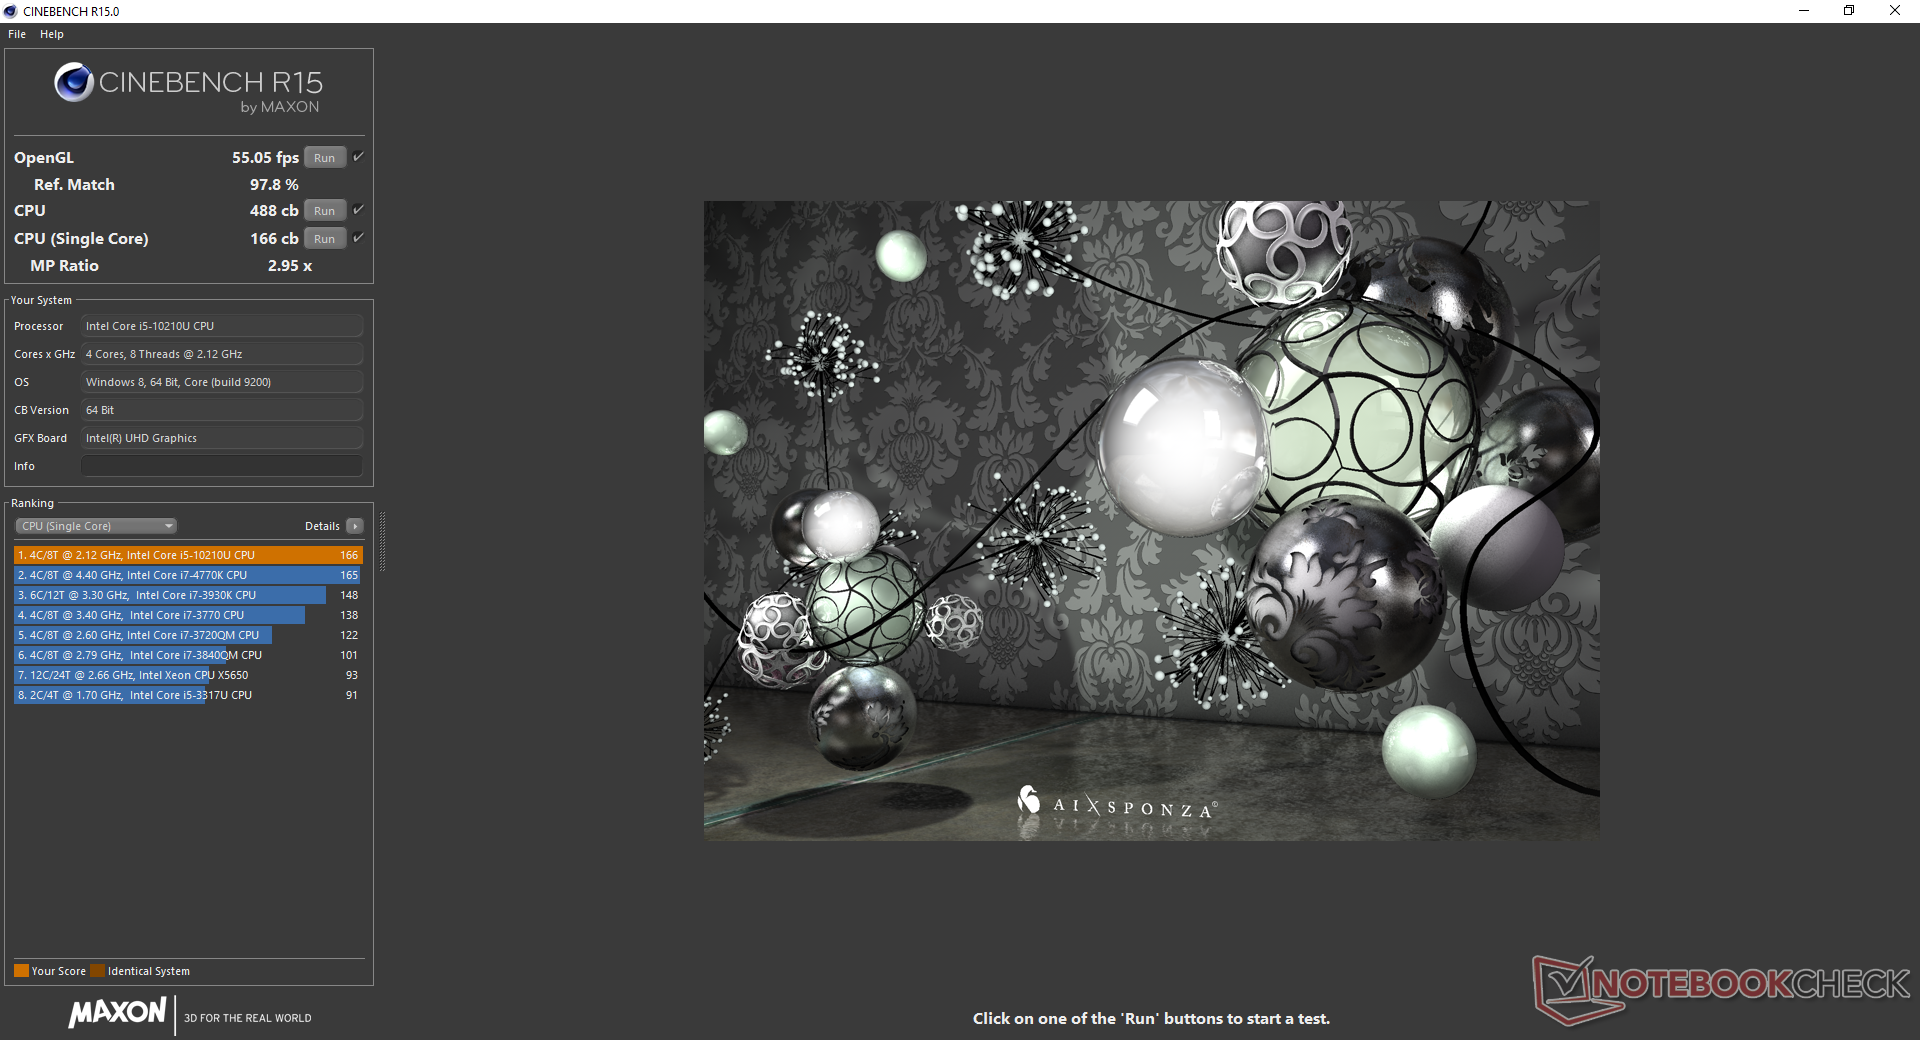
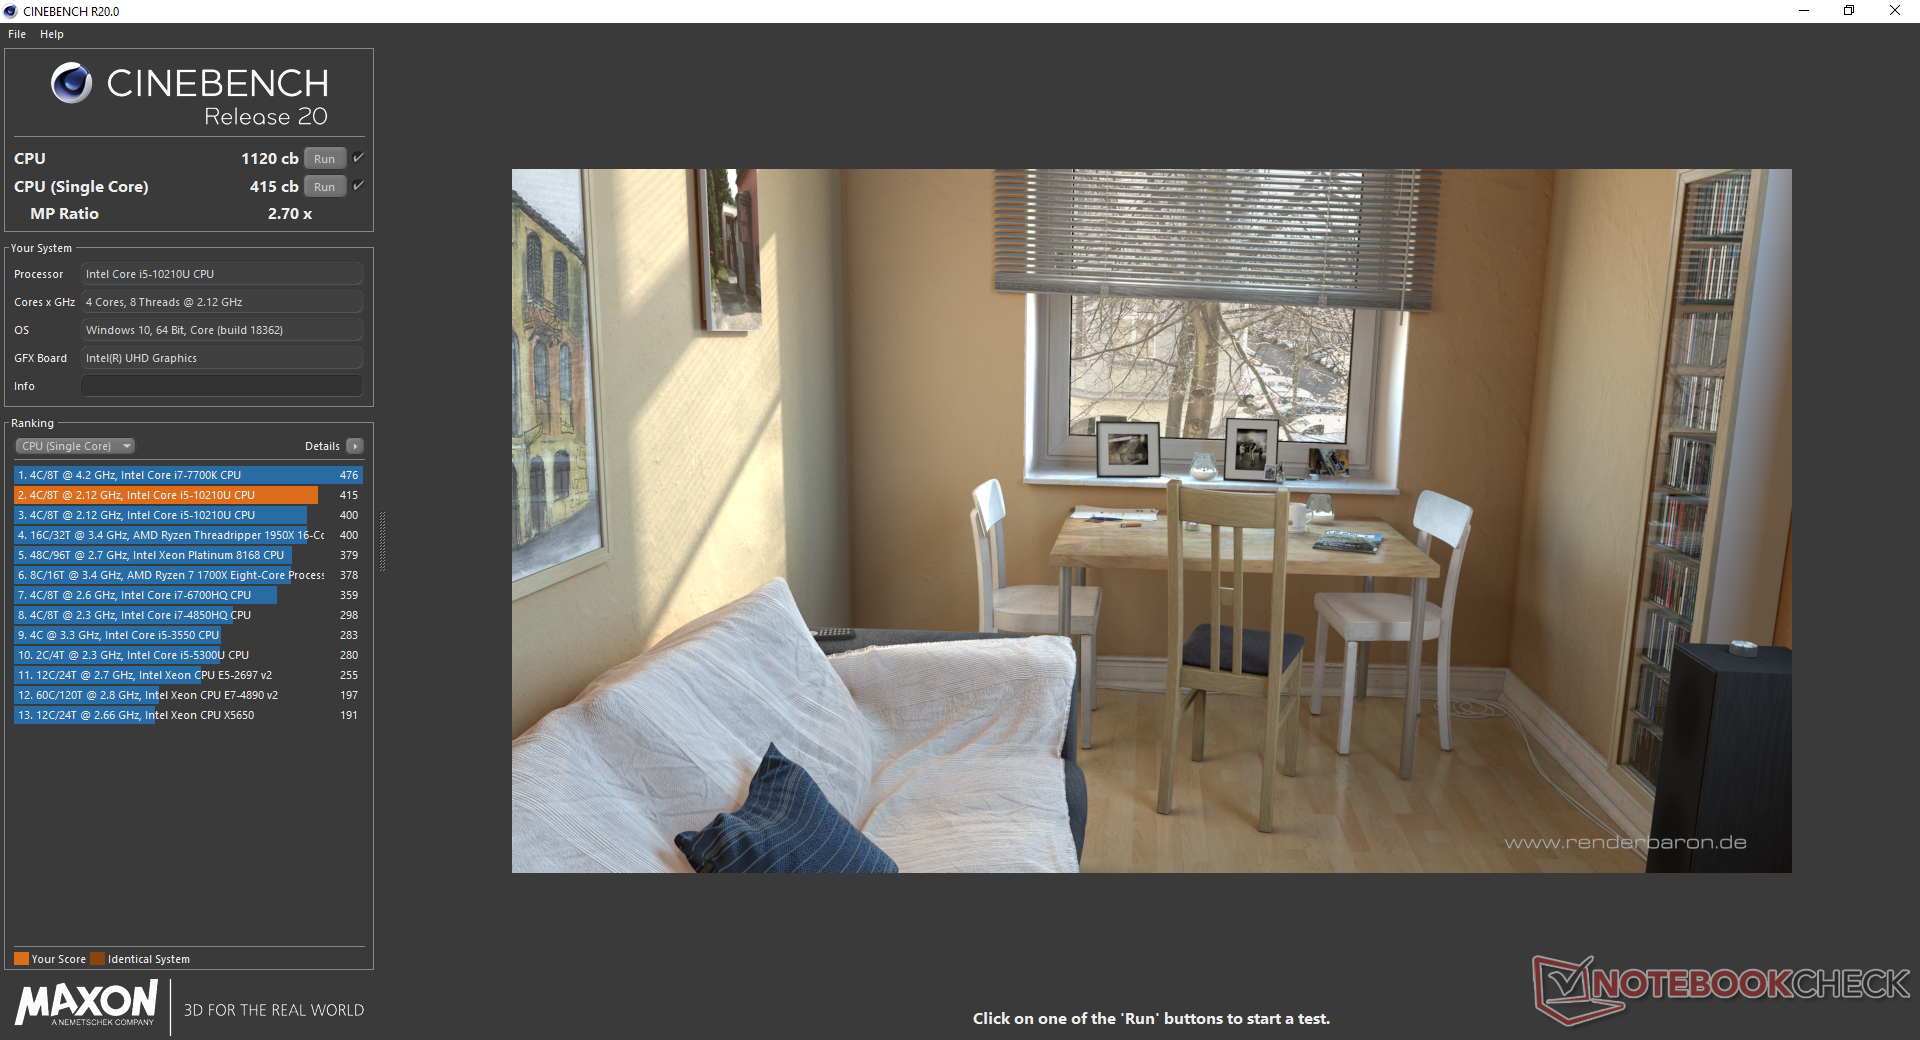
CPU performance is disappointing. Of the 10 laptops in our database equipped with the same Core i5-10210U CPU, our Acer Aspire 5 A514 is the slowest at 17 to 22 percent slower than the average. Multi-thread performance is essentially on par with the two-generation old Core i7-8550U while being 35 percent slower than the Core i5-8265U in the Lenovo IdeaPad C340-15 IWL. Single-thread performance, however, is where we expect it to be.
Running CineBench R15 Multi-Thread in a loop reveals an initial score of 488 points before dropping to around 430 points to represent a performance dip of 12 percent over time.
See our dedicated page on the Core i5-10210U for more technical information and benchmark comparisons.
| Cinebench R11.5 | |
| CPU Single 64Bit | |
| Average Intel Core i5-10210U (1.71 - 1.91, n=4) | |
| Dell Inspiron 15 5000 5585 | |
| CPU Multi 64Bit | |
| Dell Inspiron 15 5000 5585 | |
| Average Intel Core i5-10210U (5.69 - 8.66, n=4) | |
| Cinebench R10 | |
| Rendering Multiple CPUs 32Bit | |
| Lenovo Ideapad C340-15IWL-81N5004QGE | |
| Average Intel Core i5-10210U (15037 - 22164, n=3) | |
| Dynabook Portege A30-E-174 | |
| Rendering Single 32Bit | |
| Average Intel Core i5-10210U (6410 - 6613, n=3) | |
| Dynabook Portege A30-E-174 | |
| Lenovo Ideapad C340-15IWL-81N5004QGE | |
System Performance
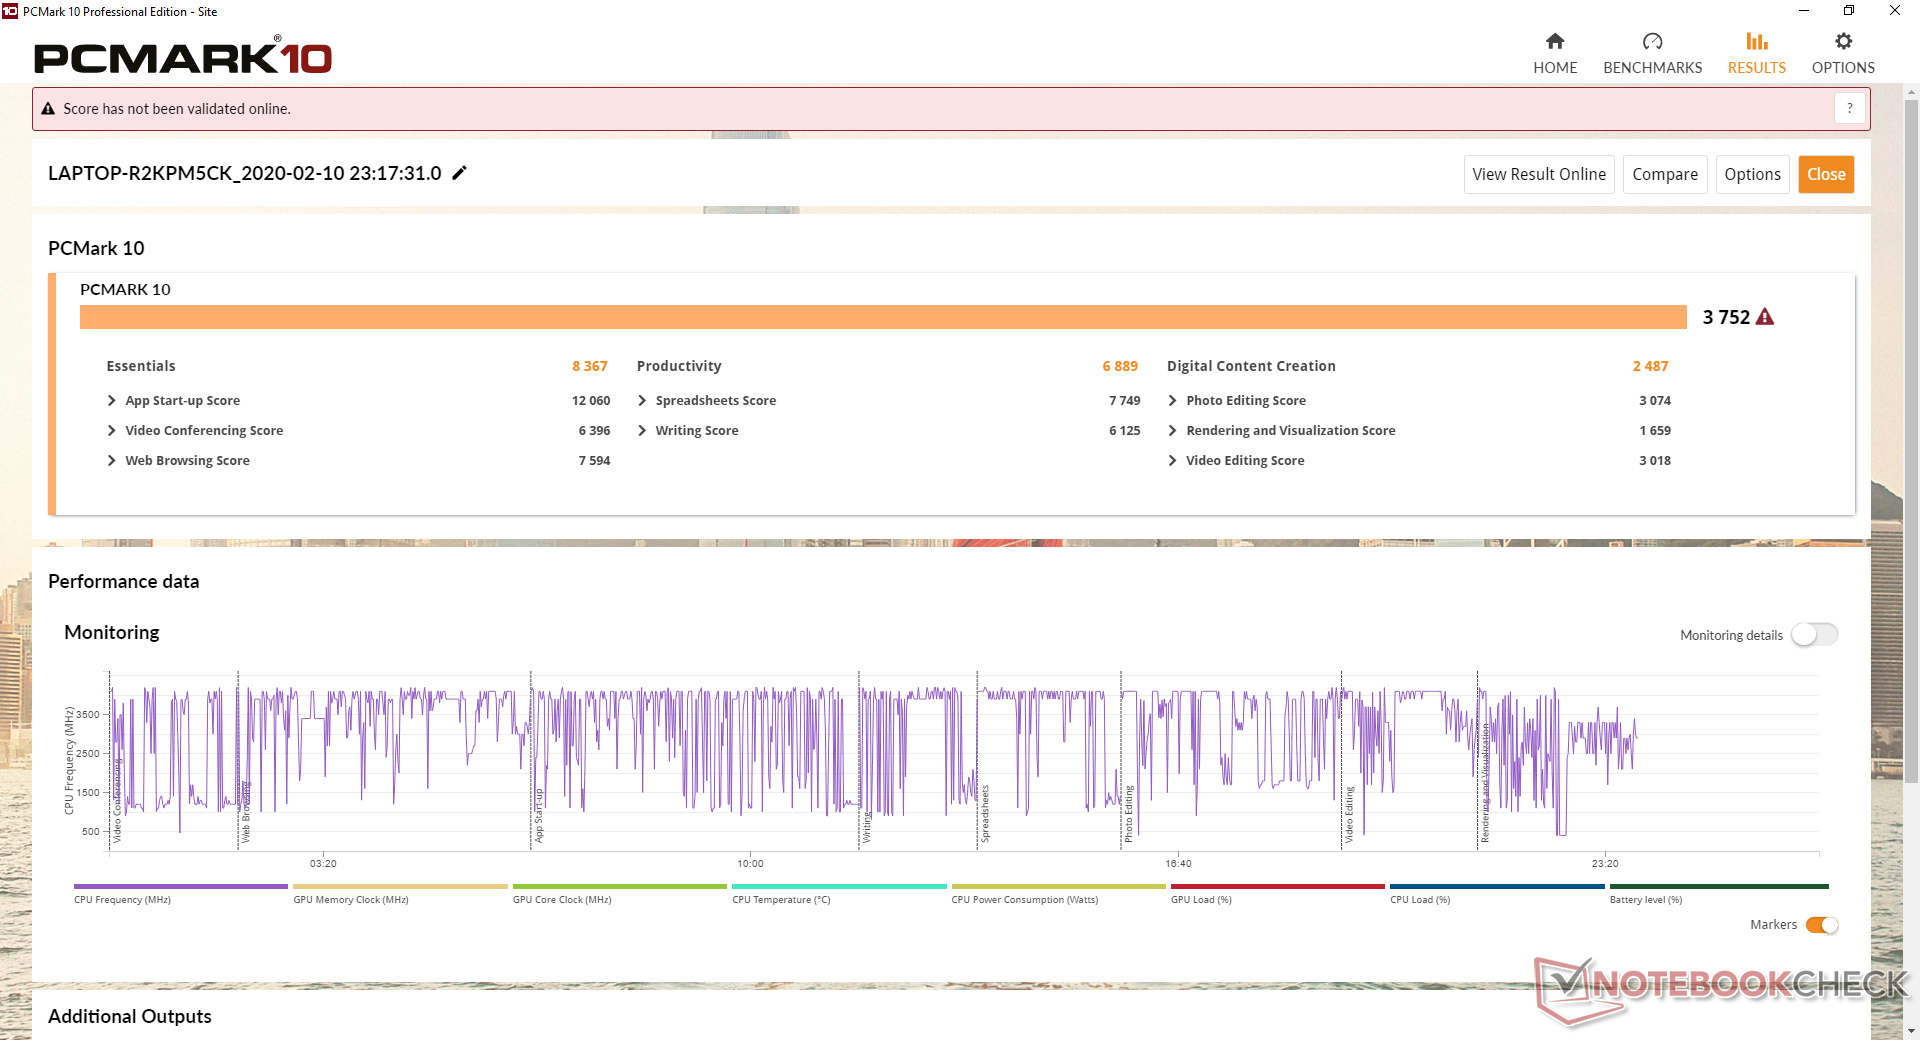
PCMark benchmarks are generally below average when compared to other laptops with the same Core i5-10210U CPU and integrated GPU. Its PCMark 10 and PCMark 8 Home scores, for example, are 6 percent and 10 percent below what we were expecting. The slower-than-average CPU performance mentioned above is a likely contributor.
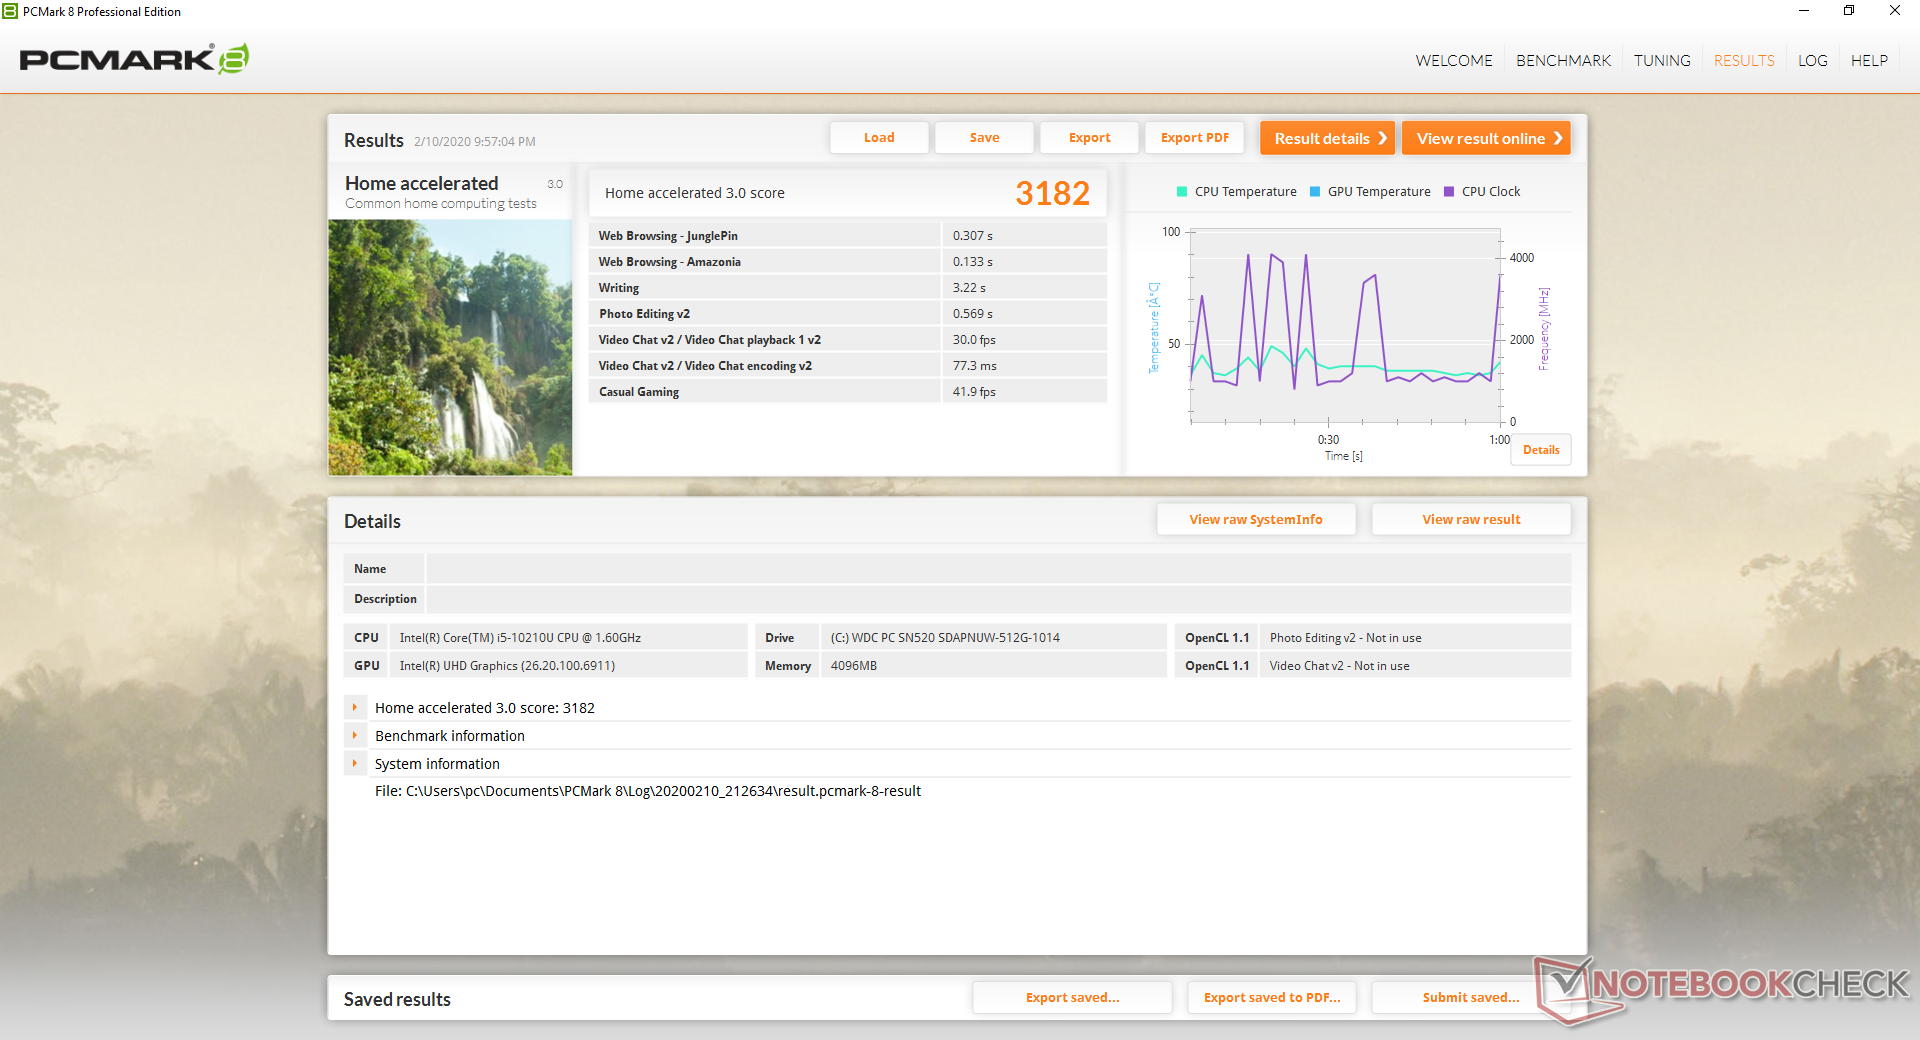
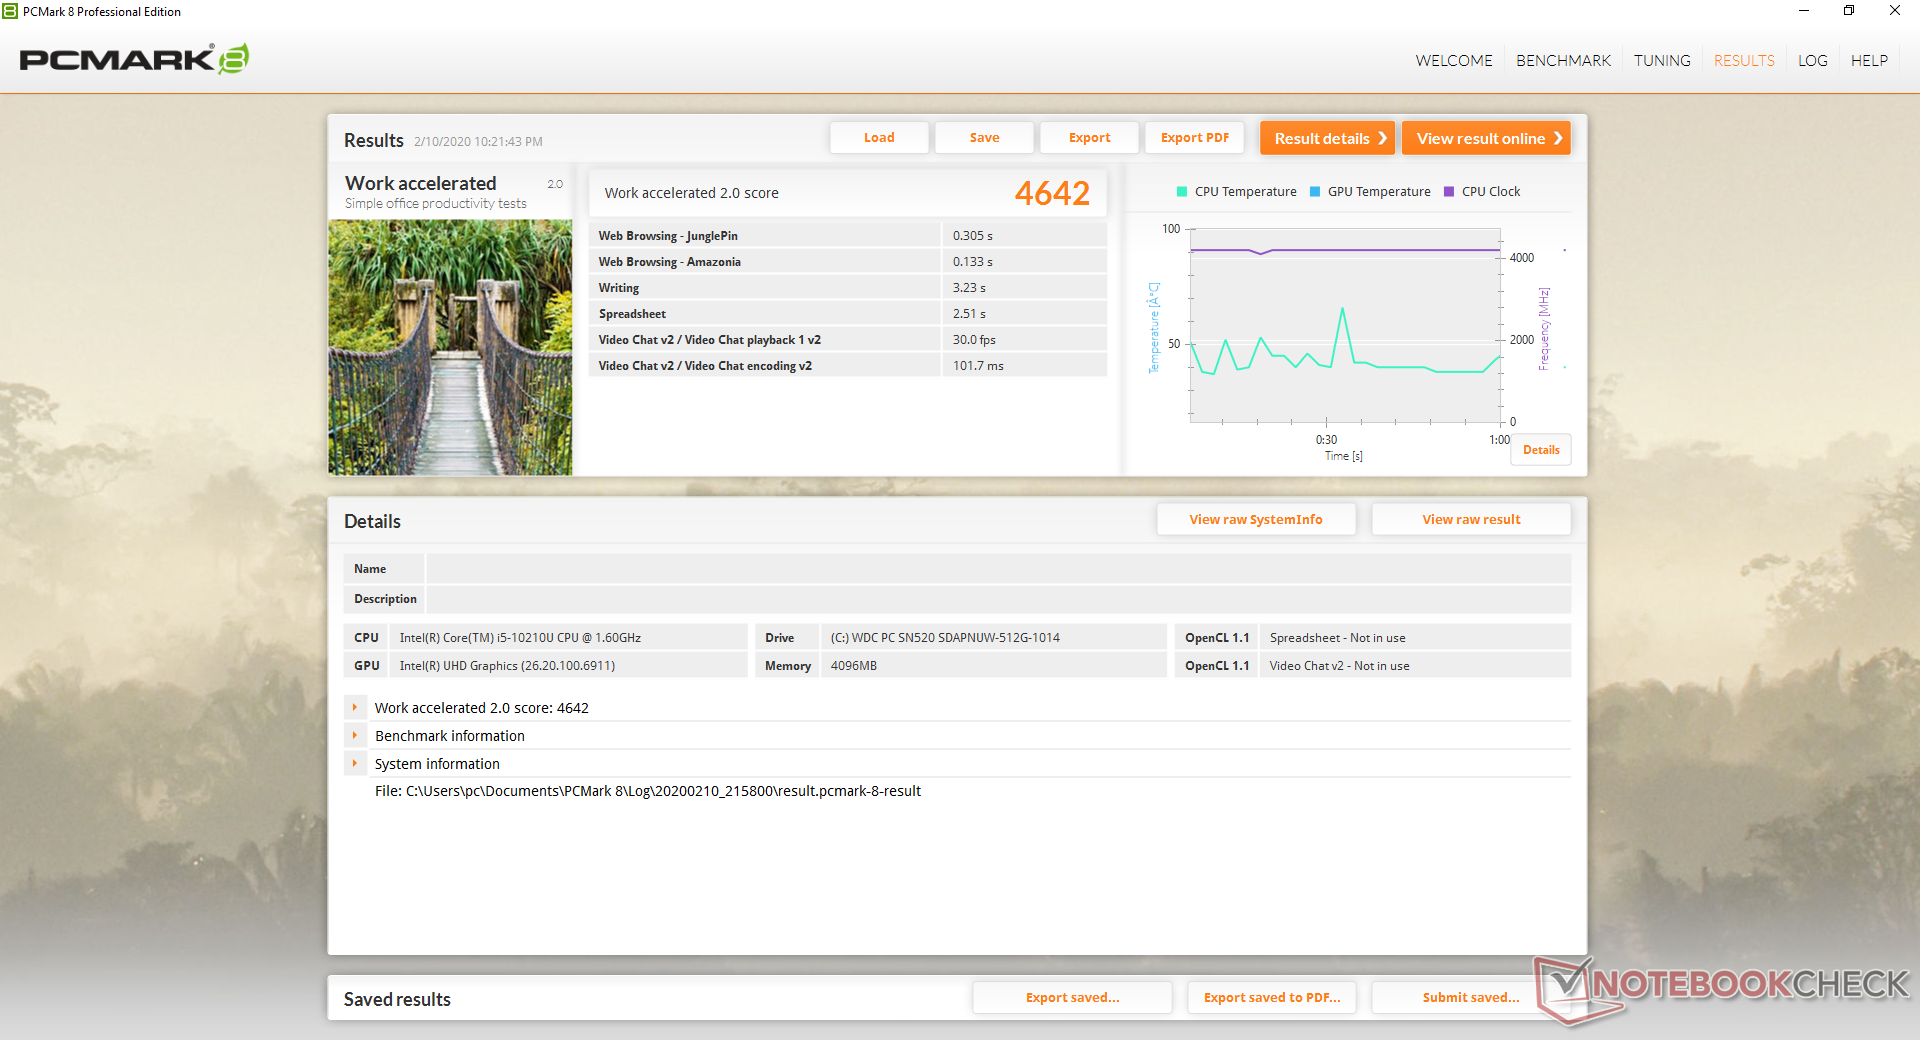
| PCMark 8 Home Score Accelerated v2 | 3182 points | |
| PCMark 8 Work Score Accelerated v2 | 4642 points | |
| PCMark 10 Score | 3752 points | |
Help | ||
Storage Devices
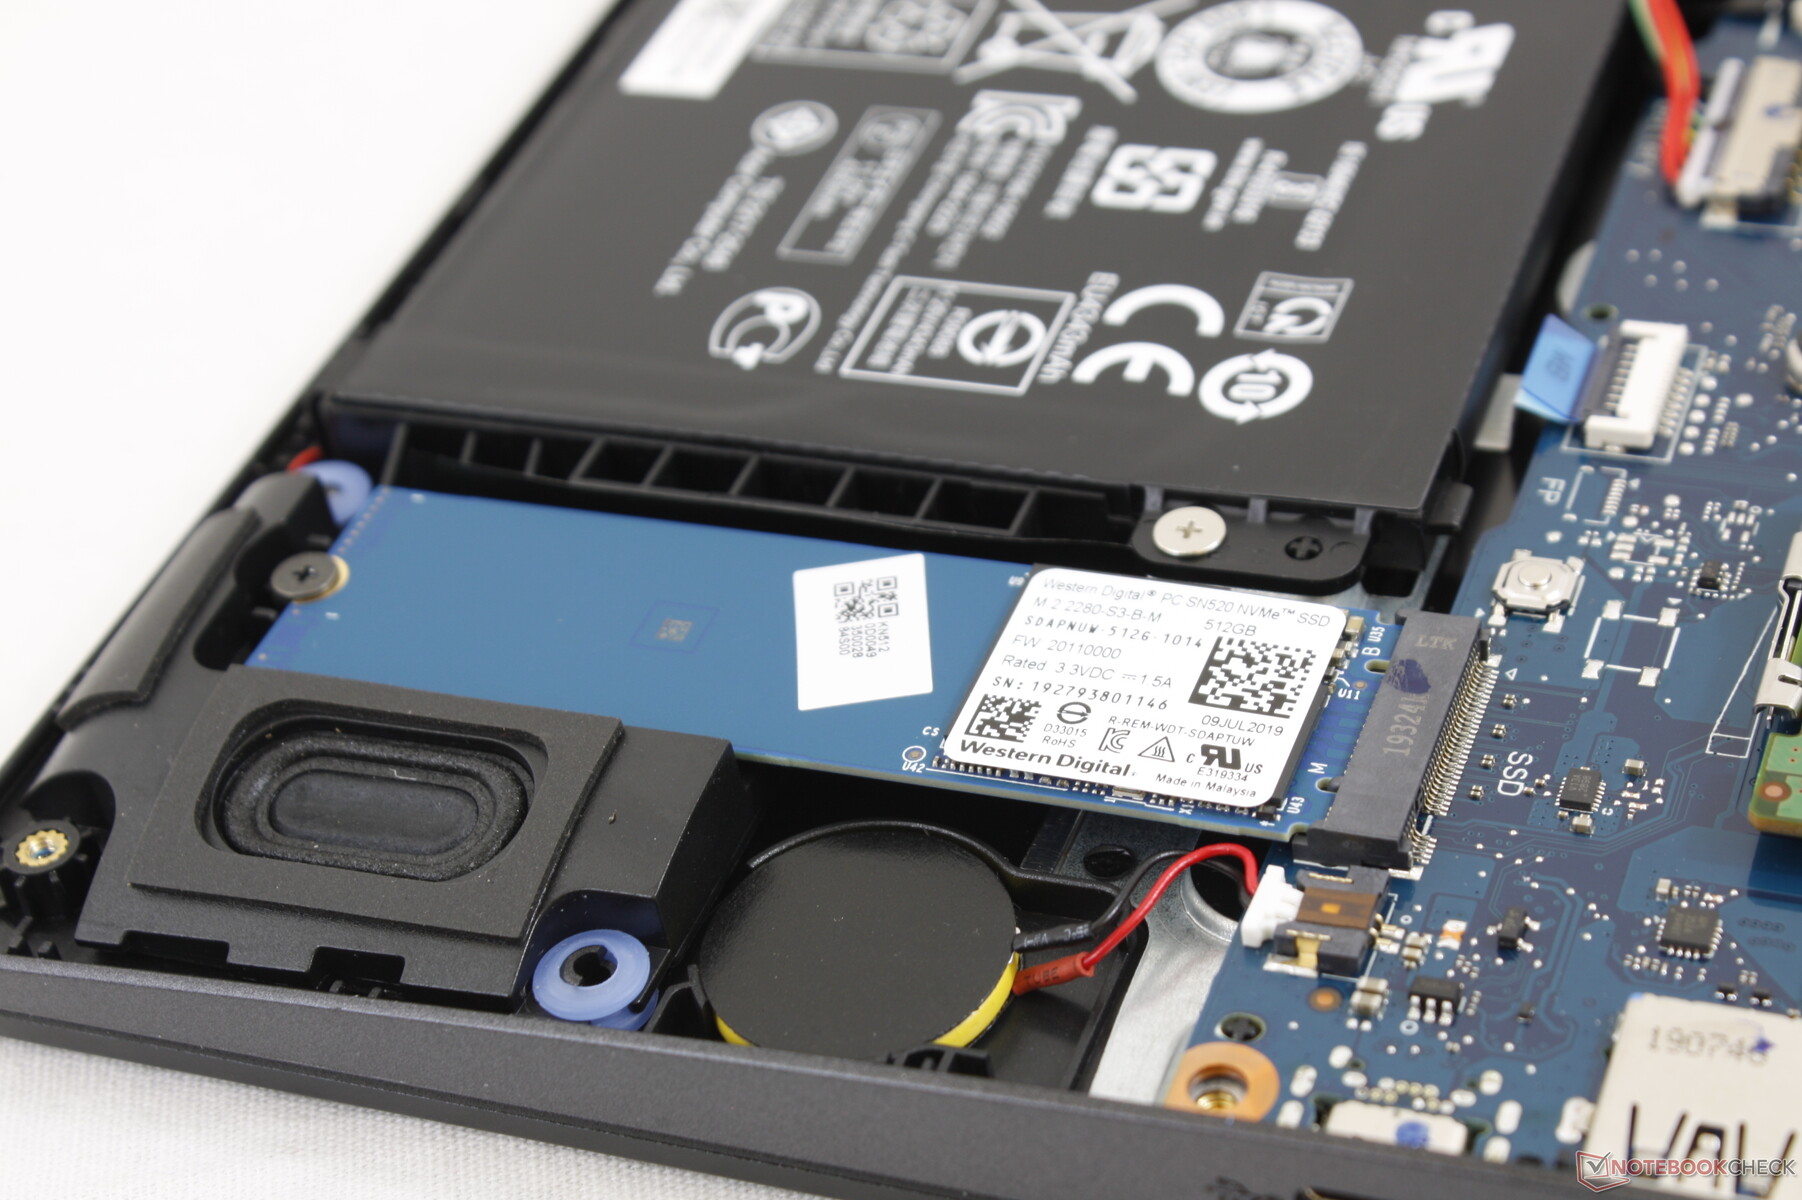
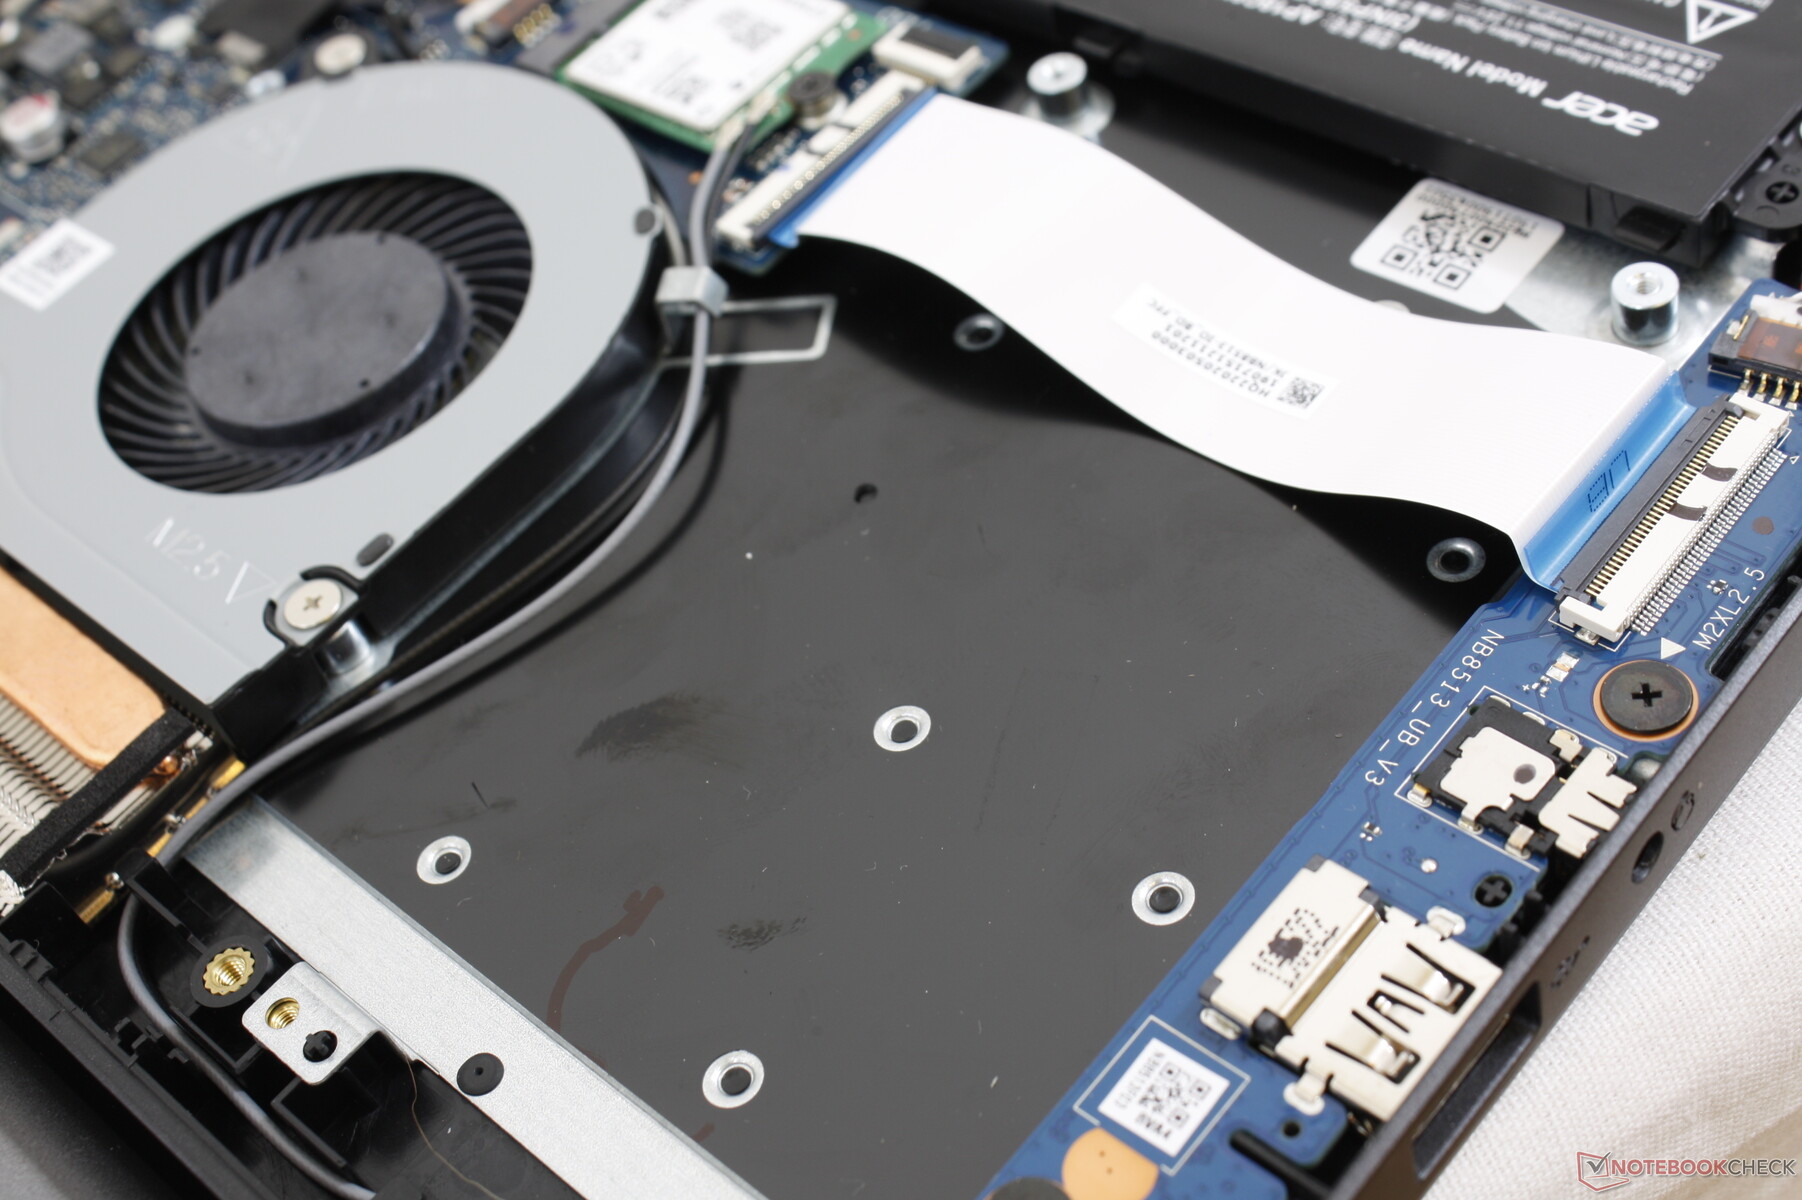
Owners get a primary M.2 2280 slot and a secondary 2.5-inch SATA III bay. Installation of the 2.5-inch drive, however, is slightly more involved than usual. Users must first install the SATA bracket, SATA port, and ribbon before the 2.5-inch drive can be used. All the necessary pieces are included in the retail box.
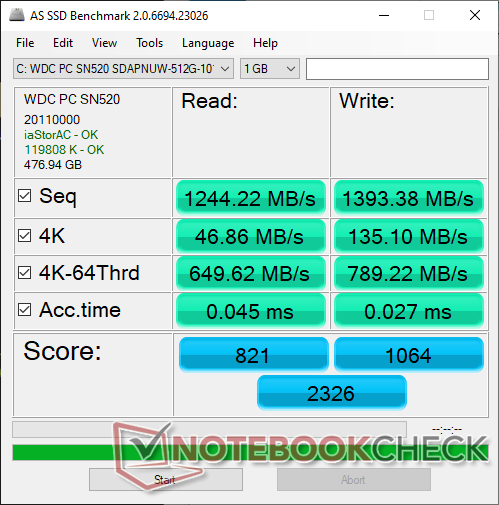
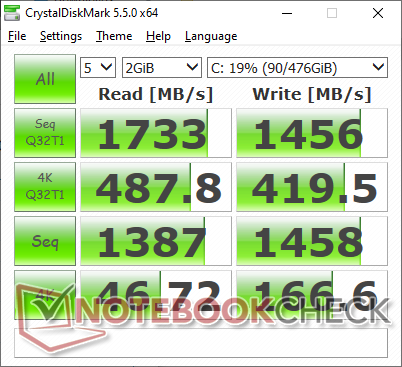
Our test unit comes with a budget 512 GB Western Digital SN520 NVMe SSD compatible with up to PCIe x2 speeds instead of PCIe x4. As such, sequential read and write rates average around 1300 MB/s each versus ~2500 MB/s on the more expensive Samsung PM981 series. For the target audience, however, an inexpensive NVMe drive will be more than enough in terms of performance.
See our table of SSDs and HDDs for more benchmark comparisons.
| Acer Aspire 5 A514-52 WDC PC SN520 SDAPNUW-512G | Dell XPS 15 7590 i5 iGPU FHD Toshiba XG6 KXG60ZNV512G | Asus VivoBook S15 S532F WDC PC SN520 SDAPNUW-256G | HP Envy x360 15-bq102ng Samsung PM961 MZVLW256HEHP | Lenovo Ideapad S540-15IML Samsung SSD PM981a MZVLB512HBJQ | |
|---|---|---|---|---|---|
| AS SSD | 23% | -14% | -19% | 66% | |
| Seq Read | 1244 | 2357 89% | 1147 -8% | 2465 98% | 2642 112% |
| Seq Write | 1393 | 1235 -11% | 752 -46% | 1318 -5% | 2433 75% |
| 4K Read | 46.86 | 43.29 -8% | 41.52 -11% | 42.97 -8% | 58 24% |
| 4K Write | 135.1 | 99.7 -26% | 149.7 11% | 81.9 -39% | 145.3 8% |
| 4K-64 Read | 650 | 1020 57% | 605 -7% | 1025 58% | 1431 120% |
| 4K-64 Write | 789 | 1502 90% | 453.2 -43% | 338.6 -57% | 1753 122% |
| Access Time Read * | 0.045 | 0.07 -56% | 0.073 -62% | 0.077 -71% | 0.072 -60% |
| Access Time Write * | 0.027 | 0.039 -44% | 0.025 7% | 0.046 -70% | 0.027 -0% |
| Score Read | 821 | 1299 58% | 761 -7% | 1314 60% | 1753 114% |
| Score Write | 1064 | 1726 62% | 678 -36% | 552 -48% | 2142 101% |
| Score Total | 2326 | 3640 56% | 1821 -22% | 2488 7% | 4790 106% |
| Copy ISO MB/s | 1637 | 2145 31% | 1093 -33% | 700 -57% | |
| Copy Program MB/s | 496.6 | 565 14% | 775 56% | 167.2 -66% | |
| Copy Game MB/s | 1161 | 1320 14% | 1196 3% | 370.4 -68% | |
| CrystalDiskMark 5.2 / 6 | 17% | -16% | -4% | 23% | |
| Write 4K | 166.6 | 93.6 -44% | 149.9 -10% | 116 -30% | 170.7 2% |
| Read 4K | 46.72 | 41.87 -10% | 46.13 -1% | 42.73 -9% | 49.51 6% |
| Write Seq | 1458 | 1698 16% | 970 -33% | 1222 -16% | 1156 -21% |
| Read Seq | 1387 | 1978 43% | 1085 -22% | 1608 16% | 1136 -18% |
| Write 4K Q32T1 | 419.5 | 383.1 -9% | 460.8 10% | 280.1 -33% | 420.5 0% |
| Read 4K Q32T1 | 487.8 | 326.9 -33% | 410.3 -16% | 333.6 -32% | 527 8% |
| Write Seq Q32T1 | 1456 | 2778 91% | 662 -55% | 1291 -11% | 2984 105% |
| Read Seq Q32T1 | 1733 | 3119 80% | 1728 0% | 3183 84% | 3550 105% |
| Total Average (Program / Settings) | 20% /
21% | -15% /
-15% | -12% /
-14% | 45% /
48% |
* ... smaller is better

GPU Performance
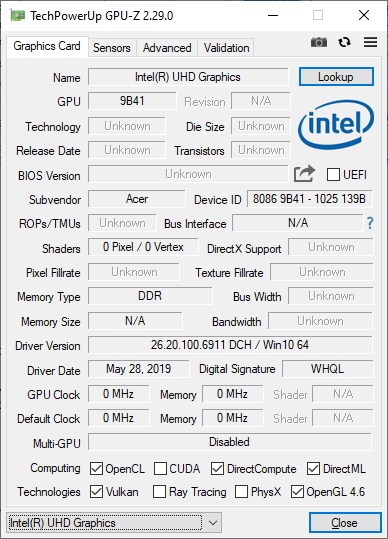
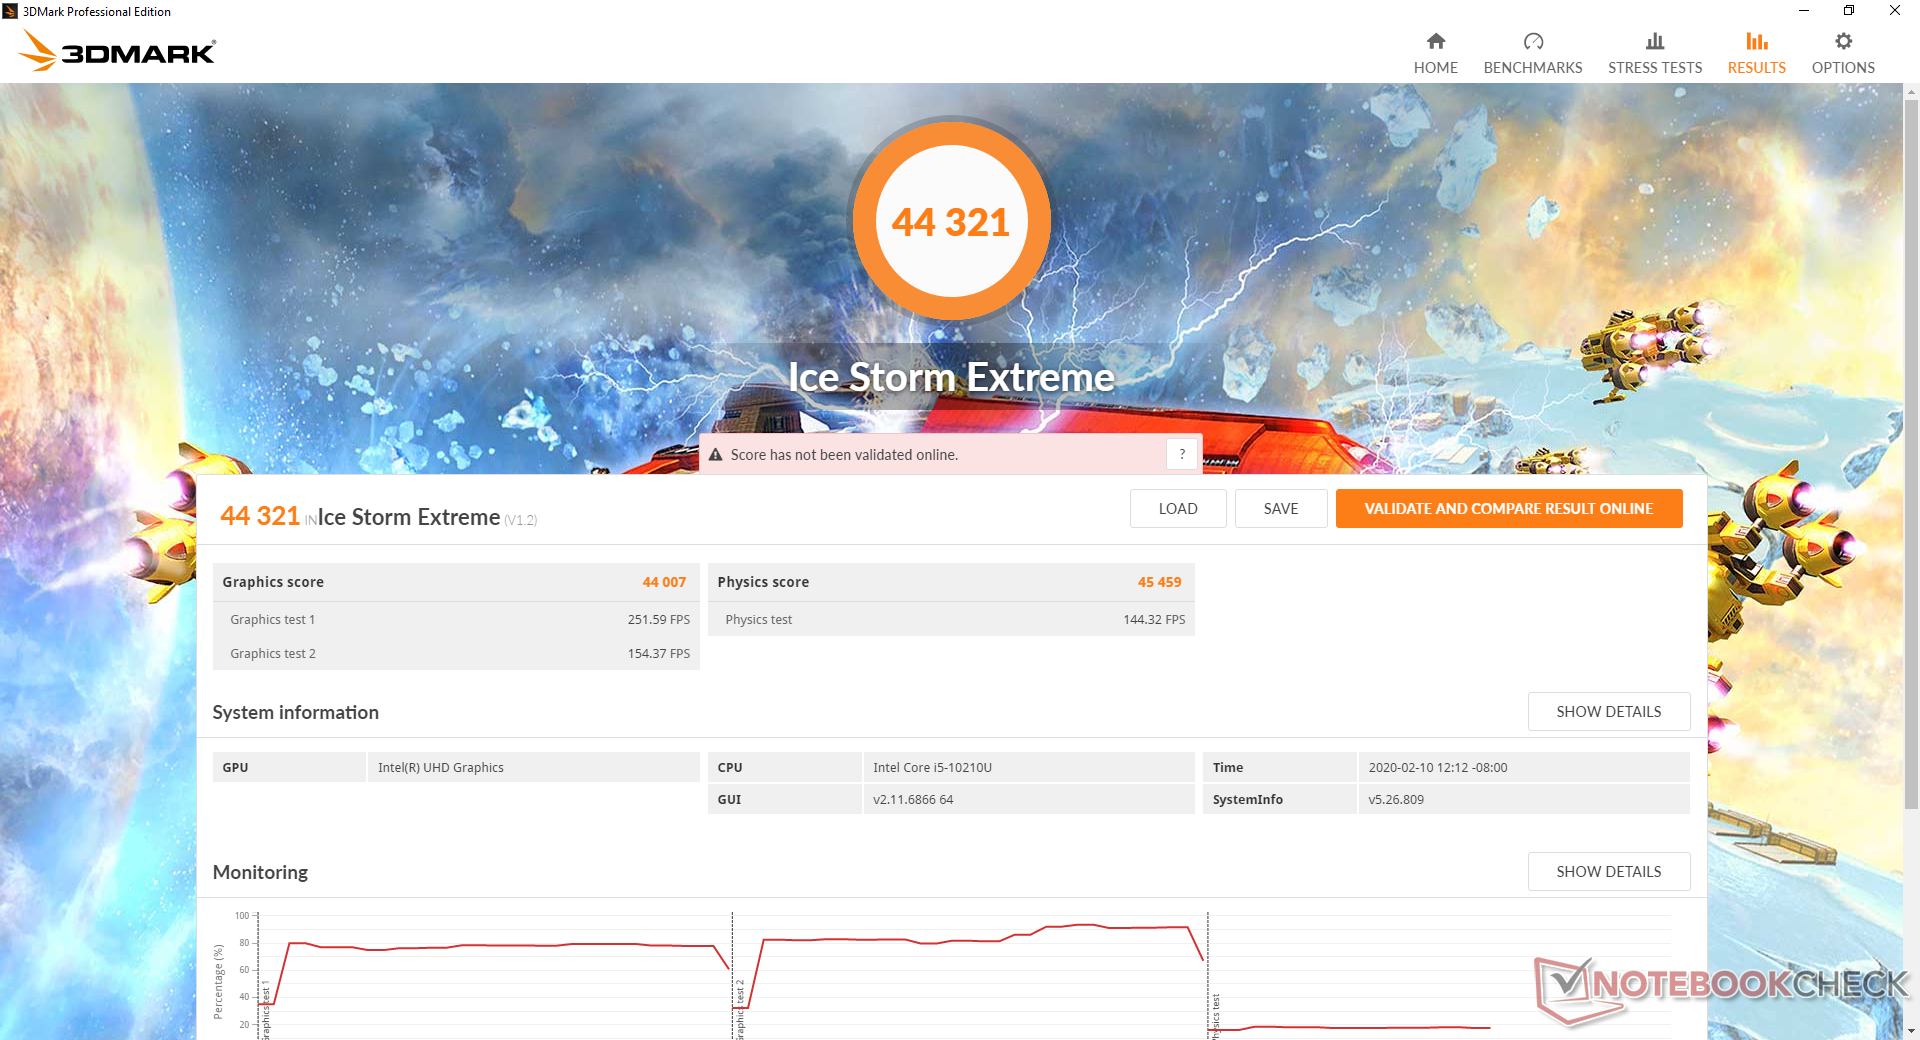
The UHD Graphics 620 is awfully outdated by today's standards. The competing Radeon RX Vega 8 and RX Vega 10, for example, are significantly faster by at least 60 percent according to 3DMark benchmarks. Still, users aren't going to buy this Aspire 5 for its graphics performance and so the modest GPU here should be a non-issue. Streaming 4K content or playing the occasional browser game still works smoothly.
See our dedicated page on the UHD Graphics 620 for more technical information and benchmarks.
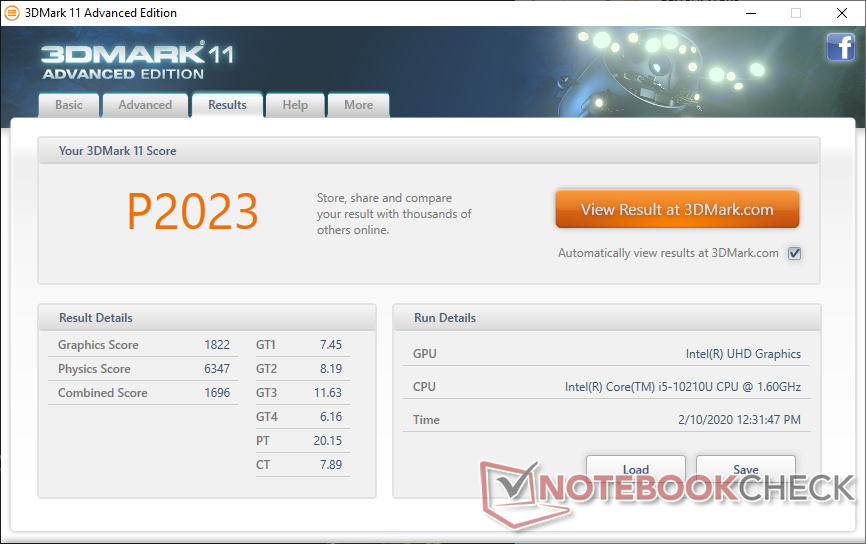
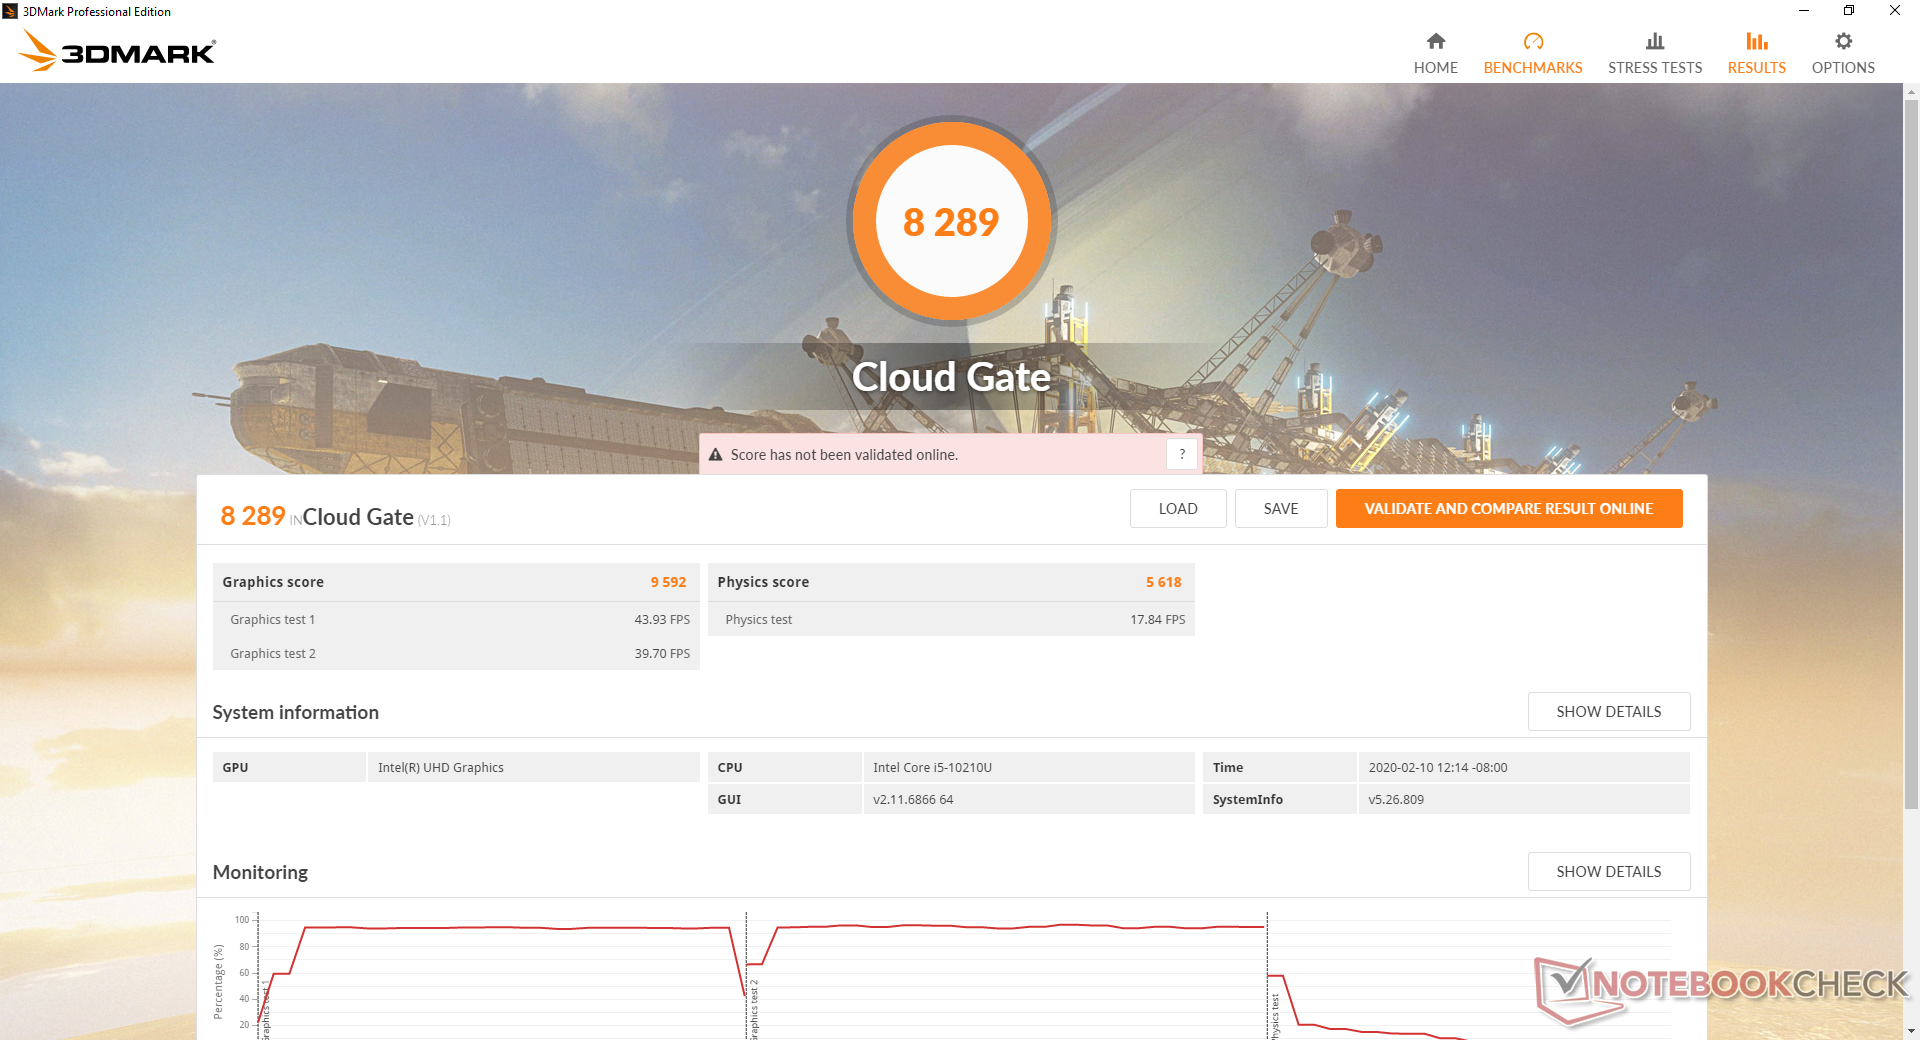
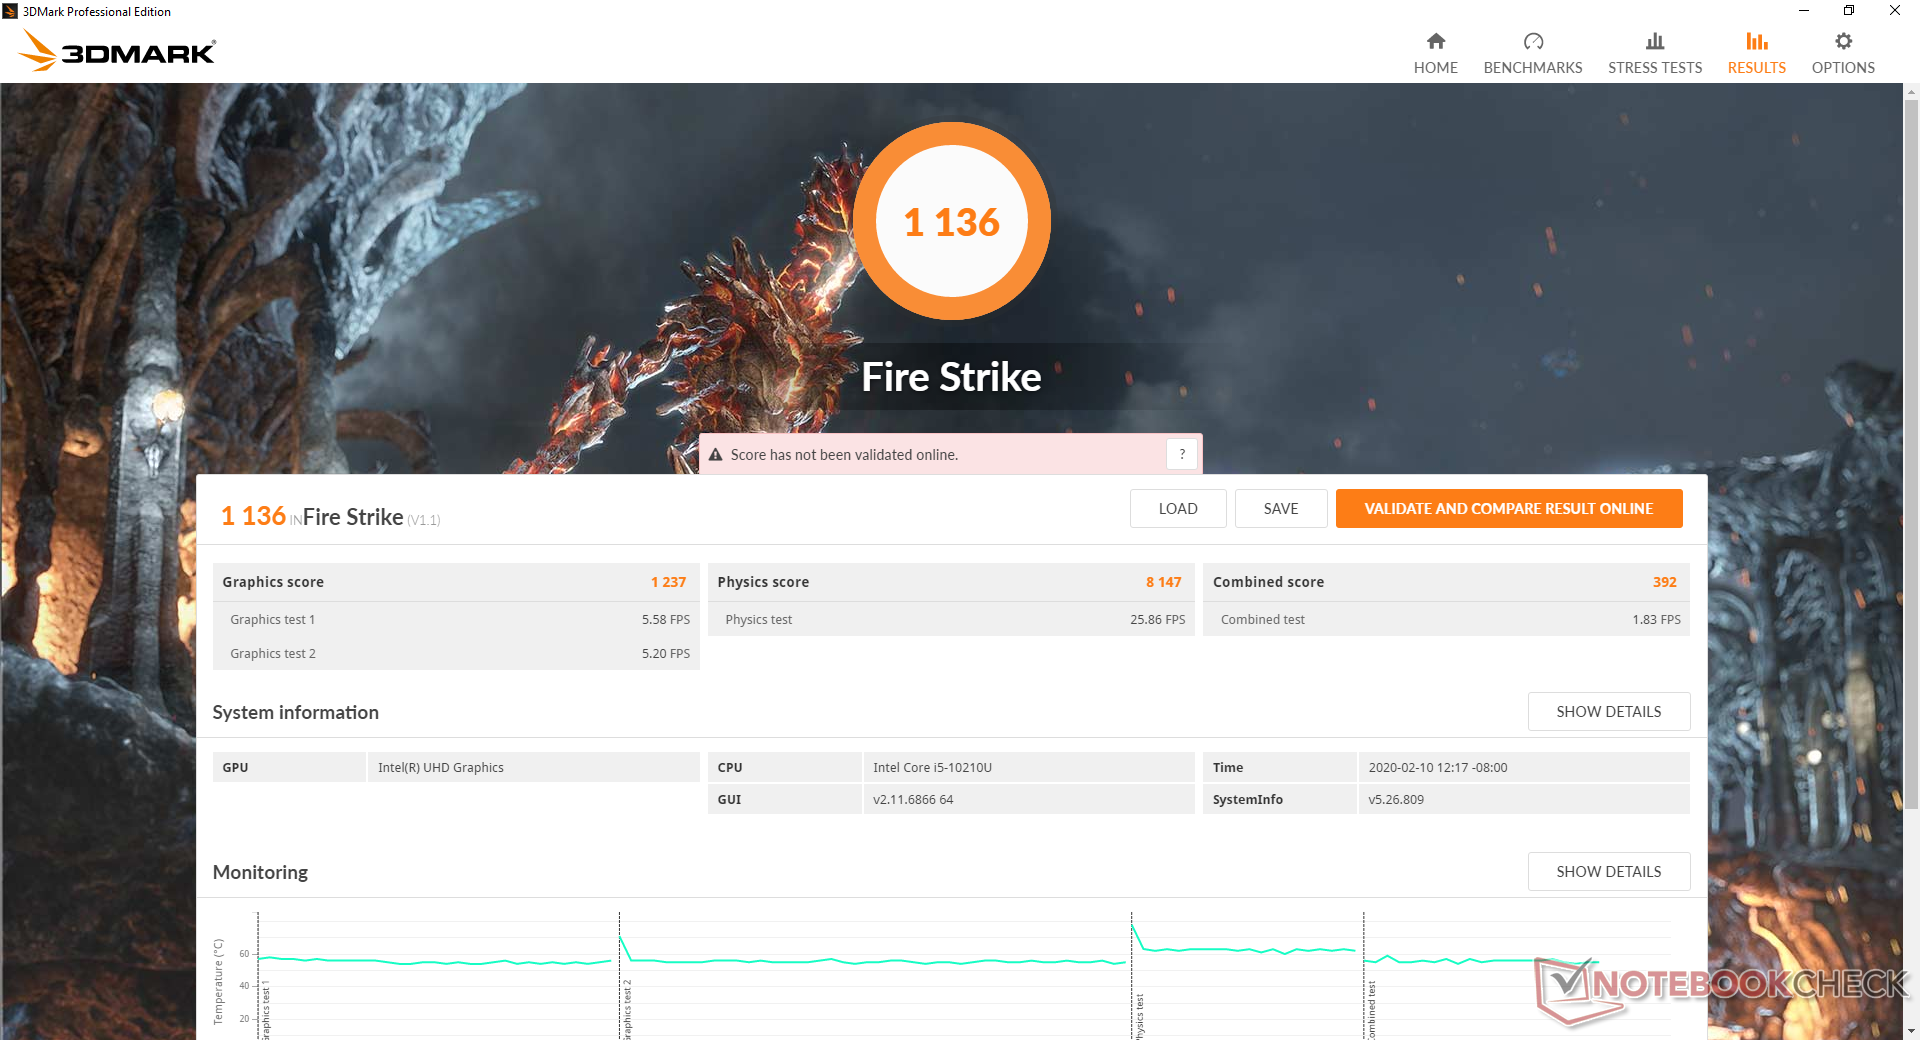
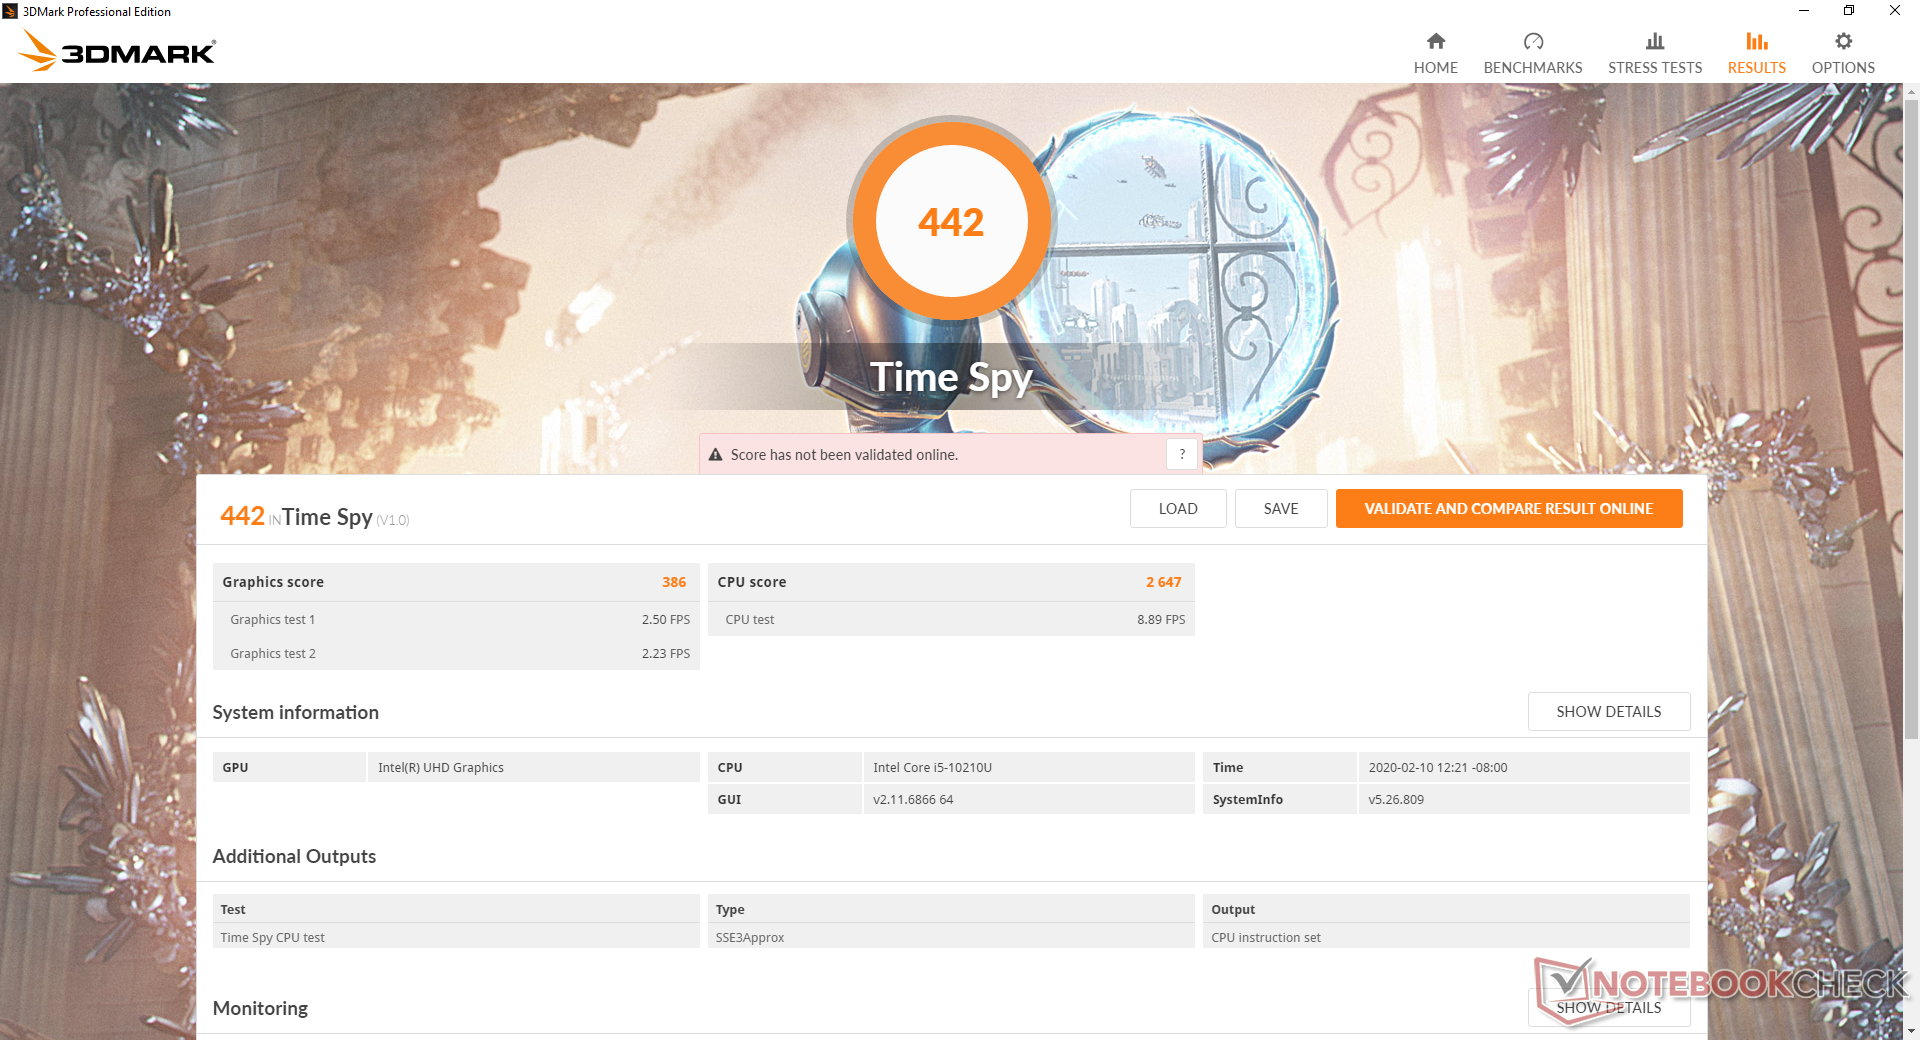
| 3DMark 11 Performance | 2023 points | |
| 3DMark Cloud Gate Standard Score | 8289 points | |
| 3DMark Fire Strike Score | 1136 points | |
| 3DMark Time Spy Score | 442 points | |
Help | ||
| The Witcher 3 | |
| 1024x768 Low Graphics & Postprocessing | |
| MSI Modern 14 A10RB-459US | |
| Average Intel UHD Graphics 620 (8.8 - 50.9, n=64) | |
| 1366x768 Medium Graphics & Postprocessing | |
| MSI Modern 14 A10RB-459US | |
| Average Intel UHD Graphics 620 (8 - 27.9, n=29) | |
| 1920x1080 High Graphics & Postprocessing (Nvidia HairWorks Off) | |
| MSI Modern 14 A10RB-459US | |
| Average Intel UHD Graphics 620 (4.2 - 13.5, n=17) | |
| low | med. | high | ultra | |
| BioShock Infinite (2013) | 67 | 35.2 | 30.1 | 9.6 |
| Rocket League (2017) | 20.1 |
Emissions
System Noise
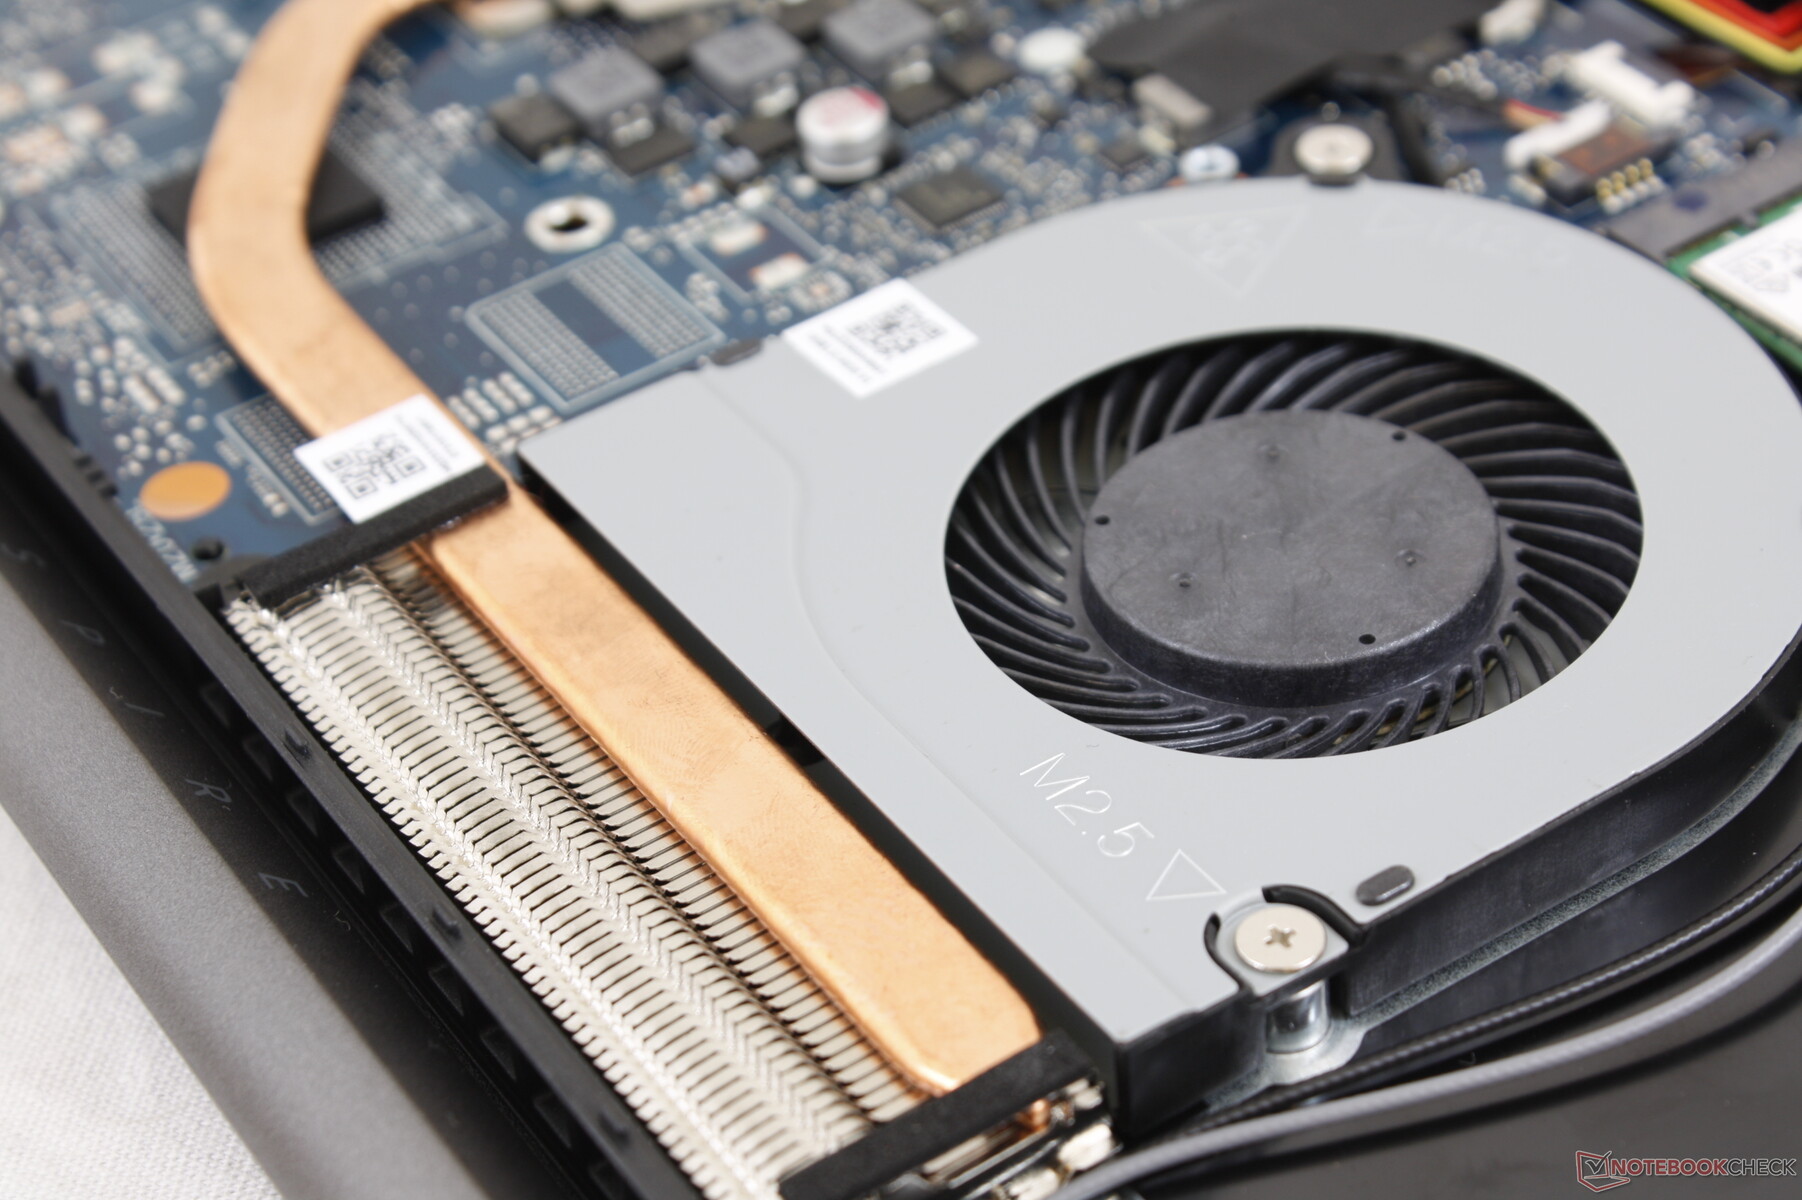
The cooling solution is relatively small as one would expect from a Core U-series laptop. If configuring with the dedicated GeForce MX250 GPU, however, expect warmer temperatures and/or louder fan noise due to the higher load.
Our test unit is almost always silent during low processing loads like browsing, streaming, or word processing. The fan may occasionally pulse to 31.5 dB(A) when launching applications before quickly winding back down to 30 dB(A) against a background of 29.1 dB(A). Extreme loads will induce a steady fan noise of 36 dB(A) to still be quieter than many competitors when under similar processing conditions.
We're able to notice slight electronic noise or coil whine when placing an ear near the keyboard keys. It's thankfully minor enough to be unnoticeable when sitting at a normal distance from the laptop.
| Acer Aspire 5 A514-52 UHD Graphics 620, i5-10210U, WDC PC SN520 SDAPNUW-512G | Dell XPS 15 7590 i5 iGPU FHD UHD Graphics 630, i5-9300H, Toshiba XG6 KXG60ZNV512G | Asus VivoBook S15 S532F GeForce MX250, i7-8565U, WDC PC SN520 SDAPNUW-256G | HP Envy x360 15-bq102ng Vega 8, R5 2500U, Samsung PM961 MZVLW256HEHP | Lenovo Ideapad S540-15IML GeForce MX250, i5-10210U, Samsung SSD PM981a MZVLB512HBJQ | MSI Modern 15 A10RB GeForce MX250, i7-10510U, WDC PC SN730 SDBPNTY-512G | |
|---|---|---|---|---|---|---|
| Noise | -1% | -5% | -7% | -14% | -12% | |
| off / environment * | 29.1 | 29.3 -1% | 28 4% | 30.13 -4% | 30 -3% | 28.3 3% |
| Idle Minimum * | 29.1 | 29.3 -1% | 28 4% | 30.13 -4% | 30 -3% | 32 -10% |
| Idle Average * | 29.1 | 29.3 -1% | 28 4% | 30.13 -4% | 32 -10% | 32 -10% |
| Idle Maximum * | 29.1 | 29.8 -2% | 30 -3% | 30.13 -4% | 37 -27% | 32 -10% |
| Load Average * | 33.5 | 32.4 3% | 41.4 -24% | 38.8 -16% | 41 -22% | 34.5 -3% |
| Load Maximum * | 36.1 | 37.2 -3% | 41.5 -15% | 38.8 -7% | 42 -16% | 50.9 -41% |
| Witcher 3 ultra * | 41.5 | 39 | 39.5 |
* ... smaller is better
Noise Level
| Idle |
| 29.1 / 29.1 / 29.1 dB(A) |
| Load |
| 33.5 / 36.1 dB(A) |
 | ||
30 dB silent 40 dB(A) audible 50 dB(A) loud |
||
min: | ||
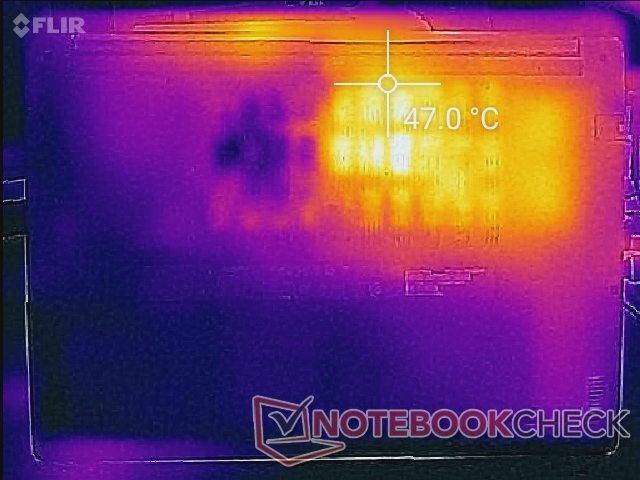
Temperature
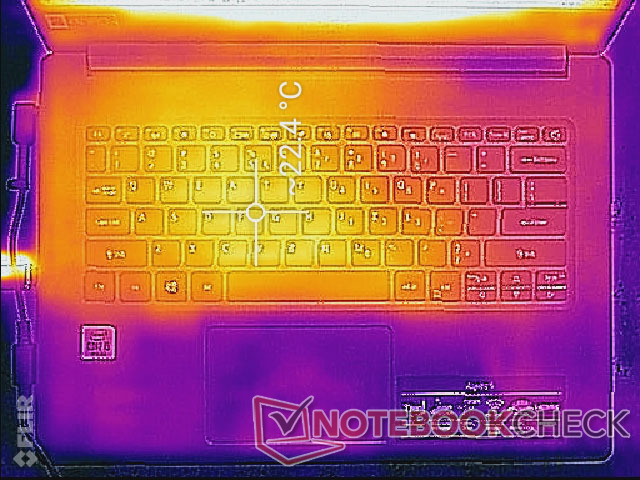
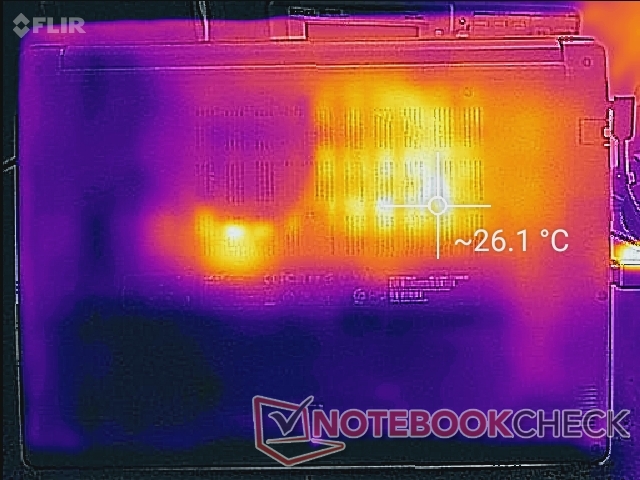
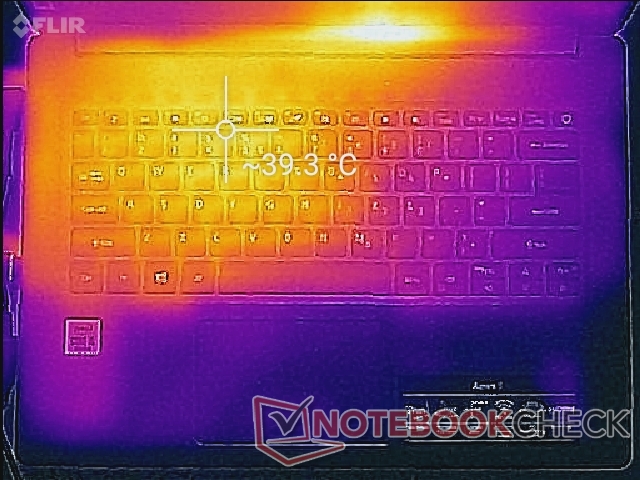
Surface temperatures are always warmer on the left half of the laptop than the right because of the how the motherboard and cooling apparatus are positioned. When under extreme loads, hot spots on the left side can be as warm as 44 C compared to just 26 C on the right side. Nonetheless, the system never becomes uncomfortable on the palms or lap. Hot spots on the thinner Walmart Motile laptop can be much warmer at up to 58 C when under similar stressful conditions.
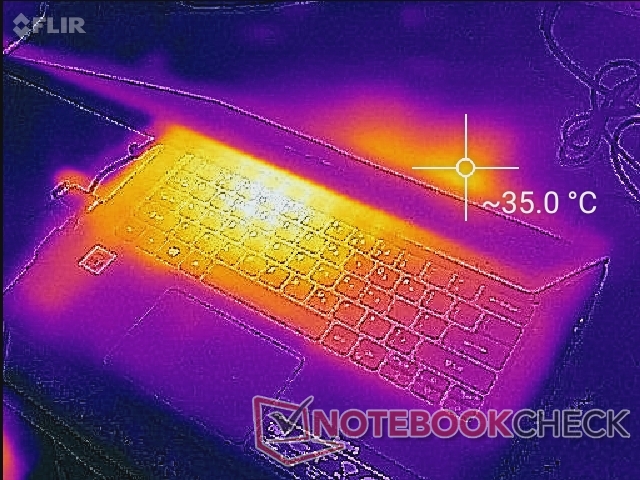
(+) The maximum temperature on the upper side is 39.2 °C / 103 F, compared to the average of 36.9 °C / 98 F, ranging from 21.1 to 71 °C for the class Multimedia.
(-) The bottom heats up to a maximum of 46 °C / 115 F, compared to the average of 39.1 °C / 102 F
(+) In idle usage, the average temperature for the upper side is 21.1 °C / 70 F, compared to the device average of 31.2 °C / 88 F.
(+) The palmrests and touchpad are cooler than skin temperature with a maximum of 27.2 °C / 81 F and are therefore cool to the touch.
(±) The average temperature of the palmrest area of similar devices was 28.8 °C / 83.8 F (+1.6 °C / 2.8 F).
Stress Test
We stress the system with synthetic loads to identify for any potential throttling or stability issues. When running Prime95, clock rates would fluctuate between 400 MHz and 3.4 GHz for the first 20 seconds or so before stabilizing at 2.2 GHz and 63 C. This behavior is definitely strange and undesirable as it indicates unsteady Turbo Boost performance during a period when Turbo Boost is normally reliable. The MSI Modern 14 with the same Core i5 CPU, for example, would boost and remain steady at the 2.7 GHz to 3 GHz range temporarily before stabilizing at 2.3 to 2.5 GHz when under similar Prime95 conditions.
Running both Prime95 and FurMark will throttle the CPU down to just 1 GHz while maintaining a core temperature of 65 C to be about average for a Core U-powered Ultrabook. We suspect that SKUs with the dedicated GeForce MX250 GPU will run warmer since both processors will share the same copper heat pipe.
Performance between battery power and AC adapter power is essentially the same. A 3DMark 11 run on battery power returns Physics and Graphics scores of 6436 and 1817 points, respectively, to be nearly identical to the scores when on mains.
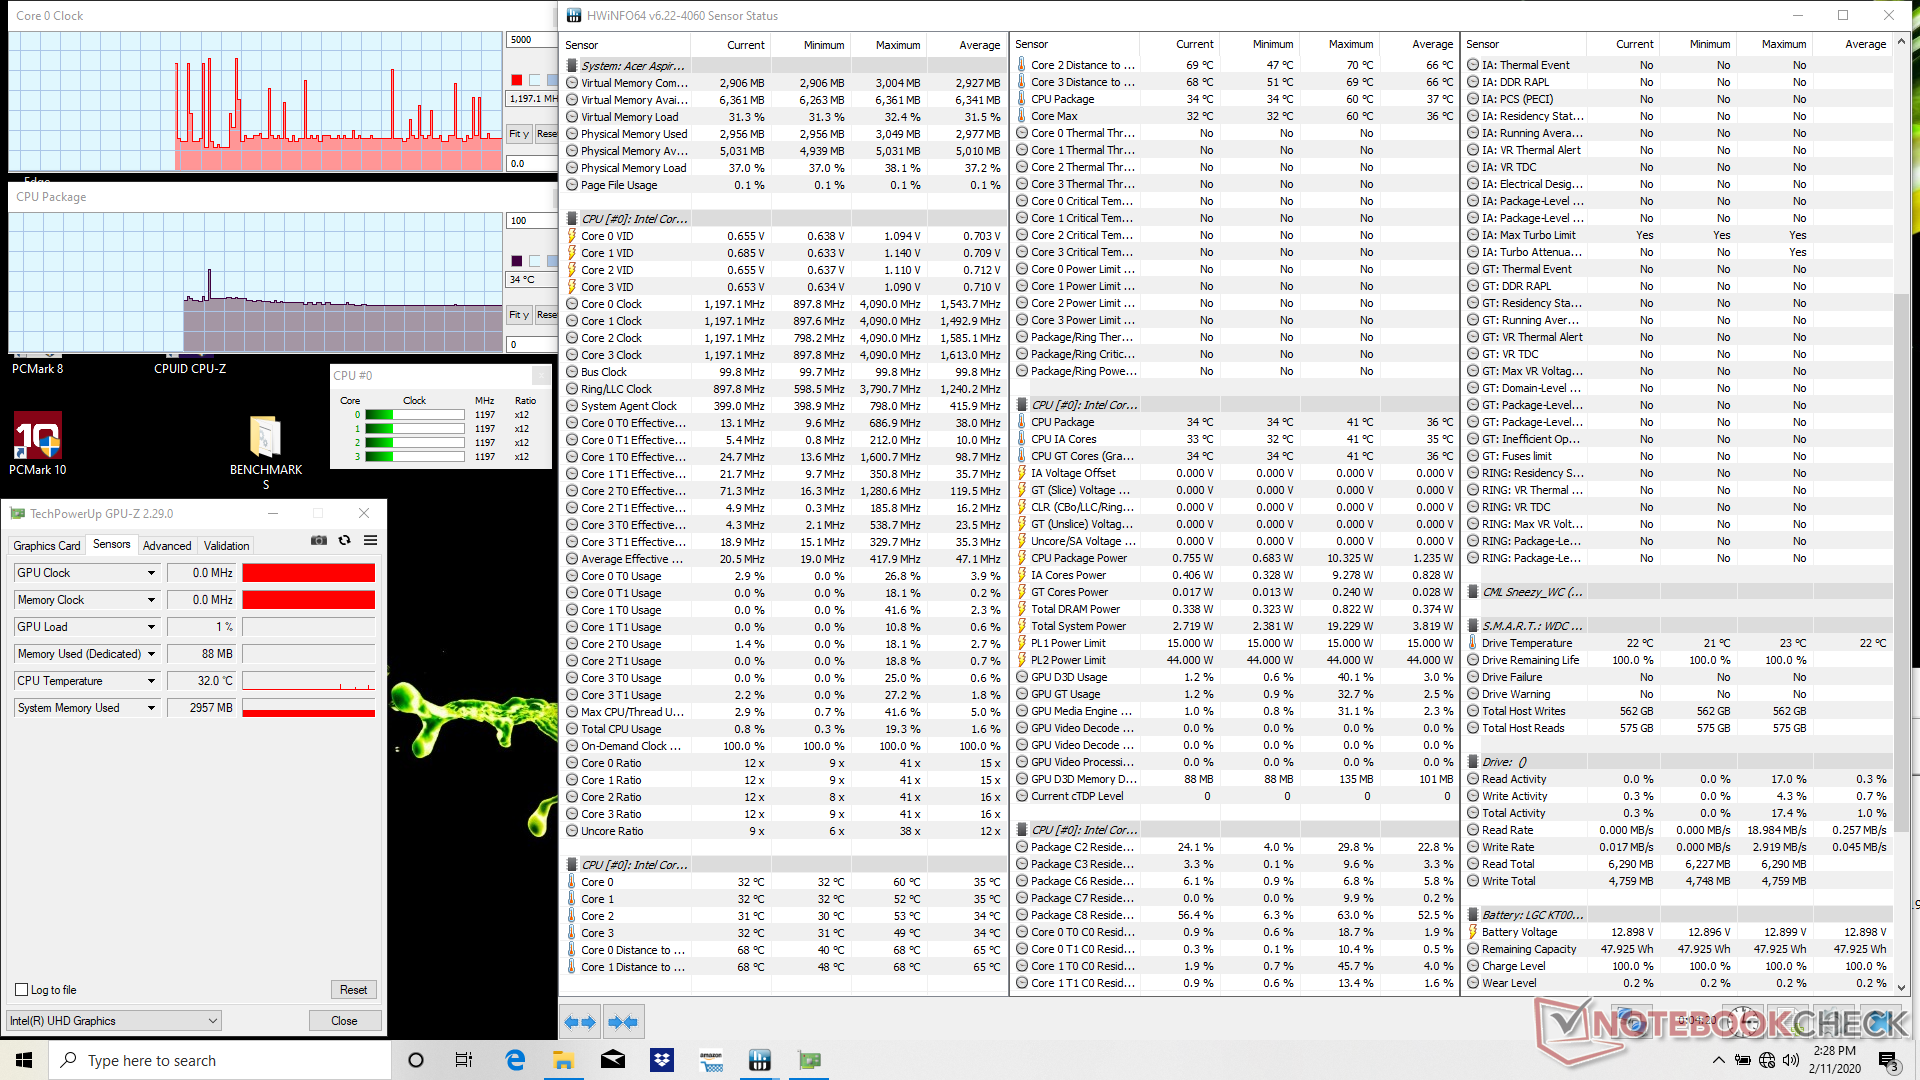
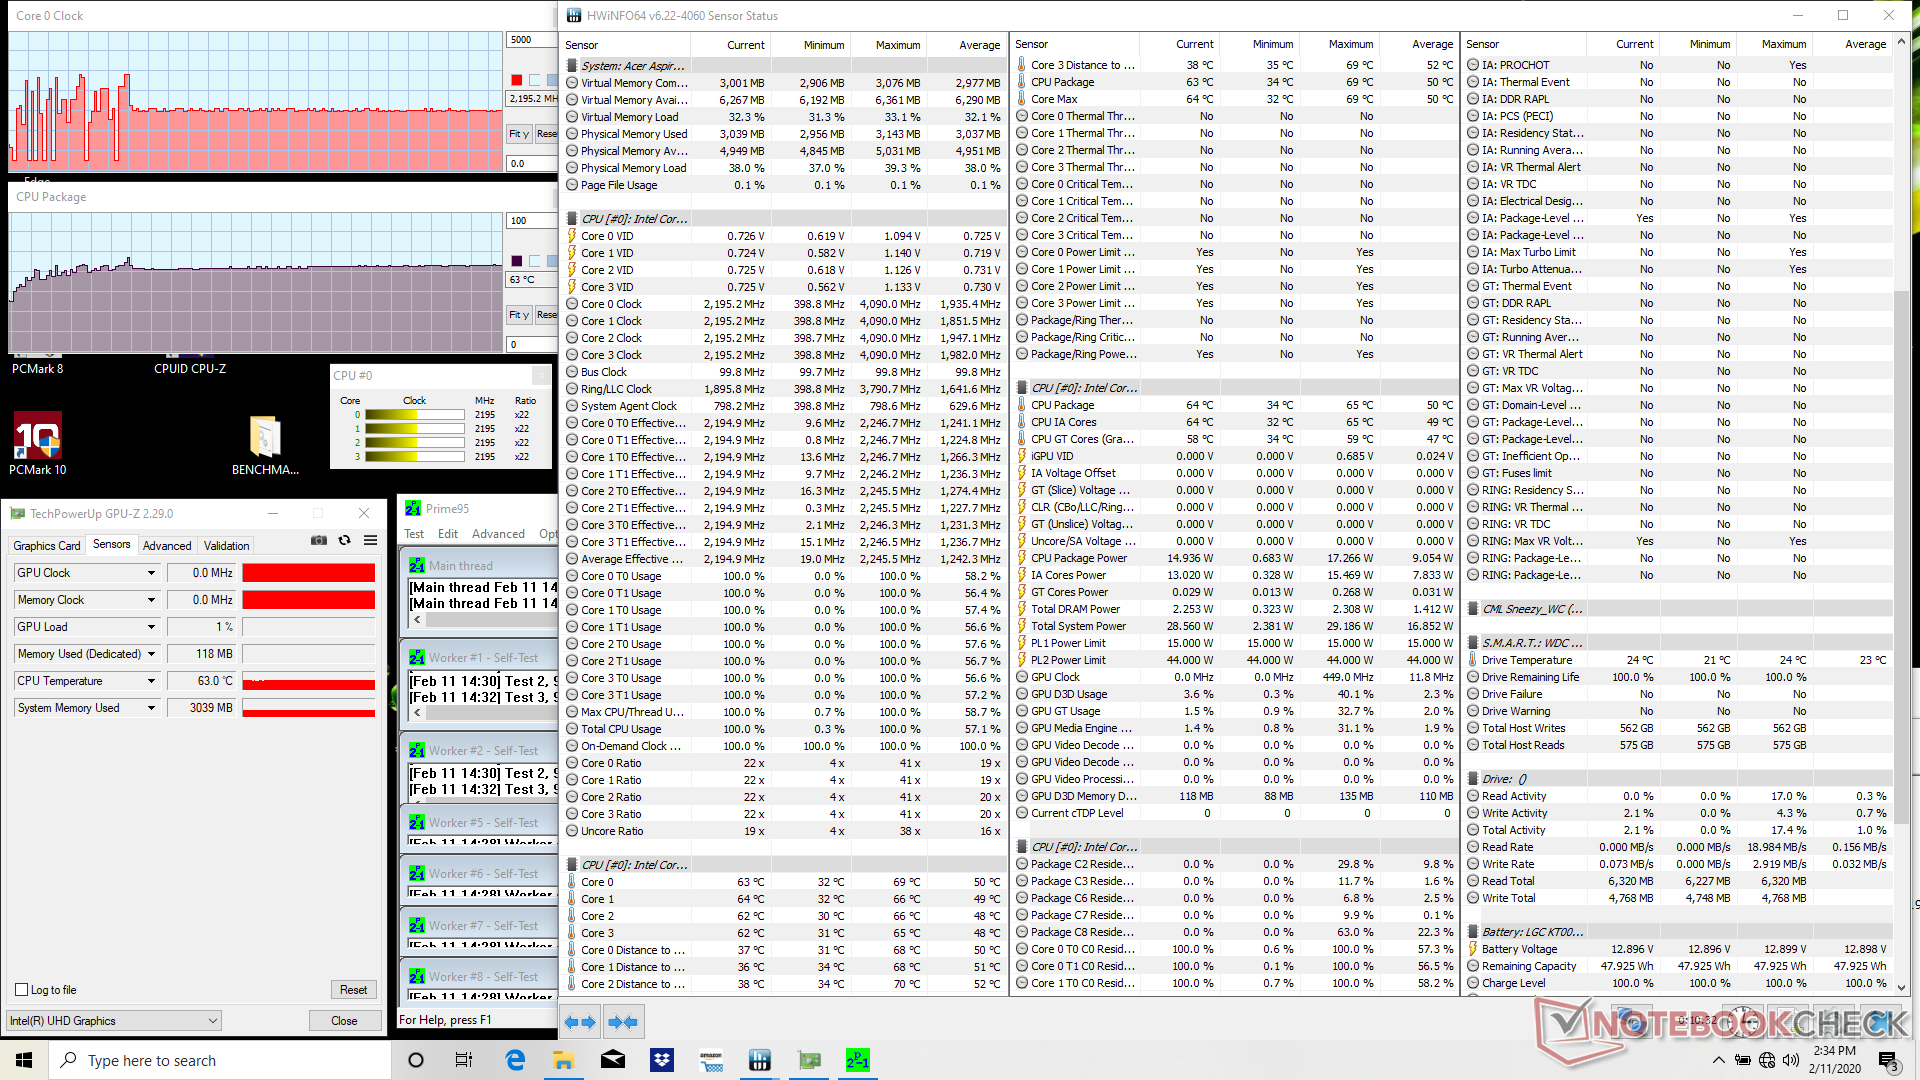
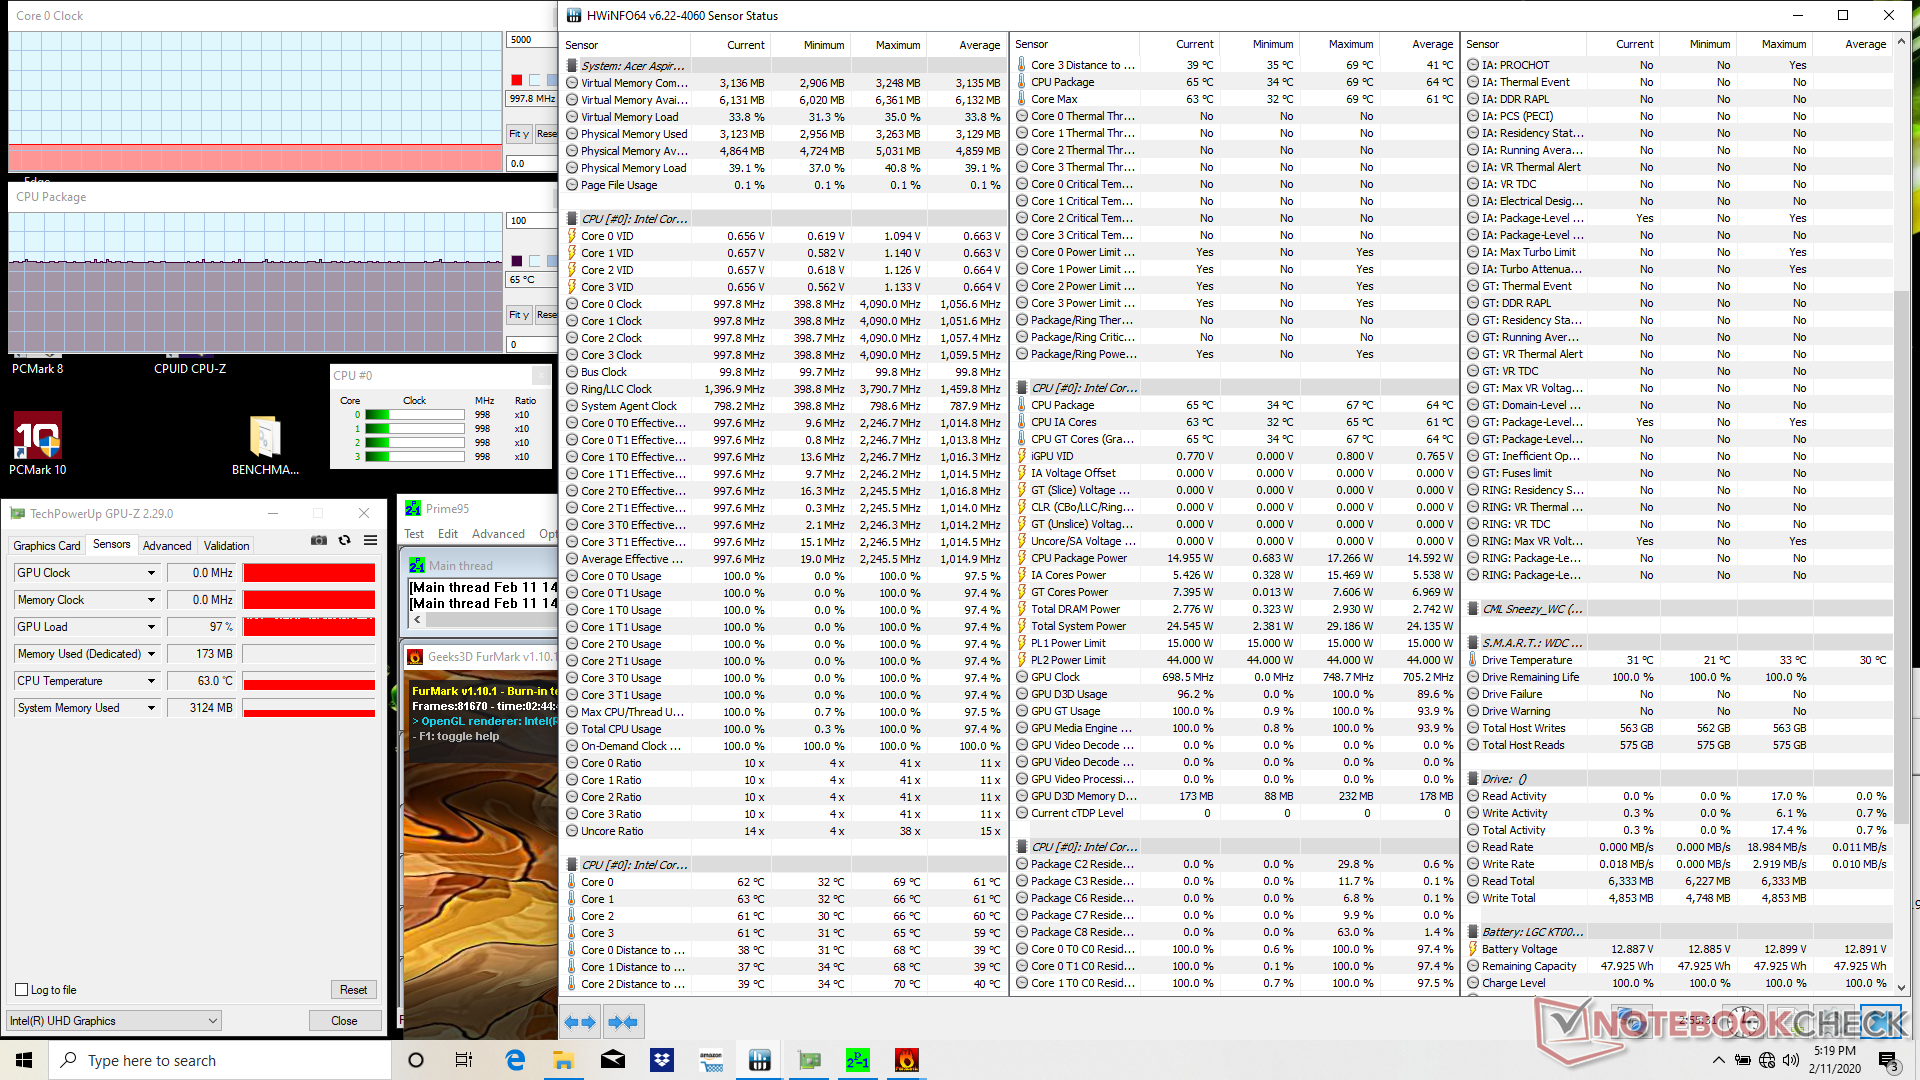
| CPU Clock (GHz) | GPU Clock (MHz) | Average CPU Temperature (°C) | |
| System Idle | -- | -- | 34 |
| Prime95 Stress | 2.2 | -- | 63 |
| Prime95 + FurMark Stress | 1.0 | -- | 65 |
Speakers
Audio quality is nothing special for a budget laptop and not dissimilar to the HP Pavilion x360 15 in terms of both maximum volume and bass reproduction as exemplified by their similar pink noise graphs. Maximum volume introduces no static or heavy imbalances and only minor vibrations on the palm rests surface.


Acer Aspire 5 A514-52 audio analysis
(±) | speaker loudness is average but good (78.1 dB)
Bass 100 - 315 Hz
(-) | nearly no bass - on average 16.5% lower than median
(-) | bass is not linear (15.3% delta to prev. frequency)
Mids 400 - 2000 Hz
(+) | balanced mids - only 2.6% away from median
(±) | linearity of mids is average (9.3% delta to prev. frequency)
Highs 2 - 16 kHz
(+) | balanced highs - only 2.8% away from median
(±) | linearity of highs is average (8.8% delta to prev. frequency)
Overall 100 - 16.000 Hz
(±) | linearity of overall sound is average (20.1% difference to median)
Compared to same class
» 62% of all tested devices in this class were better, 9% similar, 29% worse
» The best had a delta of 5%, average was 18%, worst was 45%
Compared to all devices tested
» 46% of all tested devices were better, 8% similar, 45% worse
» The best had a delta of 4%, average was 25%, worst was 134%
Apple MacBook 12 (Early 2016) 1.1 GHz audio analysis
(+) | speakers can play relatively loud (83.6 dB)
Bass 100 - 315 Hz
(±) | reduced bass - on average 11.3% lower than median
(±) | linearity of bass is average (14.2% delta to prev. frequency)
Mids 400 - 2000 Hz
(+) | balanced mids - only 2.4% away from median
(+) | mids are linear (5.5% delta to prev. frequency)
Highs 2 - 16 kHz
(+) | balanced highs - only 2% away from median
(+) | highs are linear (4.5% delta to prev. frequency)
Overall 100 - 16.000 Hz
(+) | overall sound is linear (10.2% difference to median)
Compared to same class
» 5% of all tested devices in this class were better, 2% similar, 93% worse
» The best had a delta of 5%, average was 19%, worst was 53%
Compared to all devices tested
» 3% of all tested devices were better, 1% similar, 96% worse
» The best had a delta of 4%, average was 25%, worst was 134%
Energy Management
Power Consumption
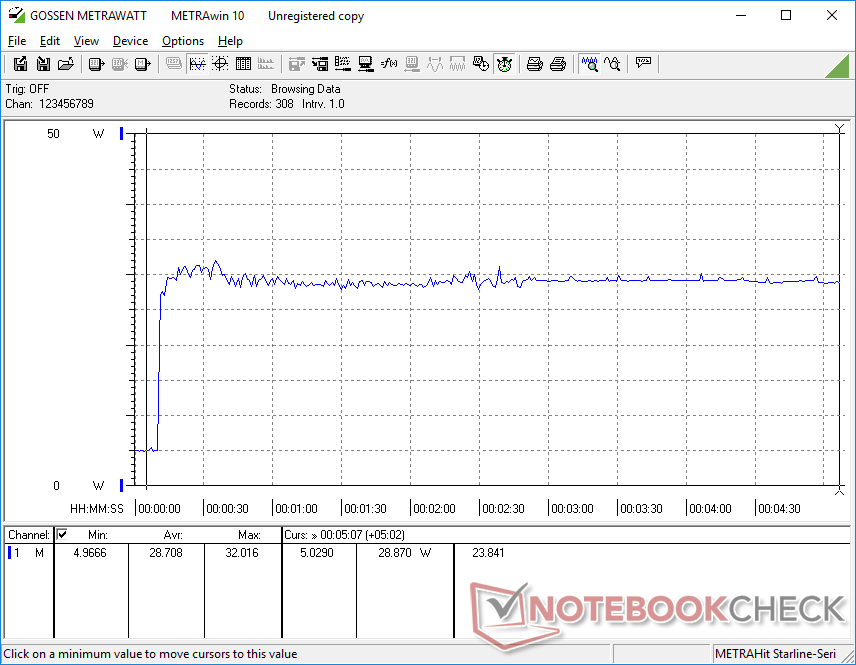
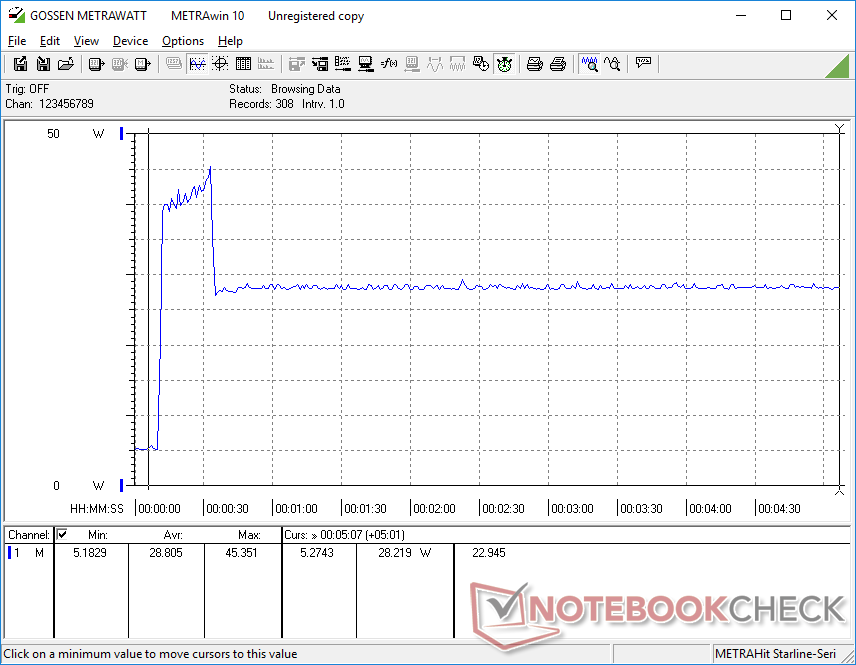
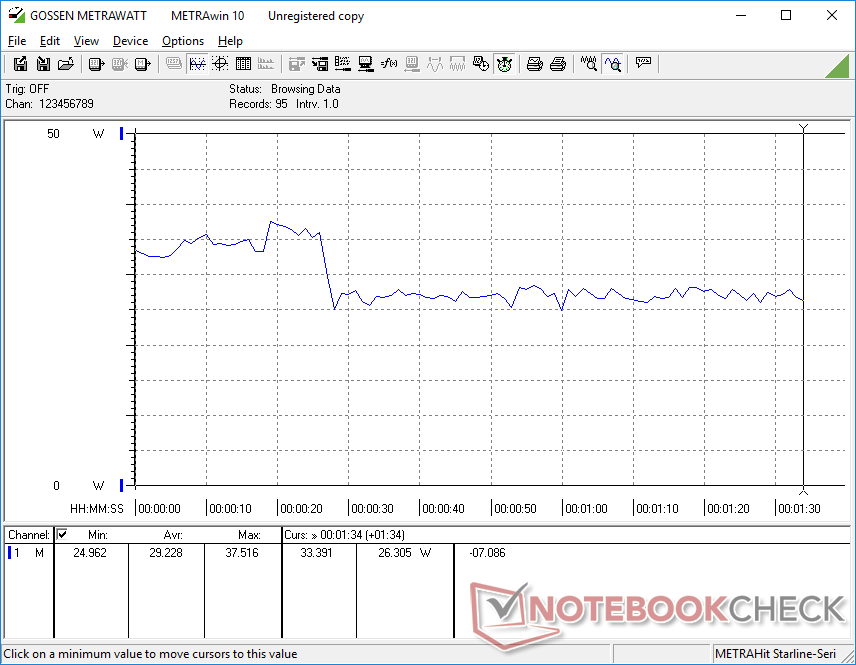
Our Aspire is very power efficient even for its class likely due to its below average CPU performance. Idling on desktop demands between 2 W and 5 W depending on the brightness level compared to 5 W and 14 W on the AMD-powered Walmart Mobile or 2 W and 6 W on the Asus VivoBook 14 with the older Core i5-8265U CPU. Running 3DMark 06 consumes about 35 W for the first 30 seconds or so before falling to 26 W thereafter.
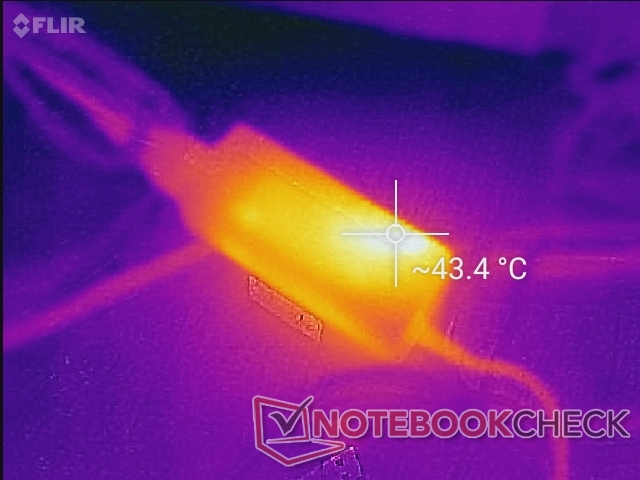
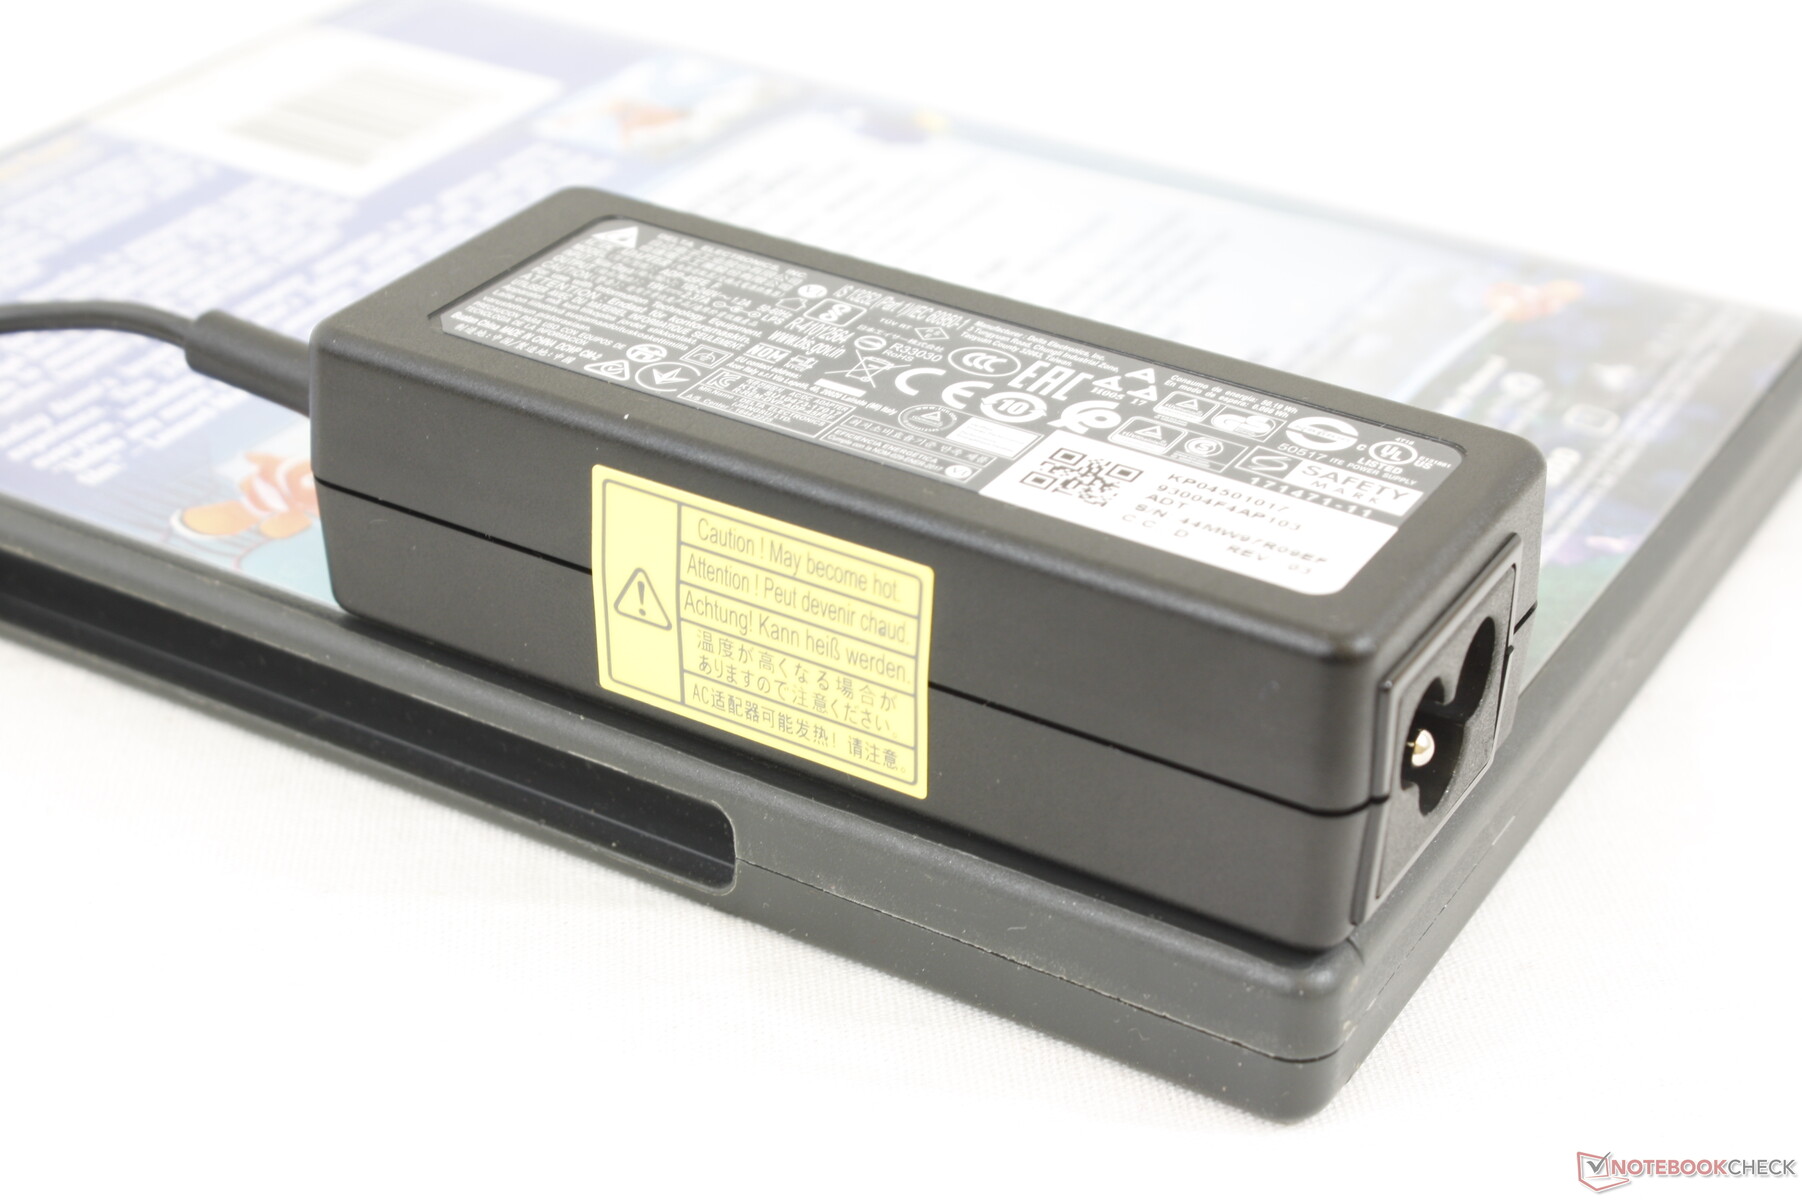
We're able to measure a maximum consumption of 45.4 W from the small (~9.3 x 3.8 x 2.7 cm) 45 W AC adapter when running both Prime95 and FurMark simultaneously. However, this lasts for only about 20 seconds as shown by our graph below before falling and stabilizing at 28.2 W. Note that the higher-end A514-52G SKUs with dedicated Nvidia graphics will ship with a more capable 65 W AC adapter.
| Off / Standby | |
| Idle | |
| Load |
|
| Acer Aspire 5 A514-52 i5-10210U, UHD Graphics 620, WDC PC SN520 SDAPNUW-512G, IPS, 1920x1080, 14.00 | Asus VivoBook 14 X403FA i5-8265U, UHD Graphics 620, Intel SSD 660p SSDPEKNW512G8, IPS, 1920x1080, 14.00 | MSI Modern 14 A10RB-459US i5-10210U, GeForce MX250, Kingston RBUSNS8154P3512GJ, IPS, 1920x1080, 14.00 | Dell Inspiron 14 3493-4KWCF i7-1065G7, GeForce MX230, Toshiba KBG40ZNS512G NVMe, IPS, 1920x1080, 14.00 | Walmart Motile M142 R5 3500U, Vega 8, BIWIN SSD 256 GB, IPS, 1920x1080, 14.00 | Lenovo Ideapad C340-14API 81N6004UGE R5 3500U, Vega 8, Samsung SSD PM981 MZVLB256HAHQ, IPS, 1920x1080, 14.00 | |
|---|---|---|---|---|---|---|
| Power Consumption | -18% | -75% | -69% | -115% | -77% | |
| Idle Minimum * | 2.7 | 2.7 -0% | 4.2 -56% | 4.7 -74% | 5.3 -96% | 5.1 -89% |
| Idle Average * | 3 | 4.6 -53% | 5.9 -97% | 6.6 -120% | 8.6 -187% | 7.2 -140% |
| Idle Maximum * | 4.6 | 5.2 -13% | 7.2 -57% | 5.9 -28% | 13.1 -185% | 9.7 -111% |
| Load Average * | 29.3 | 35.9 -23% | 63.4 -116% | 56 -91% | 50.6 -73% | 40 -37% |
| Load Maximum * | 45.4 | 46 -1% | 67.4 -48% | 60.2 -33% | 61.6 -36% | 49 -8% |
| Witcher 3 ultra * | 53.5 |
* ... smaller is better
Battery Life
The internal 51 Wh battery is typical in size for a budget multimedia laptop. Still, real-world WLAN runtimes are long for its category at about 9.5 hours of use compared to "only" 7.5 hours on the Walmart Motile or Lenovo IdeaPad C340. Recharging from empty to full capacity takes about 1.5 to 2 hours.
It is not possible to recharge the laptop with a USB Type-C charger meaning that the proprietary AC adapter must not be lost. Such a feature would have been a boon for travelers.
| Acer Aspire 5 A514-52 i5-10210U, UHD Graphics 620, 51 Wh | Asus VivoBook 14 X403FA i5-8265U, UHD Graphics 620, 72 Wh | MSI Modern 14 A10RB-459US i5-10210U, GeForce MX250, 50 Wh | Dell Inspiron 14 3493-4KWCF i7-1065G7, GeForce MX230, 42 Wh | Walmart Motile M142 R5 3500U, Vega 8, 47 Wh | Lenovo Ideapad C340-14API 81N6004UGE R5 3500U, Vega 8, 45 Wh | |
|---|---|---|---|---|---|---|
| Battery Runtime | 39% | -16% | -30% | -18% | -21% | |
| Reader / Idle | 1360 | 2141 57% | 986 -27% | 830 -39% | ||
| WiFi v1.3 | 564 | 761 35% | 515 -9% | 390 -31% | 462 -18% | 448 -21% |
| Load | 121 | 153 26% | 105 -13% | 98 -19% |
Pros
Cons
Verdict
The Acer Aspire 5 A514 doesn't excel at any one particular category which is fine since it is supposed to be an affordable laptop. Still, that doesn't mean it can't be behind in some key aspects. Users choosing a 14-inch laptop over a 15.6-inch laptop are more likely to value the portability of the smaller form factor. The thick bezels and thus heavier weight of the Acer make it an inferior option to lighter alternatives like the Asus VivoBook or Walmart Motile. The larger dimensions of the Acer would have been fine had it offered advantages like improved rigidity or additional features, but we don't see any of that here.
The CPU performance bug we encountered is another blemish on the system. It thankfully won't impact day-to-day performance since the Aspire 5 doesn't target demanding workloads, but it's undesirable nonetheless. Even when not taking into account the bug, raw CPU performance is on slower than most other laptops equipped with the same Core i5-10210U processor.
There are a few highlights to the system worth mentioning. The display is well-calibrated out of the box and there are two internal storage options instead of just one. Fan noise is almost always quiet during low to low-medium loads and battery life is respectable for its category. Even so, the Aspire 5 A514 has fallen behind when compared to newer and similarly priced subnotebooks from competing OEMs.
The display may be nice for the price, but almost everything else about the Aspire 5 A514 feels dated. It may be time for Acer to redesign the chassis in order to be more competitive in the 14-inch laptop market.
Acer Aspire 5 A514-52
-
02/14/2020 v7
Allen Ngo


Pricecompare
