 Deutsch
 English
 Español
 Français
 Italiano
 Nederlands
 Polski
 Português
 Русский
 Türkçe
 Svenska
 Chinese
 Magyar
Acer Aspire 3 A315-41 (Ryzen 3 2200U, Vega 3, SSD, FHD) Laptop Review
The Aspire 3 A315-41 is an office notebook that is powered by a Ryzen 3 2200U APU. We have already reviewed several Aspire 3 models with the Aspire 3 A315-51-36YU, the Aspire 3 A315-51-55E4, the Aspire 3 A315-21-651Y and the Aspire 3 A315-51-30YA. The competing devices include: The Acer Aspire 3 A315-51, the HP 250 G6, and the Lenovo V330-15IKB.
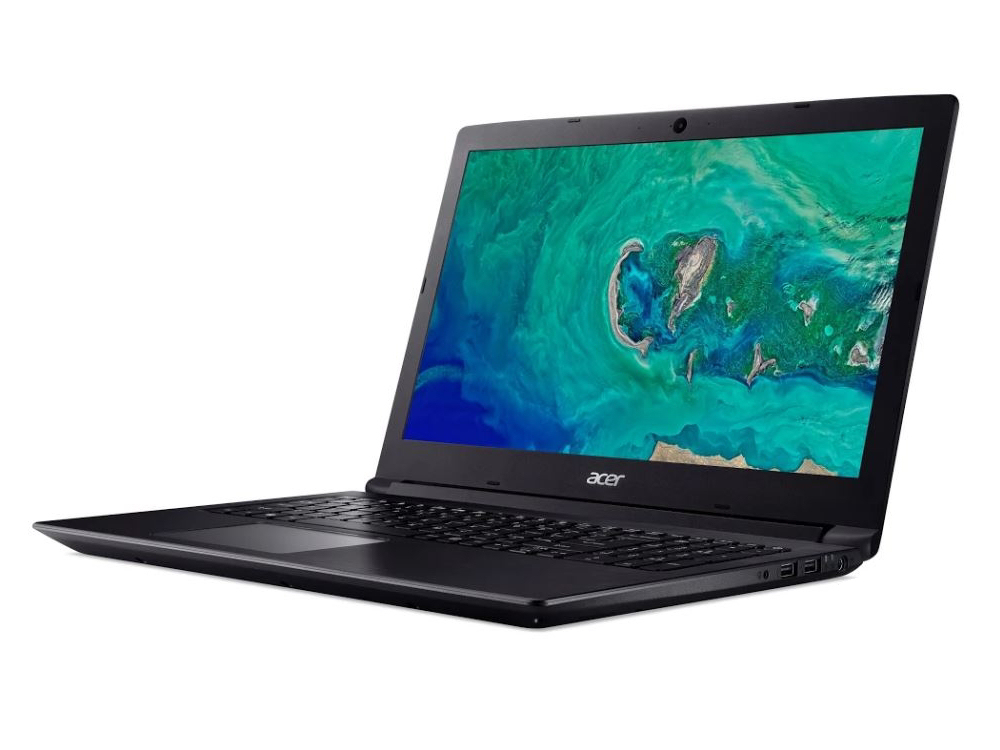
Please note: In many online stores, the A315-41 is advertised with images that depict the A315-51, the A315-31 or the A315-21. The A315-41 comes with a different case. Acer Germany could not provide any product images for the A315-41 when we asked for them.
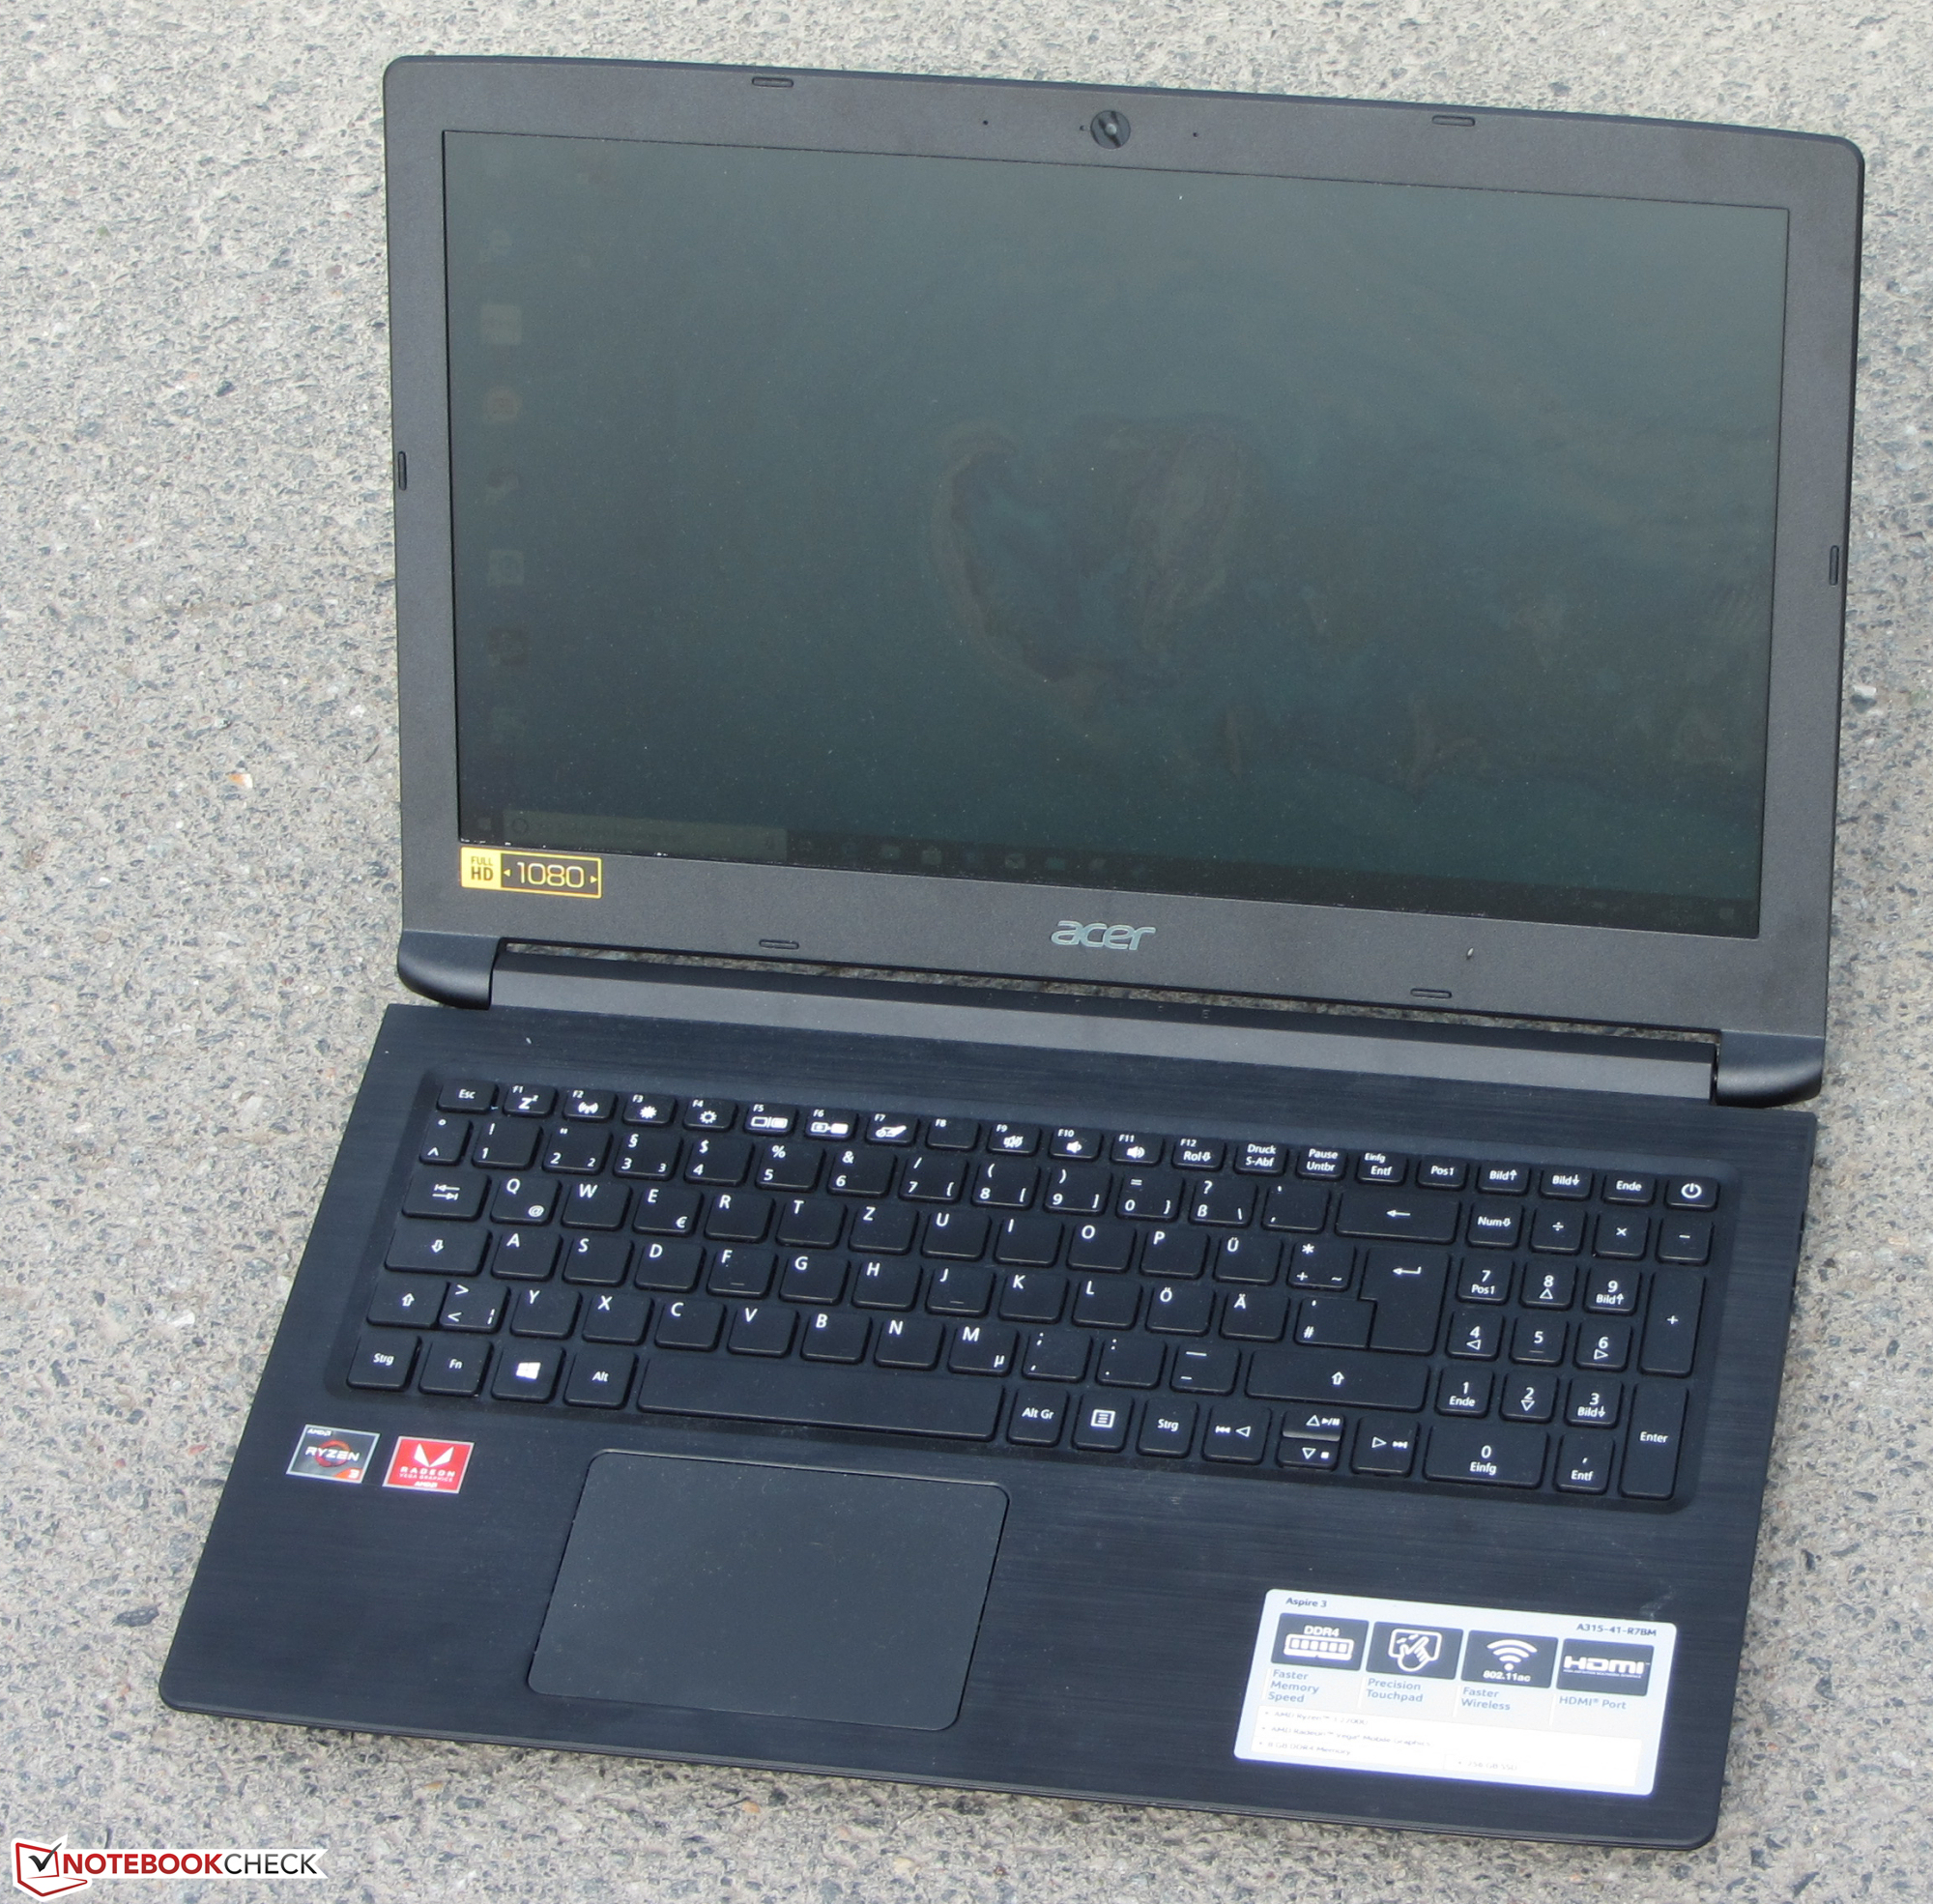
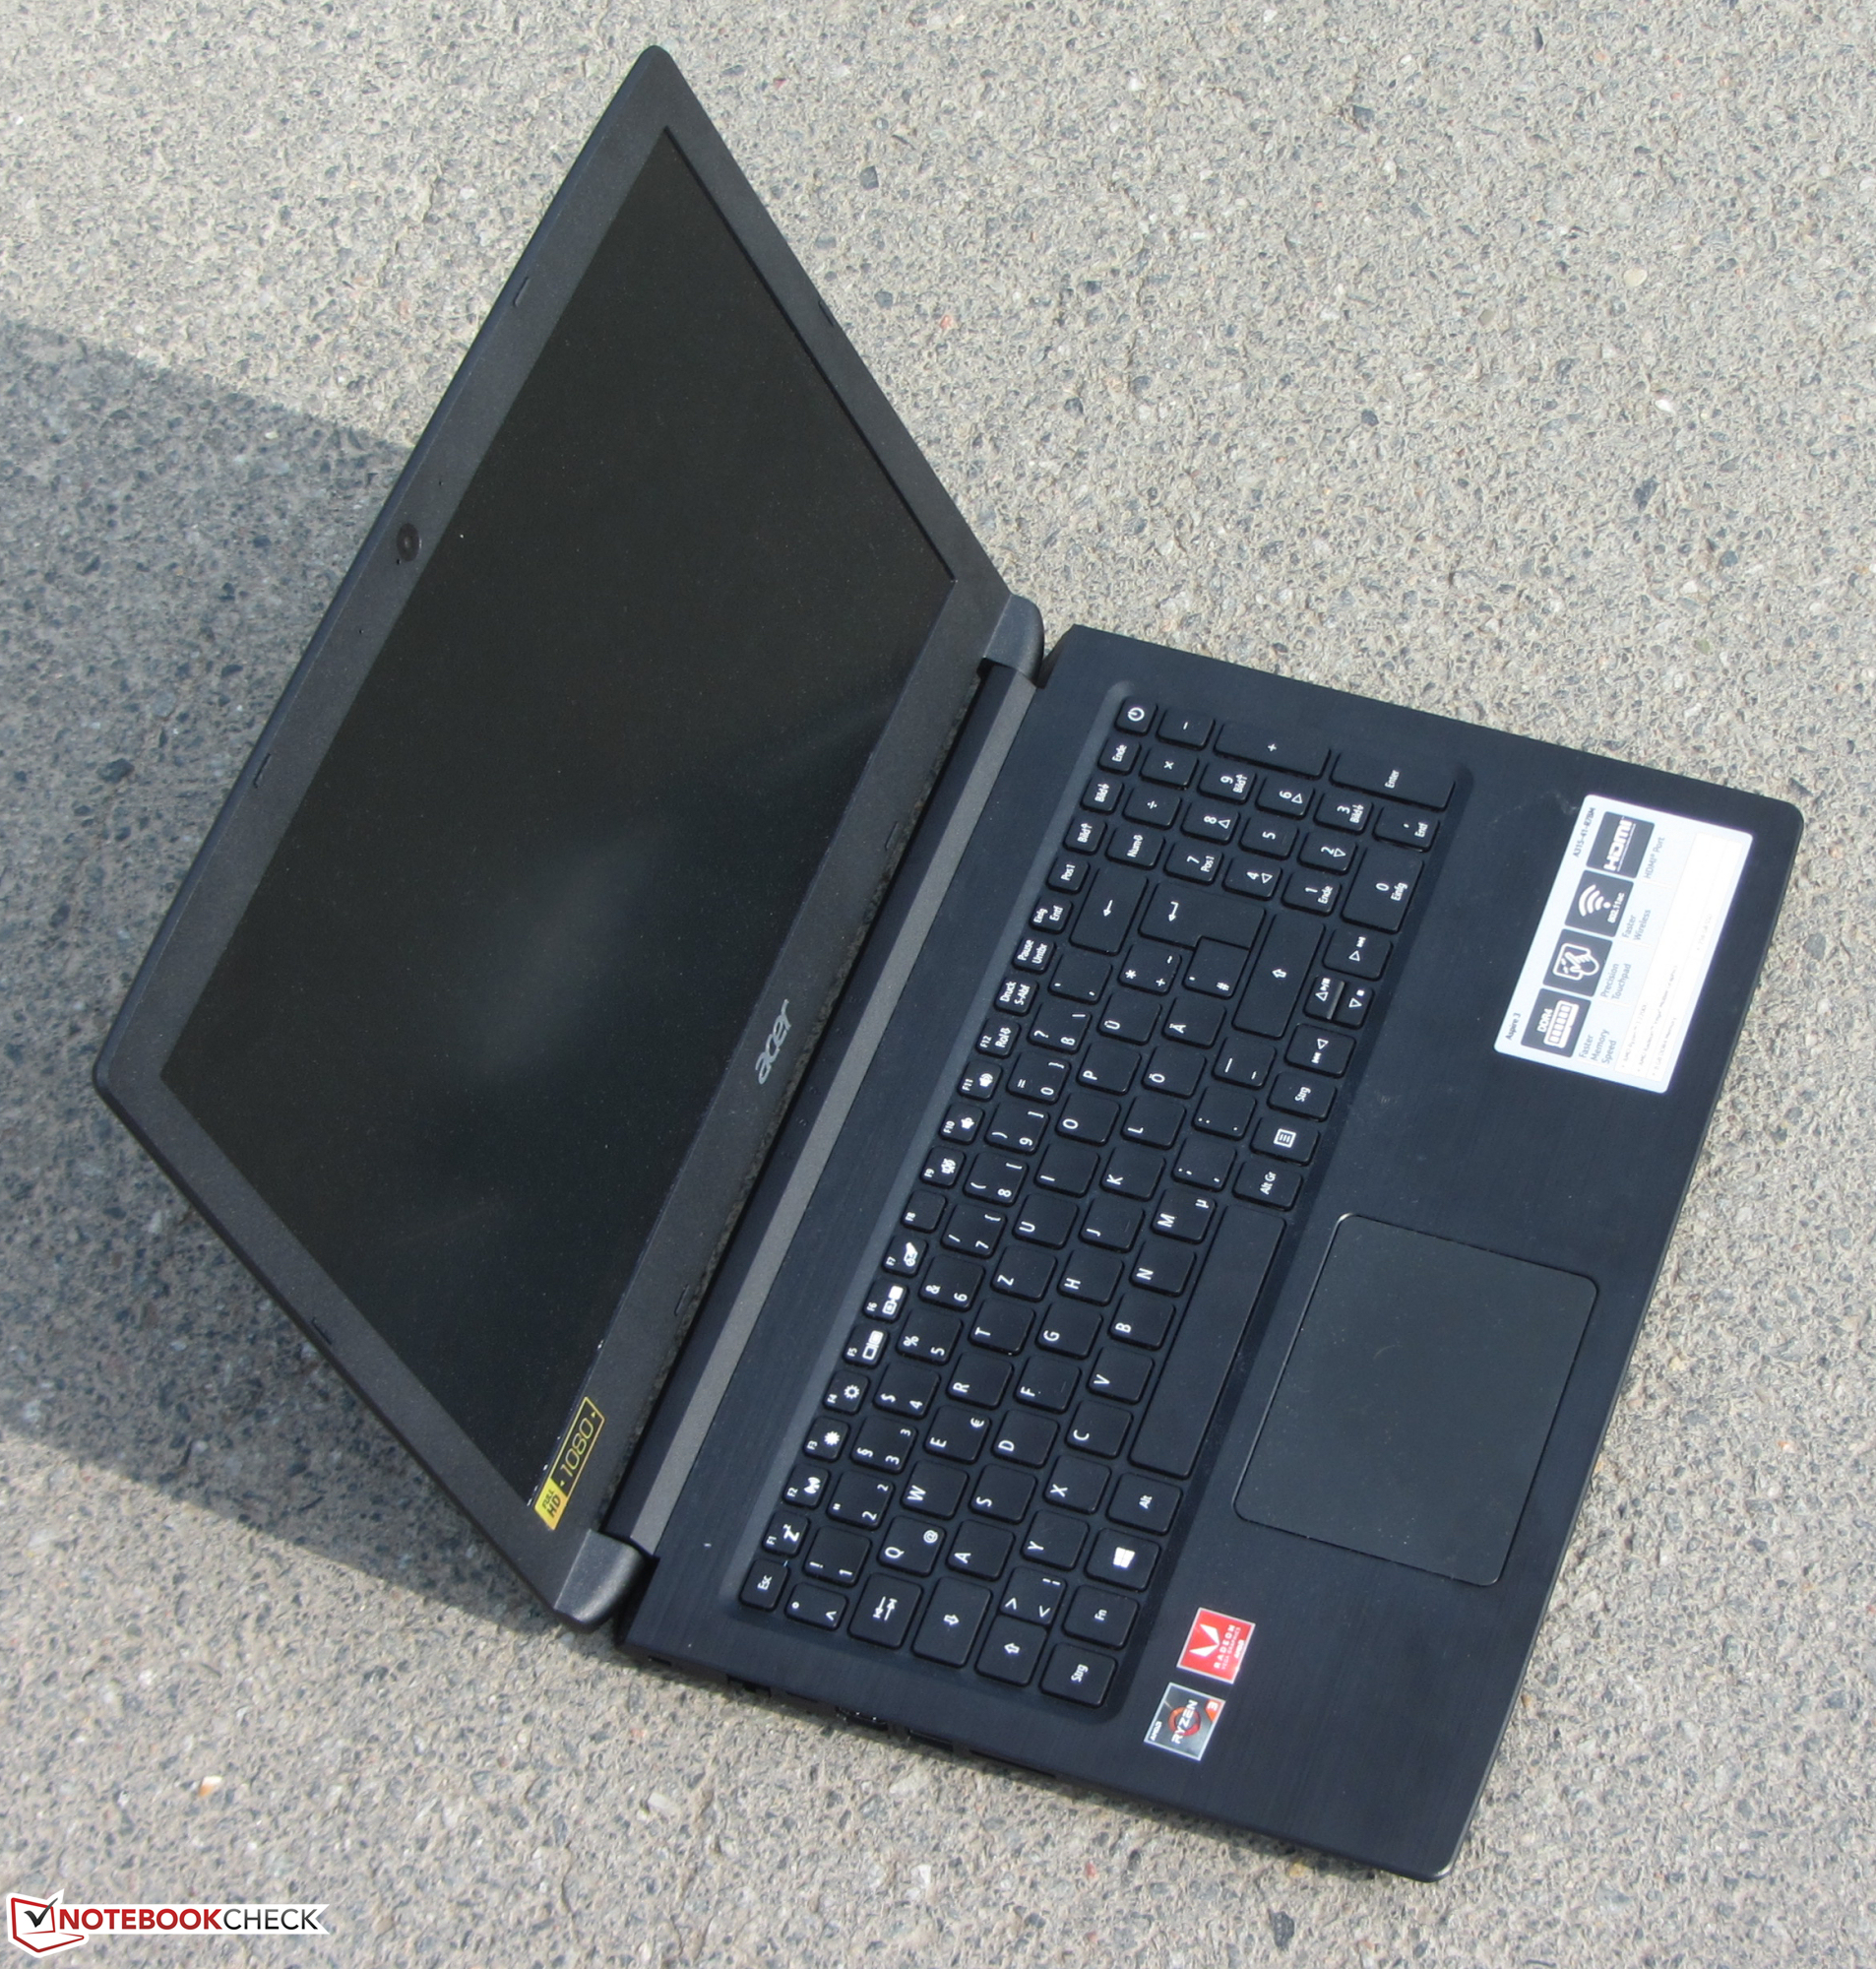
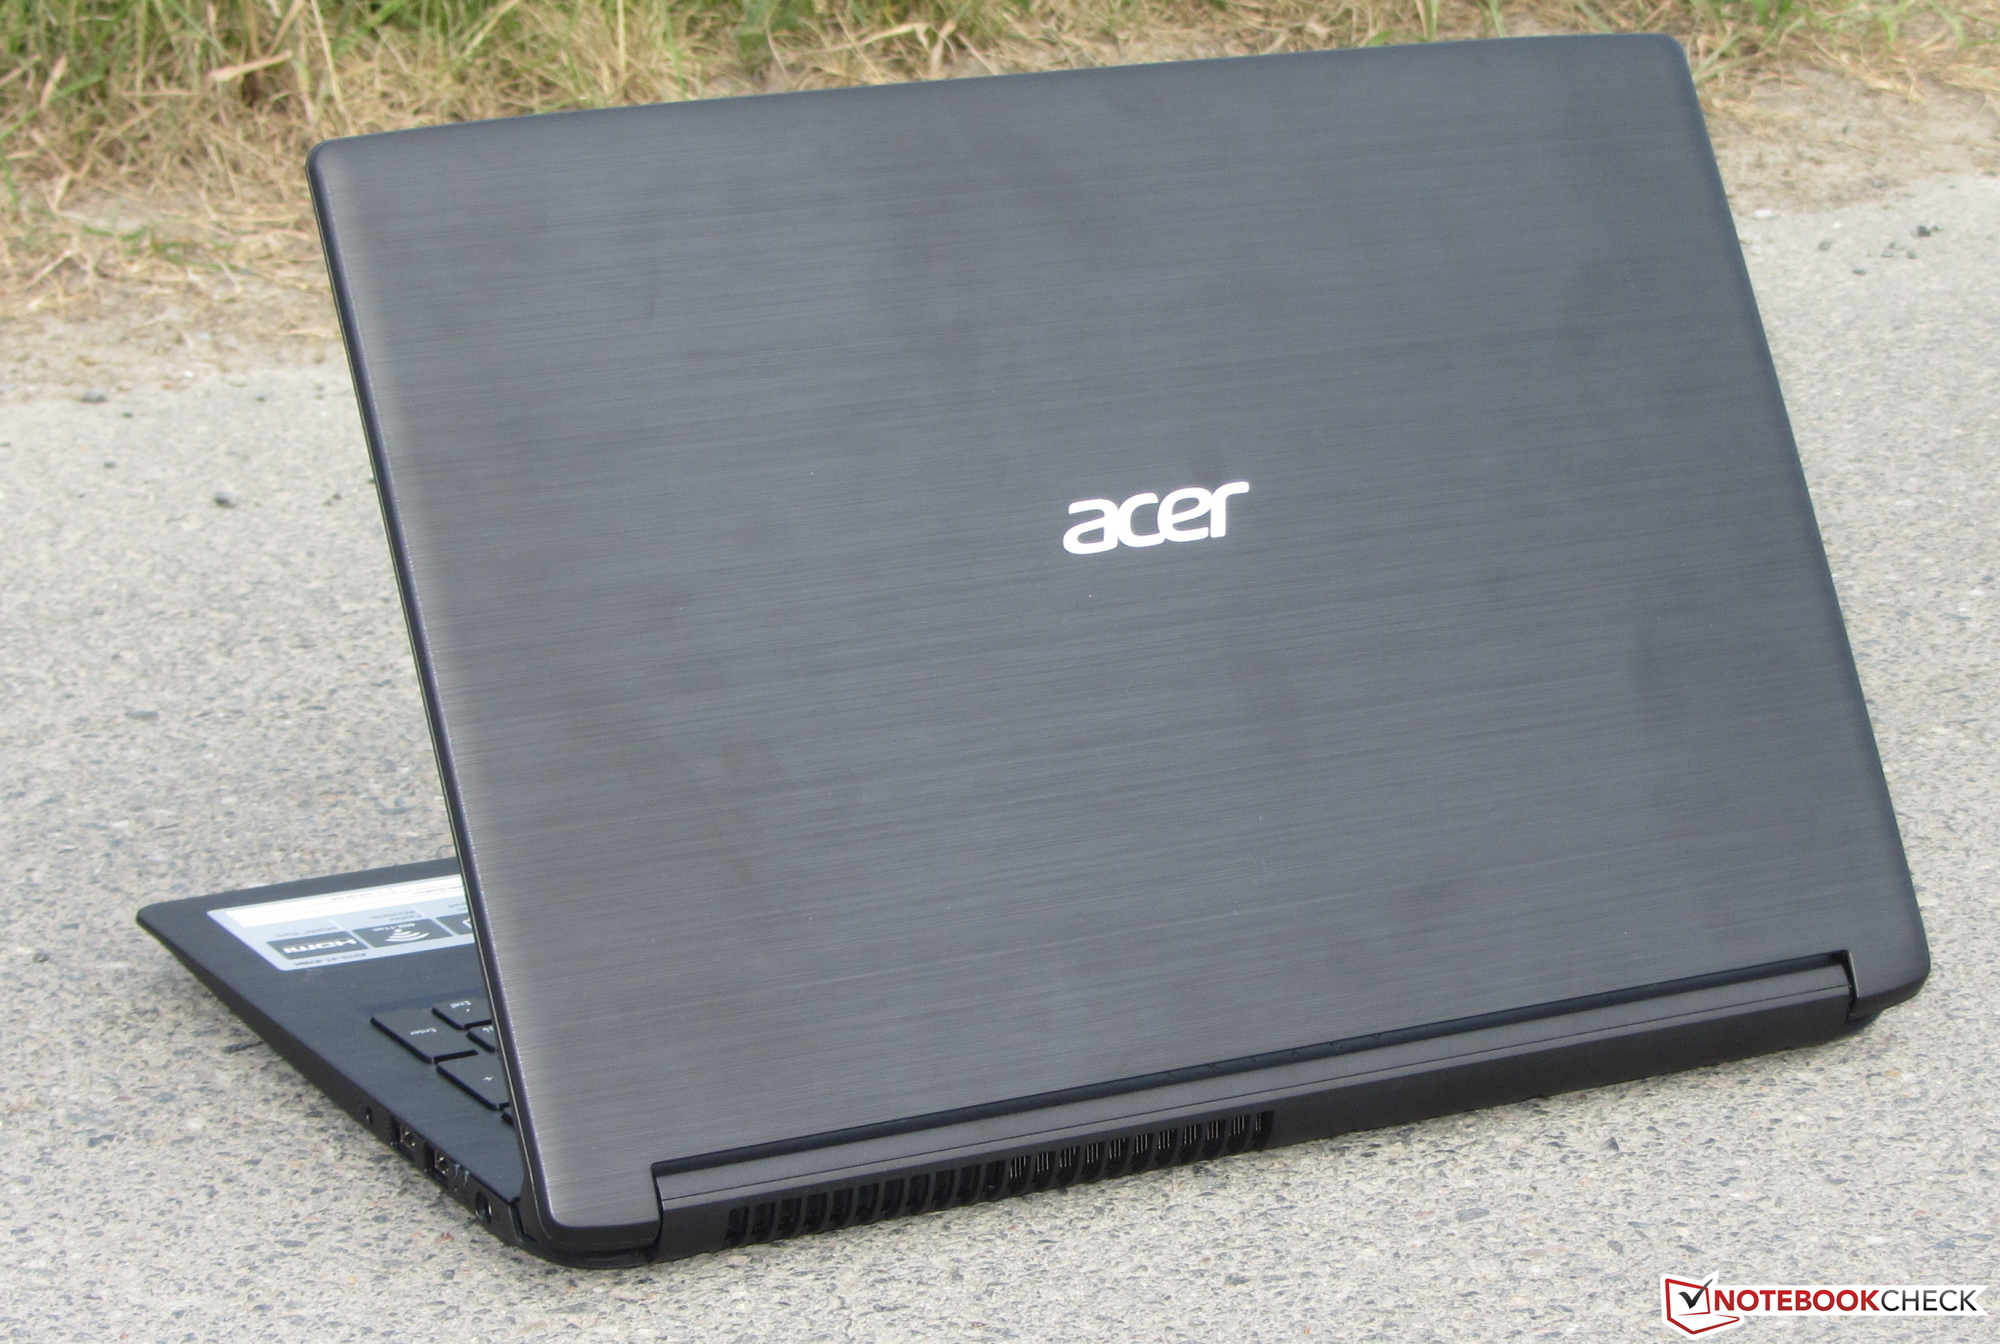
Case & Connectivity - Acer uses a plastic case
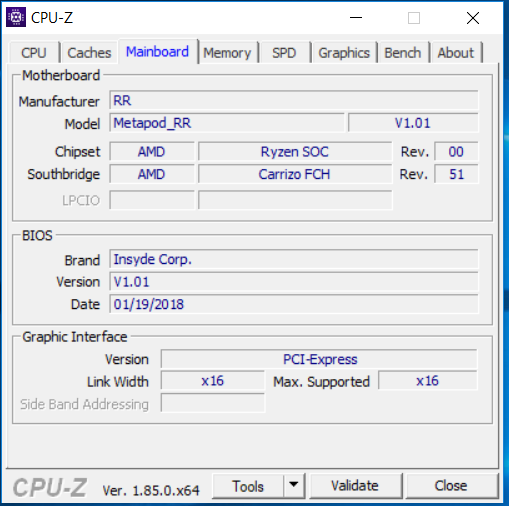
The Aspire 3 A315-21, the Aspire 3 A315-31 and the Aspire 3 A315-51 all use the same case. However, the Aspire 3 A315-41 comes with a different case. It is a little thicker and has different hinges. It also has larger fan grills. That being said, all Aspire 3 A315 models are made of black, brushed plastic.
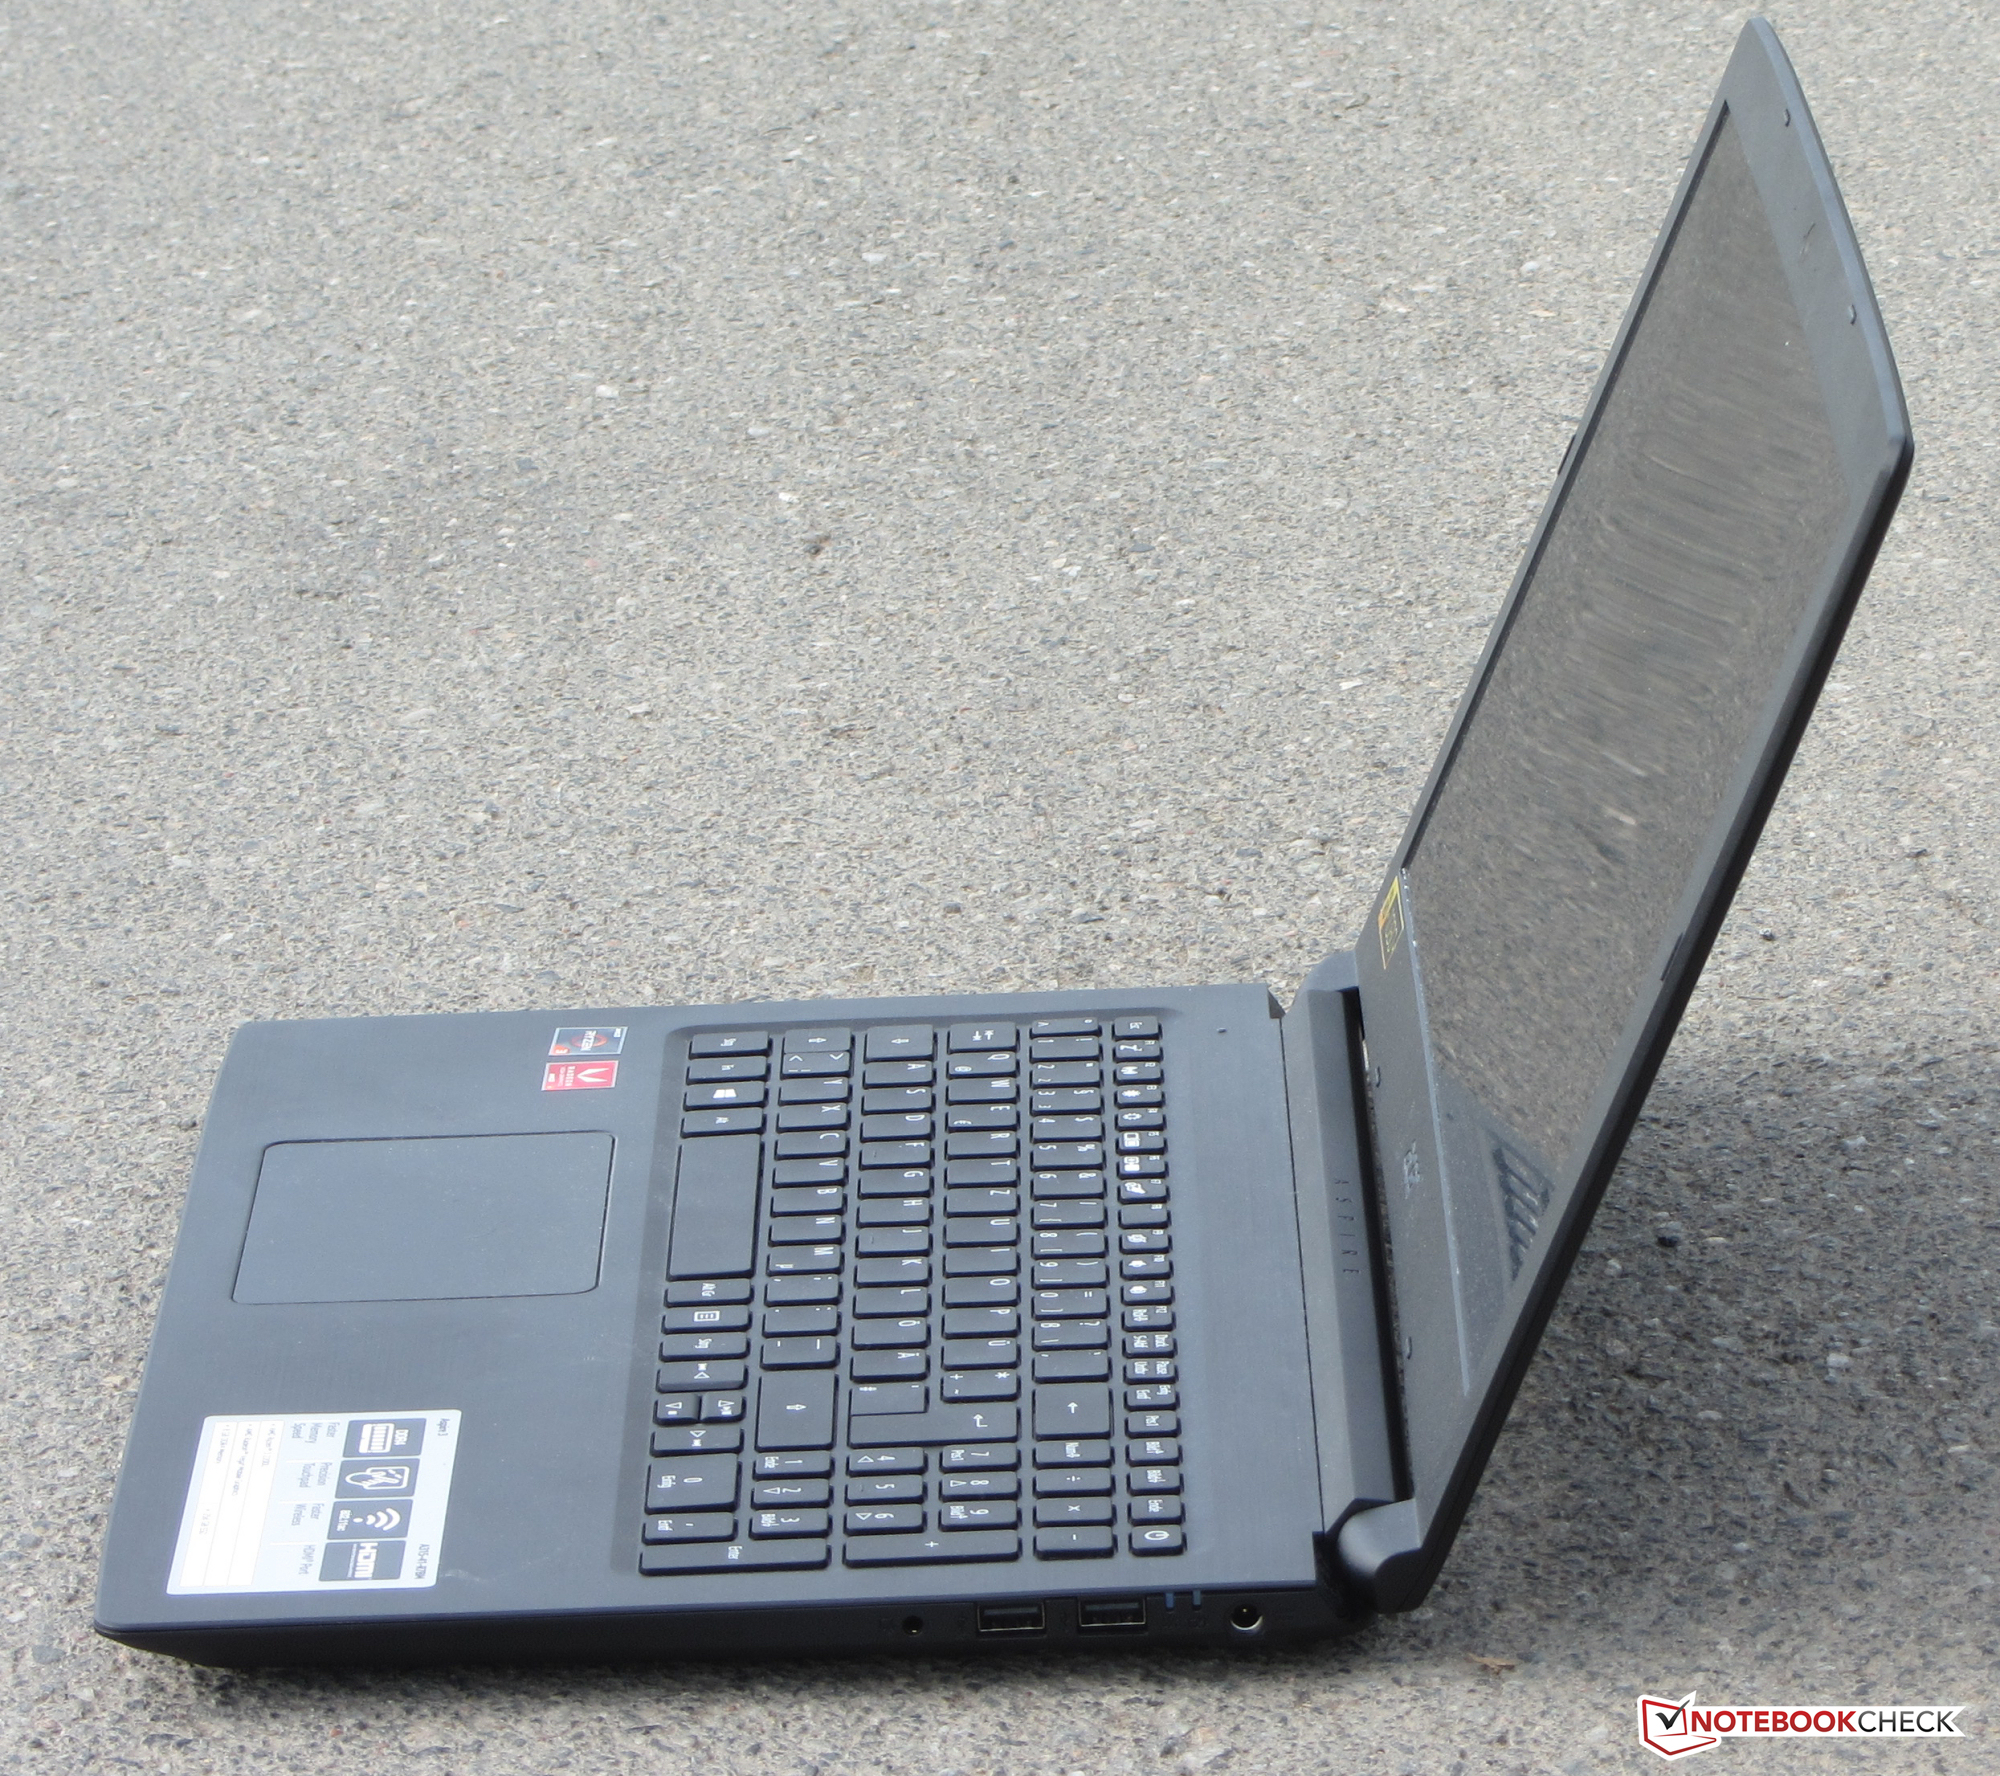
All in all, the device has a good build quality. However, the display lid could have been somewhat more rigid: It can be twisted with little effort, and when it is twisted, it usually leads to image distortions. The images also become distorted when pressure is applied to the back of the display lid. The hinges can hold the display in a set position. However, there is some screen wobble. The display lid can be opened with one hand, but this will require some sleight of hand to achieve.
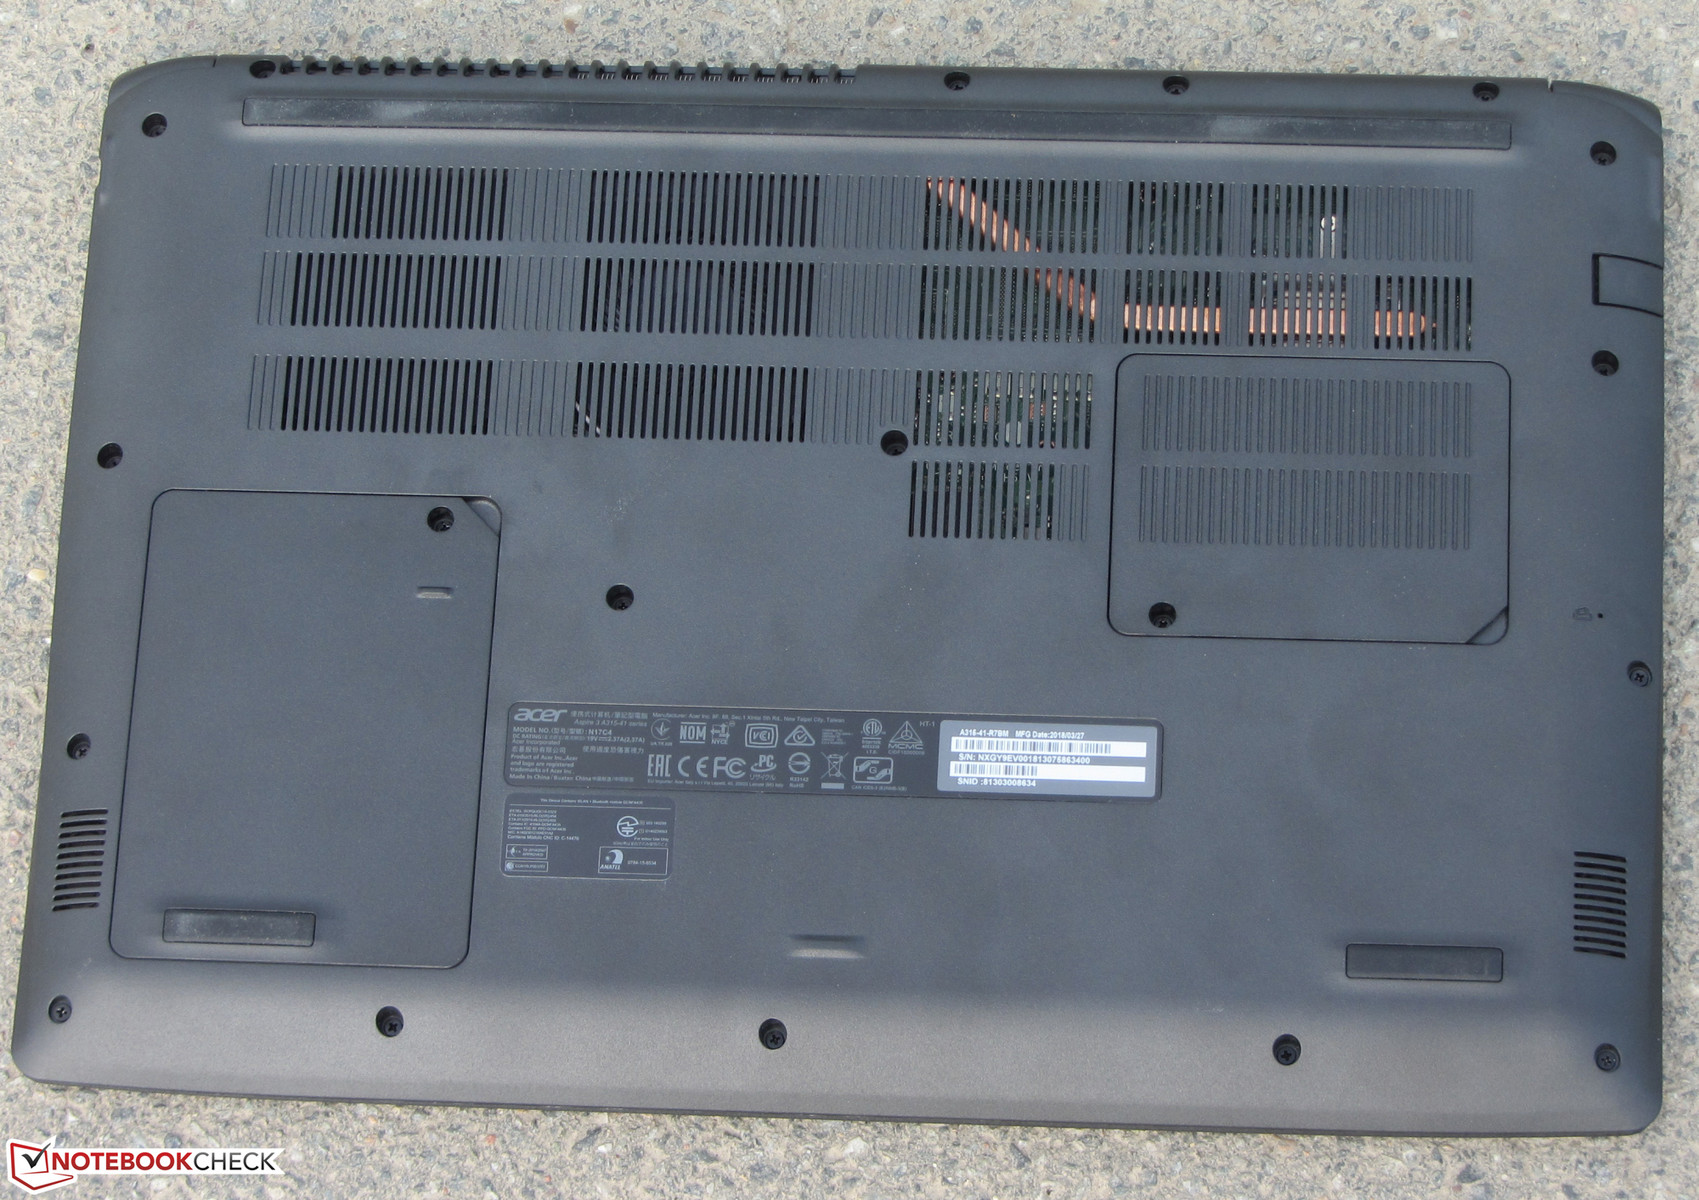
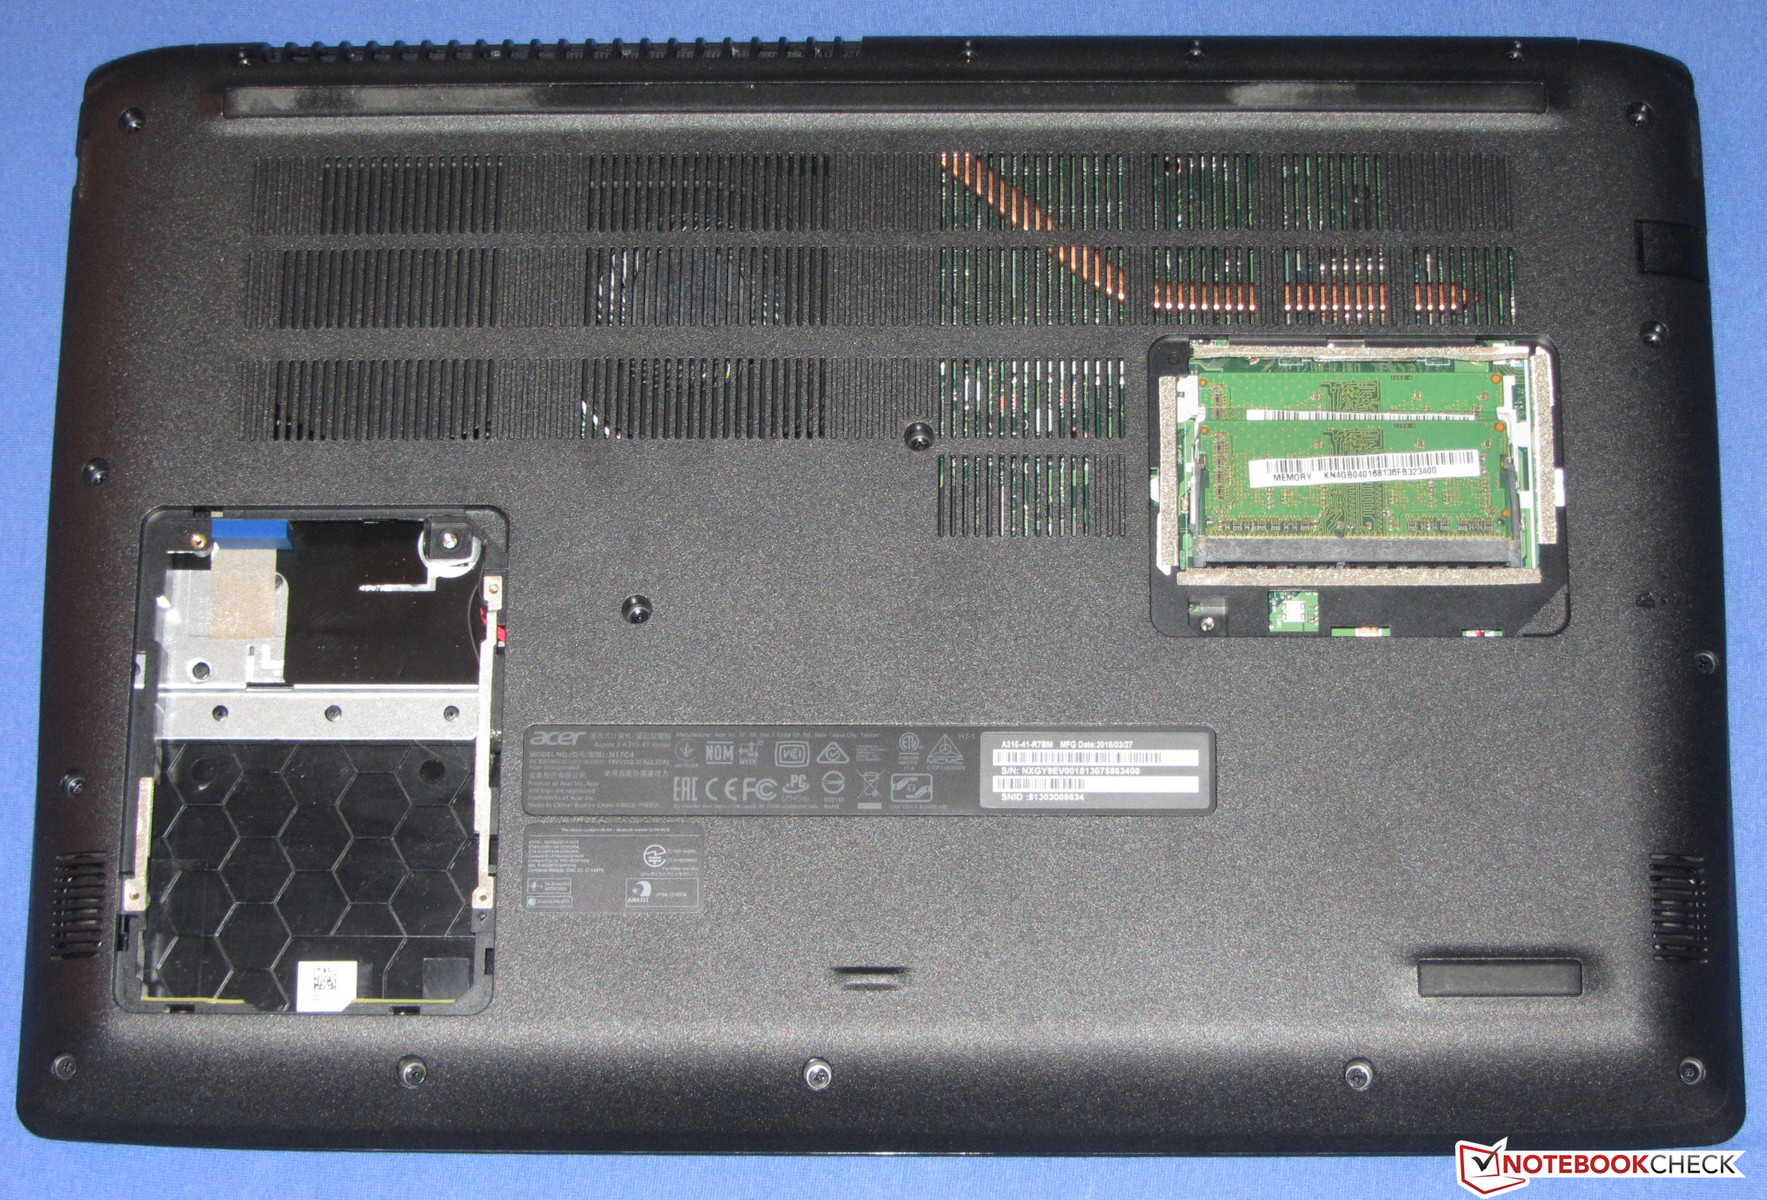
The Aspire 3 offers two maintenance hatches. The small hatch enables access to the RAM. The large hatch allows access to the 2.5-inch drive bay. However, this drive bay offers neither an installation frame for an HDD nor a SATA connector.
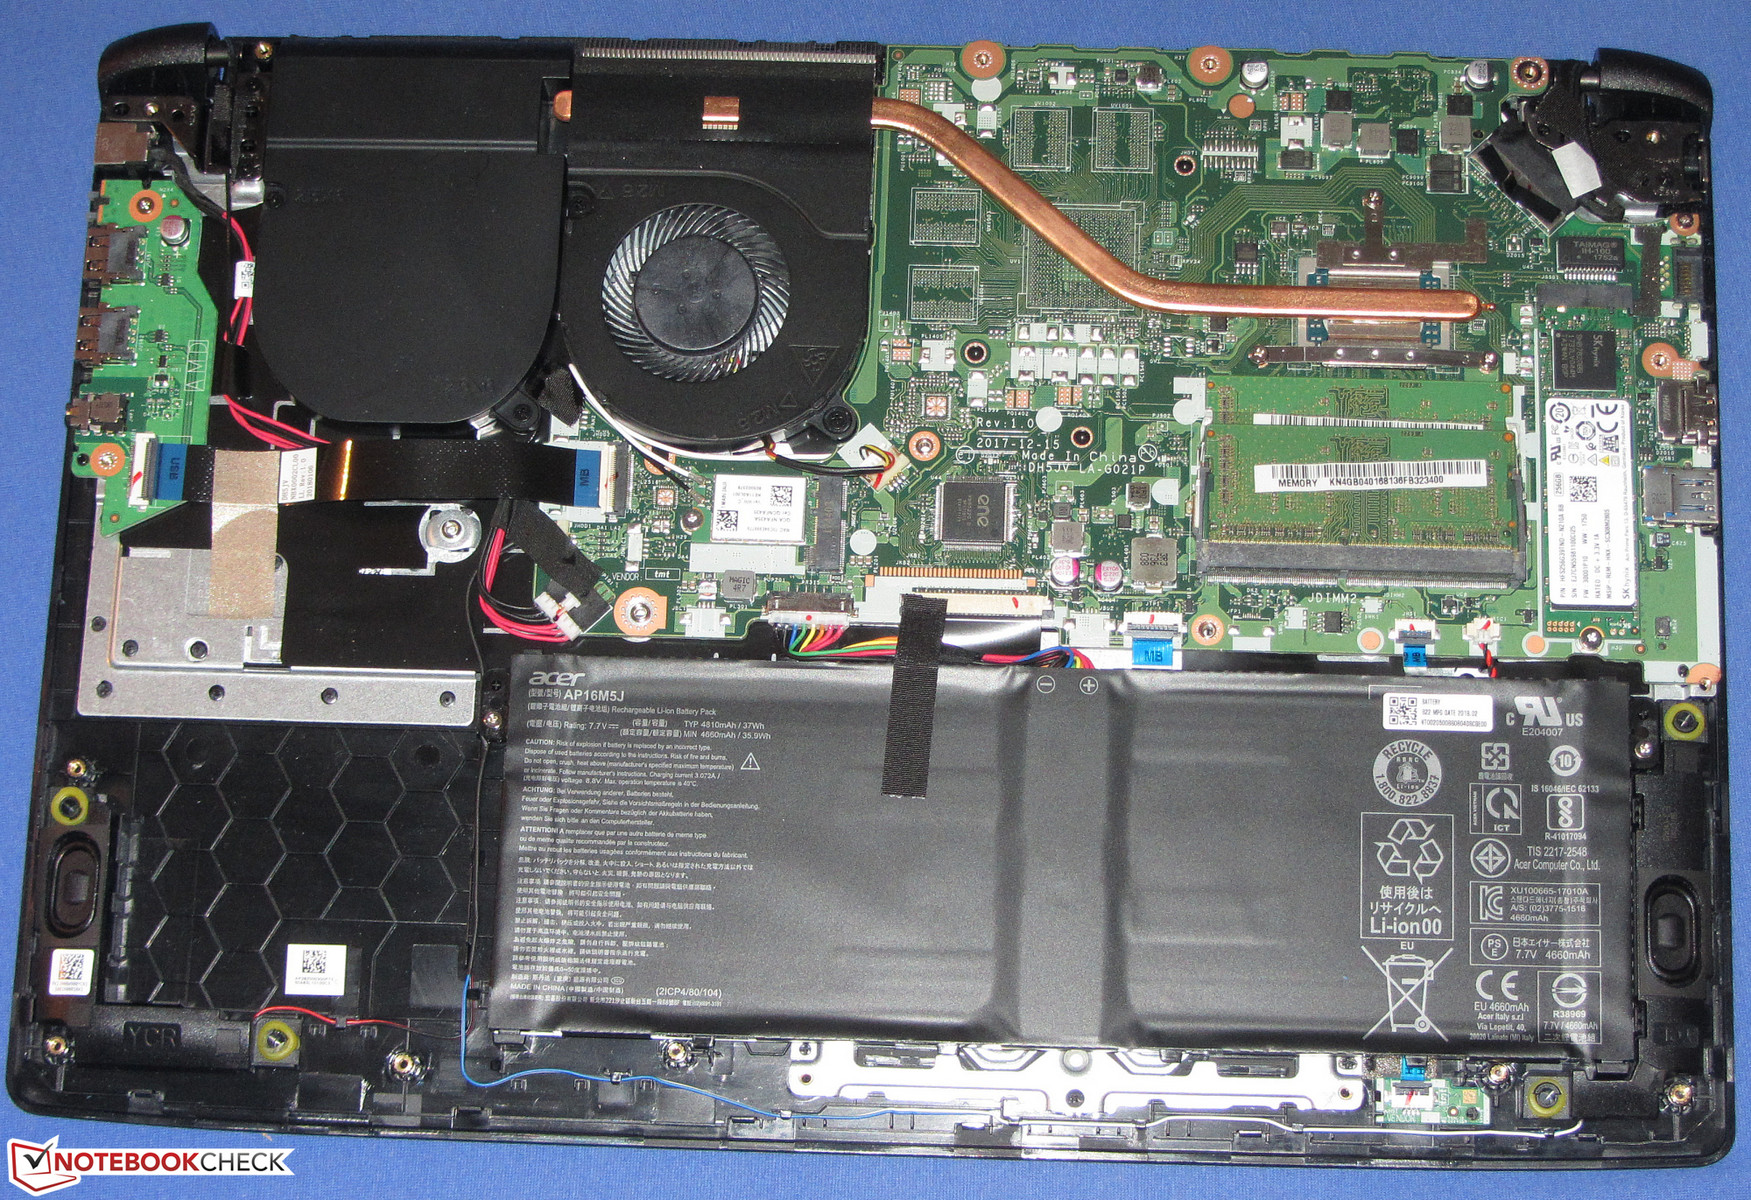
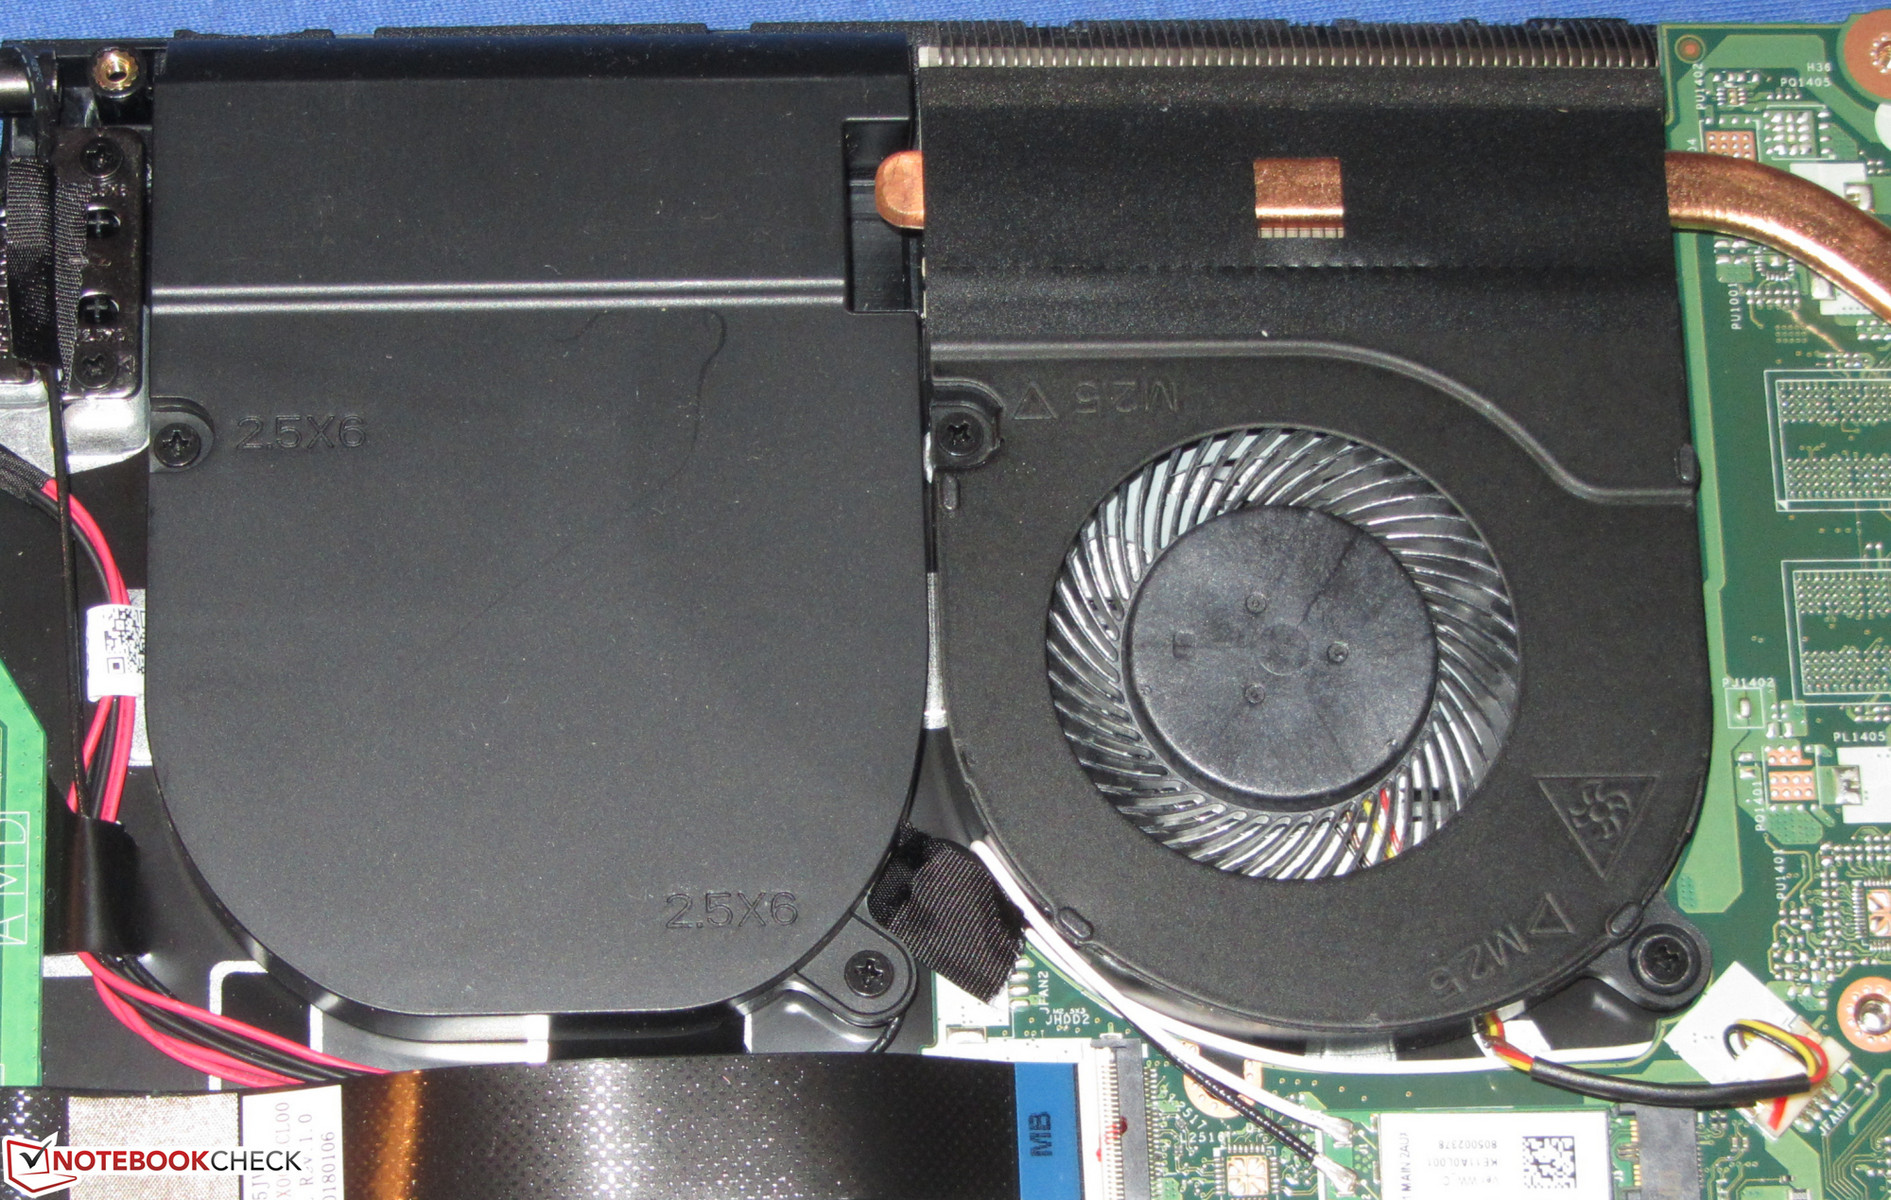
To reach the rest of the hardware you will have to remove the bottom cover. For this, you will have to first remove both maintenance covers. Then you will need to undo all the screws on the underside. Now the bottom cover can be removed with the help of a spatula or a (plastic) putty knife.
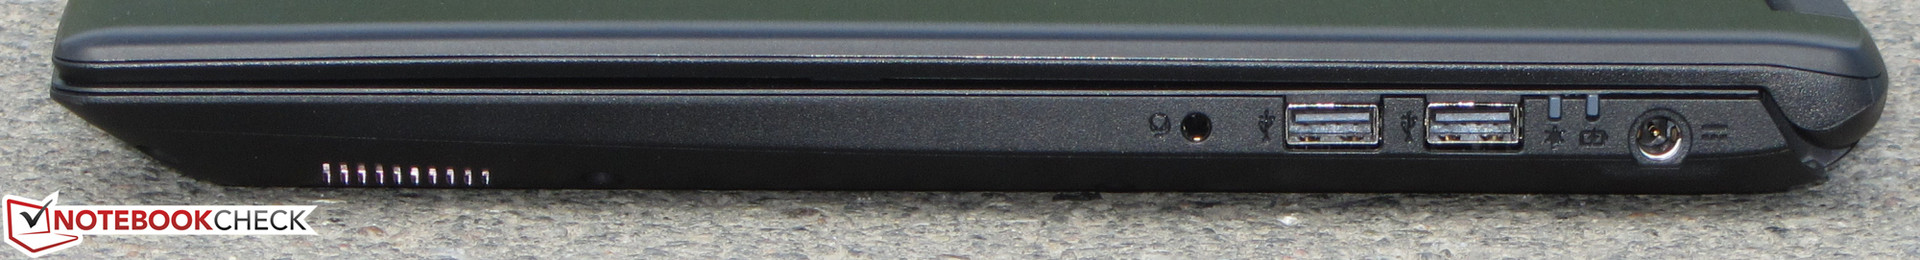
The A315-41 has the same selection of ports as its siblings. Acer provides the notebook with three USB Type-A ports (one USB 3.1 Gen 1 port, two USB 2.0 ports). The laptop does not offer any USB Type-C ports. An external monitor can be connected via HDMI. The SD card reader belongs to the faster specimens of its kind. When copying large chunks of data, a maximum transfer speed of 75.9 MB/s was achieved. The transfer of 250 JPG image files was completed with a speed of 86.2 MB/s. We test the SD card reader with the help of a reference SD card (Toshiba Exceria Pro SDXC 64 GB UHS-II).
The Aspire 3 comes equipped with a Wi-Fi module from Qualcomm (QCA9377). Besides the Wi-Fi standards 802.11 a/b/g/n, it also supports the fast Wireless-AC standard. The data transfer speeds that we measured under the optimal conditions (no other Wi-Fi-enabled devices in close proximity, a short distance between the notebook and the server PC) are quite average, because the device features a 1x1 MIMO antenna.


Connectivity

| SD Card Reader | |
| average JPG Copy Test (av. of 3 runs) | |
| Acer Aspire 3 A315-51-55E4 (Toshiba Exceria Pro SDXC 64 GB UHS-II) | |
| Acer Aspire 3 A315-41-R7BM (Toshiba Exceria Pro SDXC 64 GB UHS-II) | |
| Average of class Office (8 - 82.7, n=49, last 2 years) | |
| Acer Extensa 2540-580K (Toshiba Exceria Pro SDXC 64 GB UHS-II) | |
| HP 250 G6 2UB93ES (Toshiba Exceria Pro SDXC 64 GB UHS-II) | |
| Lenovo V330-15IKB (Toshiba Exceria Pro SDXC 64 GB UHS-II) | |
| maximum AS SSD Seq Read Test (1GB) | |
| Acer Aspire 3 A315-41-R7BM (Toshiba Exceria Pro SDXC 64 GB UHS-II) | |
| Acer Aspire 3 A315-51-55E4 (Toshiba Exceria Pro SDXC 64 GB UHS-II) | |
| Average of class Office (25 - 90.5, n=43, last 2 years) | |
| HP 250 G6 2UB93ES (Toshiba Exceria Pro SDXC 64 GB UHS-II) | |
| Acer Extensa 2540-580K (Toshiba Exceria Pro SDXC 64 GB UHS-II) | |
| Lenovo V330-15IKB (Toshiba Exceria Pro SDXC 64 GB UHS-II) | |
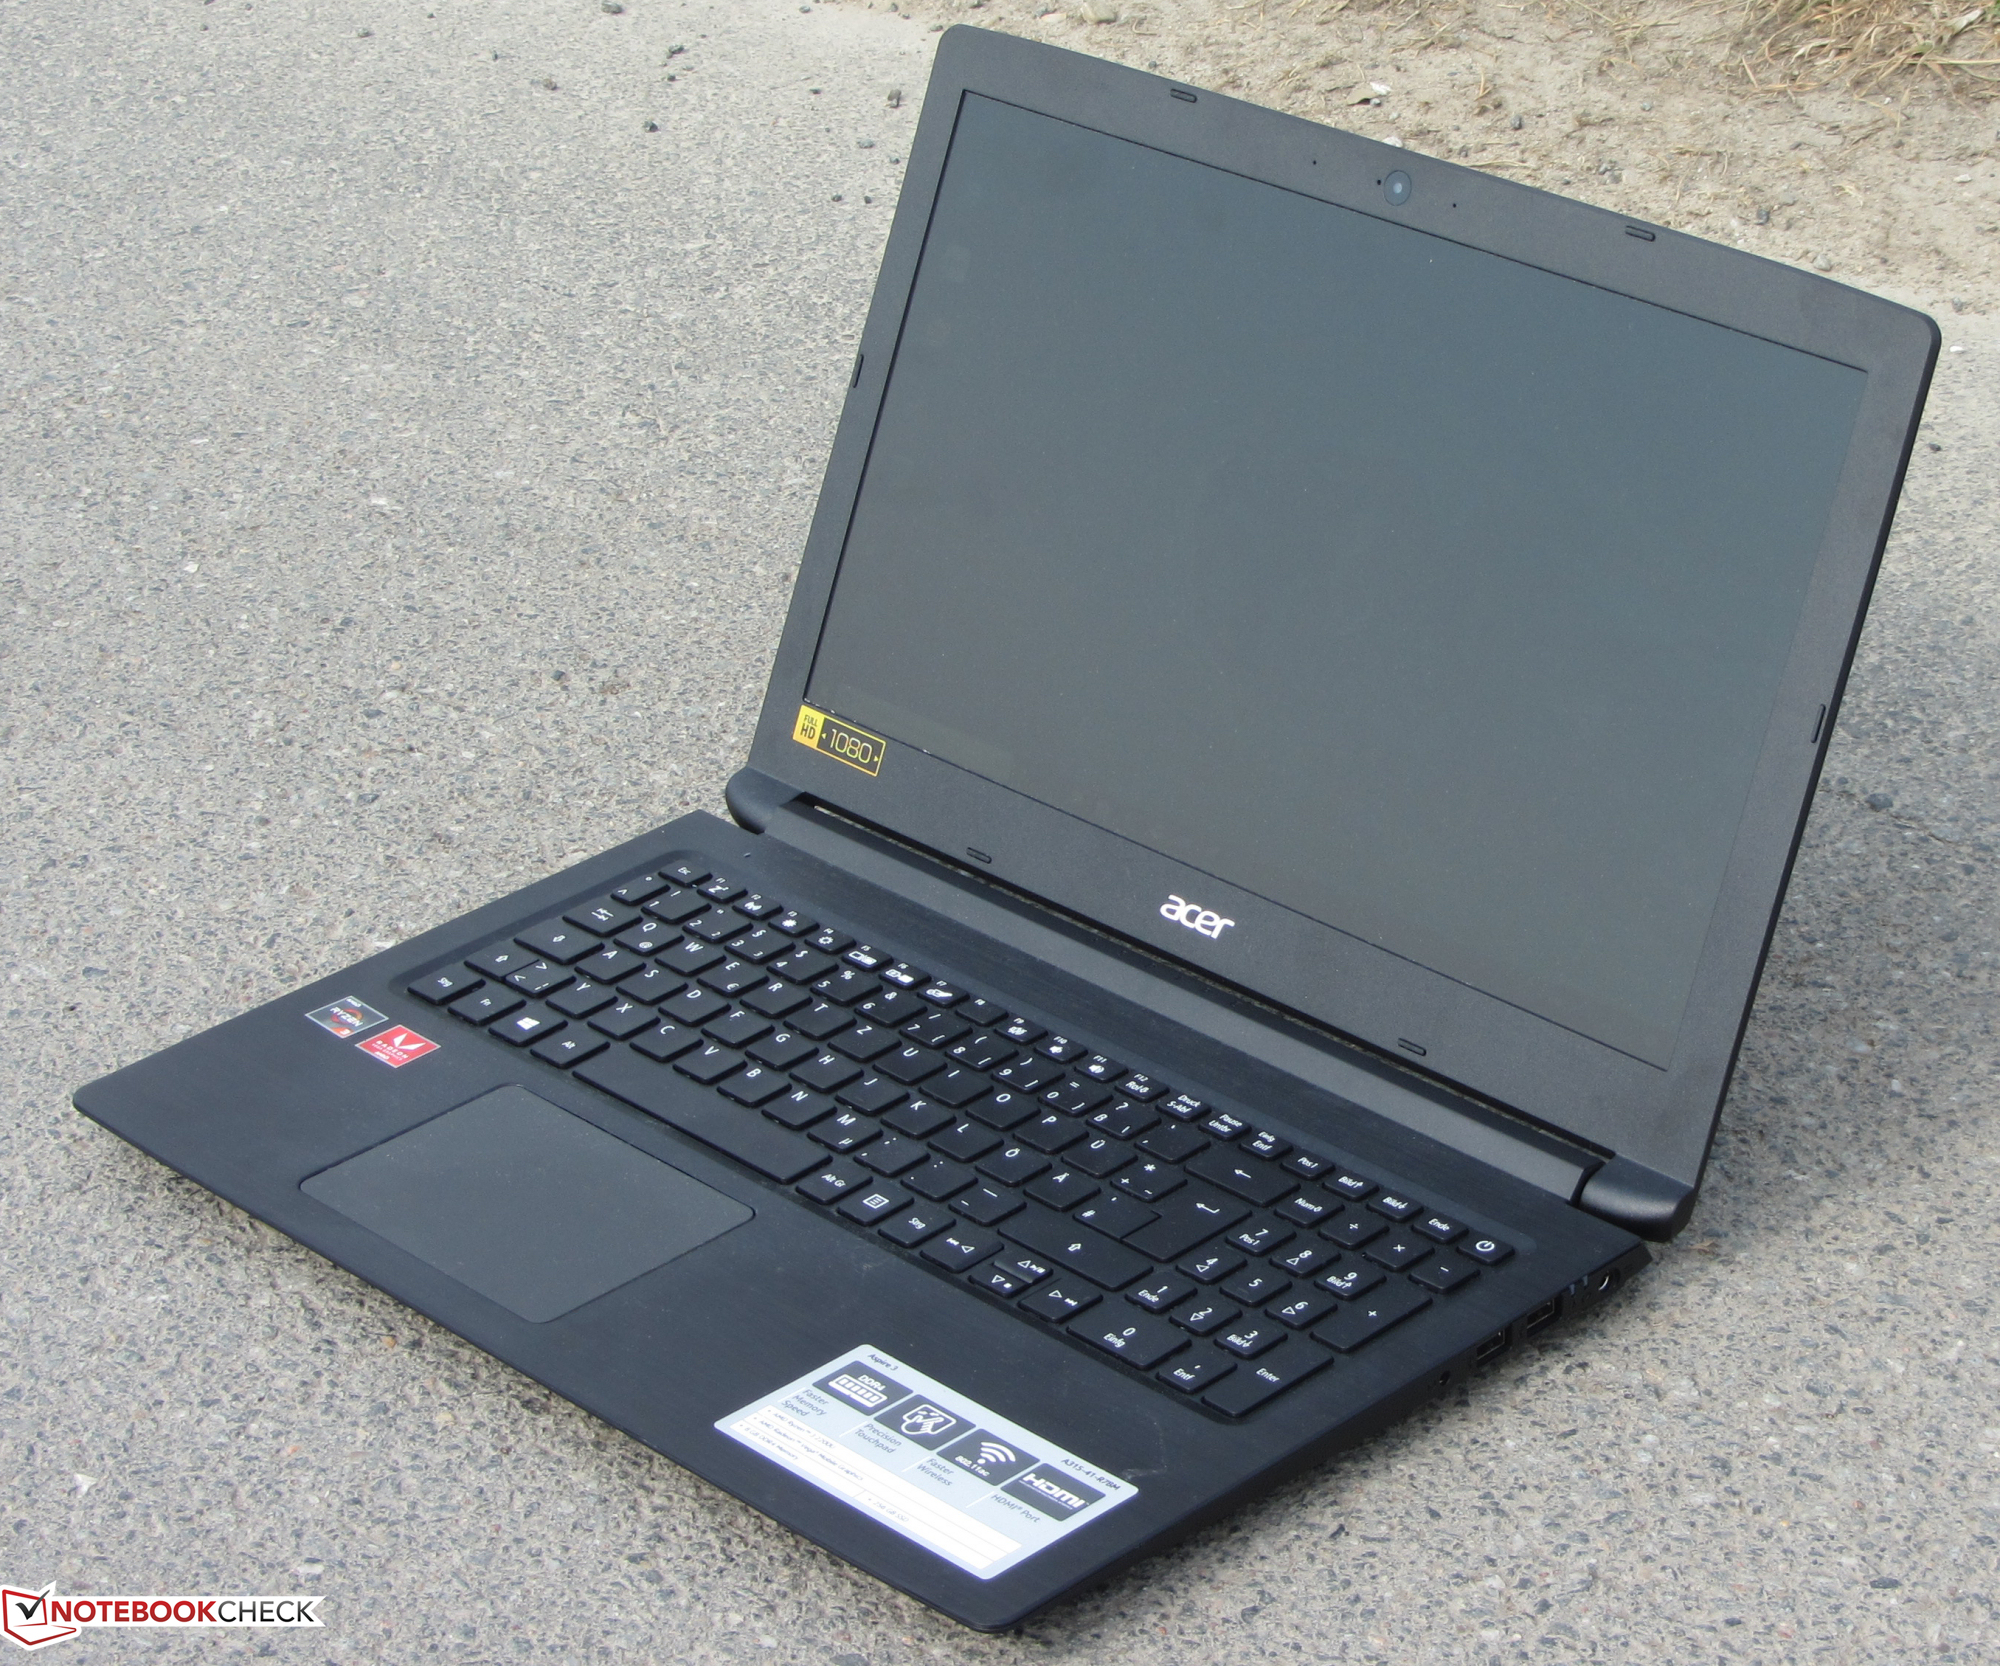
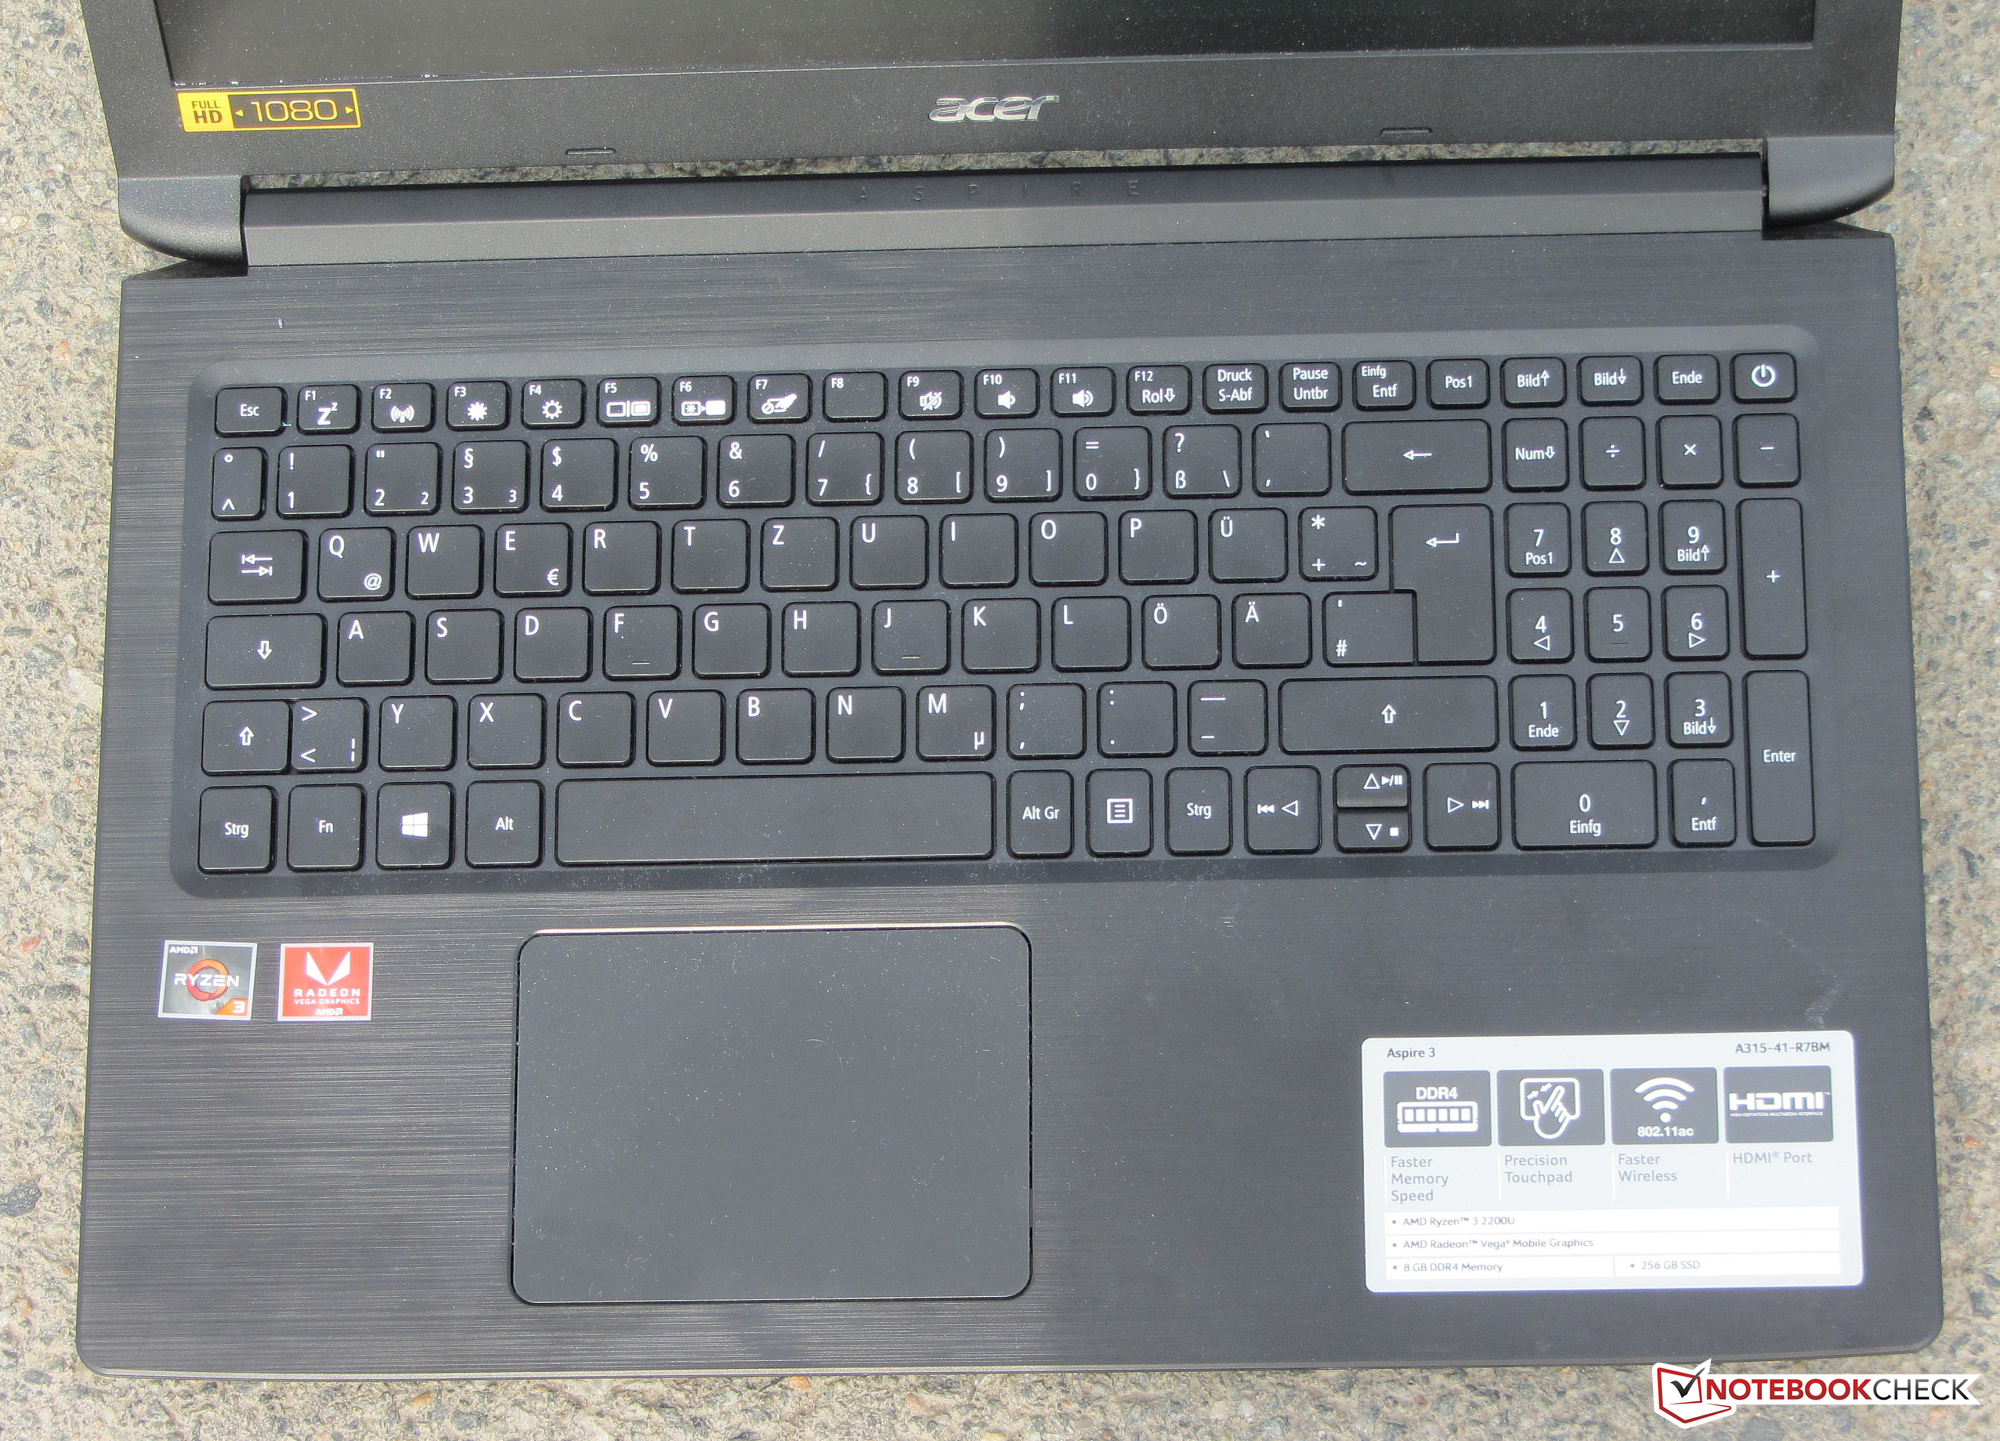
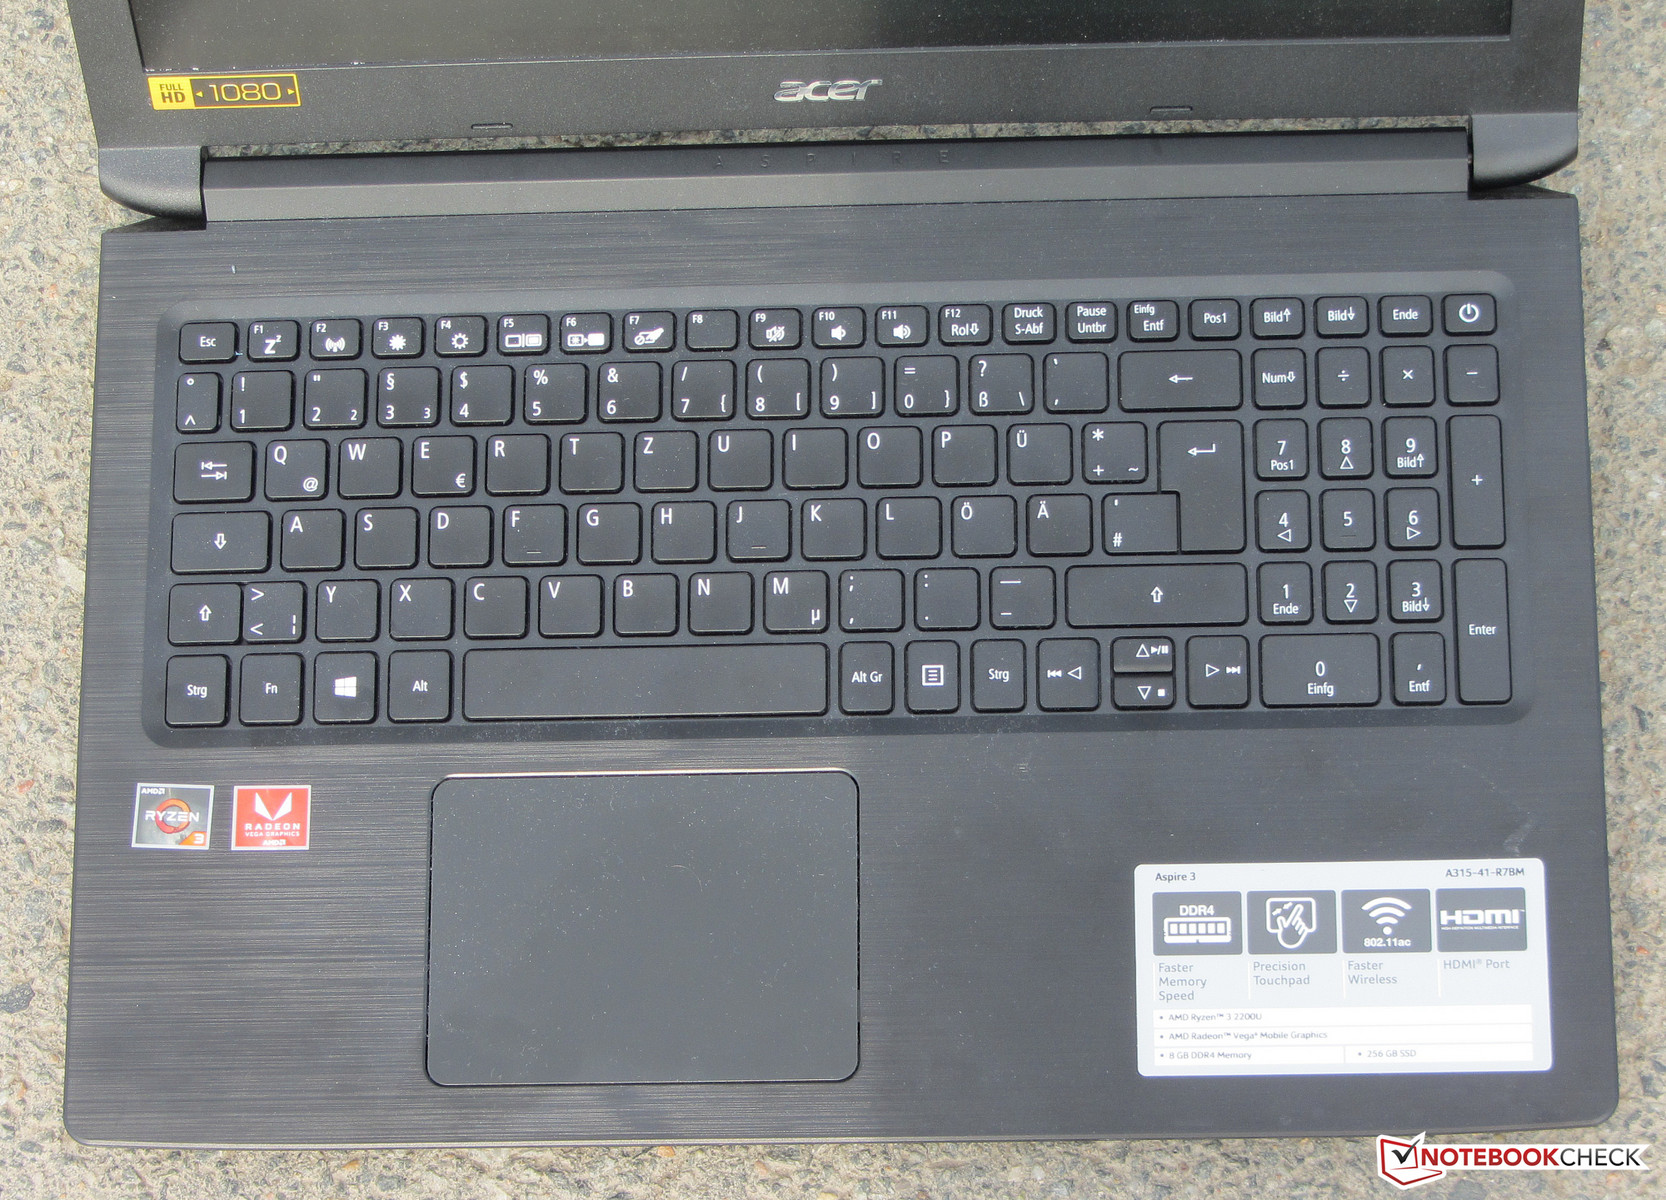
Input Devices - The Aspire 3 does not have a keyboard backlight
The Aspire 3 comes with an unlit chiclet-style keyboard complete with a number pad. The keys have a slightly rough surface. They have a short travel distance and a clear actuation point. The keys are a little too mushy for our taste. During typing, the center of the keyboard exhibits some mild flex. However, this does not prove to be annoying. All in all, Acer delivers an “okay” keyboard that is well suited for regular typing.
The multitouch-enabled ClickPad occupies an area of some 10.5 x 7.8 cm (4.1 x 3 in). Therefore, there is enough space for the use of gesture controls. The smooth surface of the pad makes finger-gliding easy. The corners of the ClickPad register inputs well. The bottom of the pad, where the left and the right mouse buttons are usually located, exhibits a long travel distance and a vague actuation point.
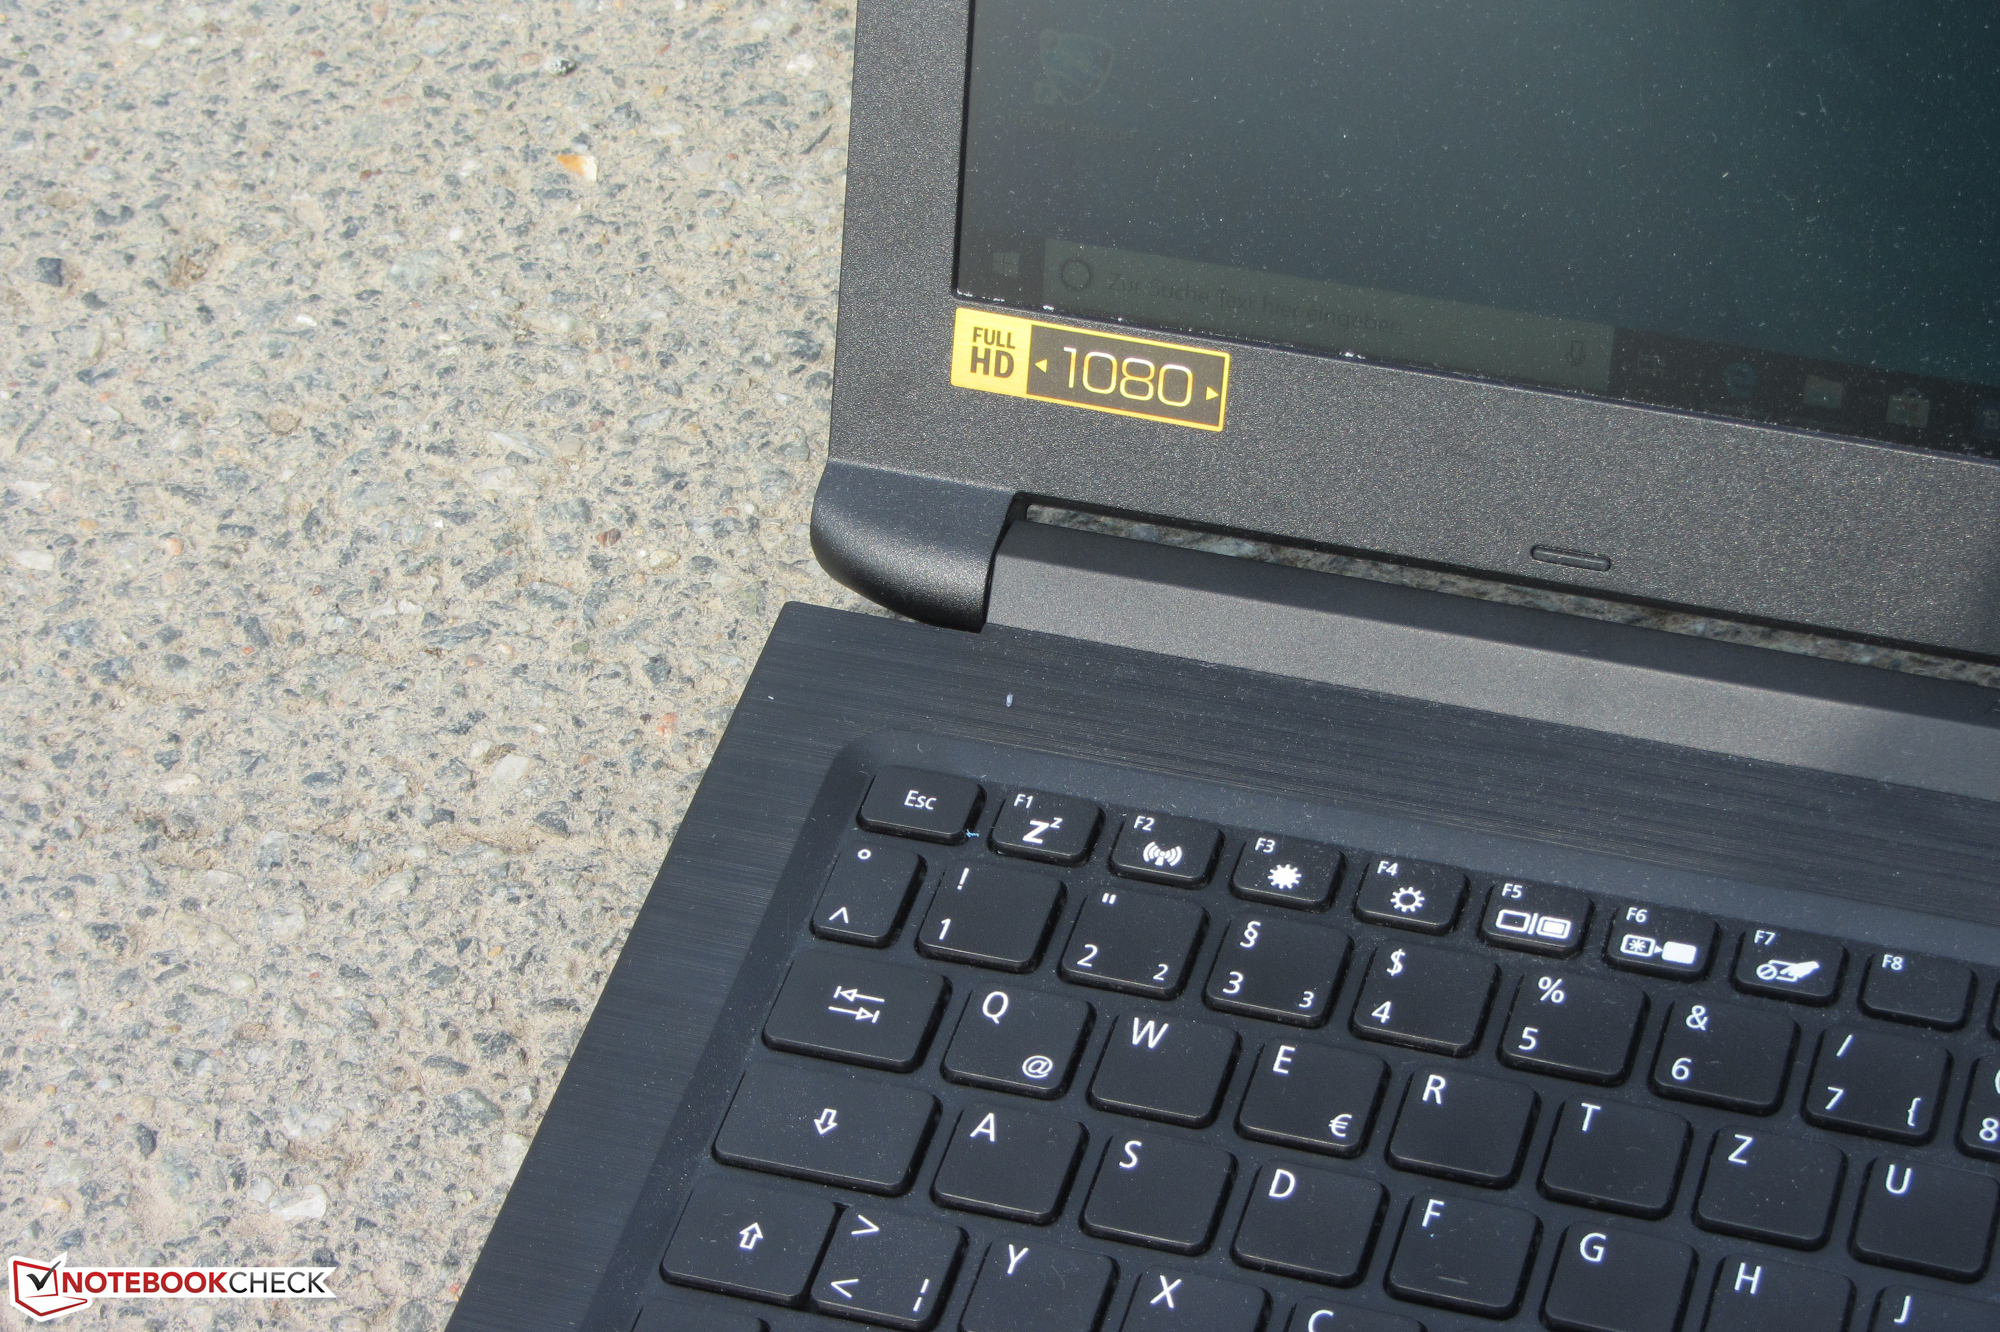
Display - The dim display with poor viewing angles is not going to win any praise
The matte 15.6-inch display of the Aspire 3 has a native resolution of 1920x1080. Both the contrast ratio (544:1) and the brightness (211 cd/m²) are way too low.
Unfortunately, at 10% brightness and below, the screen exhibits PWM flickering with a frequency of 25000 Hz. However, such a high frequency should not lead to headaches and/or eye-strain amongst susceptible individuals.
| |||||||||||||||||||||||||
Brightness Distribution: 83 %
Center on Battery: 236 cd/m²
Contrast: 544:1 (Black: 0.43 cd/m²)
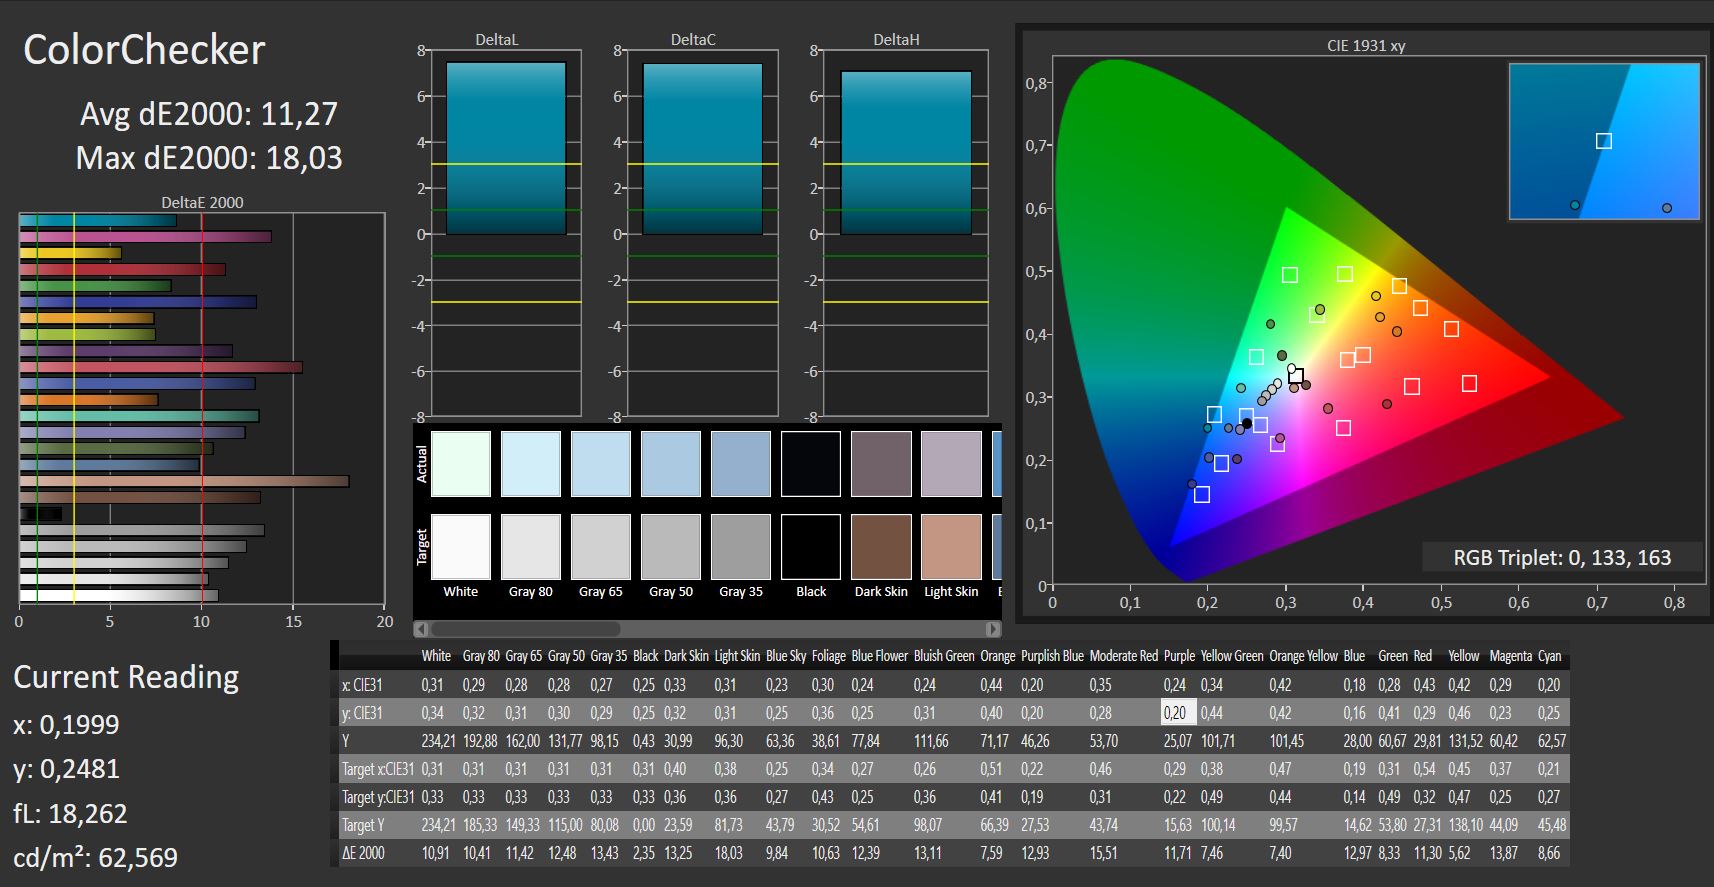
ΔE Color 11.27 | 0.5-29.43 Ø5
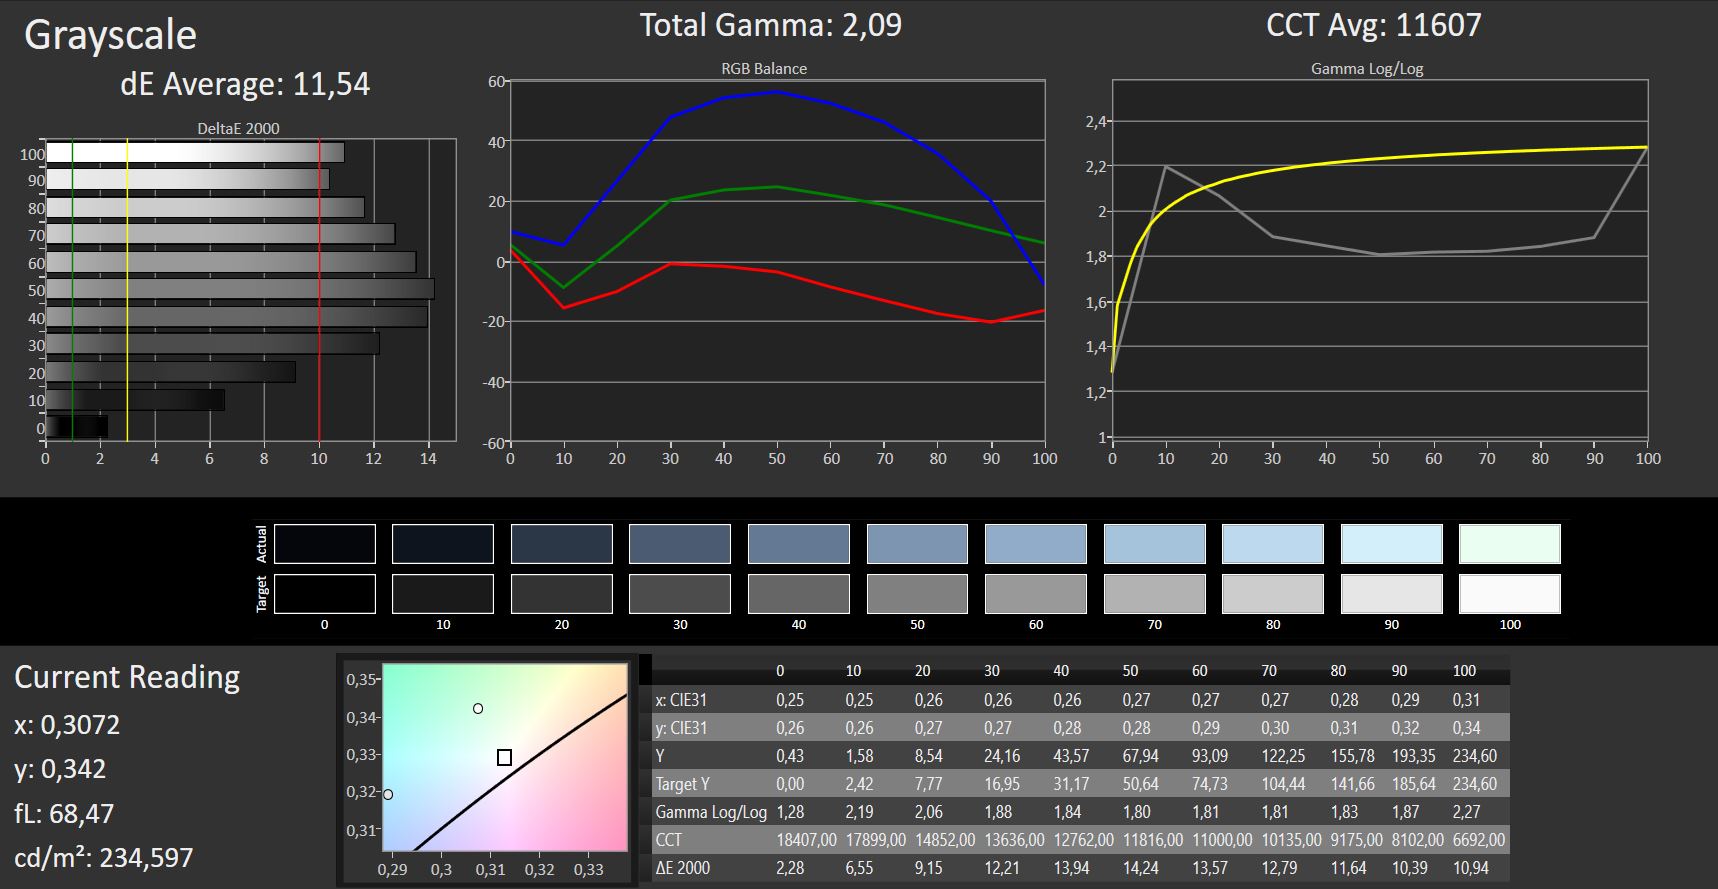
ΔE Greyscale 11.54 | 0.57-98 Ø5.3
60% sRGB (Argyll 1.6.3 3D)
38% AdobeRGB 1998 (Argyll 1.6.3 3D)
41.47% AdobeRGB 1998 (Argyll 2.2.0 3D)
59.7% sRGB (Argyll 2.2.0 3D)
40.09% Display P3 (Argyll 2.2.0 3D)
Gamma: 2.09
| Acer Aspire 3 A315-41-R7BM TN LED, 1920x1080, 15.60 | Acer Aspire 3 A315-51-55E4 TN LED, 1920x1080, 15.60 | HP 250 G6 2UB93ES TN LED, 1920x1080, 15.60 | Acer Extensa 2540-580K TN LED, 1920x1080, 15.60 | Lenovo V330-15IKB TN LED, 1920x1080, 15.60 | |
|---|---|---|---|---|---|
| Display | -10% | -2% | -6% | -2% | |
| Display P3 Coverage | 40.09 | 35.97 -10% | 39.11 -2% | 37.59 -6% | 39.32 -2% |
| sRGB Coverage | 59.7 | 54.1 -9% | 58.8 -2% | 56.5 -5% | 58.8 -2% |
| AdobeRGB 1998 Coverage | 41.47 | 37.17 -10% | 40.41 -3% | 38.84 -6% | 40.65 -2% |
| Response Times | 7% | -26% | -14% | -26% | |
| Response Time Grey 50% / Grey 80% * | 44 ? | 44 ? -0% | 42 ? 5% | 41 ? 7% | 40 ? 9% |
| Response Time Black / White * | 14 ? | 12 ? 14% | 13 ? 7% | 22 ? -57% | 26 ? -86% |
| PWM Frequency | 25000 ? | 2500 ? -90% | 27000 ? 8% | 25000 0% | |
| Screen | 20% | -6% | -6% | -5% | |
| Brightness middle | 234 | 241 3% | 184 -21% | 215 -8% | 230 -2% |
| Brightness | 211 | 229 9% | 178 -16% | 217 3% | 200 -5% |
| Brightness Distribution | 83 | 87 5% | 80 -4% | 92 11% | 77 -7% |
| Black Level * | 0.43 | 0.46 -7% | 0.38 12% | 0.68 -58% | 0.45 -5% |
| Contrast | 544 | 524 -4% | 484 -11% | 316 -42% | 511 -6% |
| Colorchecker dE 2000 * | 11.27 | 3.4 70% | 11.29 -0% | 9.14 19% | 11.84 -5% |
| Colorchecker dE 2000 max. * | 18.03 | 7.61 58% | 19.48 -8% | 15.46 14% | 20.47 -14% |
| Greyscale dE 2000 * | 11.54 | 1.7 85% | 12.43 -8% | 10.08 13% | 12.22 -6% |
| Gamma | 2.09 105% | 2.36 93% | 2.34 94% | 2.07 106% | 2.12 104% |
| CCT | 11607 56% | 6750 96% | 13823 47% | 10158 64% | 13073 50% |
| Color Space (Percent of AdobeRGB 1998) | 38 | 34 -11% | 37 -3% | 36 -5% | 38 0% |
| Color Space (Percent of sRGB) | 60 | 54 -10% | 59 -2% | 56 -7% | 59 -2% |
| Total Average (Program / Settings) | 6% /
12% | -11% /
-9% | -9% /
-7% | -11% /
-8% |
* ... smaller is better
Screen Flickering / PWM (Pulse-Width Modulation)
| Screen flickering / PWM detected | 25000 Hz | ≤ 10 % brightness setting | 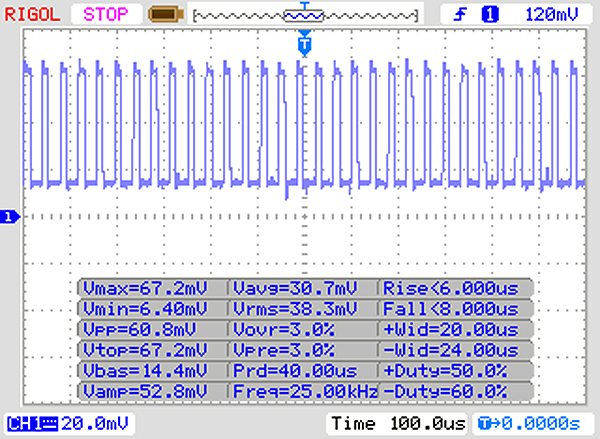 |
The display backlight flickers at 25000 Hz (worst case, e.g., utilizing PWM) Flickering detected at a brightness setting of 10 % and below. There should be no flickering or PWM above this brightness setting. The frequency of 25000 Hz is quite high, so most users sensitive to PWM should not notice any flickering. In comparison: 53 % of all tested devices do not use PWM to dim the display. If PWM was detected, an average of 17900 (minimum: 5 - maximum: 3846000) Hz was measured. | |||
The display does not shine in terms of color accuracy. Straight out of the box, we measured a DeltaE 2000 color deviation of 11.27 (DeltaE less than 3 is the optimal value). Moreover, the display suffers from a noticeable bluish cast. The display can cover only 56% of the sRGB color space and 36% of the Adobe RGB color space.
By means of our color profile, the color reproduction can be improved. However, before downloading it, you should make sure that your laptop has the same display model (manufacturer + model number) as our review device, because otherwise our color profile can result in worse color reproduction. Displays from different manufacturers can often be found within notebooks from the same model range.
Display Response Times
| ↔ Response Time Black to White | ||
|---|---|---|
| 14 ms ... rise ↗ and fall ↘ combined | ↗ 10 ms rise | 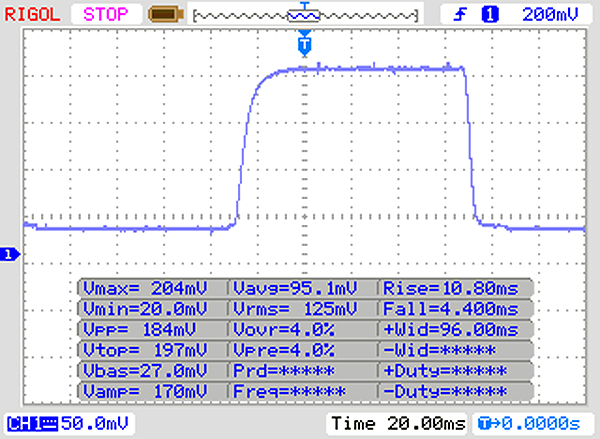 |
| ↘ 4 ms fall | ||
| The screen shows good response rates in our tests, but may be too slow for competitive gamers. In comparison, all tested devices range from 0.1 (minimum) to 240 (maximum) ms. » 29 % of all devices are better. This means that the measured response time is better than the average of all tested devices (21.5 ms). | ||
| ↔ Response Time 50% Grey to 80% Grey | ||
| 44 ms ... rise ↗ and fall ↘ combined | ↗ 23 ms rise | 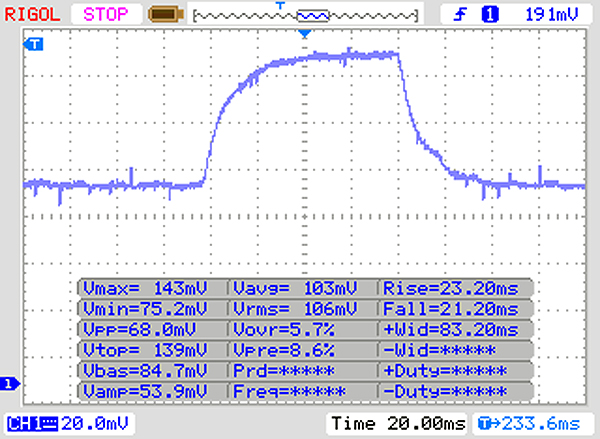 |
| ↘ 21 ms fall | ||
| The screen shows slow response rates in our tests and will be unsatisfactory for gamers. In comparison, all tested devices range from 0.2 (minimum) to 636 (maximum) ms. » 69 % of all devices are better. This means that the measured response time is worse than the average of all tested devices (33.7 ms). | ||
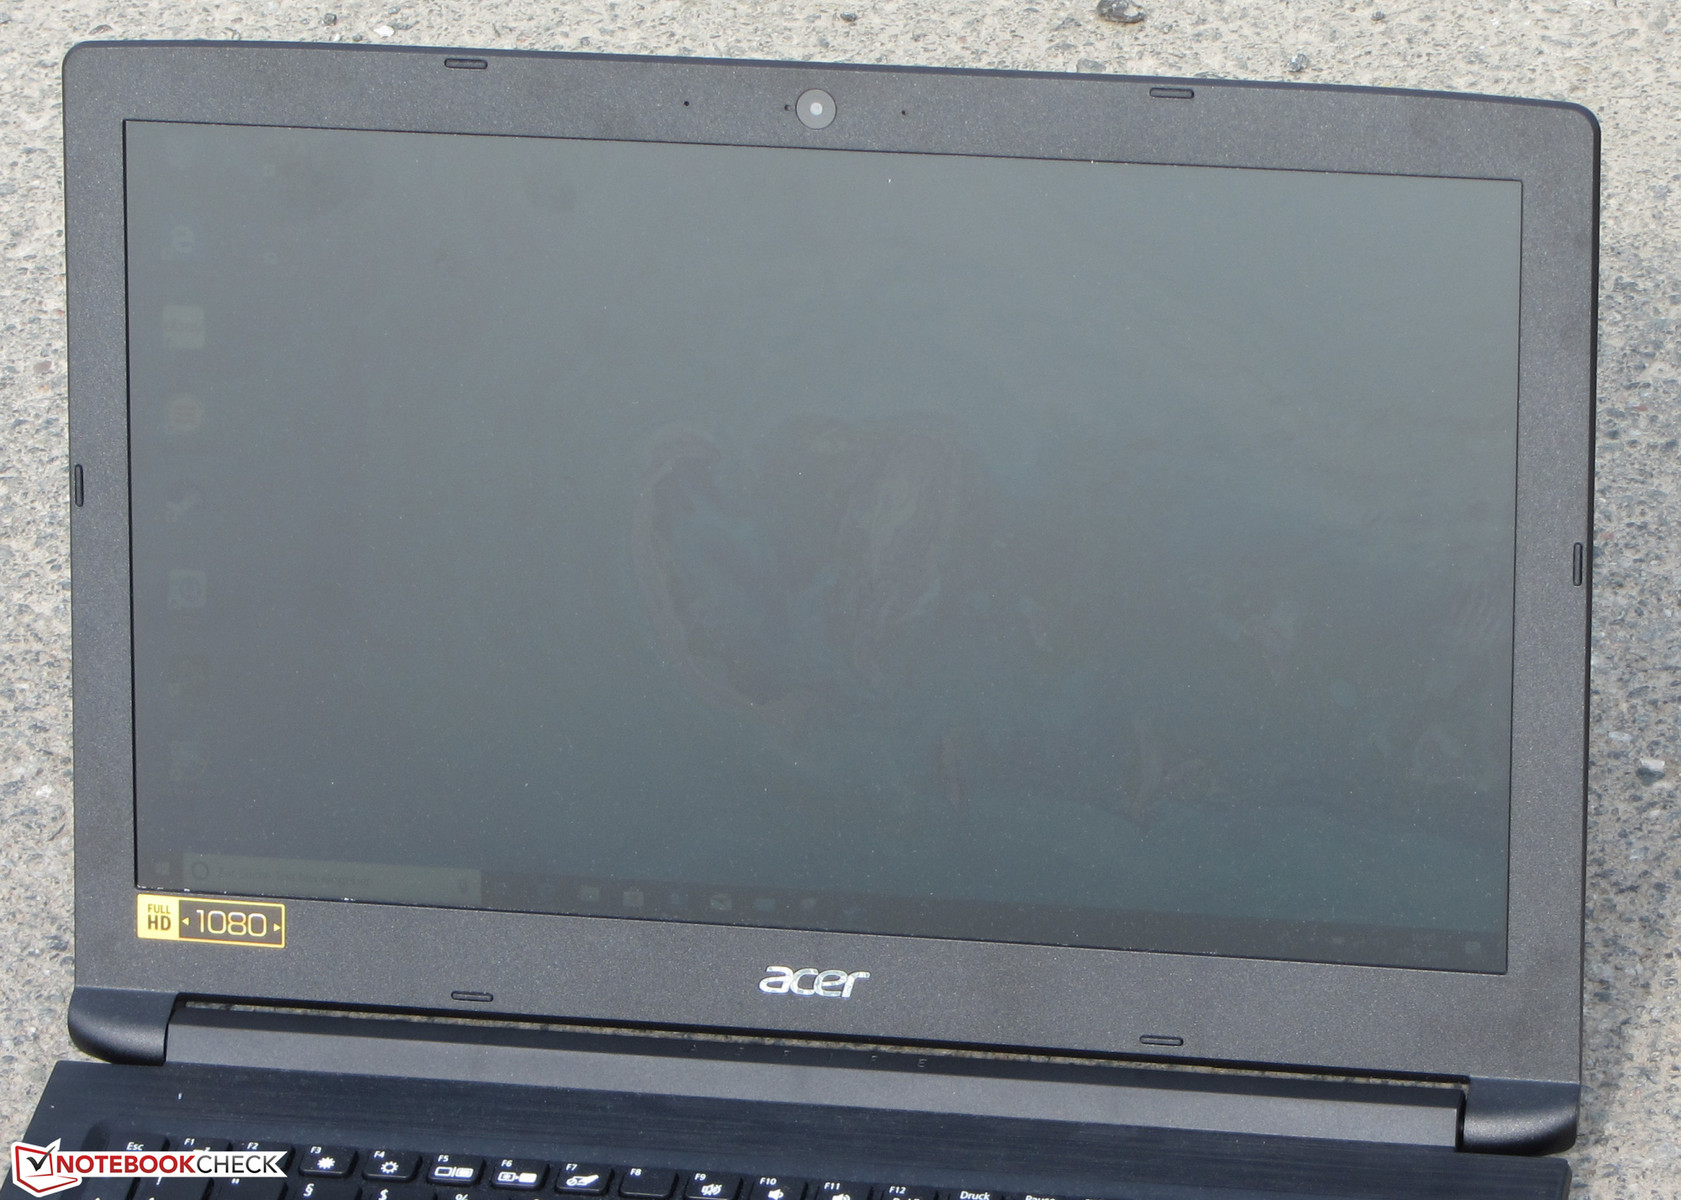
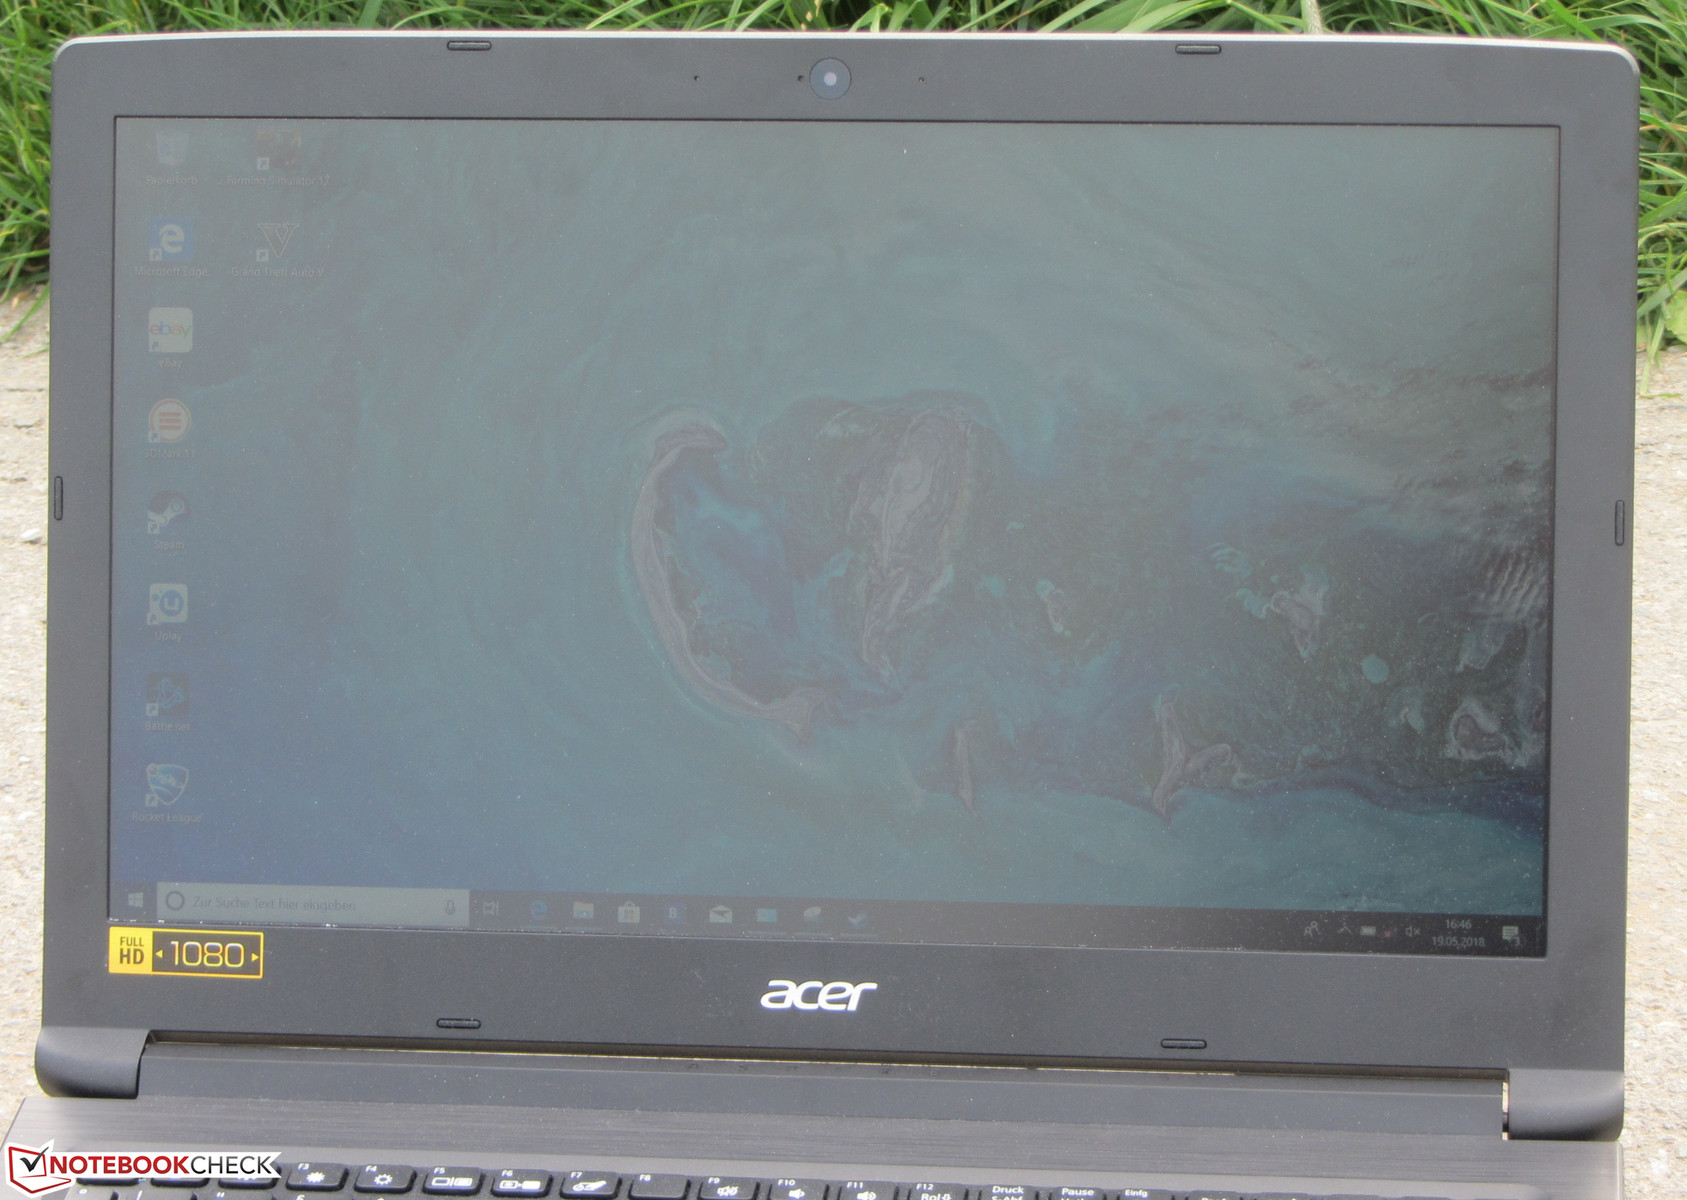
Acer has equipped the laptop with a TN panel offering poor viewing angles. Consequently, the display is not legible from every position. Outdoors, the notebook can only be used in the shade.
Performance - the AMD APU gives Intel’s Kaby Lake processors a run for their money
With the Aspire 3 A315-41, Acer has a 15.6-inch office notebook in its product range. It offers more than enough performance for such usage scenarios as office work and Internet browsing. Our review device can be had for 600 Euros (~$702). Other hardware configurations are also available. The prices start at 400 Euros (~$468).

Processor
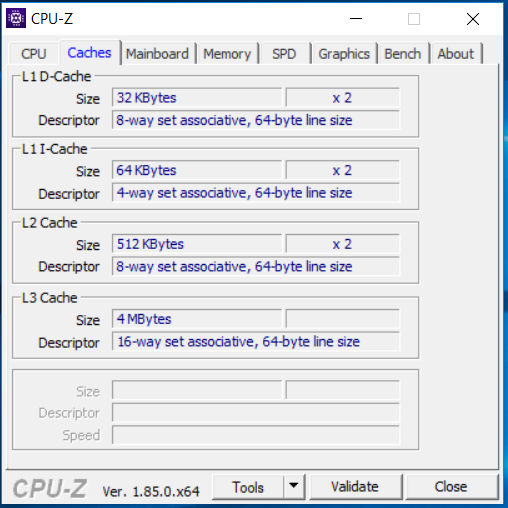
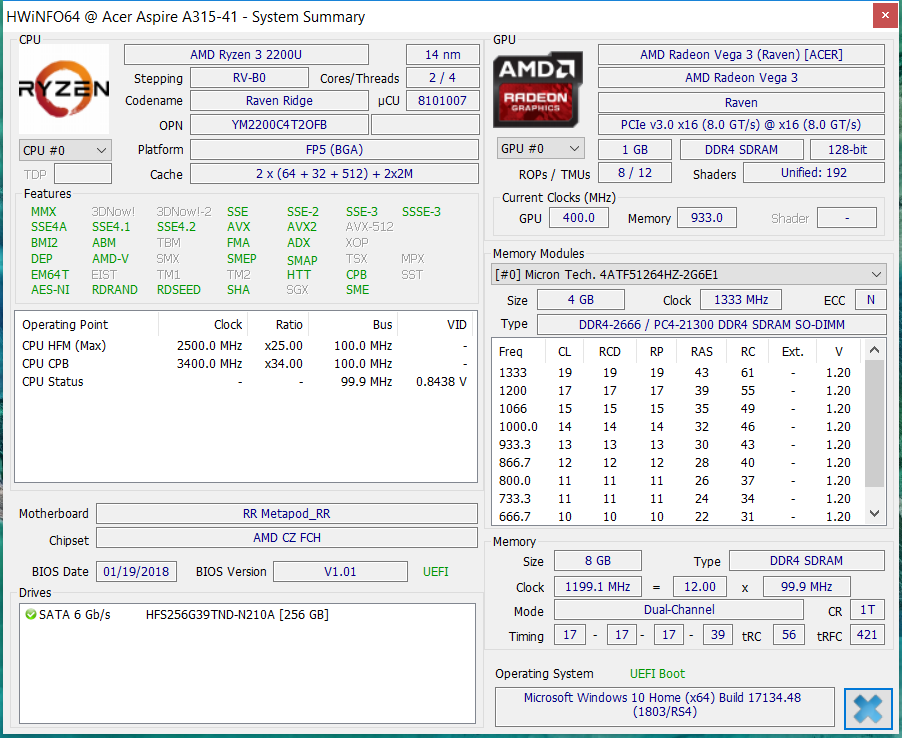
The Aspire 3 is powered by a Ryzen 3 2200U (Raven Ridge) APU from AMD. The AMD CPU has two cores and a base clock rate of 2.5 GHz. Thanks to AMD’s Turbo Core technology, the CPU’s clock rate can be boosted up to 3.4 GHz. The processor also supports Simultaneous Multithreading, which means that each core can process two threads at the same time.
In the multi-core Cinebench benchmarks, the CPU runs most of the time at 2.5 GHz when plugged in. From time to time, the clock rate gets boosted up to 3.4 GHz. In the single-core benchmarks, the processor operates at 1.6 to 3.4 GHz. When running on battery power, the CPU’s performance declines considerably. Here, the CPU runs consistently at 1.6 GHz.
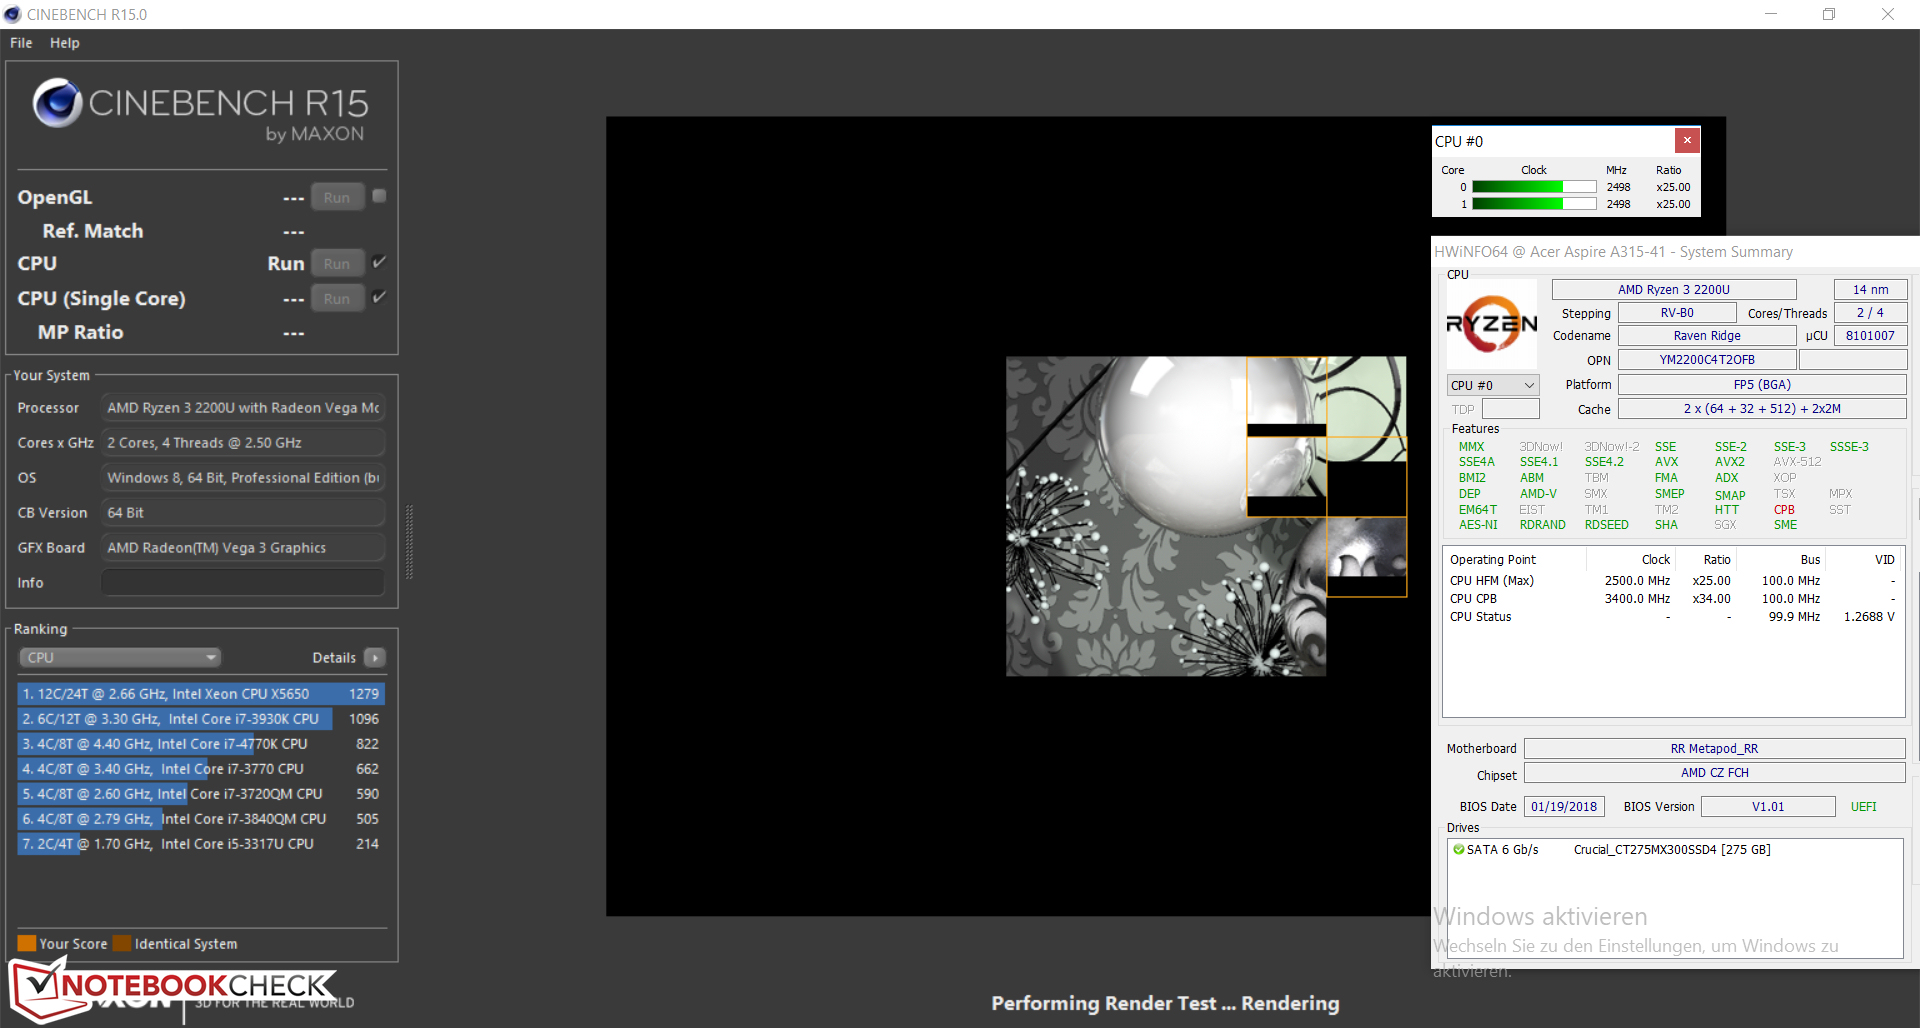
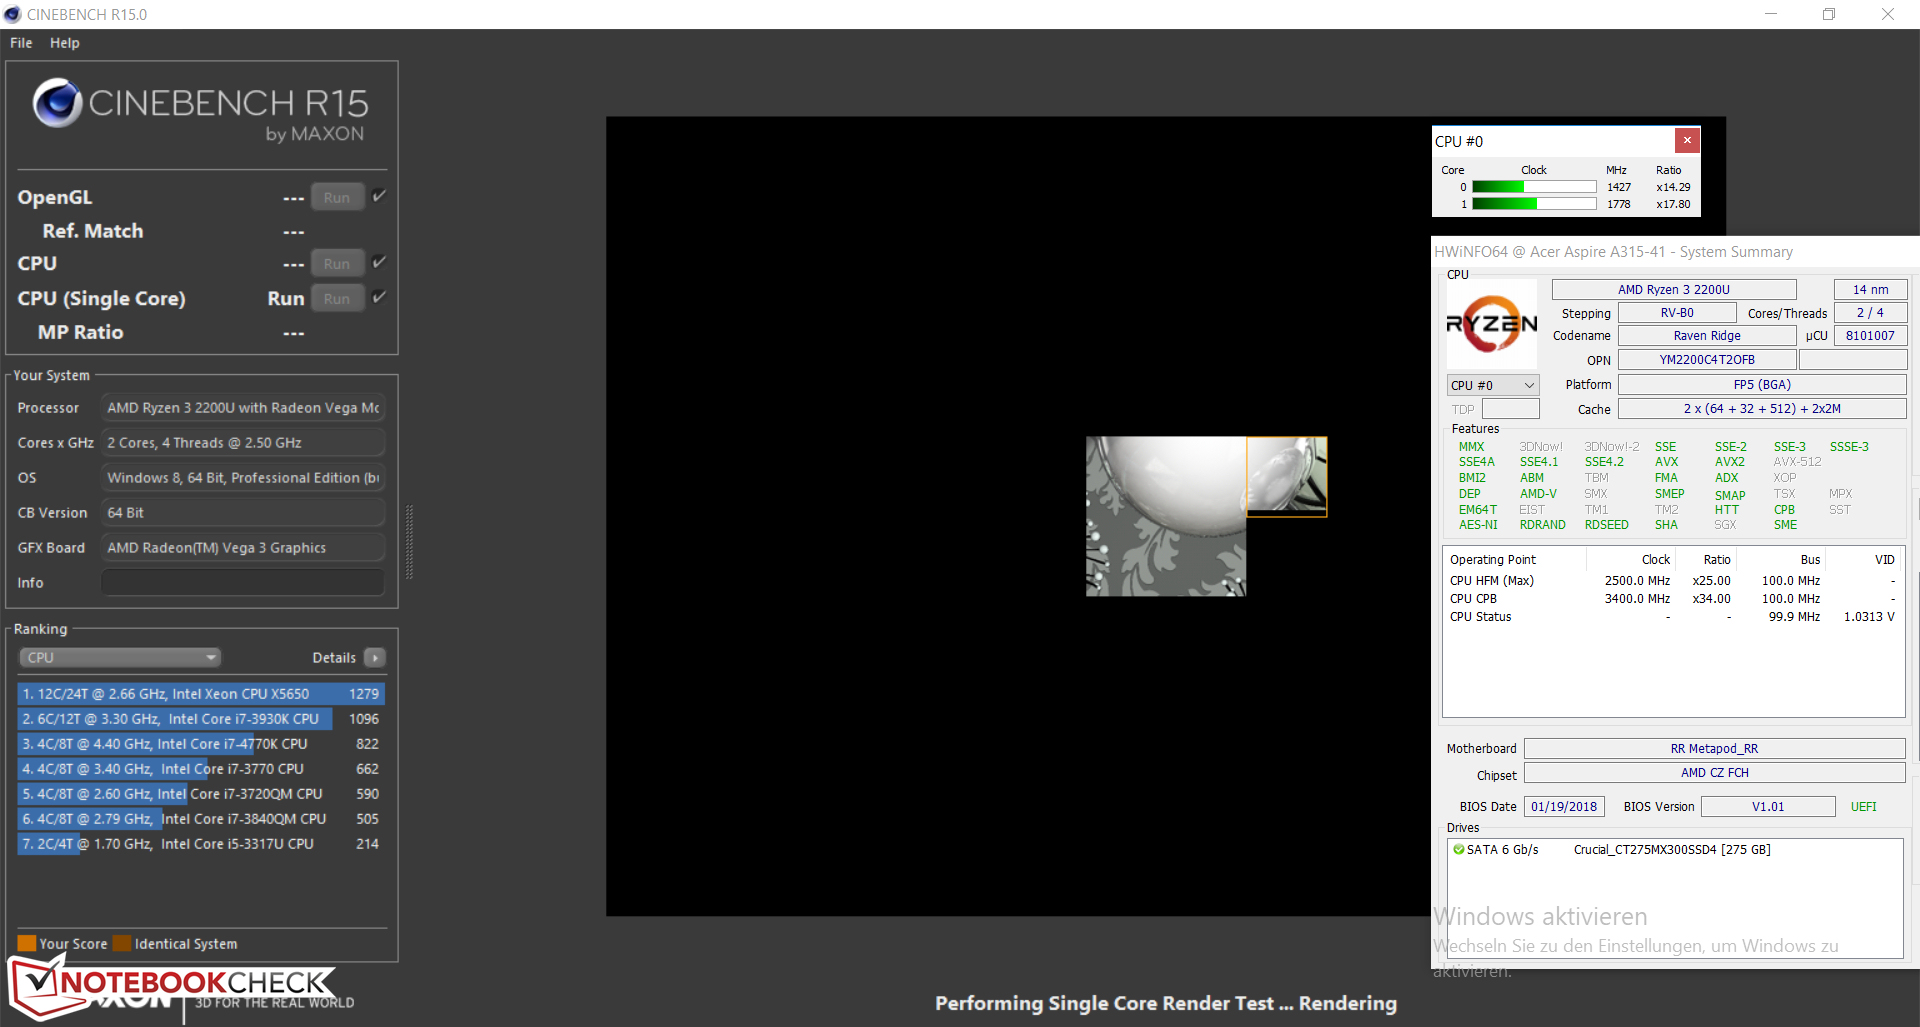
We check if the Turbo boost can be used over a prolonged period of time by running the Cinebench multi-core benchmark in a continuous loop for 30 minutes. The results improve from the first to the fourth benchmark run. After that, they stay on the same level. The Turbo boost is used. However, it does not run at full speed.
A look at our comparison devices reveals that the CPU part of the APU slots in between the Core i3-7130U and the Core i5-7200U. Therefore, it offers more than enough computing power for such usage scenarios as office work and Internet browsing.
However, the CPU fails to realize all of its potential. The processor achieves these results without the Turbo boost running at full speed. This can be attributed to the low TDP (15 watts). The TDP of the APU can be adjusted by the manufacturer (from 12 up to 25 watts). If the APU received the full 25 watts, then the AMD processor would have performed significantly better.
| Mozilla Kraken 1.1 - Total | |
| Lenovo ThinkPad A275 | |
| HP 15-ba077ng (Edge 38) | |
| Average AMD Ryzen 3 2200U (1396 - 1979, n=2) | |
| Lenovo V330-15IKB (Edge 41) | |
| Acer Aspire 3 A315-41-R7BM (Edge 42) | |
| Acer Aspire 3 A315-51-30YA (Edge 41) | |
| Acer Extensa 2540-580K (Edge 41) | |
| Average of class Office (479 - 1966, n=112, last 2 years) | |
| Octane V2 - Total Score | |
| Average of class Office (21416 - 93596, n=52, last 2 years) | |
| Acer Extensa 2540-580K (Edge 41) | |
| Acer Aspire 3 A315-51-30YA (Edge 41) | |
| Acer Aspire 3 A315-41-R7BM (Edge 42) | |
| Average AMD Ryzen 3 2200U (20430 - 25430, n=2) | |
| Lenovo V330-15IKB (Edge 41) | |
| HP 15-ba077ng (Edge 38) | |
| Lenovo ThinkPad A275 | |
| JetStream 1.1 - Total Score | |
| Average of class Office (117.1 - 544, n=18, last 2 years) | |
| Acer Extensa 2540-580K (Edge 41) | |
| Acer Aspire 3 A315-51-30YA (Edge 41) | |
| Acer Aspire 3 A315-41-R7BM (Edge 42) | |
| Asus X510UA-BR305T (Edge 40) | |
| Lenovo V330-15IKB (Edge 41) | |
| Average AMD Ryzen 3 2200U (109.3 - 170.3, n=3) | |
| HP 15-ba077ng (Edge 38) | |
| HP 250 G6 2UB93ES (Edge 41) | |
* ... smaller is better
System Performance
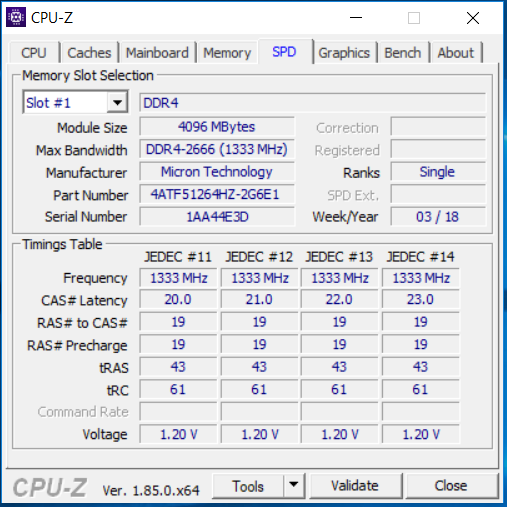
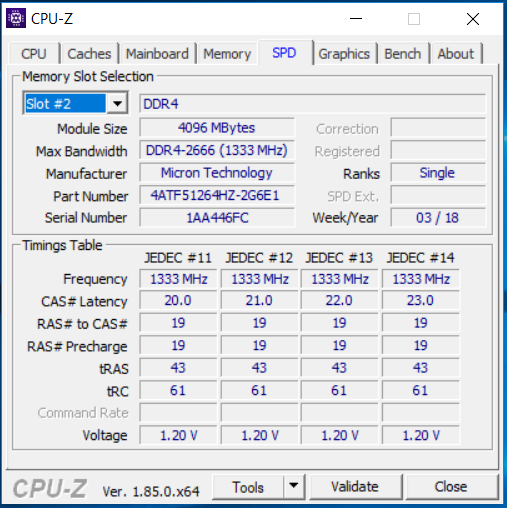
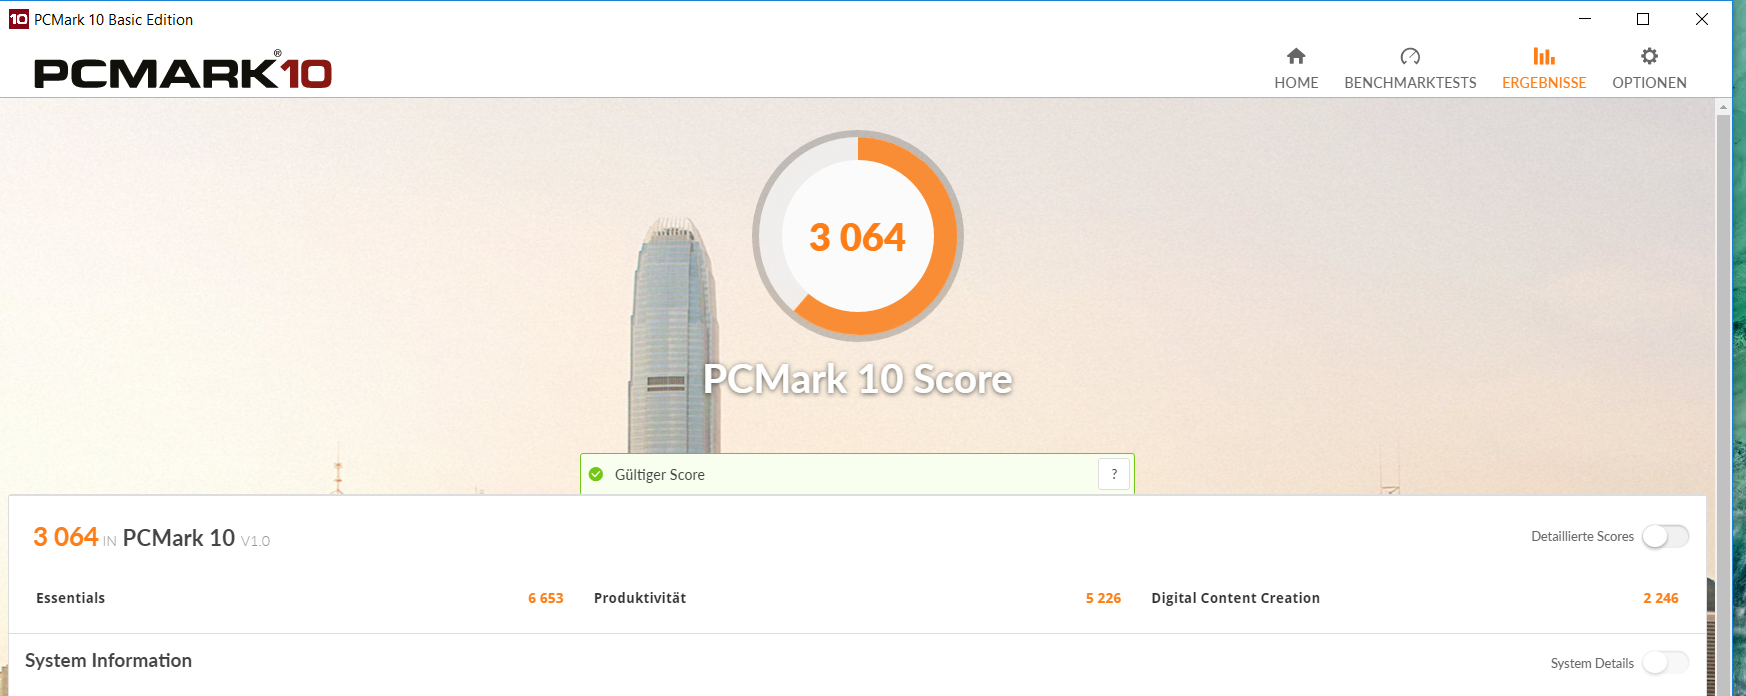
The combination of a powerful APU, an SSD and dual-channel-enabled RAM creates a very responsive system. The results in the PCMark benchmarks are in good order and on the same level as the Core i5-7200U. An increase in overall performance is not possible. Acer has already exhausted all the possibilities.
| PCMark 7 Score | 5766 points | |
| PCMark 8 Home Score Accelerated v2 | 3457 points | |
| PCMark 8 Creative Score Accelerated v2 | 3884 points | |
| PCMark 8 Work Score Accelerated v2 | 4592 points | |
| PCMark 10 Score | 3064 points | |
Help | ||
Storage Devices
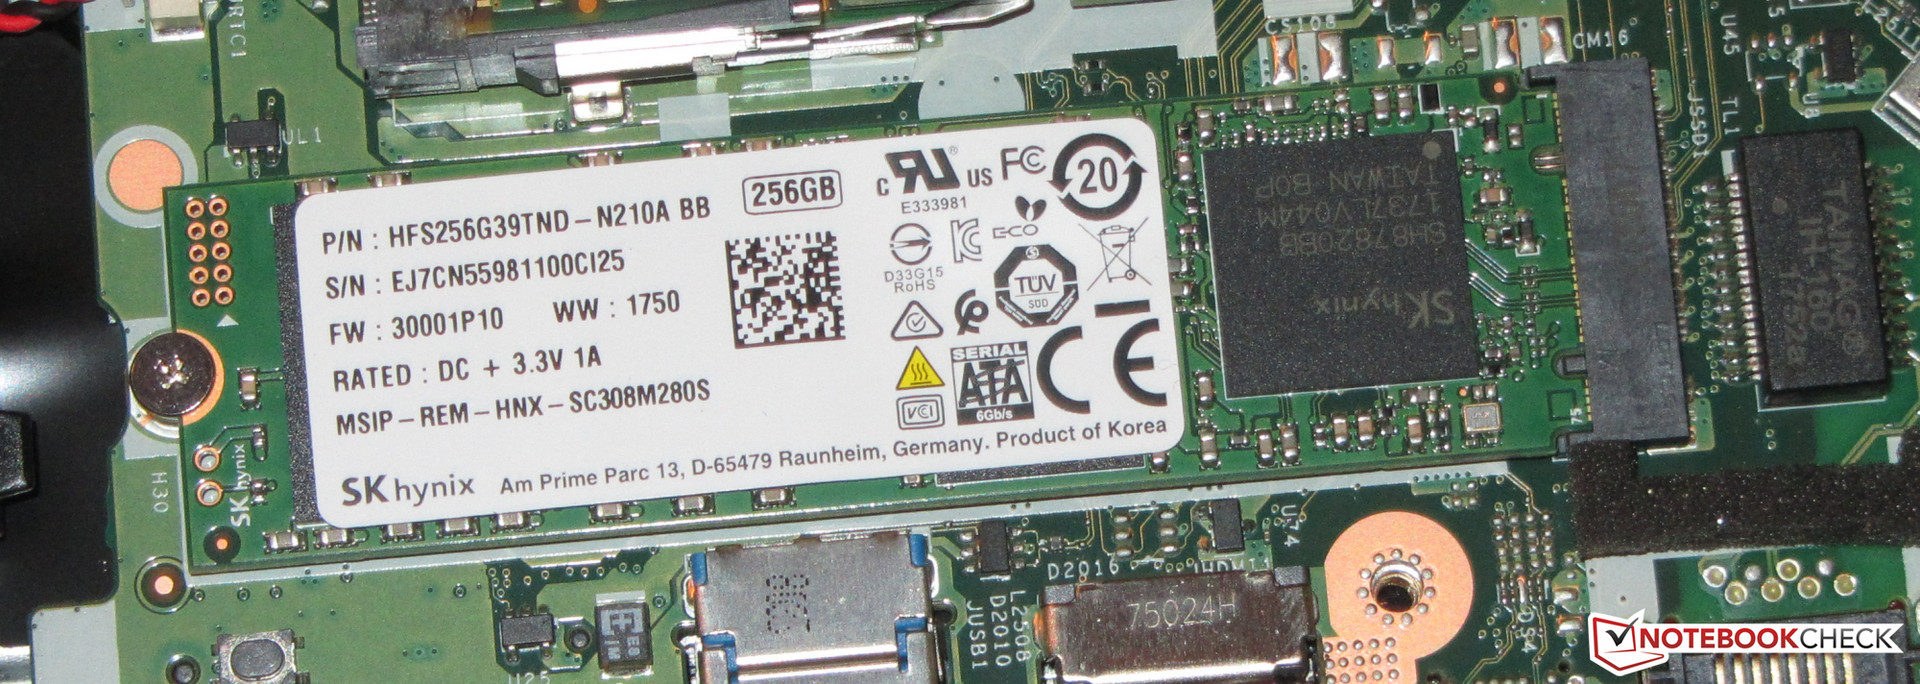
A SATA III SSD from SK Hynix serves as the system drive. It comes in an M.2-2280 form factor and has a capacity of 256 GB. Right out of the box, only 206 GB is available to the user. The rest of the storage space is occupied by the Windows installation files and the recovery partition. The transfer rates are in good order.
A 2.5-inch drive bay lurks behind the large maintenance hatch of the Aspire 3. However, our review device offers neither an installation frame for an HDD nor a SATA connector. Therefore, installing a secondary drive is out of the question.

| Acer Aspire 3 A315-41-R7BM SK Hynix HFS256G39TND-N210A | Acer Aspire 3 A315-51-55E4 Micron 1100 MTFDDAV256TBN | HP 250 G6 2UB93ES Samsung SSD PM871a MZNLN256HMHQ | Acer Extensa 2540-580K Kingston RBUSC180DS37256GH | Lenovo V330-15IKB Samsung PM961 MZVLW256HEHP | Average SK Hynix HFS256G39TND-N210A | |
|---|---|---|---|---|---|---|
| CrystalDiskMark 3.0 | 42% | 44% | 48% | 143% | 18% | |
| Read Seq | 512 | 485.8 -5% | 488 -5% | 473.9 -7% | 1303 154% | 482 ? -6% |
| Write Seq | 257.2 | 456.1 77% | 455 77% | 467.1 82% | 1279 397% | 246 ? -4% |
| Read 512 | 368.5 | 328 -11% | 426.4 16% | 318.3 -14% | 815 121% | 328 ? -11% |
| Write 512 | 259.1 | 446.8 72% | 390.7 51% | 441.3 70% | 826 219% | 243 ? -6% |
| Read 4k | 24.92 | 26.95 8% | 37.68 51% | 33.06 33% | 50.1 101% | 28 ? 12% |
| Write 4k | 46.59 | 86.7 86% | 76.9 65% | 77.7 67% | 100.7 116% | 74.8 ? 61% |
| Read 4k QD32 | 195.7 | 245.9 26% | 286.5 46% | 310.1 58% | 252.2 29% | 323 ? 65% |
| Write 4k QD32 | 165.5 | 300.2 81% | 253.1 53% | 317.1 92% | 178.5 8% | 220 ? 33% |
Graphics Card
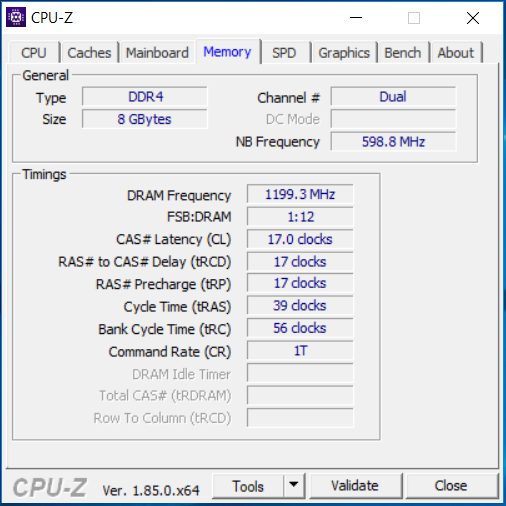
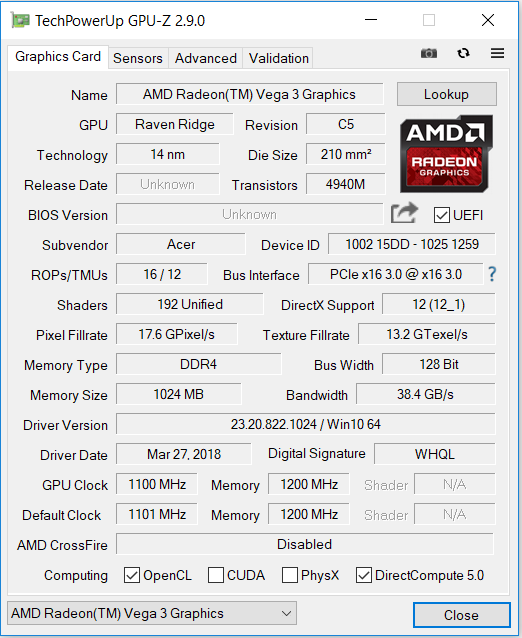
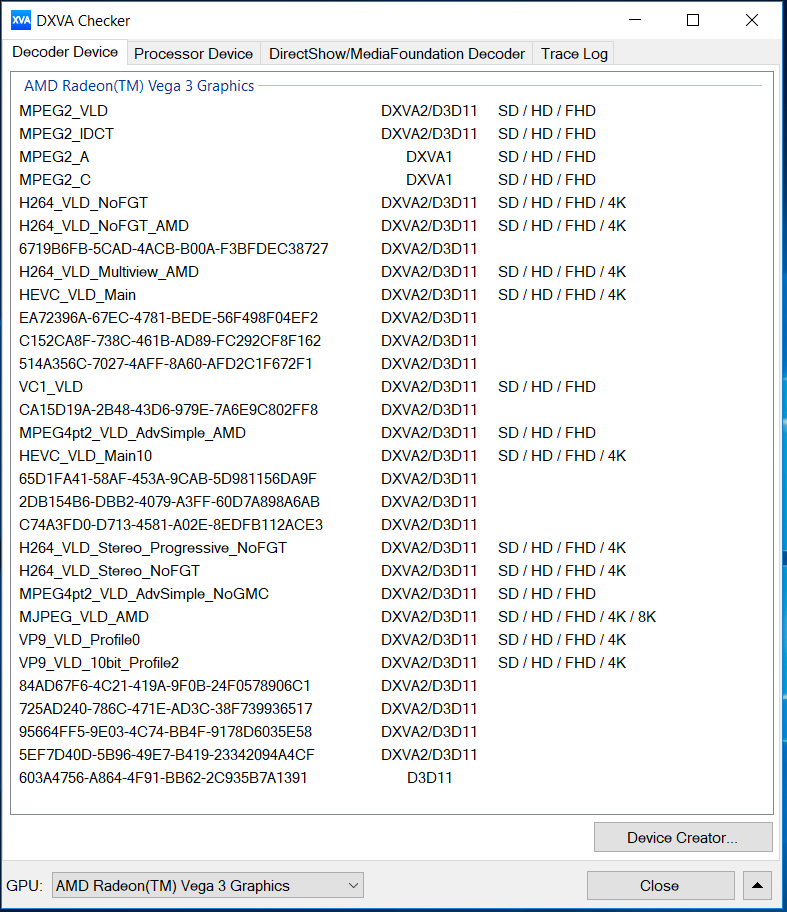
The integrated AMD Radeon RX Vega 3 graphics card supports DirectX 12 and has a maximum core clock of 1100 MHz. The Vega 3 benefits from fast RAM. The fastest RAM that the memory controller supports is DDR4 2400 MHz RAM. The Aspire 3 actually comes with DDR4 2666 MHz RAM. This is why there should not be any bottlenecks in terms of the RAM.
The results in the 3DMark benchmarks are on the normal level for this kind of GPU. The Vega 3 performs somewhat better than Intel’s (U)HD Graphics 620. However, Intel’s GPU manages to beat AMD’s GPU in some benchmarks. Therefore, both the (U)HD Graphics 620 and the Vega 3 are roughly on the same level in terms of performance.
The differences in performance between UHD/HD Graphics 620-based notebooks (with dual-channel-enabled RAM) are huge. In other words: The results vary greatly from notebook to notebook. In the GPU benchmarks, some notebooks with Intel’s integrated graphics are significantly faster than the Aspire 3. This can be attributed to the differences in TDP and cooling solutions. Whether such differences in performance exist with the Vega 3-based notebooks we do not know. The Aspire 3 is a Vega 3-based notebook.
| 3DMark 03 Standard | 27308 points | |
| 3DMark 05 Standard | 15885 points | |
| 3DMark 06 Standard Score | 9174 points | |
| 3DMark Vantage P Result | 5846 points | |
| 3DMark 11 Performance | 2068 points | |
| 3DMark Ice Storm Standard Score | 70193 points | |
| 3DMark Cloud Gate Standard Score | 6281 points | |
| 3DMark Fire Strike Score | 1274 points | |
| 3DMark Fire Strike Extreme Score | 586 points | |
| 3DMark Time Spy Score | 424 points | |
Help | ||
| ComputeMark v2.1 - 1024x600 Normal, Score | |
| Average of class Office (634 - 8754, n=4, last 2 years) | |
| Acer Swift 3 SF315-41-R4W1 | |
| Asus VivoBook 15 X542UF-DM143T | |
| Lenovo IdeaPad 320s-14IKB | |
| Acer Aspire 3 A315-41-R7BM | |
| Asus X302UV-FN016T | |
| Average AMD Radeon RX Vega 3 (933 - 1083, n=2) | |
| Acer Aspire ES1-731G-P5UR | |
| HP 15-bs103ng | |
| Acer Spin 5 SP513-52N-566U | |
| HP 17-bs103ng | |
| GFXBench (DX / GLBenchmark) 2.7 | |
| 1920x1080 T-Rex Offscreen | |
| Asus VivoBook 15 X542UF-DM143T | |
| Acer Swift 3 SF315-41-R4W1 | |
| Acer Spin 5 SP513-52N-566U | |
| Lenovo IdeaPad 320s-14IKB | |
| HP 15-bs103ng | |
| HP 17-bs103ng | |
| Asus X302UV-FN016T | |
| Acer Aspire 3 A315-41-R7BM | |
| Average of class Office (38 - 210, n=4, last 2 years) | |
| Acer Aspire ES1-731G-P5UR | |
| Average AMD Radeon RX Vega 3 (40 - 89, n=2) | |
| T-Rex Onscreen | |
| Asus VivoBook 15 X542UF-DM143T | |
| HP 17-bs103ng | |
| Lenovo IdeaPad 320s-14IKB | |
| HP 15-bs103ng | |
| Acer Aspire 3 A315-41-R7BM | |
| Average AMD Radeon RX Vega 3 (39 - 86, n=2) | |
| Asus X302UV-FN016T | |
| Acer Spin 5 SP513-52N-566U | |
| Acer Swift 3 SF315-41-R4W1 | |
| Acer Aspire ES1-731G-P5UR | |
| Average of class Office (35 - 58, n=4, last 2 years) | |
| GFXBench 3.0 | |
| 1920x1080 1080p Manhattan Offscreen | |
| Asus VivoBook 15 X542UF-DM143T | |
| Lenovo IdeaPad 320s-14IKB | |
| Acer Spin 5 SP513-52N-566U | |
| Asus X302UV-FN016T | |
| HP 15-bs103ng | |
| HP 17-bs103ng | |
| Acer Aspire ES1-731G-P5UR | |
| Acer Aspire 3 A315-41-R7BM | |
| Average AMD Radeon RX Vega 3 (20 - 26, n=2) | |
| Average of class Office (18 - 24, n=3, last 2 years) | |
| on screen Manhattan Onscreen OGL | |
| Asus VivoBook 15 X542UF-DM143T | |
| Lenovo IdeaPad 320s-14IKB | |
| HP 17-bs103ng | |
| Asus X302UV-FN016T | |
| Acer Spin 5 SP513-52N-566U | |
| HP 15-bs103ng | |
| Acer Aspire ES1-731G-P5UR | |
| Average of class Office (23 - 49, n=3, last 2 years) | |
| Acer Aspire 3 A315-41-R7BM | |
| Average AMD Radeon RX Vega 3 (19 - 25.5, n=2) | |
| GFXBench 3.1 | |
| 1920x1080 Manhattan ES 3.1 Offscreen | |
| Asus VivoBook 15 X542UF-DM143T | |
| Lenovo IdeaPad 320s-14IKB | |
| Asus X302UV-FN016T | |
| Acer Spin 5 SP513-52N-566U | |
| HP 15-bs103ng | |
| HP 17-bs103ng | |
| Acer Aspire ES1-731G-P5UR | |
| Average of class Office (8.2 - 85, n=4, last 2 years) | |
| Acer Aspire 3 A315-41-R7BM | |
| Average AMD Radeon RX Vega 3 (13 - 25.1, n=2) | |
| on screen Manhattan ES 3.1 Onscreen | |
| Asus VivoBook 15 X542UF-DM143T | |
| Asus X302UV-FN016T | |
| Lenovo IdeaPad 320s-14IKB | |
| HP 17-bs103ng | |
| Acer Spin 5 SP513-52N-566U | |
| Acer Aspire ES1-731G-P5UR | |
| Average of class Office (15 - 59, n=4, last 2 years) | |
| HP 15-bs103ng | |
| Acer Aspire 3 A315-41-R7BM | |
| Average AMD Radeon RX Vega 3 (14 - 24.7, n=2) | |
| GFXBench | |
| 1920x1080 Car Chase Offscreen | |
| Average of class Office (9.1 - 198.6, n=5, last 2 years) | |
| Asus VivoBook 15 X542UF-DM143T | |
| Lenovo IdeaPad 320s-14IKB | |
| Acer Spin 5 SP513-52N-566U | |
| Asus X302UV-FN016T | |
| HP 15-bs103ng | |
| HP 17-bs103ng | |
| Acer Aspire ES1-731G-P5UR | |
| Acer Aspire 3 A315-41-R7BM | |
| Average AMD Radeon RX Vega 3 (10 - 21.5, n=2) | |
| on screen Car Chase Onscreen | |
| Asus X302UV-FN016T | |
| Asus VivoBook 15 X542UF-DM143T | |
| Average of class Office (9.3 - 60.1, n=5, last 2 years) | |
| HP 17-bs103ng | |
| Lenovo IdeaPad 320s-14IKB | |
| Acer Aspire ES1-731G-P5UR | |
| HP 15-bs103ng | |
| Acer Aspire 3 A315-41-R7BM | |
| Average AMD Radeon RX Vega 3 (11 - 21.3, n=2) | |
| Unigine Heaven 2.1 - 1280x1024 high, Tesselation (normal), DirectX11 AA:off AF:1x | |
| Asus VivoBook 15 X542UF-DM143T | |
| Lenovo IdeaPad 320s-14IKB | |
| Asus X302UV-FN016T | |
| Acer Aspire 3 A315-41-R7BM | |
| Average AMD Radeon RX Vega 3 () | |
| Acer Aspire ES1-731G-P5UR | |
| HP 15-bs103ng | |
| HP 17-bs103ng | |
| Unigine Valley 1.0 | |
| 1920x1080 Extreme HD DirectX AA:x8 | |
| Average of class Office (4.4 - 18.9, n=3, last 2 years) | |
| Asus VivoBook 15 X542UF-DM143T | |
| Lenovo IdeaPad 320s-14IKB | |
| HP 17-bs103ng | |
| Acer Spin 5 SP513-52N-566U | |
| Acer Aspire 3 A315-41-R7BM | |
| Average AMD Radeon RX Vega 3 () | |
| HP 15-bs103ng | |
| 1920x1080 Extreme HD Preset OpenGL AA:x8 | |
| Average of class Office (5.2 - 21.6, n=3, last 2 years) | |
| Asus VivoBook 15 X542UF-DM143T | |
| Lenovo IdeaPad 320s-14IKB | |
| HP 17-bs103ng | |
| HP 15-bs103ng | |
| Acer Aspire 3 A315-41-R7BM | |
| Average AMD Radeon RX Vega 3 () | |
| Geekbench 4.0 - Compute OpenCL Score | |
| Asus VivoBook 15 X542UF-DM143T | |
| HP EliteBook 840 G5-3JX61EA | |
| Lenovo IdeaPad 320s-14IKB | |
| HP 17-bs103ng | |
| Lenovo V330-15IKB | |
| HP 15-bs103ng | |
| Acer Extensa 2540-580K | |
| Acer Aspire 3 A315-41-R7BM | |
| Average AMD Radeon RX Vega 3 (15755 - 20649, n=3) | |
| Acer Aspire 3 A315-51-30YA | |
| HP 250 G6 2UB93ES | |
Gaming Performance
The APU of the Aspire 3 can run some games at decent frame rates. Here, we mean titles that have low system requirements. However, you will have to be content with running these games at low resolution (720p) and on low settings. Graphically demanding titles like Far Cry 5 are not playable. The gaming benchmarks tell the same story as the synthetic benchmarks: The UHD Graphics 620/HD Graphics 620 and the Vega 3 are on the same level in terms of performance. Both GPUs achieve very similar frame rates.
We use the video game The Witcher 3 to check if the frame rates can be maintained over an extended period of time. For this, we run the game on the maximum settings at Full HD resolution (1920x1080) for one hour. Over the entire run of gameplay, the player-controlled character just stands still. We did not observe any performance drops during this test.
| low | med. | high | ultra | |
| StarCraft 2 (2010) | 175.4 | 63 | 38.7 | 18.6 |
| The Elder Scrolls V: Skyrim (2011) | 51.5 | 32.7 | 23.5 | 13.6 |
| Diablo III (2012) | 97.1 | 51.6 | 45.2 | 26.8 |
| Tomb Raider (2013) | 95.1 | 41.6 | 32.6 | 13.8 |
| BioShock Infinite (2013) | 90.5 | 46.2 | 31 | 10 |
| GRID: Autosport (2014) | 145.7 | 50.6 | 24.1 | 13.7 |
| Sims 4 (2014) | 152.7 | 56.1 | 26.5 | 21.7 |
| Middle-earth: Shadow of Mordor (2014) | 42.6 | 24.9 | 11.8 | |
| Dragon Age: Inquisition (2014) | 35.7 | 21.9 | 6.7 | |
| GTA V (2015) | 42.7 | 35 | 9.1 | |
| Dirt Rally (2015) | 132.5 | 33.5 | 16.7 | |
| The Witcher 3 (2015) | 20.1 | 9.9 | 5.2 | |
| Dota 2 Reborn (2015) | 62 | 45.2 | 21.5 | 17.7 |
| World of Warships (2015) | 67.3 | 40.4 | 20 | 17.6 |
| Anno 2205 (2015) | 22.7 | 12.1 | 5.1 | |
| Rainbow Six Siege (2015) | 39.7 | 20.4 | 10.2 | |
| Rise of the Tomb Raider (2016) | 25.6 | 16 | 6.6 | |
| The Division (2016) | 16.1 | 9.7 | 4.3 | |
| Overwatch (2016) | 43.5 | 32.5 | 18.8 | |
| Battlefield 1 (2016) | 25.5 | 15.7 | 7.1 | |
| Civilization VI (2016) | 53.7 | 35.7 | 6.9 | |
| Farming Simulator 17 (2016) | 100.2 | 72.3 | 20.7 | |
| Resident Evil 7 (2017) | 41.6 | 15.6 | 10 | |
| For Honor (2017) | 34 | 9.4 | 8.9 | |
| Prey (2017) | 35 | 14.3 | 8.5 | |
| Rocket League (2017) | 93.3 | 27.3 | 17.4 | |
| Team Fortress 2 (2017) | 75 | 60.3 | 43 | 29 |
| F1 2017 (2017) | 30 | 14 | 13 | |
| FIFA 18 (2017) | 102 | 31.8 | 27.4 | |
| Middle-earth: Shadow of War (2017) | 27 | 8 | ||
| Assassin´s Creed Origins (2017) | 13 | 7 | ||
| Call of Duty WWII (2017) | 30.7 | 16.6 | ||
| Need for Speed Payback (2017) | 15.4 | 7.7 | ||
| Star Wars Battlefront 2 (2017) | 20.8 | 6 | ||
| Fortnite (2018) | 37.6 | 11 | ||
| Final Fantasy XV Benchmark (2018) | 11.7 | 5.5 | ||
| X-Plane 11.11 (2018) | 23.5 | 14.3 | 12.9 | |
| Far Cry 5 (2018) | 13 | 5 |
| Tomb Raider - 1366x768 Normal Preset AA:FX AF:4x | |
| Asus VivoBook 15 X542UF-DM143T | |
| Average of class Office (last 2 years) | |
| Acer Swift 3 SF315-41-R4W1 | |
| Asus X302UV-FN016T | |
| HP 17-bs103ng | |
| Acer Extensa 2540-580K | |
| Acer Aspire 3 A315-41-R7BM | |
| Average AMD Radeon RX Vega 3 () | |
| Acer Aspire ES1-731G-P5UR | |
| HP 15-bs103ng | |
| Dota 2 Reborn - 1366x768 med (1/3) | |
| Asus VivoBook 15 X542UF-DM143T | |
| Average of class Office (10.9 - 146.2, n=123, last 2 years) | |
| Lenovo IdeaPad 320s-14IKB | |
| HP 17-bs103ng | |
| Acer Swift 3 SF315-41-R4W1 | |
| HP 15-bs103ng | |
| Acer Aspire 3 A315-41-R7BM | |
| Average AMD Radeon RX Vega 3 (14.6 - 56.1, n=11) | |
| Team Fortress 2 - 1920x1080 high AF:16x | |
| Asus VivoBook 15 X542UF-DM143T | |
| Lenovo IdeaPad 320s-14IKB | |
| Acer Swift 3 SF315-41-R4W1 | |
| Acer Aspire 3 A315-41-R7BM | |
| Average AMD Radeon RX Vega 3 () | |
| HP 17-bs103ng | |
| HP 15-bs103ng | |
| Diablo III - 1366x768 Medium / low | |
| Asus VivoBook 15 X542UF-DM143T | |
| Acer Swift 3 SF315-41-R4W1 | |
| Asus X302UV-FN016T | |
| Average of class Office (last 2 years) | |
| HP 17-bs103ng | |
| Acer Aspire 3 A315-41-R7BM | |
| Average AMD Radeon RX Vega 3 () | |
| Acer Aspire ES1-731G-P5UR | |
| HP 15-bs103ng | |
| GRID: Autosport - 1366x768 Medium Preset | |
| Asus X302UV-FN016T | |
| HP 17-bs103ng | |
| Acer Aspire 3 A315-41-R7BM | |
| Average AMD Radeon RX Vega 3 () | |
| For Honor - 1280x720 Low Preset | |
| Asus VivoBook 15 X542UF-DM143T | |
| Acer Swift 3 SF315-41-R4W1 | |
| Lenovo IdeaPad 320s-14IKB | |
| Acer Aspire 3 A315-41-R7BM | |
| Average AMD Radeon RX Vega 3 () | |
| HP 17-bs103ng | |
| HP 15-bs103ng | |
| Rainbow Six Siege - 1024x768 Low Preset AA:T AF:Linear | |
| Asus VivoBook 15 X542UF-DM143T | |
| Acer Swift 3 SF315-41-R4W1 | |
| HP 17-bs103ng | |
| Asus X302UV-FN016T | |
| HP 15-bs103ng | |
| Acer Aspire 3 A315-41-R7BM | |
| Average AMD Radeon RX Vega 3 () | |
| Acer Aspire ES1-731G-P5UR | |
| Overwatch - 1280x720 Low (Render Scale 100 %) AA:FX AF:1x | |
| Asus VivoBook 15 X542UF-DM143T | |
| Lenovo IdeaPad 320s-14IKB | |
| HP 17-bs103ng | |
| Acer Aspire 3 A315-41-R7BM | |
| Average AMD Radeon RX Vega 3 () | |
| HP 15-bs103ng | |
| World of Warships - 1366x768 Medium Preset AF:Trilinear | |
| Asus VivoBook 15 X542UF-DM143T | |
| Asus X302UV-FN016T | |
| Acer Swift 3 SF315-41-R4W1 | |
| Acer Aspire 3 A315-41-R7BM | |
| Average AMD Radeon RX Vega 3 () | |
| HP 15-bs103ng | |
| Acer Aspire ES1-731G-P5UR | |
| Rocket League - 1280x720 Performance | |
| Lenovo IdeaPad 320s-14IKB | |
| Acer Swift 3 SF315-41-R4W1 | |
| Acer Aspire 3 A315-41-R7BM | |
| Average AMD Radeon RX Vega 3 () | |
| HP 17-bs103ng | |
| HP 15-bs103ng | |
| Sims 4 - 1366x768 Medium Preset | |
| Lenovo Ideapad 310-15ISK | |
| Acer Swift 3 SF315-41-R4W1 | |
| Acer Aspire 3 A315-41-R7BM | |
| Average AMD Radeon RX Vega 3 () | |
| HP 17-bs103ng | |
Emissions & Energy - The Aspire 3 does not get hot
System Noise
As a rule, the fan stands still when idle. This leads to silent operation. Under load, the fan starts to spin up. During our stress test we measured a sound pressure level of 40.6 dB(A).
We have some issues with the way the fan is controlled. It spins too fast under load. A look at the temperatures reveals that it should be able to effectively cool the system even at low speed. Here, Acer should provide a BIOS update to fix this issue.
Noise Level
| Idle |
| 30.3 / 30.3 / 30.9 dB(A) |
| Load |
| 37.8 / 40.6 dB(A) |
 | ||
30 dB silent 40 dB(A) audible 50 dB(A) loud |
||
min: | ||
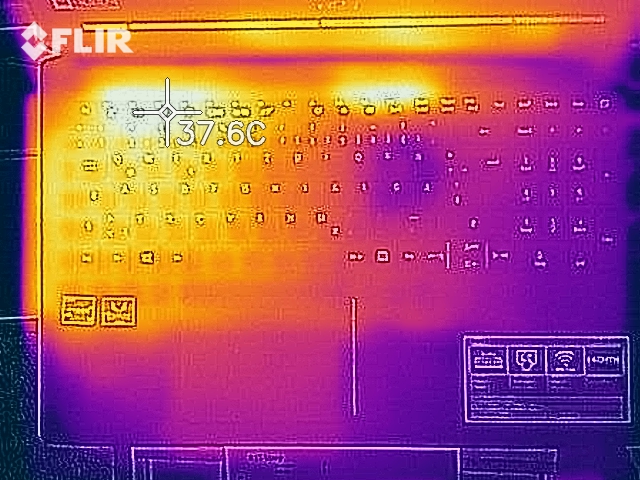
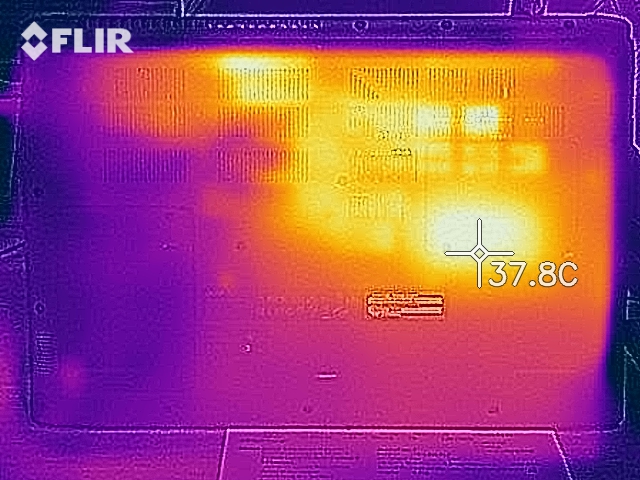
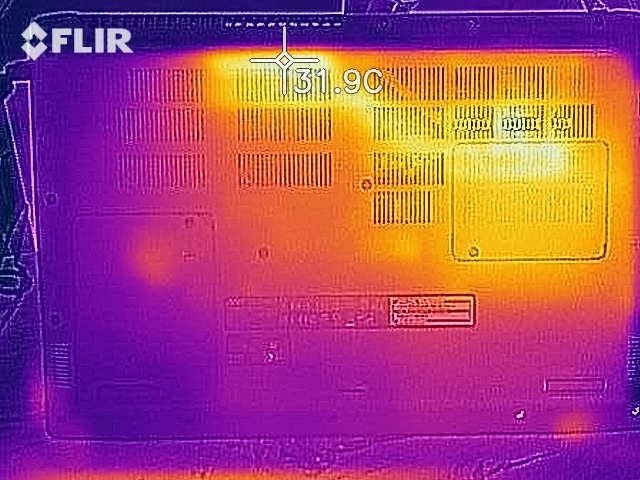
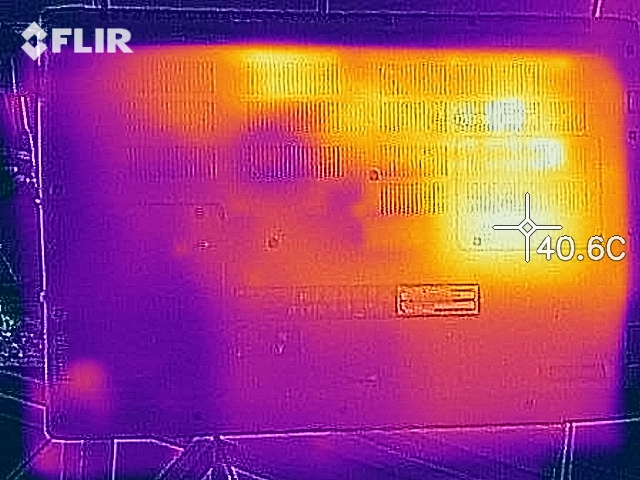
Temperature
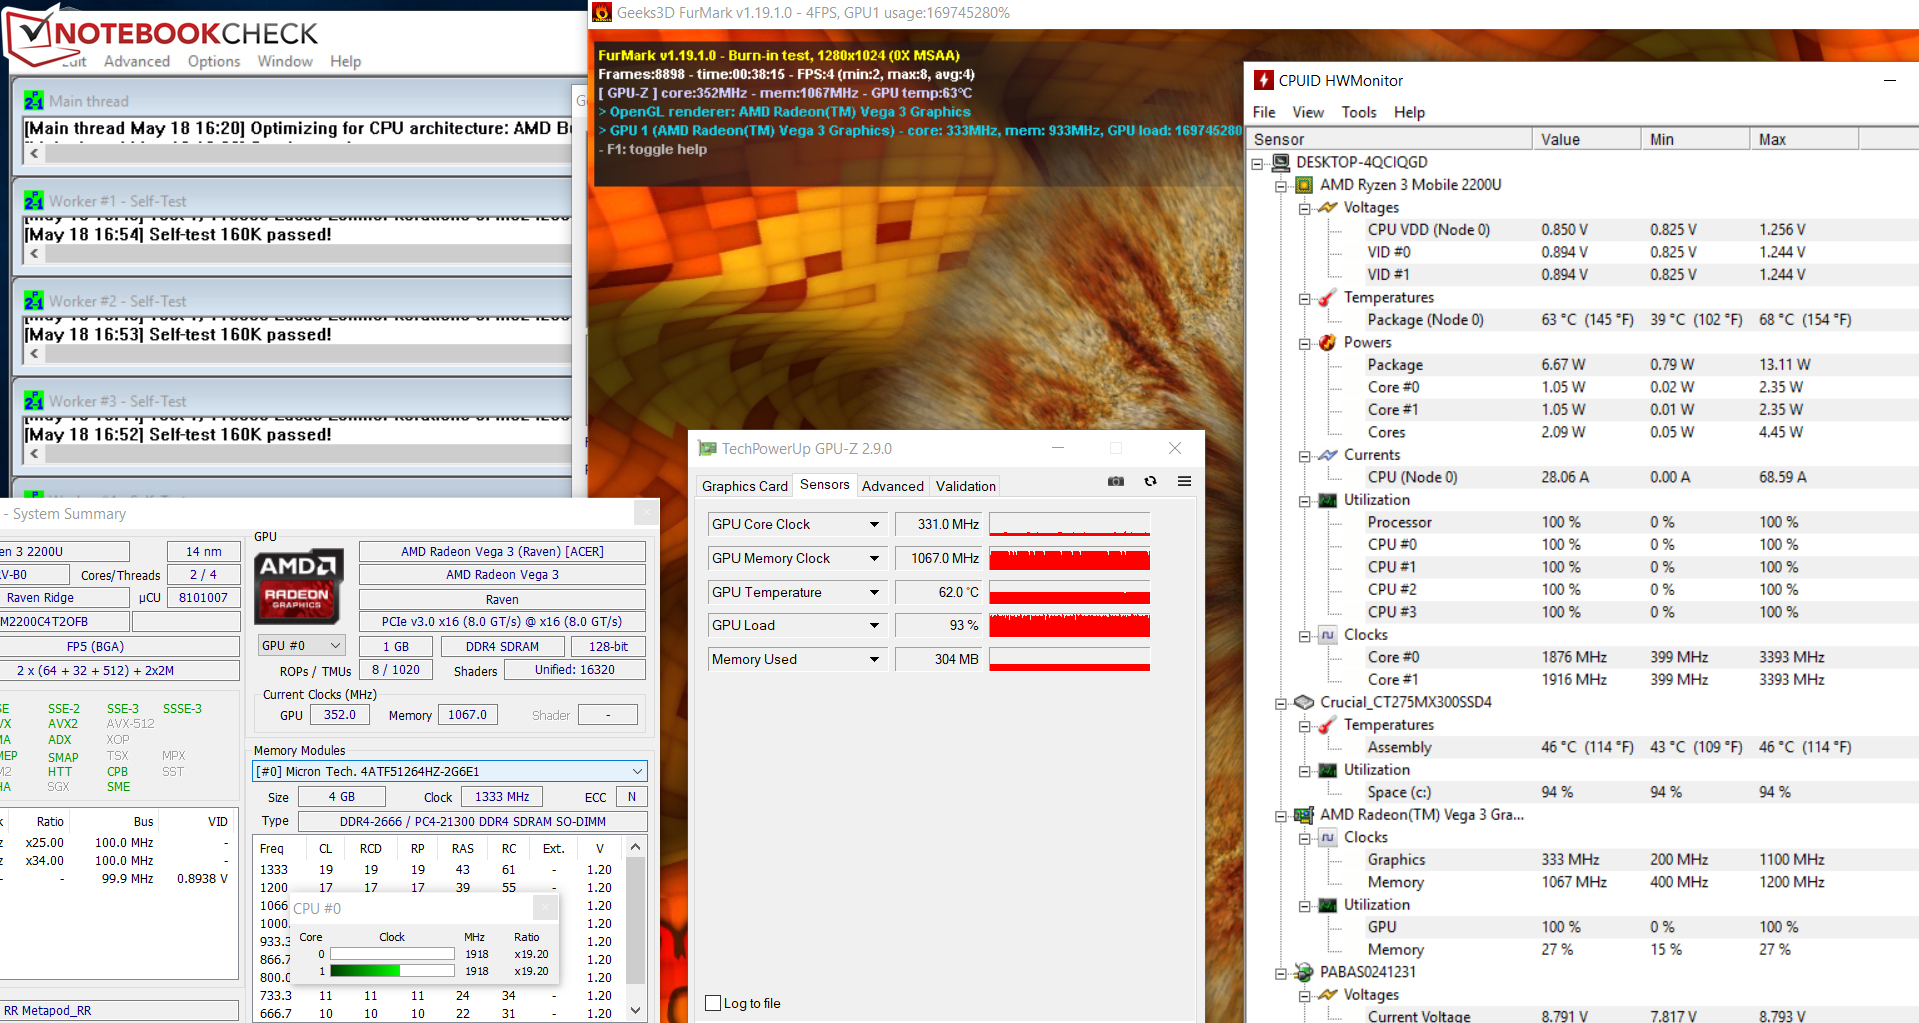
The Aspire 3 gets different results in our stress test (Prime95 and FurMark running for at least one hour) when it is plugged in and when it is running on battery power. When plugged in, the processor operates at 1.9 to 2 GHz. The GPU runs at 300 to 400 MHz. When running on battery power, the clock rate of the CPU fluctuates between 400 and 1600 MHz. The core clock of the GPU sits in the 400-to-700 MHz range.
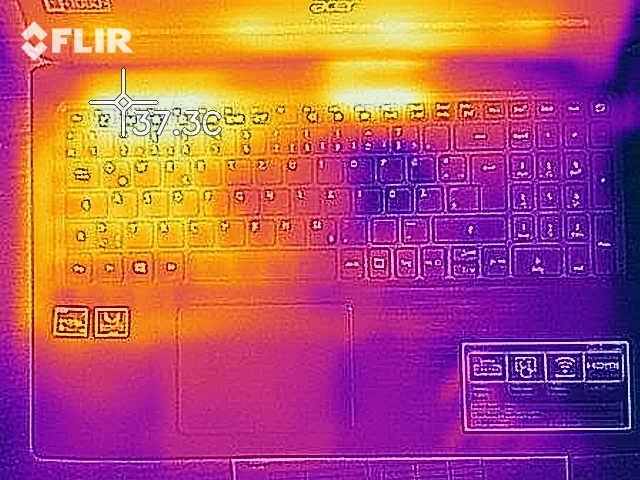
During the stress test, the laptop does not become hot. The 30 °C (86 °F) mark is only exceeded at one measurement point. The temperatures turn out to be somewhat higher during the stress test with The Witcher 3 (in this stress test, the video game runs for one hour at Full HD resolution and on the ultra settings).
(+) The maximum temperature on the upper side is 29.9 °C / 86 F, compared to the average of 34.2 °C / 94 F, ranging from 21.2 to 62.5 °C for the class Office.
(+) The bottom heats up to a maximum of 30.1 °C / 86 F, compared to the average of 36.7 °C / 98 F
(+) In idle usage, the average temperature for the upper side is 22.5 °C / 73 F, compared to the device average of 29.5 °C / 85 F.
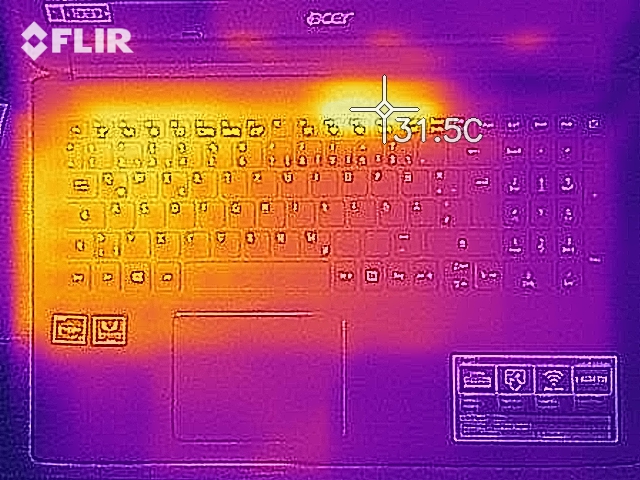
(+) Playing The Witcher 3, the average temperature for the upper side is 27 °C / 81 F, compared to the device average of 29.5 °C / 85 F.
(+) The palmrests and touchpad are cooler than skin temperature with a maximum of 24.1 °C / 75.4 F and are therefore cool to the touch.
(+) The average temperature of the palmrest area of similar devices was 27.7 °C / 81.9 F (+3.6 °C / 6.5 F).
Speakers
The stereo speakers are located on the underside. They produce an okay sound that is completely lacking bass. For a better listening experience, you should use a pair of headphones or external speakers.
Acer Aspire 3 A315-41-R7BM audio analysis
(-) | not very loud speakers (67.8 dB)
Bass 100 - 315 Hz
(-) | nearly no bass - on average 25.3% lower than median
(±) | linearity of bass is average (12.5% delta to prev. frequency)
Mids 400 - 2000 Hz
(+) | balanced mids - only 3% away from median
(±) | linearity of mids is average (10.1% delta to prev. frequency)
Highs 2 - 16 kHz
(+) | balanced highs - only 1.8% away from median
(+) | highs are linear (5.5% delta to prev. frequency)
Overall 100 - 16.000 Hz
(±) | linearity of overall sound is average (22.7% difference to median)
Compared to same class
» 57% of all tested devices in this class were better, 9% similar, 34% worse
» The best had a delta of 7%, average was 22%, worst was 53%
Compared to all devices tested
» 62% of all tested devices were better, 6% similar, 32% worse
» The best had a delta of 4%, average was 25%, worst was 134%
Apple MacBook 12 (Early 2016) 1.1 GHz audio analysis
(+) | speakers can play relatively loud (83.6 dB)
Bass 100 - 315 Hz
(±) | reduced bass - on average 11.3% lower than median
(±) | linearity of bass is average (14.2% delta to prev. frequency)
Mids 400 - 2000 Hz
(+) | balanced mids - only 2.4% away from median
(+) | mids are linear (5.5% delta to prev. frequency)
Highs 2 - 16 kHz
(+) | balanced highs - only 2% away from median
(+) | highs are linear (4.5% delta to prev. frequency)
Overall 100 - 16.000 Hz
(+) | overall sound is linear (10.2% difference to median)
Compared to same class
» 5% of all tested devices in this class were better, 2% similar, 93% worse
» The best had a delta of 5%, average was 19%, worst was 53%
Compared to all devices tested
» 3% of all tested devices were better, 1% similar, 96% worse
» The best had a delta of 4%, average was 25%, worst was 134%
Energy Consumption
There are no abnormalities in terms of energy consumption to report. When idle, we measured a maximum power draw of 8.4 watts. During the stress test, the energy consumption peaked at 44.2 watts. The rated output of the AC adapter amounts to 45 watts.
| Off / Standby | |
| Idle | |
| Load |
|
Battery Life
In our practically oriented Wi-Fi test, the Aspire 3 achieves a runtime of 5 hours and 44 minutes. This test simulates loads that are consistent with surfing the web. The “balanced” power plan is selected, the energy-saving functions are turned off and the display brightness is set to 150 cd/m². The Acer laptop achieves a runtime of 4 hours and 56 minutes in our video test. During this test, we play the short film Big Buck Bunny (H.264, 1920x1080) in a continuous loop. The communications modules are disabled, the energy-saving functions are switched on and the display brightness is reduced to 150 cd/m².
| Acer Aspire 3 A315-41-R7BM R3 2200U, Vega 3, 37 Wh | Acer Aspire 3 A315-51-55E4 i5-7200U, HD Graphics 620, 37 Wh | HP 250 G6 2UB93ES 6006U, HD Graphics 520, 41.6 Wh | Acer Extensa 2540-580K i5-7200U, HD Graphics 620, 48 Wh | Lenovo V330-15IKB i3-7130U, UHD Graphics 620, 30 Wh | Average of class Office | |
|---|---|---|---|---|---|---|
| Battery Runtime | 20% | 19% | 60% | -20% | 105% | |
| Reader / Idle | 536 | 855 60% | 1133 111% | 1436 ? 168% | ||
| H.264 | 296 | 462 56% | 705 ? 138% | |||
| WiFi v1.3 | 344 | 350 2% | 409 19% | 484 41% | 275 -20% | 594 ? 73% |
| Load | 83 | 81 -2% | 109 31% | 117.7 ? 42% |
Verdict
Pros
Cons
The Aspire 3 A315-41 is a 15.6-inch office notebook that is powered by a Ryzen 3 2200U APU. The APU offers more than enough computing power for such usage scenarios as office work and Internet browsing. The notebook does not become hot even under full load. However, the fan is active both when the notebook is idle and when it is under load. This can be attributed to the fact that the fan tends to spin too fast even when the temperatures are relatively low.
The Acer Aspire 3 A315-41 is a simple office notebook that is suitable for home use.
An SSD creates a very responsive system. It can be replaced. However, to do this you will have to remove the entire bottom cover. The two maintenance hatches do not provide access to the SSD. The keyboard has left a positive impression and is fit for regular office work. It does not feature a backlight.
The battery life is okay. There is a fast SD card reader on board. The screen disappoints once again. Here, Acer uses a dim TN panel with poor contrast and viewing angles.
All in all, the built-in AMD APU has left a positive impression. It is a direct competitor to Intel’s dual-core Kaby Lake CPUs. In both CPU and GPU benchmarks, the two processors are roughly on the same level.
Acer Aspire 3 A315-41-R7BM
-
05/29/2018 v6(old)
Sascha Mölck
Pricecompare
