Notebookcheck Logo

AMD Zen 3 Cezanne vs. Intel Tiger Lake-H 45 W power efficiency comparison: Ryzen 9 5900HS and Ryzen 5 5600H trounce the entire Tiger Lake-H lineup

Cezanne all the way. We compared the power efficiency of various AMD Zen 3 Cezanne APUs and their corresponding Intel Tiger Lake-H competition to see which SoCs are more power-efficient. Our results show that even the humble quad-core from Intel trails behind significantly when pitted against both high-end and mid-range AMD Zen 3 offerings.

Update 01/14: Added Cinebench R15 performance results following a reader's suggestion. 

Though laptops with the latest Intel Alder Lake and AMD Ryzen 6000 processors are expected to be available from later this quarter, a good number of devices are still being offered with Intel Tiger Lake-H and AMD Ryzen 5000 Cezanne chips.

Both Intel and AMD claimed enhanced power efficiency with their respective offerings last year. With Tiger Lake, Intel finally transitioned to 10 nm and also improved on multi-core performance to match that of AMD's. AMD, on the other hand, brought improvements to single-core with Zen 3 while also offering improved power management such as allowing each core to independently regulate its Vcore for a given frequency.

Intel vs AMD: Who has the more power-efficient 45 W chip?

We had reviewed about 73 laptop designs with 45 W CPUs over the past year. Of these 43 were powered by Intel Tiger Lake-H and 30 by AMD Cezanne-H. To test how power-efficient these laptops were overall, we subjected them a variety of tests. You can read about individual CPU power consumptions under various loads in each of the dedicated CPU pages linked below. 

For a broad perspective in comparing the power efficiency between Intel and AMD laptops, we considered the Cinebench 15 multi-core test running on an external monitor. This is to ensure that the variations in the internal display specifications do not affect the scores.

The chart below shows Cinebench R15 multi-core scores taken in average across all laptops tested for a given processor. We see that the Core i9-11900H and the Ryzen 9 5900HS are mostly on par with each other and so are the Core i9-11980HK and the Ryzen 9 5900HX. The Ryzen 5 5600H, however, does have a clear advantage over the Core i5-11400H in multi-core workloads.

Power Consumption - Cinebench R15 Multi Power Efficiency - external Monitor
Average AMD Ryzen 9 5900HS
  (21.1 - 32.7, n=3)
27.2 Points per Watt
Average AMD Ryzen 7 5800H
  (17 - 36.6, n=21)
23.1 Points per Watt
Average AMD Ryzen 9 5900HX
  (16.3 - 33, n=16)
22.9 Points per Watt
Average AMD Ryzen 5 5600H
  (15.8 - 27.4, n=11)
21.3 Points per Watt
Average Intel Core i9-11980HK
  (12.9 - 22.4, n=3)
18.4 Points per Watt
Average Intel Core i7-11850H
  (17.2 - 18.6, n=2)
17.9 Points per Watt
Average Intel Core i5-11400H
  (15.8 - 19.2, n=3)
17.3 Points per Watt
Average Intel Core i7-11800H
  (10.5 - 31.3, n=38)
16.9 Points per Watt
Average Intel Core i5-11300H
  (14.3 - 24.7, n=7)
16.6 Points per Watt
Average Intel Core i9-11900H
  (13.3 - 16, n=4)
14.4 Points per Watt

While the Tiger Lake-H CPUs do seem to have closed the multi-core gap with AMD Cezanne, things change dramatically when power efficiency figures are taken into account. As seen in the chart above, we find that AMD Cezanne Zen 3 processors in general are able to achieve higher performance per Watt compared to corresponding Intel offerings.

At the top-end, we find the Ryzen 9 5900HX to be about 29% more efficient than the Tiger Lake-H flagship, the Core i9-11980HK. The gap further widens with the Core i9-11900H, which lags by 37% compared to both the Ryzen 9 5900HX and the Ryzen 7 5800H

Even the mid-range hexa-core Tiger Lake-H Core i5-11400H and the quad-core Core i5-11300H fare bad when it comes to overall power efficiency. For instance, we see the Ryzen 9 5900HX to be 32% more power-efficient than the Core i5-11300H despite sporting twice the core and thread counts and higher frequencies.

The Ryzen 5 5600H leads the Core i5-11400H by 34% as well — this is despite the Core i5-11400H operating at a lower 2.7 GHz base clock at 45 W compared to the Ryzen 5 5600H's 3.3 GHz.

You can see individual Cinebench R15 multi power consumption patterns for all the tested laptops in the below graph.

Power Consumption Cinebench R15 Multi (45 W CPUs only)

0102030405060708090100110120130140150160170180Tooltip
MSI GS76 Stealth 11UH i9-11900H, GeForce RTX 3080 Laptop GPU: Ø133.9 (127-148)
Asus ROG Zephyrus S17 GX703HSD i9-11900H, GeForce RTX 3080 Laptop GPU: Ø154.4 (146-157)
Asus TUF Gaming F17 FX706HM i9-11900H, GeForce RTX 3060 Laptop GPU: Ø151.8 (133-160)
Asus ROG Zephyrus M16 GU603H i9-11900H, GeForce RTX 3070 Laptop GPU: Ø159.3 (130-175)
Dell Inspiron 16 Plus 7610-MHJ8F i7-11800H, UHD Graphics Xe 32EUs (Tiger Lake-H): Ø92.9 (78.7-119)
MSI Creator Z16 A11UET-209 i7-11800H, GeForce RTX 3060 Laptop GPU: Ø113.9 (94-136)
Alienware m15 R6, i7-11800H RTX 3080 i7-11800H, GeForce RTX 3080 Laptop GPU: Ø138.8 (135.59-146.6)
Lenovo ThinkPad X1 Extreme G4-20Y5CTO1WW (3050 Ti) i7-11800H, GeForce RTX 3050 Ti Laptop GPU: Ø105.9 (100-118)
ADATA XPG Xenia 15 i7-11800H, GeForce RTX 3070 Laptop GPU: Ø132.5 (132-134)
Lenovo ThinkPad P1 G4-20Y30017GE i7-11800H, T1200 Laptop GPU: Ø73.5 (70.5-85.4)
Alienware x15 RTX 3070 P111F i7-11800H, GeForce RTX 3070 Laptop GPU: Ø155 (152-157)
HP Omen 16-b0085ng i7-11800H, GeForce RTX 3070 Laptop GPU: Ø148.7 (140.9-152.79)
Alienware x17 RTX 3080 P48E i7-11800H, GeForce RTX 3080 Laptop GPU: Ø158.7 (156-161)
SCHENKER XMG Focus 15 i7-11800H, GeForce RTX 3050 Ti Laptop GPU: Ø85.9 (82.7-88.2)
SCHENKER XMG Focus 17 i7-11800H, GeForce RTX 3050 Ti Laptop GPU: Ø102.8 (98.5-113)
Razer Blade 17 RTX 3070 i7-11800H, GeForce RTX 3070 Laptop GPU: Ø185.1 (183-187)
Lenovo ThinkPad P15 G2-20YQ001JGE i7-11800H, RTX A3000 Laptop GPU: Ø120.1 (117-124)
Maingear Vector Pro MG-VCP17 i7-11800H, GeForce RTX 3080 Laptop GPU: Ø120 (118-124)
Lenovo ThinkPad P17 G2-20YU0025G i7-11800H, RTX A2000 Laptop GPU: Ø141.4 (139-143)
SCHENKER XMG NEO 17 GM7TG8S i7-11800H, GeForce RTX 3080 Laptop GPU: Ø121.4 (112.3-123.46)
Dell Inspiron 16 Plus 7610 i7-11800H, GeForce RTX 3050 4GB Laptop GPU: Ø91.2 (59.1-115)
MSI Katana GF66 11UG-220 i7-11800H, GeForce RTX 3070 Laptop GPU: Ø72.6 (62.7-76.2)
Dell XPS 15 9510 11800H RTX 3050 Ti OLED i7-11800H, GeForce RTX 3050 Ti Laptop GPU: Ø119.2 (105-126)
Dell XPS 17 9710 Core i7 RTX 3060 i7-11800H, GeForce RTX 3060 Laptop GPU: Ø124.4 (116-131)
Razer Blade 15 Advanced (Mid 2021) i7-11800H, GeForce RTX 3080 Laptop GPU: Ø148.3 (145-152)
Gigabyte Aero 15 OLED XD i7-11800H, GeForce RTX 3070 Laptop GPU: Ø132.2 (130-138)
Asus TUF Gaming F15 FX506HM i7-11800H, GeForce RTX 3060 Laptop GPU: Ø148.8 (144-152)
SCHENKER XMG Neo 15 Tiger Lake i7-11800H, GeForce RTX 3080 Laptop GPU: Ø99.7 (98.4-101)
MSI Katana GF76 11UE i7-11800H, GeForce RTX 3060 Laptop GPU: Ø95.2 (88.8-108)
Aorus 15P YD i7-11800H, GeForce RTX 3080 Laptop GPU: Ø151.5 (149-154)
Aorus 17G YD i7-11800H, GeForce RTX 3080 Laptop GPU: Ø158.9 (156-161)
Dell Inspiron 15 5518-2X3JR i5-11300H, GeForce MX450: Ø31.5 (22.7-56.8)
Dell Inspiron 13 5310-NJ24J i5-11300H, GeForce MX450: Ø57.4 (51.2-68)
Acer Nitro 5 AN517-53-54DQ i5-11300H, GeForce RTX 3050 4GB Laptop GPU: Ø66.2 (65.3-68.4)
Lenovo IdeaPad 5 Pro 16IHU6 i5-11300H, GeForce MX450: Ø65 (61.1-67.9)
Gigabyte G5 GD i5-11400H, GeForce RTX 3050 4GB Laptop GPU: Ø95.9 (93.1-109)
Dell XPS 15 9510 i5 11400H FHD i5-11400H, UHD Graphics Xe 16EUs (Tiger Lake-H): Ø66.4 (59.4-77.8)
MSI GE76 Raider 11UH-472US i9-11980HK, GeForce RTX 3080 Laptop GPU: Ø101.8 (100-105)
Gigabyte Aero 17 HDR YD i9-11980HK, GeForce RTX 3080 Laptop GPU: Ø159.8 (153-167)
Lenovo ThinkPad P1 G4-20Y4S0KS00 i7-11850H, GeForce RTX 3070 Laptop GPU: Ø106.7 (103-123)
Dell Precision 5000 5560 i7-11850H, RTX A2000 Laptop GPU: Ø90 (80-115)
Lenovo Legion S7 15ACH6 82K80030GE R9 5900HX, GeForce RTX 3060 Laptop GPU: Ø113.3 (111-122)
MSI Delta 15 A5EFK R9 5900HX, Radeon RX 6700M: Ø89.3 (86.9-97.1)
Asus Vivobook Pro 16X-M7600QE R9 5900HX, GeForce RTX 3050 Ti Laptop GPU: Ø70.5 (62.3-82)
Gigabyte A7 X1 R9 5900HX, GeForce RTX 3070 Laptop GPU: Ø91.1 (86.1-99.7)
Lenovo Yoga Slim 7 Pro 14ACH5 R9 5900HX, Vega 8: Ø58.7 (58.2-59.3)
Medion Erazer Beast X25 R9 5900HX, GeForce RTX 3080 Laptop GPU: Ø91 (90.2-92.7)
Asus ROG Strix Scar 15 G533QS R9 5900HX, GeForce RTX 3080 Laptop GPU: Ø100.8 (98.4-105)
Lenovo Legion 7 16ACHg6 R9 5900HX, GeForce RTX 3080 Laptop GPU: Ø107.5 (97-110)
SCHENKER XMG Apex 17 M21 R7 5800H, GeForce RTX 3070 Laptop GPU: Ø114.4 (108-121)
Dell G15 5515 R7 5800H, GeForce RTX 3050 Ti Laptop GPU: Ø84.6 (79.6-93.7)
HP Victus 16-e0179ng R7 5800H, GeForce RTX 3060 Laptop GPU: Ø66.4 (65.8-67)
Huawei MateBook 16 R7 5800H R7 5800H, Vega 8: Ø79.3 (73.6-86.9)
Lenovo Legion 5 15ACH-82JU00C6GE-FL R7 5800H, GeForce RTX 3060 Laptop GPU: Ø86.3 (80.5-93.5)
Asus ROG Strix G17 G713QE-RB74 R7 5800H, GeForce RTX 3050 Ti Laptop GPU: Ø114 (113-115)
Acer Nitro 5 AN515-45-R1JH R7 5800H, GeForce RTX 3070 Laptop GPU: Ø87.3 (84.6-91)
Lenovo IdeaPad 5 Pro 16ACH R7 5800H, GeForce GTX 1650 Mobile: Ø53.9 (49.4-60.7)
Acer Nitro 5 AN517-41-R9S5 R7 5800H, GeForce RTX 3080 Laptop GPU: Ø89 (87.1-94.9)
Lenovo Legion 5 Pro 16ACH6H (82JQ001PGE) R7 5800H, GeForce RTX 3070 Laptop GPU: Ø92.5 (86.85-100.18)
Asus TUF Gaming A15 FA506QR-AZ061T R7 5800H, GeForce RTX 3070 Laptop GPU: Ø100.8 (82.7-115)
Acer Nitro 5 AN517-41-R5Z7 R7 5800H, GeForce RTX 3070 Laptop GPU: Ø98.1 (96.4-104)
Alienware m15 R5 Ryzen Edition R7 5800H, GeForce RTX 3060 Laptop GPU: Ø95.6 (91.5-108)
Asus VivoBook 15 Pro M3500QC-L1062 R5 5600H, GeForce RTX 3050 4GB Laptop GPU: Ø61.2 (53.3-73)
Acer Nitro 5 AN515-45-R05E R5 5600H, GeForce GTX 1650 Mobile: Ø71.6 (70.1-77)
Asus Zephyrus G14 GA401QEC R9 5900HS, GeForce RTX 3050 Ti Laptop GPU: Ø66.7 (57.1-107)
Asus Zephyrus G14 GA401QM R9 5900HS, GeForce RTX 3060 Laptop GPU: Ø99.2 (96.1-112)
Average AMD Ryzen 7 5800H  : Ø87.4 (80.6-96.3)
Average Intel Core i7-11800H  : Ø119.8 (112-123.8)

Zen 3 Cezanne takes the trophy this time, but Alder Lake is right on its heels

Overall, it looks like AMD's investments into improving the power consumption with Zen 3 Cezanne have paid off well. Intel's first tryst with 10 nm has definitely been meritorious, but aspects related to power efficiency seem to have taken a hit. However, things may change this year. 

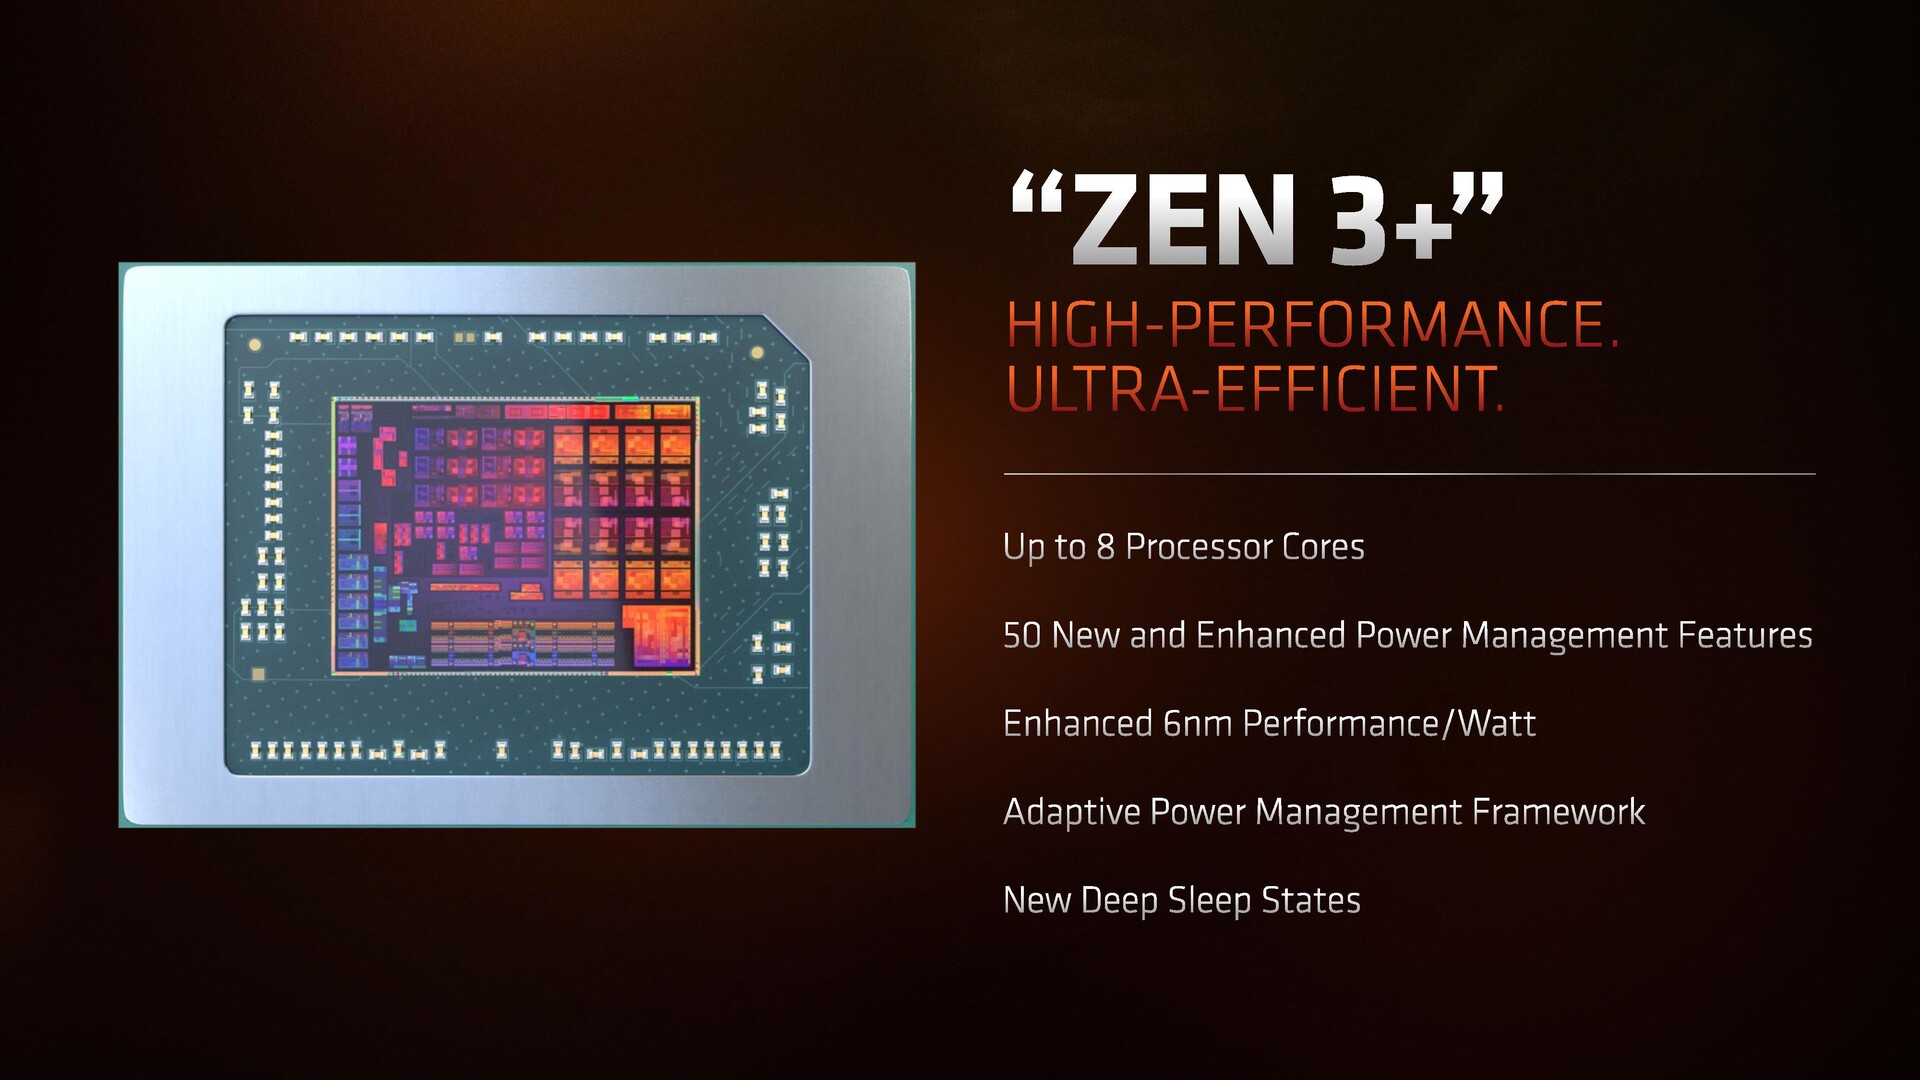
The AMD Ryzen 6000 Zen 3+ chips are based on the TSMC 6 nm process but largely carry forward the architectural improvements we saw with Ryzen 5000. AMD did say that Zen 3+ offers additional sleep states and improved power management leading to up to 24 hours of video playback time on battery, but this remains to be evaluated in real-world testing. Moreover, AMD's presentation did indicate 5 GHz designs at 35 W itself with the Ryzen 9 6980HS and at 45 W+ with the Ryzen 9 6980HX.

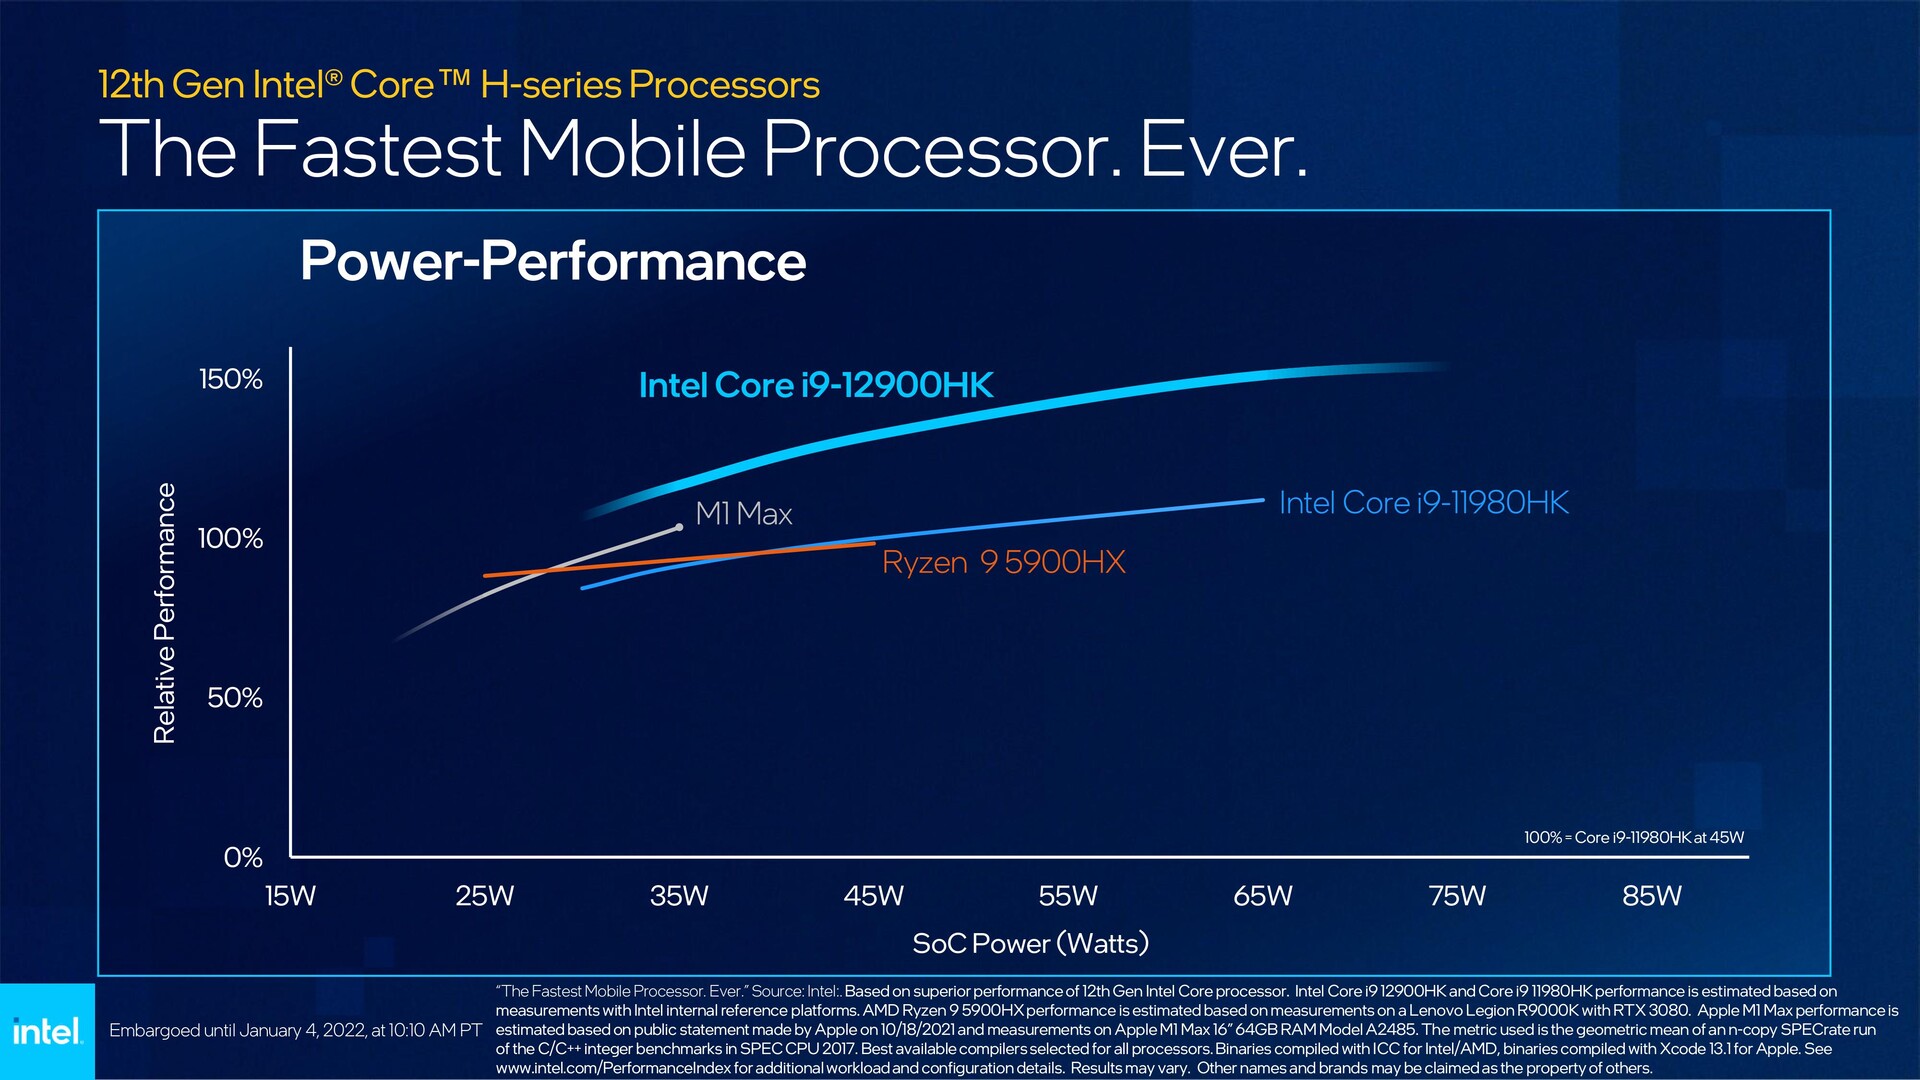
Intel Alder Lake, however, is the one to watch out for. With a heterogenous core architecture combined with improvements to OS scheduling in Windows 11, Alder Lake has the advantage of being able to delegate tasks to the E cores or P cores as the case may be in a more efficient manner. The Alder Lake Core i9-12900H and the Core i9-12900HK can offer 14 cores and 20 threads and hit 5 GHz at 45 W as well, so we are looking at higher core/thread counts and higher frequencies at a possibly competitive power consumption.

Intel claims Alder Lake's power efficiency will much higher than Apple M1 Max and AMD Zen 3 Cezanne SoCs. (Source: Intel)
AMD promises 50 new power management features and new deep sleep states. (Source: AMD)

The above data from the 73 laptop designs we had tested does paint an interesting picture. Of course, there are some limitations to this approach since each laptop chassis and cooling system is unique, which greatly affects performance. Also, performance and power do not always scale linearly till the entire duration of the test.

While we have considered Cinebench R15 Multi as our test of choice, these numbers may also change depending on the load used. For instance, the positioning of the processors may change when idle, lower loads, or even longer sustained loads are considered. Nevertheless, we hope that this comparison can serve to provide a broader perspective as to where Intel and AMD currently stand with respect to power efficiency.

We are yet to get the full low-level architectural details of both Alder Lake-H and Ryzen 6000 that will help us in better understanding power management improvements in this generation. Of course, the higher frequencies also mean higher PL2 values. The power efficiency in multi-core benchmarks will depend on how well the increased PL2 limits are sustained and for how long. A lot also depends on efficient chassis and cooling design by OEMs as well.

Hopefully, we will see better battery run times and a more power-efficient result from Intel this year that further closes the gap with AMD.

Buy the Asus ROG Strix G15 with Ryzen 9 5900HX and RTX 3060 on Amazon

Read all 15 comments / answer
static version load dynamic
Loading comments
Comment on this article
Please share our article, every link counts!
> Expert Reviews and News on Laptops, Smartphones and Tech Innovations > Contact > AMD Zen 3 Cezanne vs. Intel Tiger Lake-H 45 W power efficiency comparison: Ryzen 9 5900HS and Ryzen 5 5600H trounce the entire Tiger Lake-H lineup
Vaidyanathan Subramaniam (Update: 2023-01- 2)