 Deutsch
 English
 Español
 Français
 Italiano
 Nederlands
 Polski
 Português
 Русский
 Türkçe
 Svenska
 Chinese
 Magyar
2020 Razer Blade 15 Base Model Laptop Review: The 10th Gen Intel Comet Lake-H Update
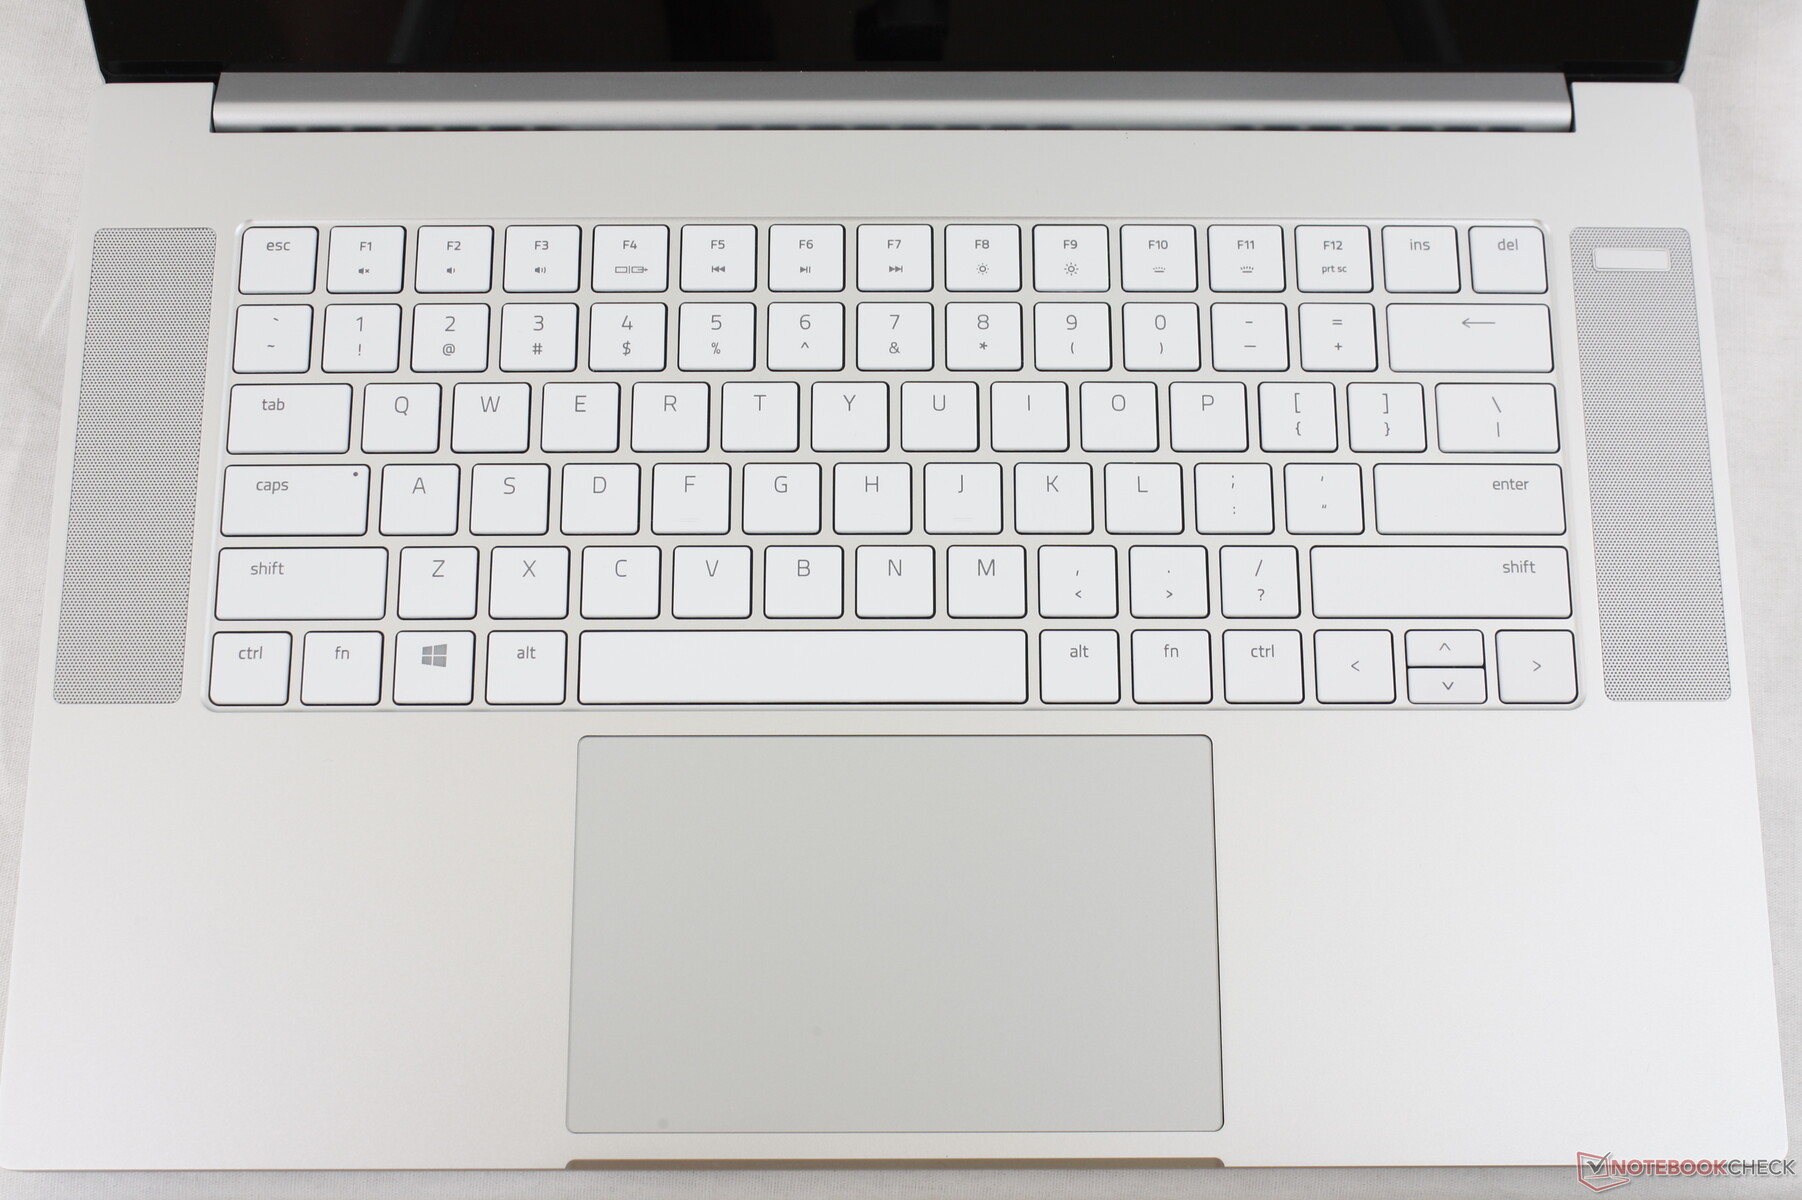
Announced just over a month ago, Razer have now begun shipping their 2020 Blade 15 SKUs to customers. The latest refresh incorporates a few changes both inside and out as detailed in our original announcement. In short, fans are getting a CPU update from 9th gen Coffee Lake-H to 10th gen Comet Lake-H, new display and GeForce Super GPU options, and a slightly revised keyboard layout.
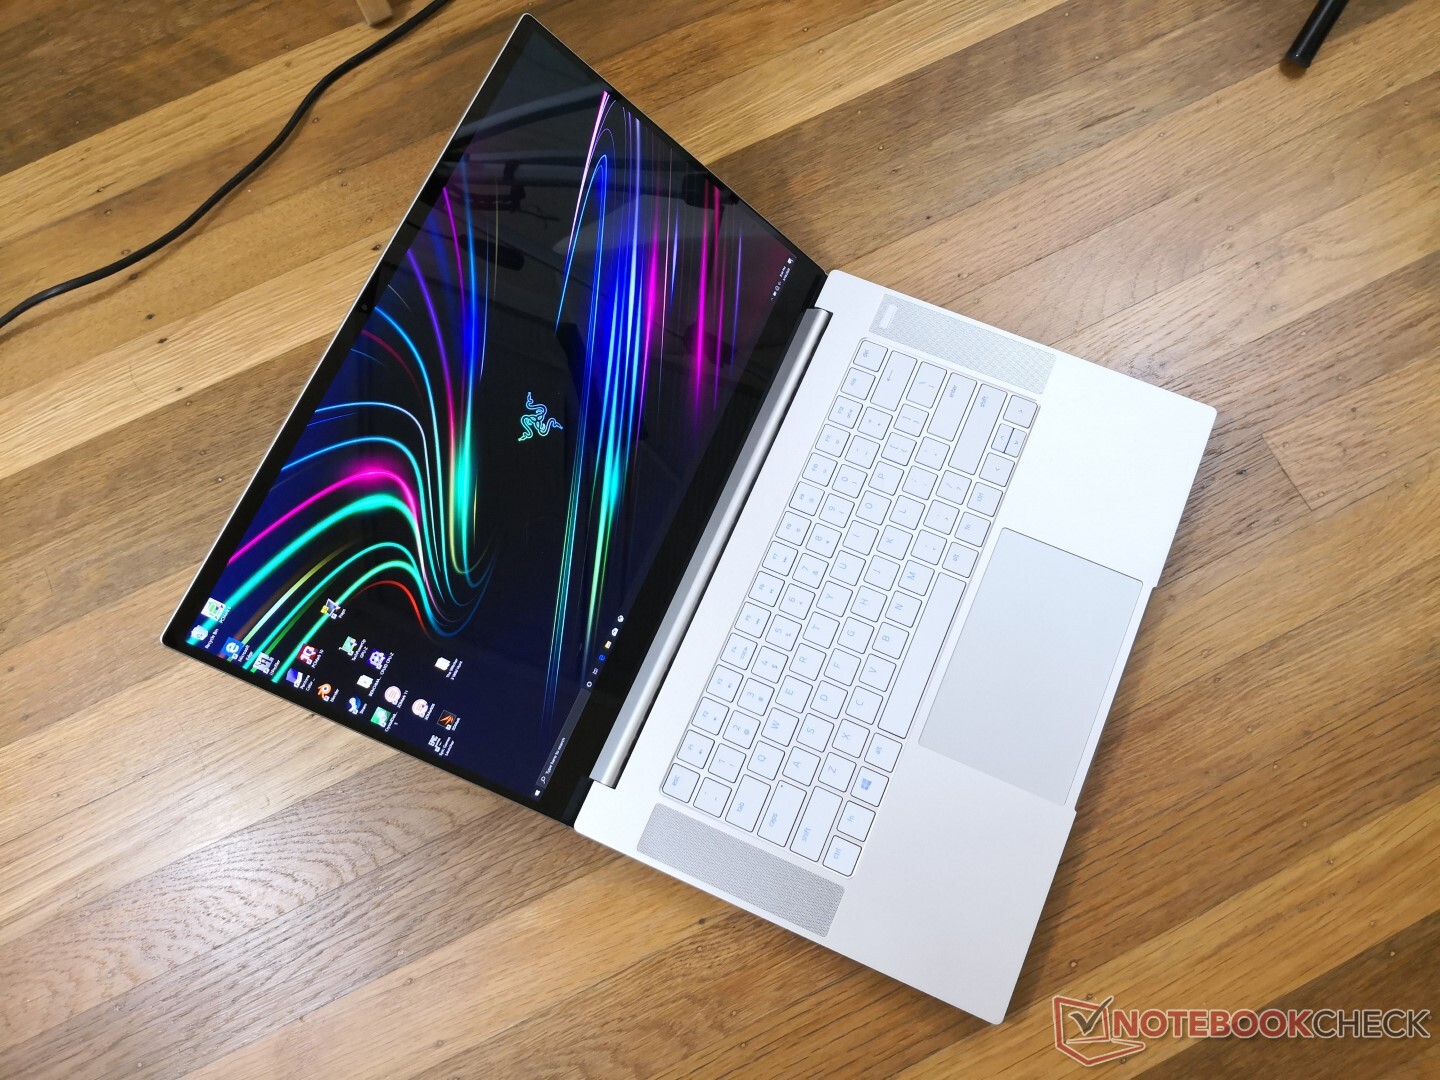
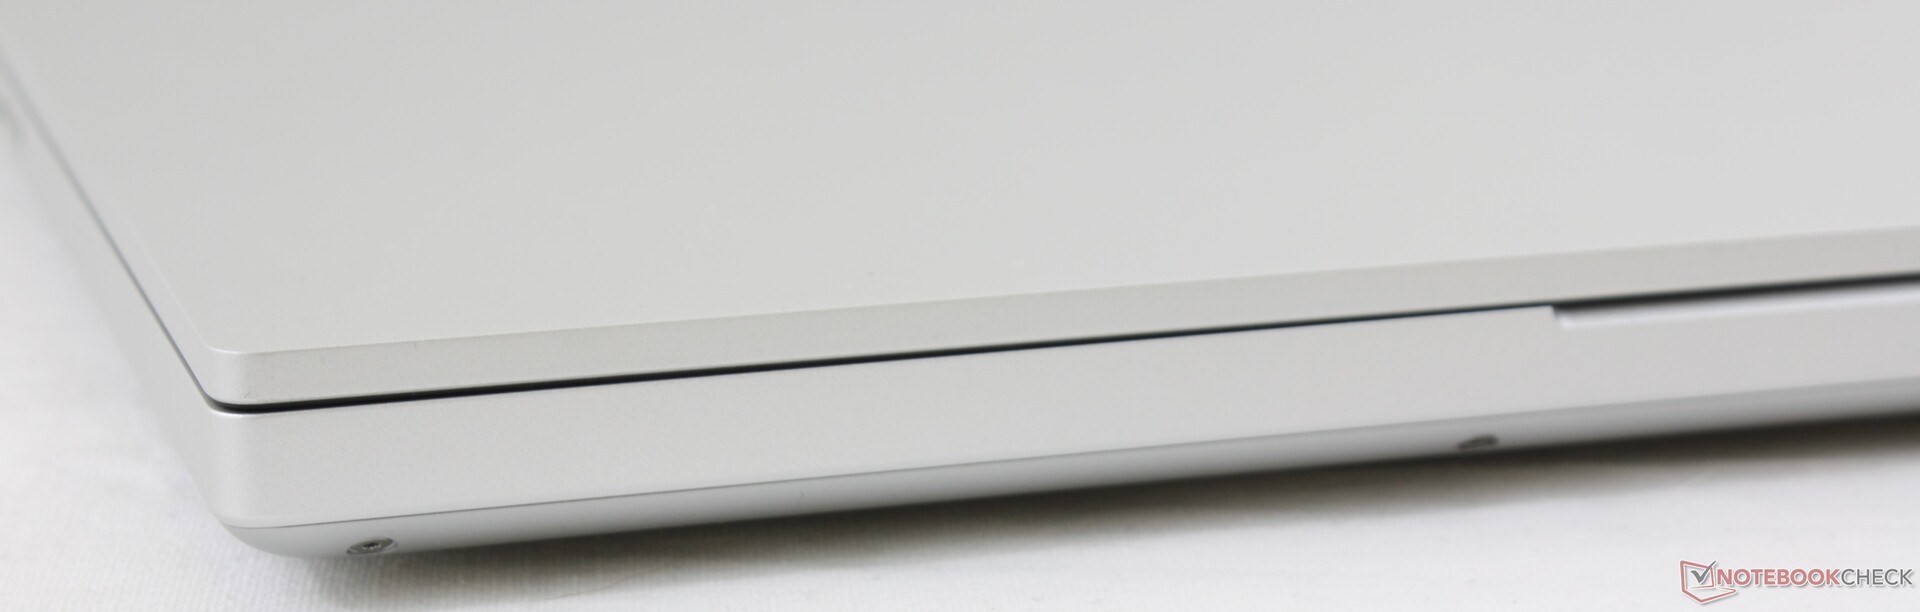
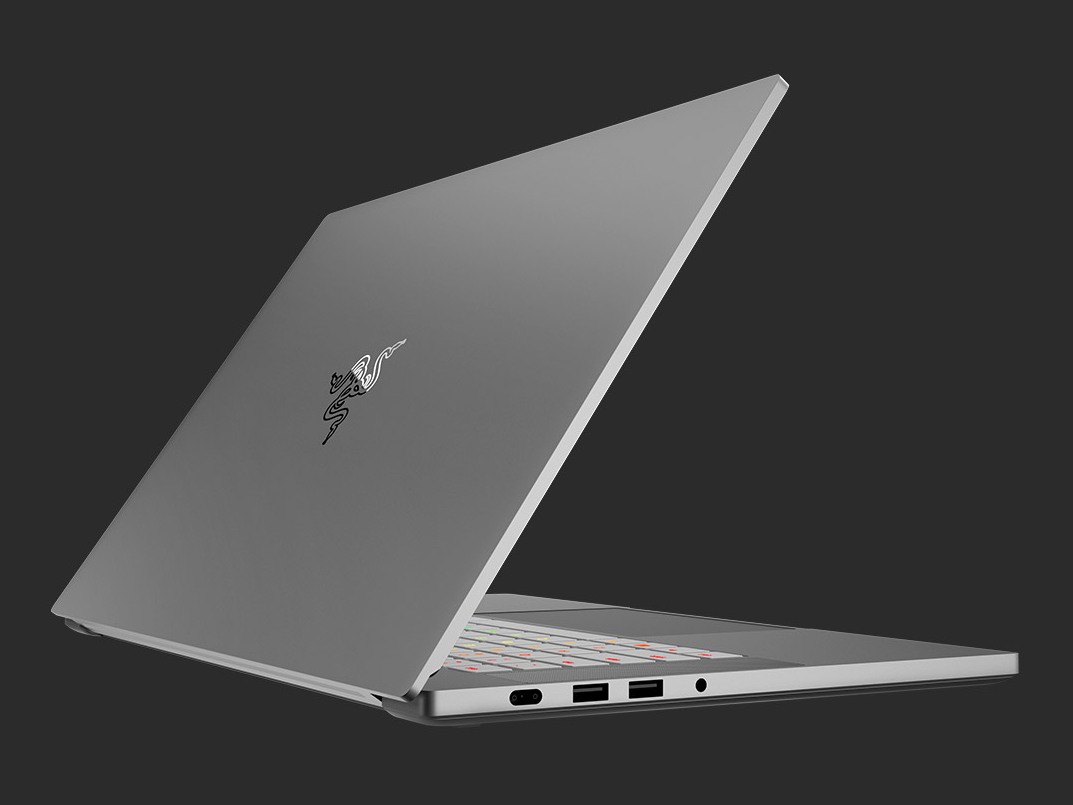
Our newest test unit is the 2020 Blade 15 Base Model in Mercury White equipped with the Core i7-10750H, GeForce RTX 2070 Max-Q, and 4K UHD OLED display. Some of these features were previously exclusive to the Blade 15 Advanced Model and so it's nice to see that they've trickled down to the less expensive Base Model. The system is otherwise almost visually identical to the 2019 Blade 15 Base Model and so we recommend checking out our existing reviews for more information on the chassis, ports, keyboard, clickpad, and other physical features. Our review below will focus on any performance differences users can expect.
Direct competitors to the Blade 15 include other super-thin 15.6-inch gaming laptops like the MSI GS66, Asus Zephyrus S GX502 or GX531, Lenovo Legion Y740-15, Gigabyte Aero 15, or the Acer Predator Triton 500.
More Razer reviews:
Rating | Date | Model | Weight | Height | Size | Resolution | Best Price |
|---|---|---|---|---|---|---|---|
| 86 % | 05/2020 | Razer Blade 15 RZ09-0328 i7-10750H, GeForce RTX 2070 Max-Q | 2.1 kg | 19.9 mm | 15.60" | 3840x2160 | |
| 84 % | 05/2020 | MSI GS66 10SGS i7-10750H, GeForce RTX 2080 Super Max-Q | 2.2 kg | 20 mm | 15.60" | 1920x1080 | |
| 81.5 % | 04/2019 | Asus Zephyrus S GX531GX i7-8750H, GeForce RTX 2080 Max-Q | 2.1 kg | 15.75 mm | 15.60" | 1920x1080 | |
| 85.8 % | 05/2020 | Gigabyte Aero 15 OLED XB-8DE51B0SP i7-10875H, GeForce RTX 2070 Super Max-Q | 2.2 kg | 20 mm | 15.60" | 3840x2160 | |
| 83 % | 09/2019 | Alienware m15 R2 P87F i7-9750H, GeForce RTX 2080 Max-Q | 2.2 kg | 18.3 mm | 15.60" | 1920x1080 | |
| 82.3 % | 11/2019 | Xiaomi Mi Gaming Laptop 2019 i7-9750H, GeForce RTX 2060 Mobile | 2.6 kg | 21 mm | 15.60" | 1920x1080 |
Case
Connectivity
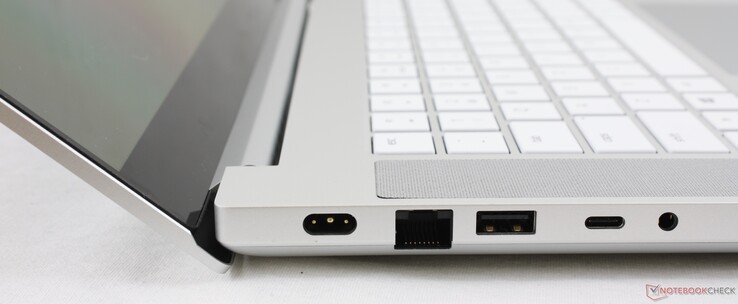
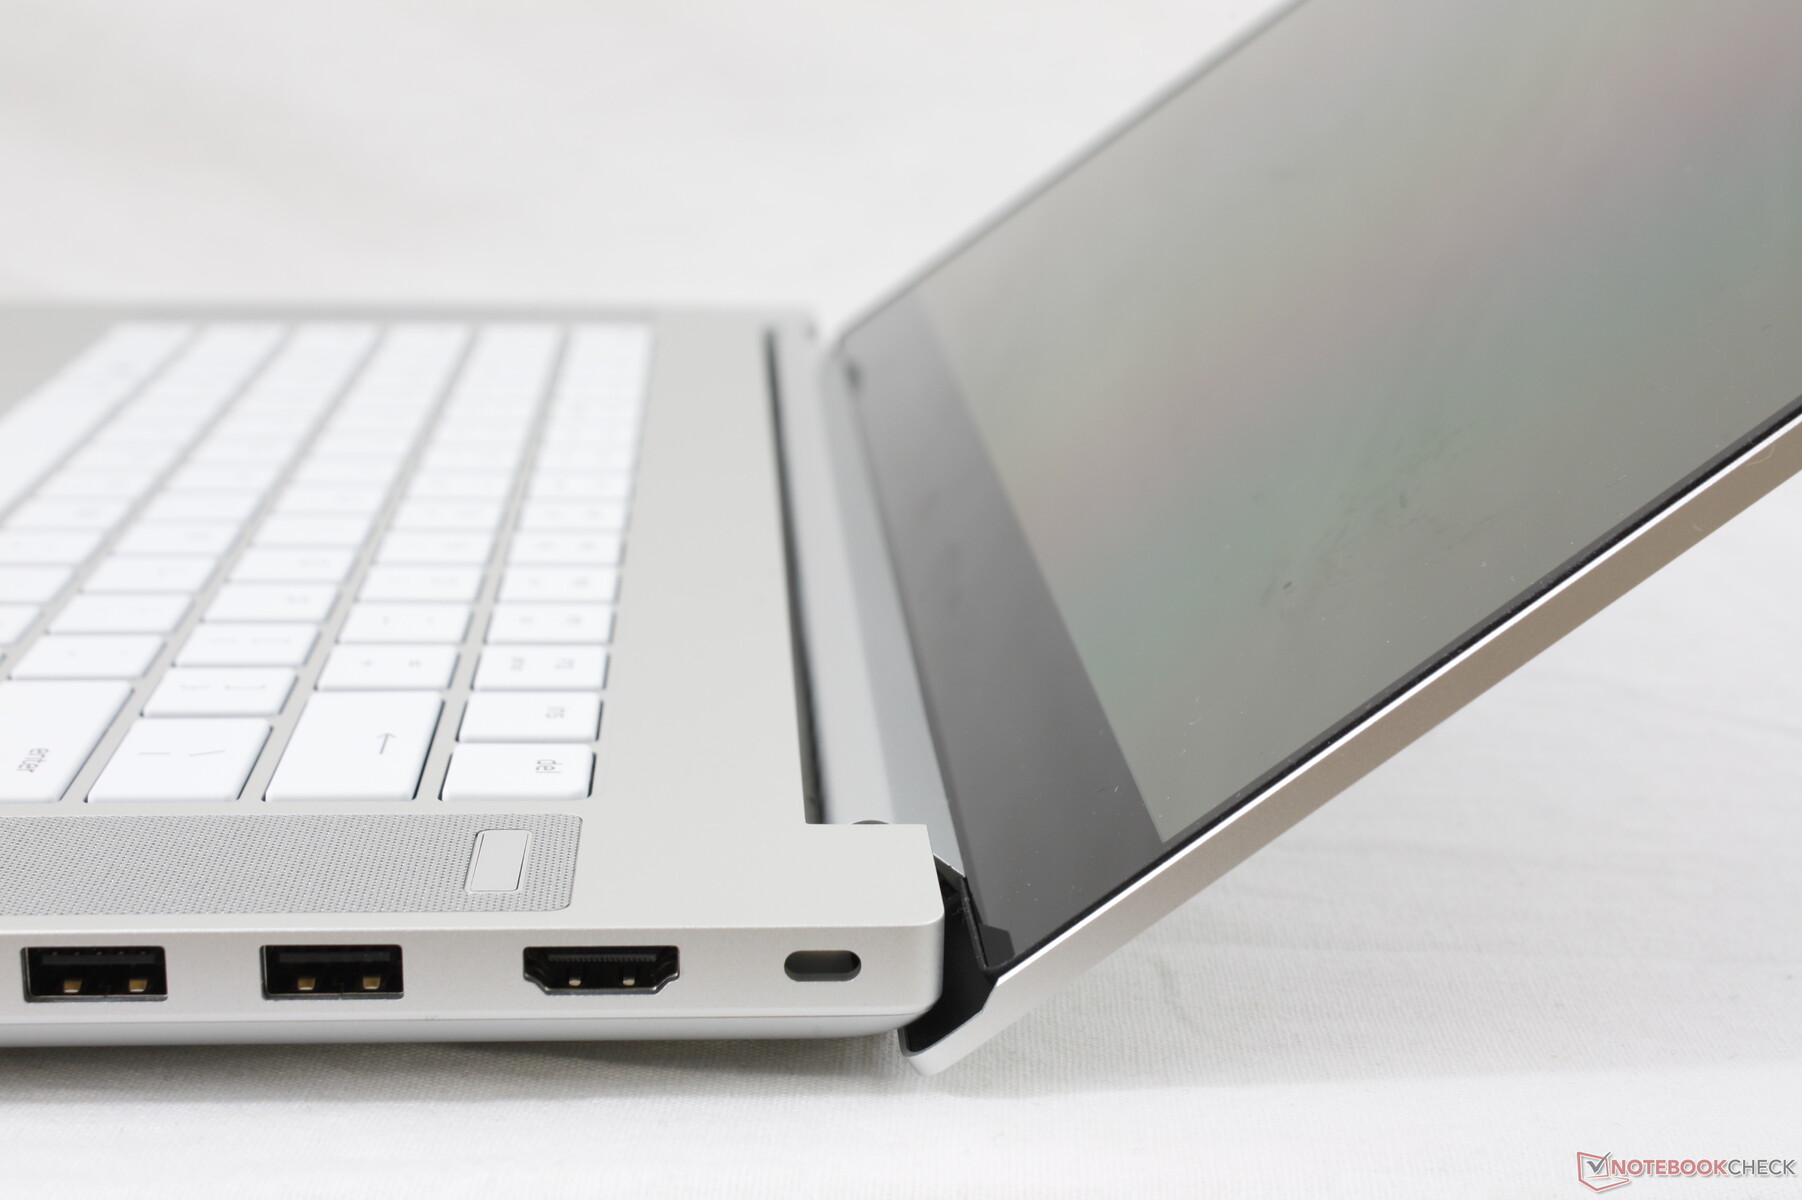
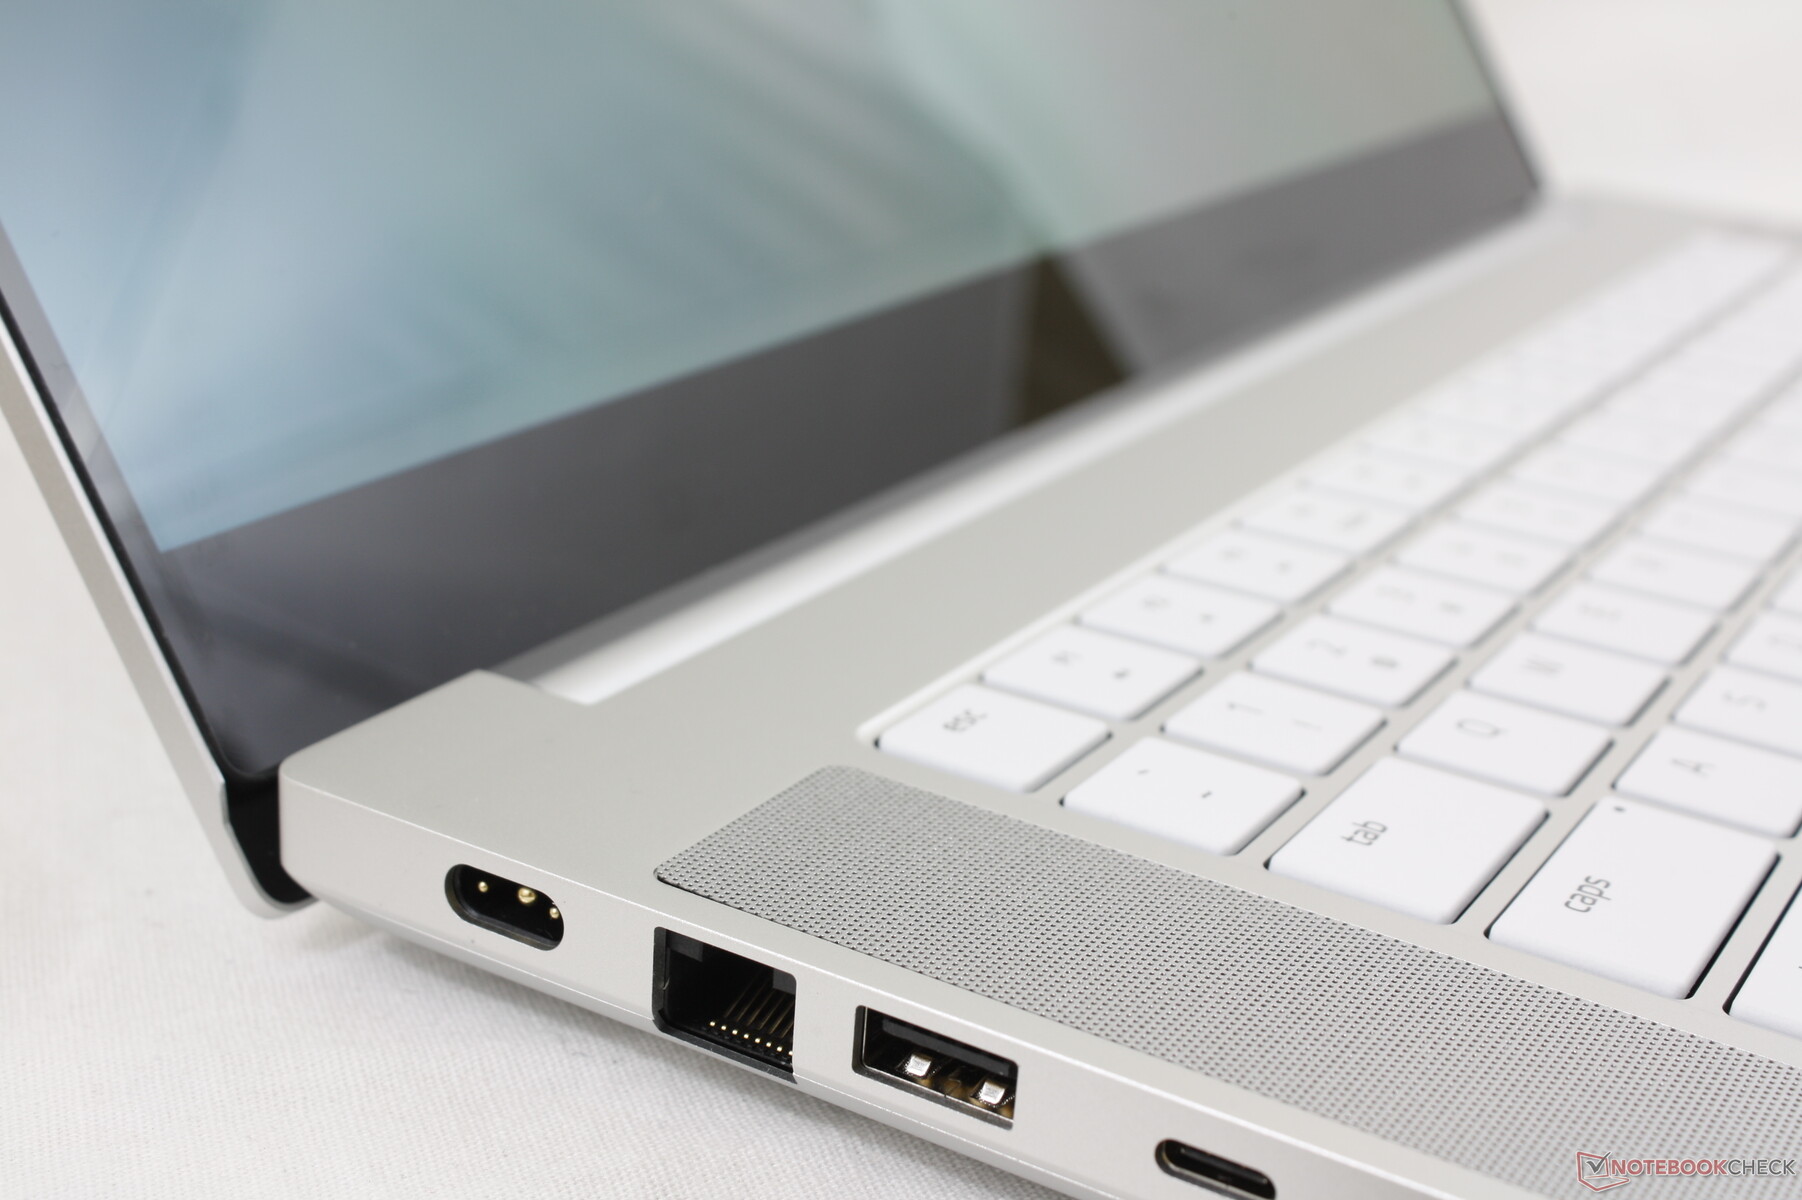
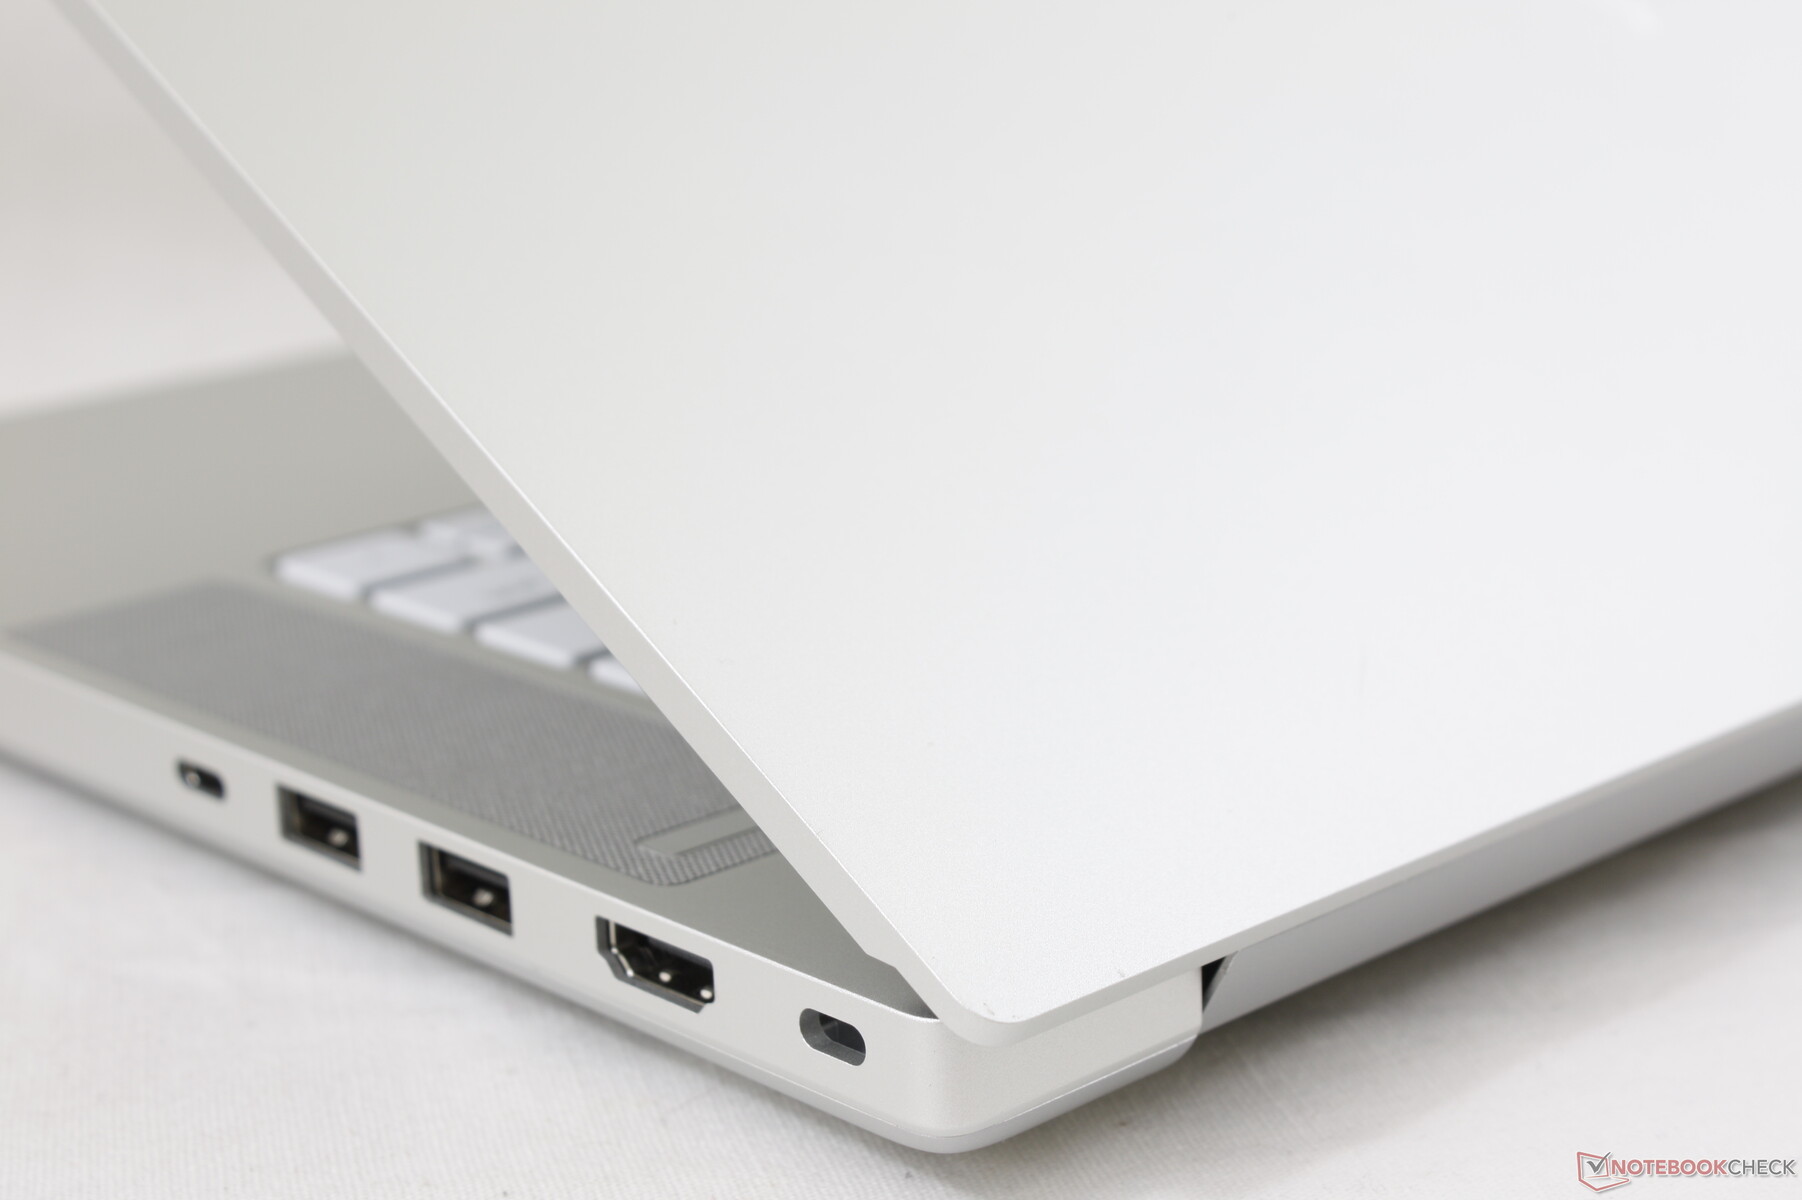
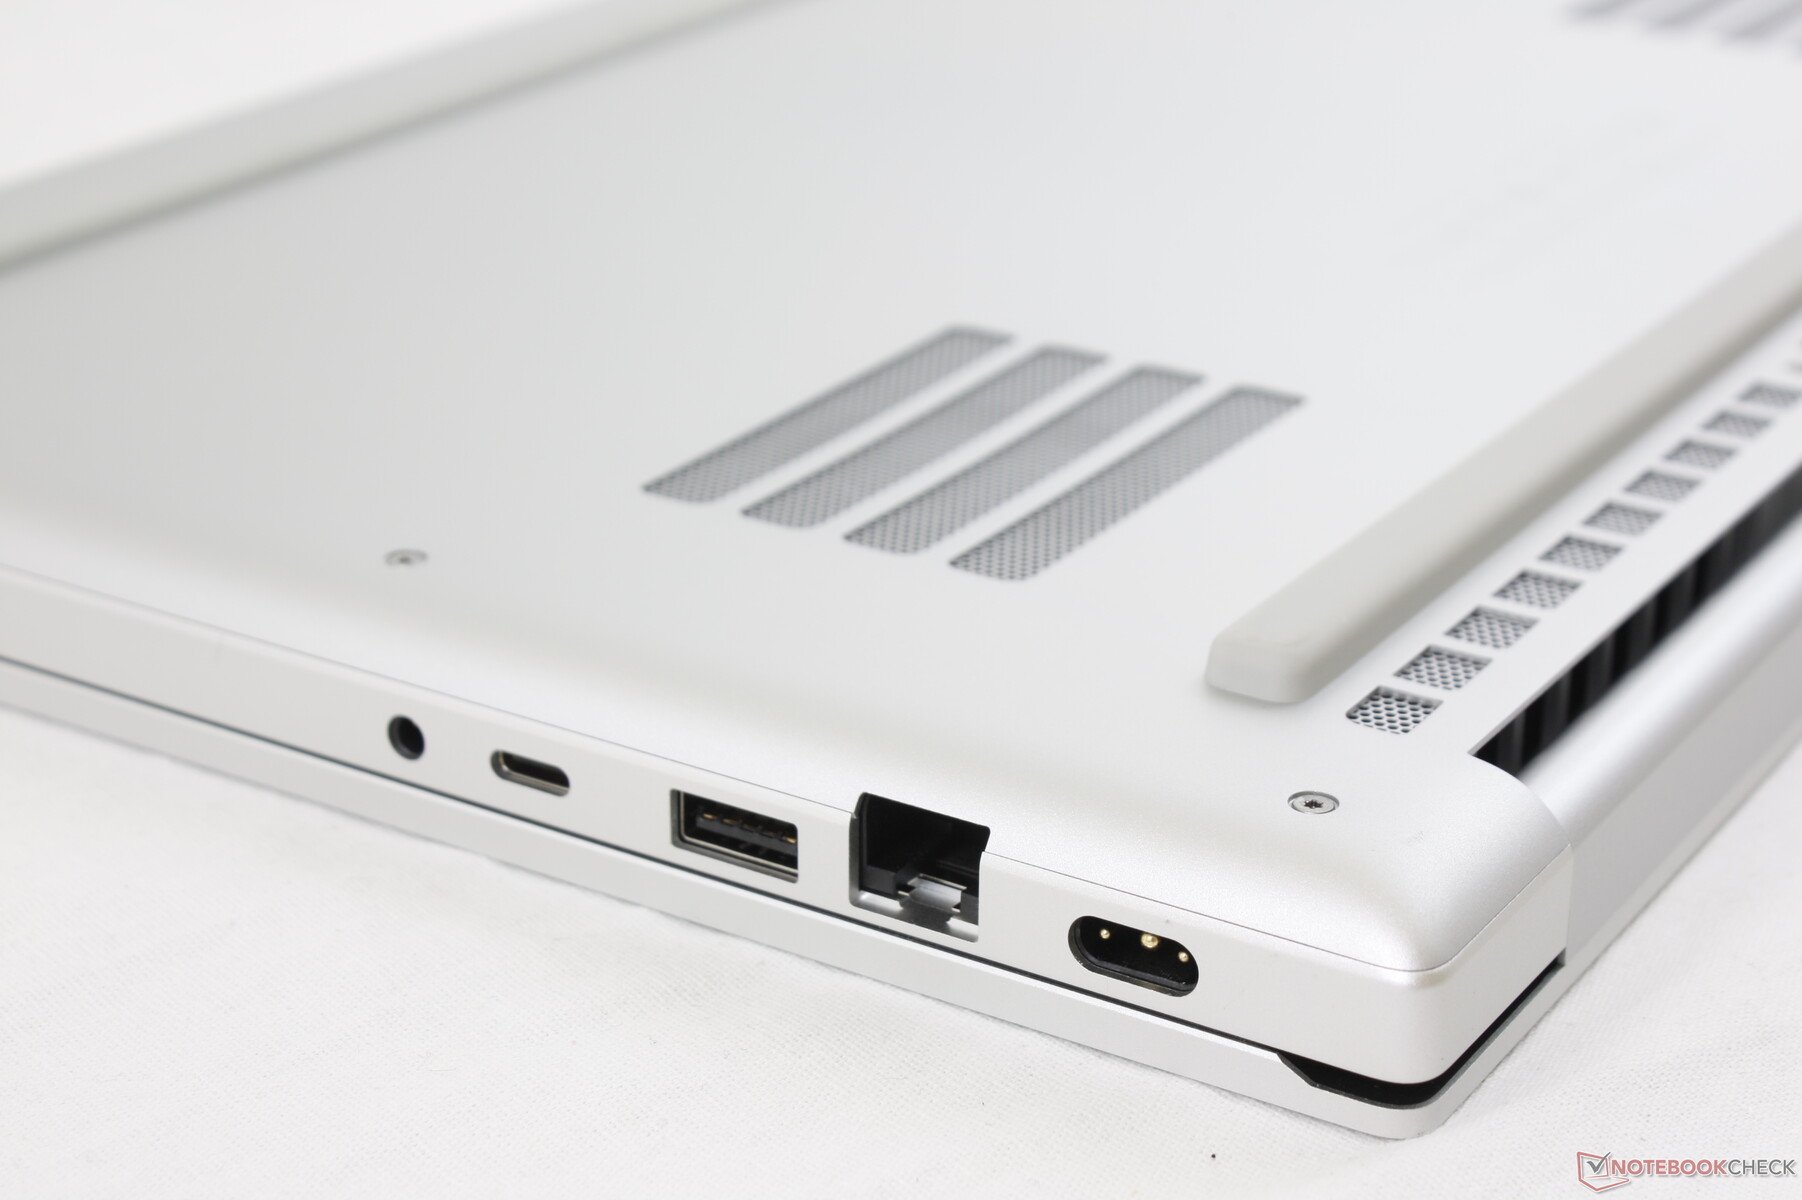
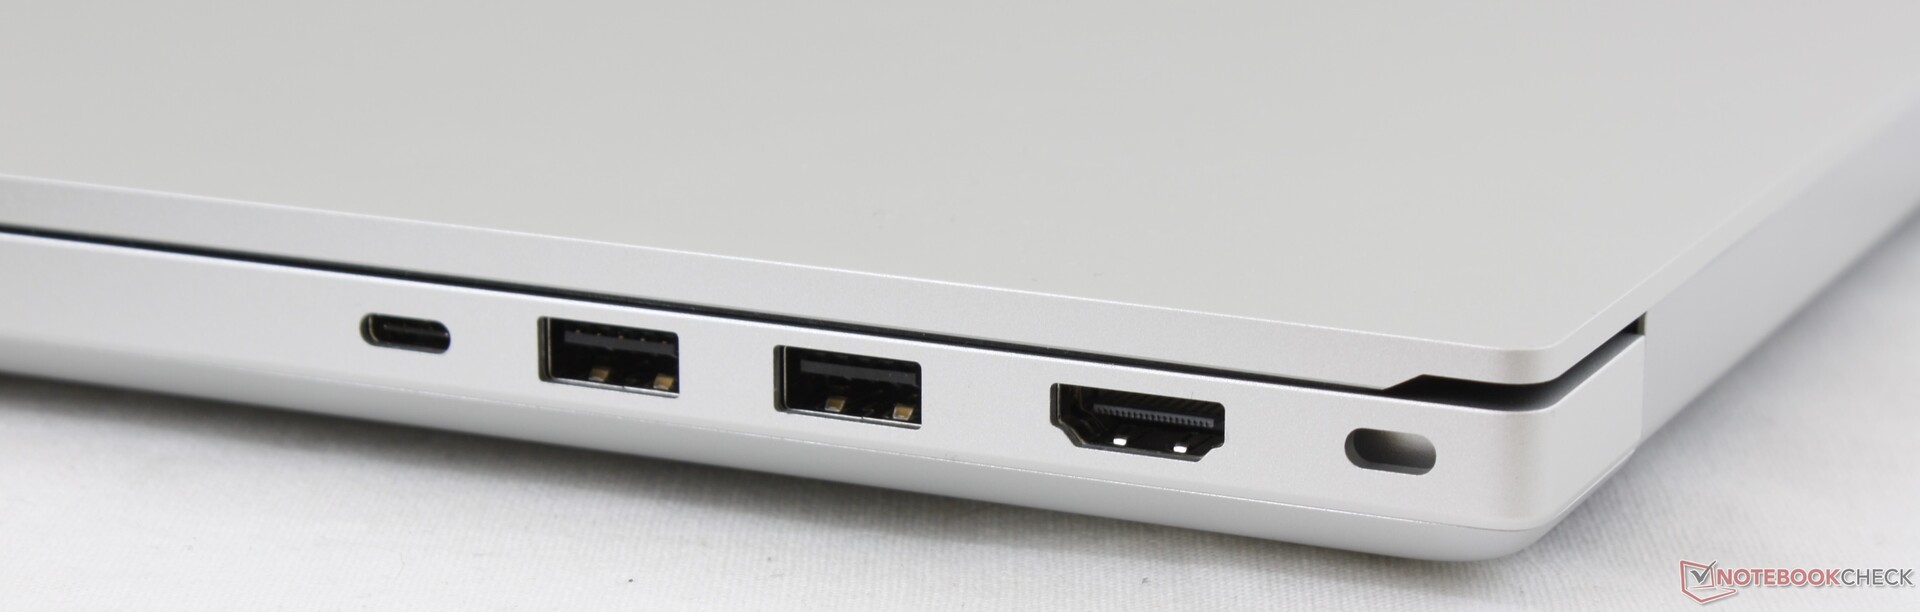
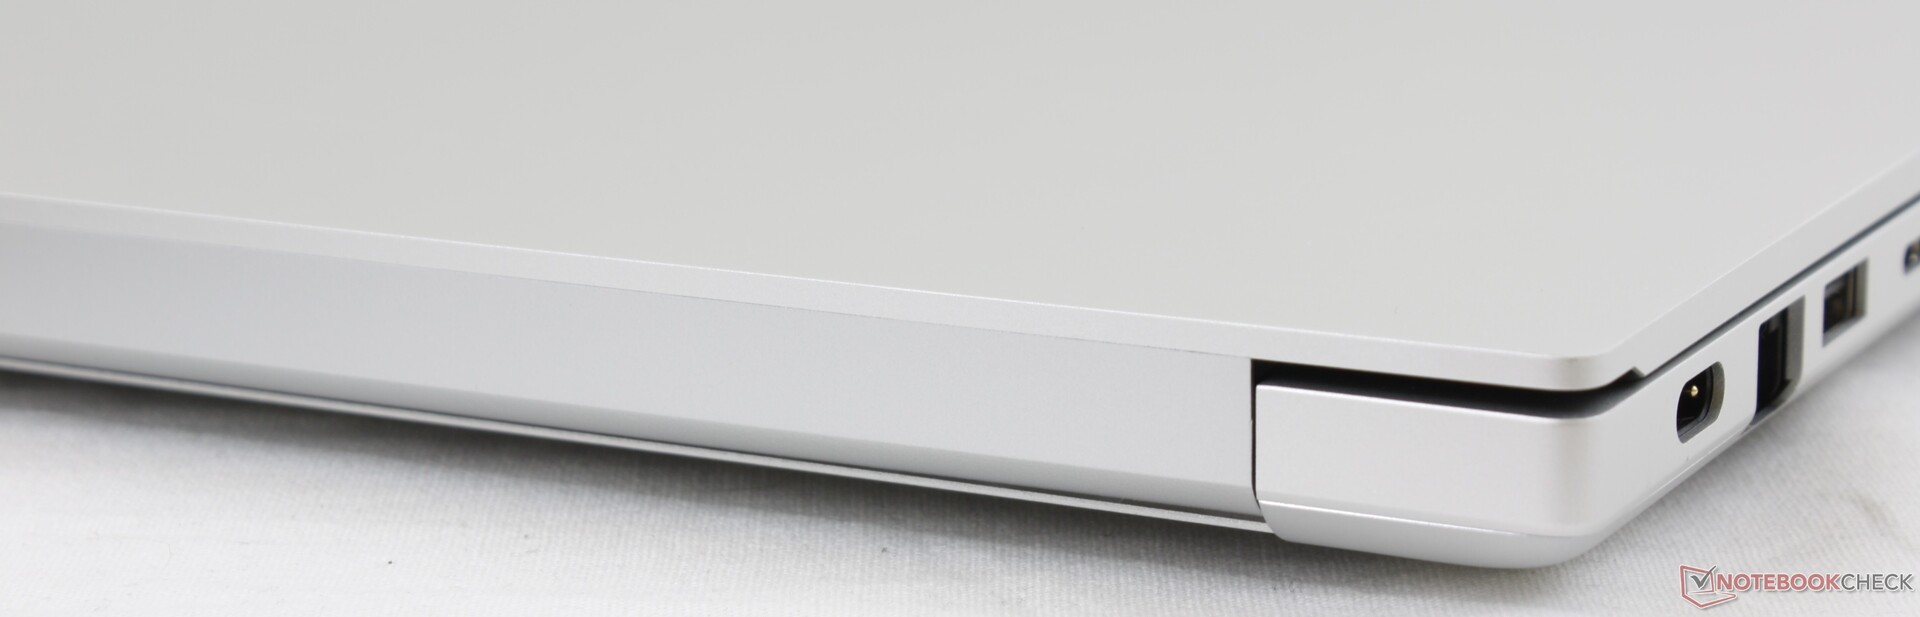
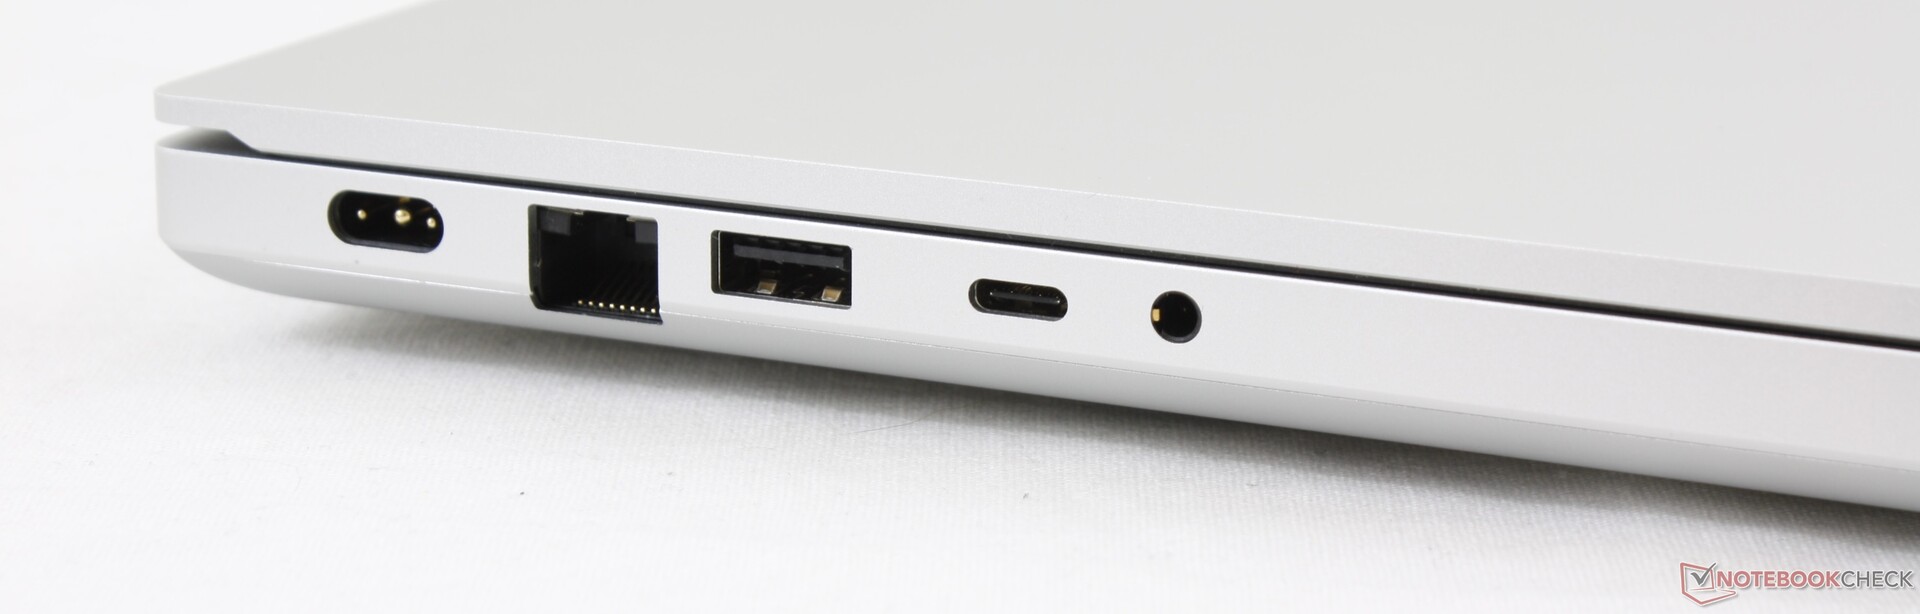
Ports have changed from the 2019 Blade 15 Base Model. The USB Type-A ports have been re-positioned, there is an extra USB Type-C port, and the mini-DisplayPort is now gone.
The system cannot be recharged via USB Type-C as that feature is reserved only for the 2020 Blade 15 Advanced Model.
Communication
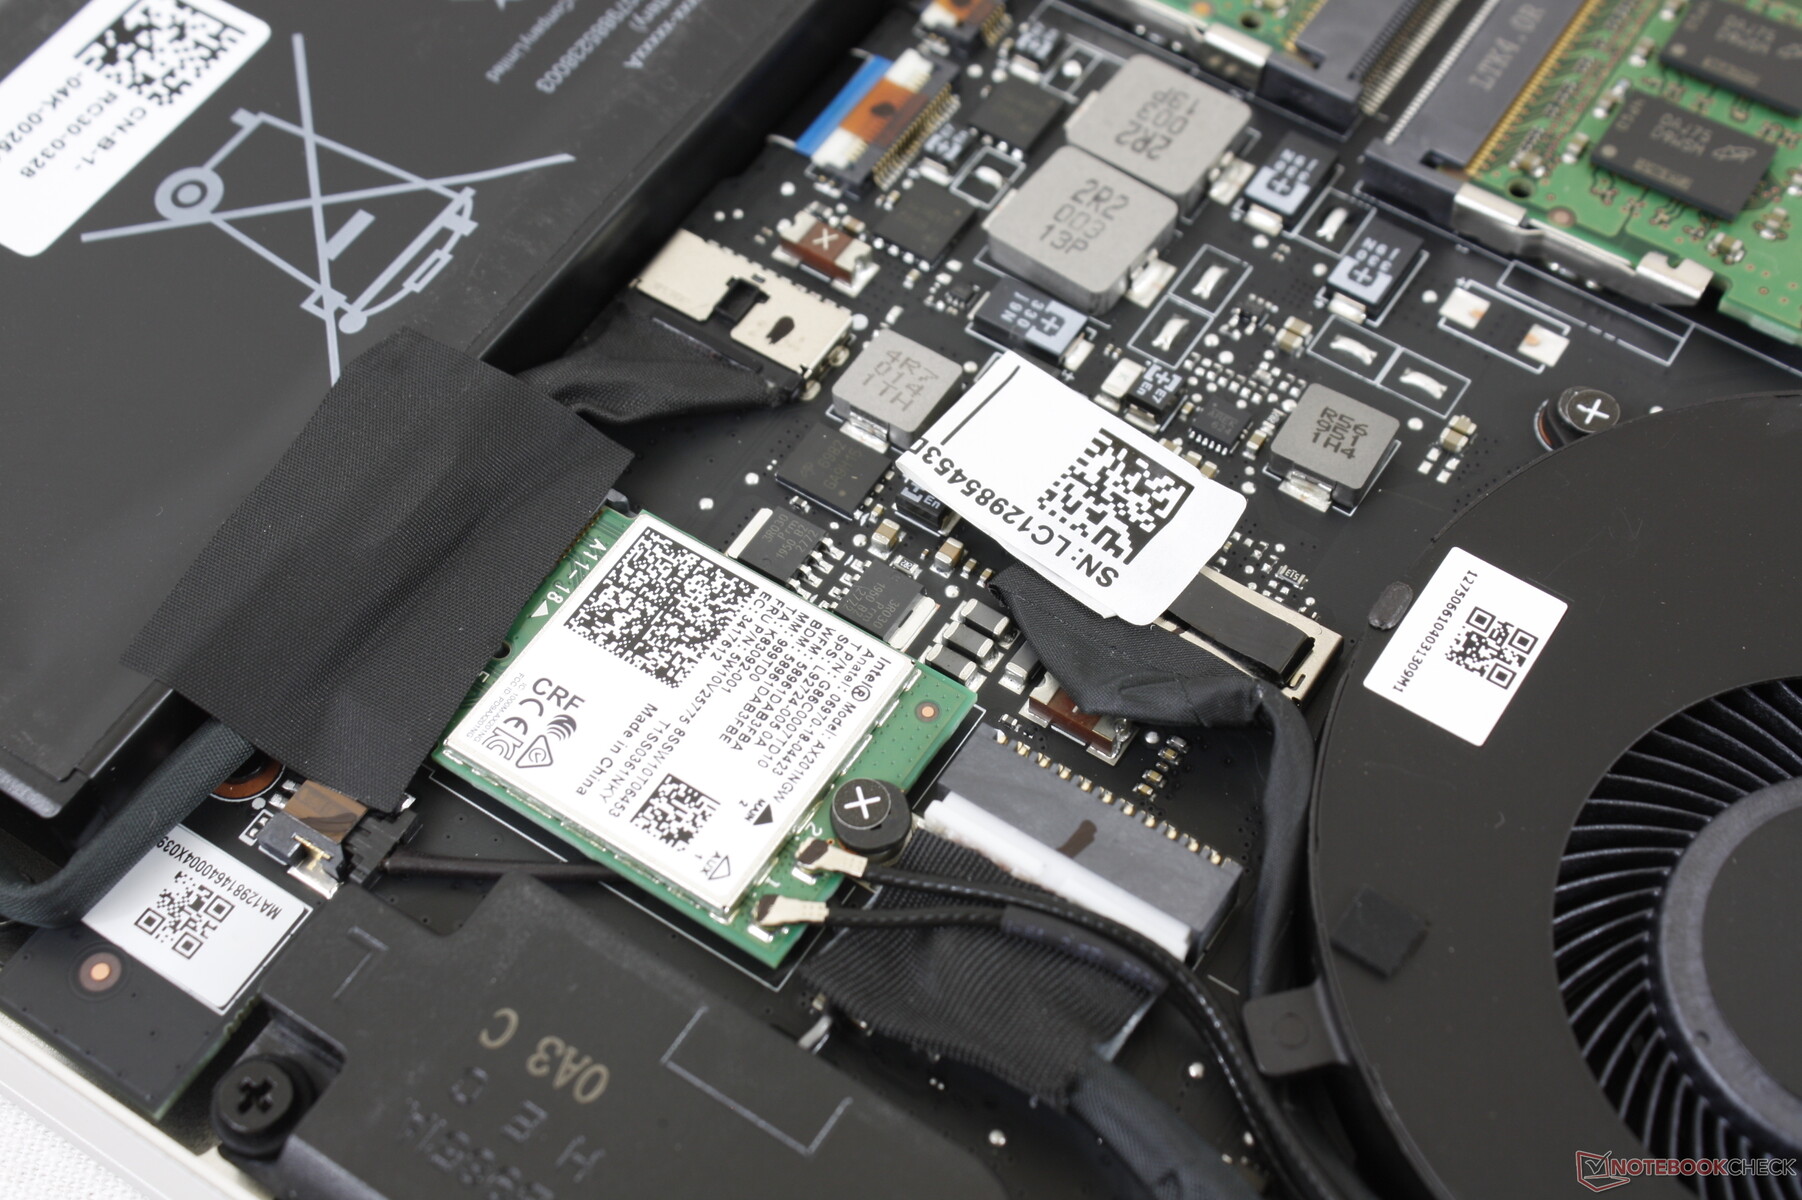
Intel AX201 comes standard for Wi-Fi 6 connectivity and Bluetooth 5.1. We experienced no connection issues when paired with our Netgear RAX200 test router.
Webcam


Maintenance
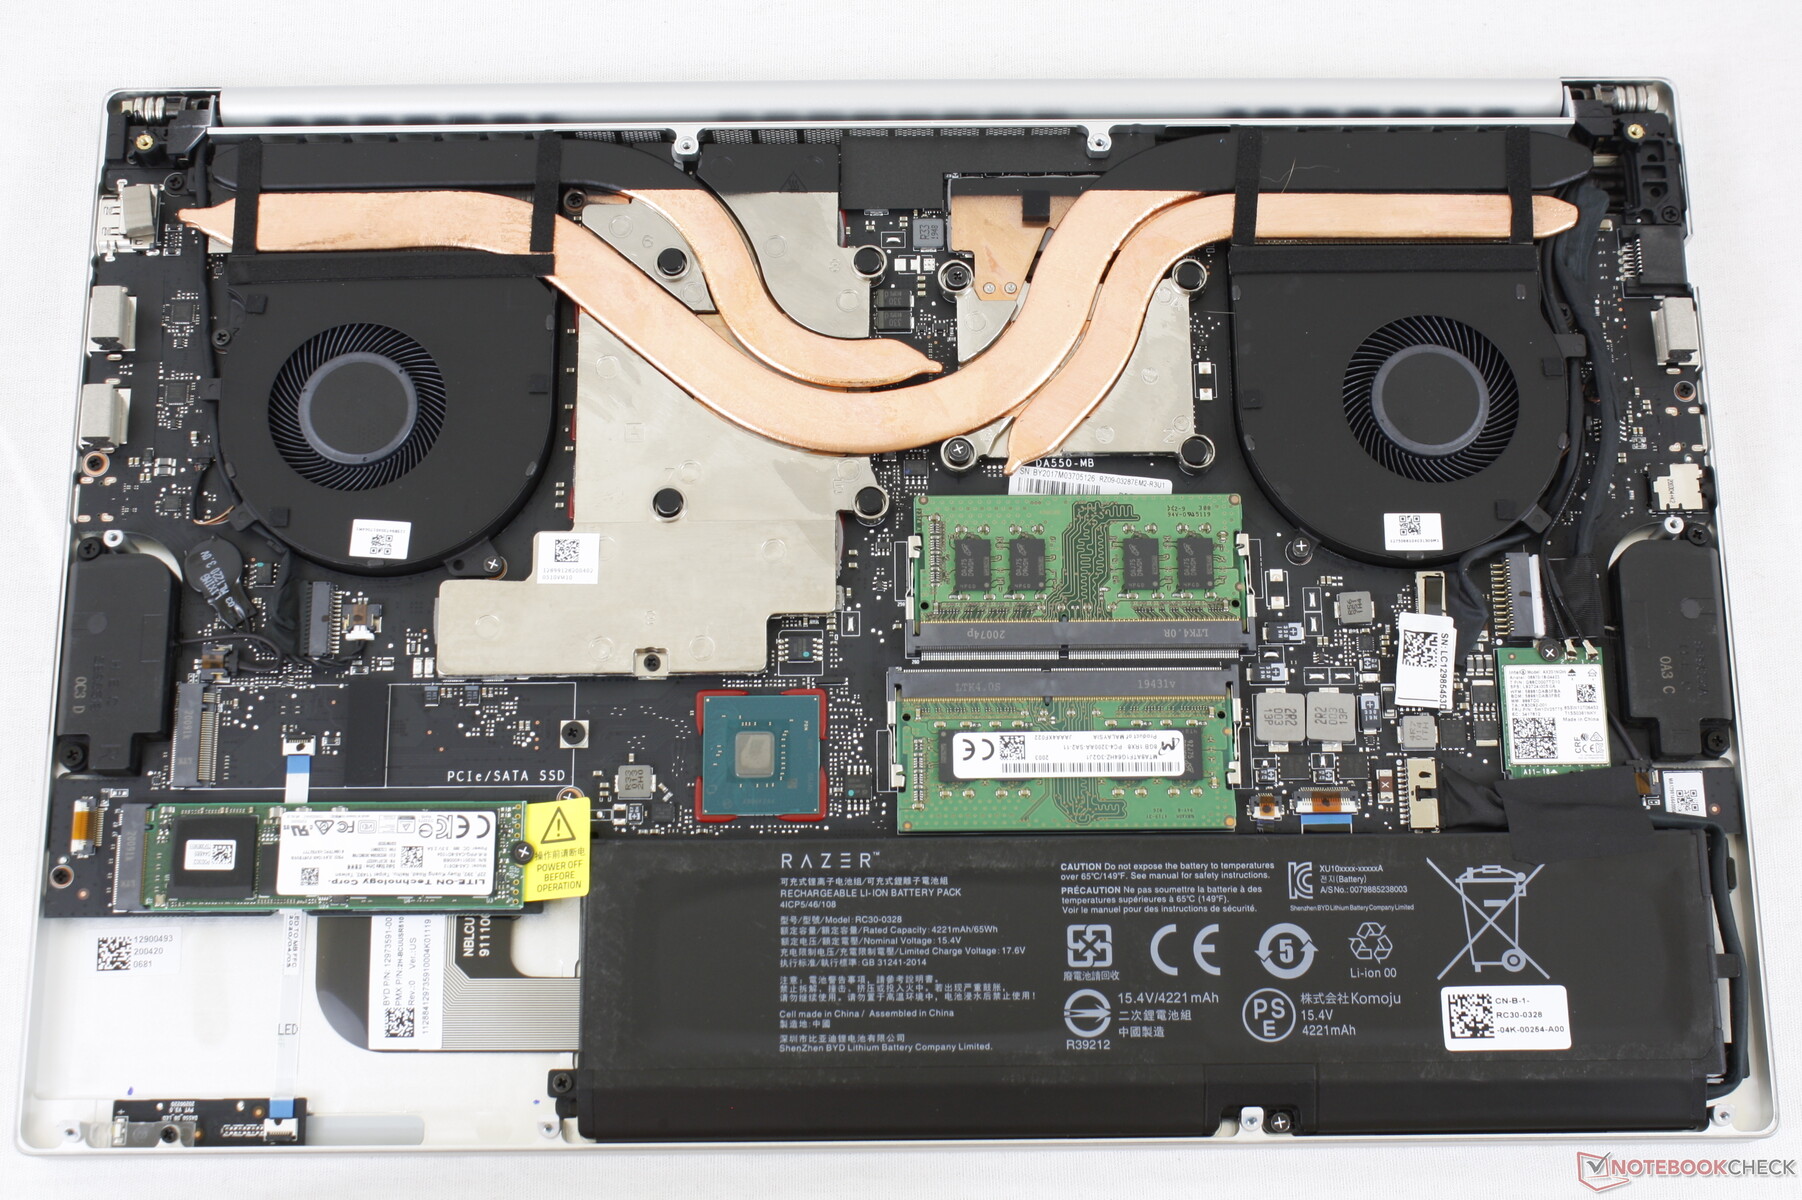
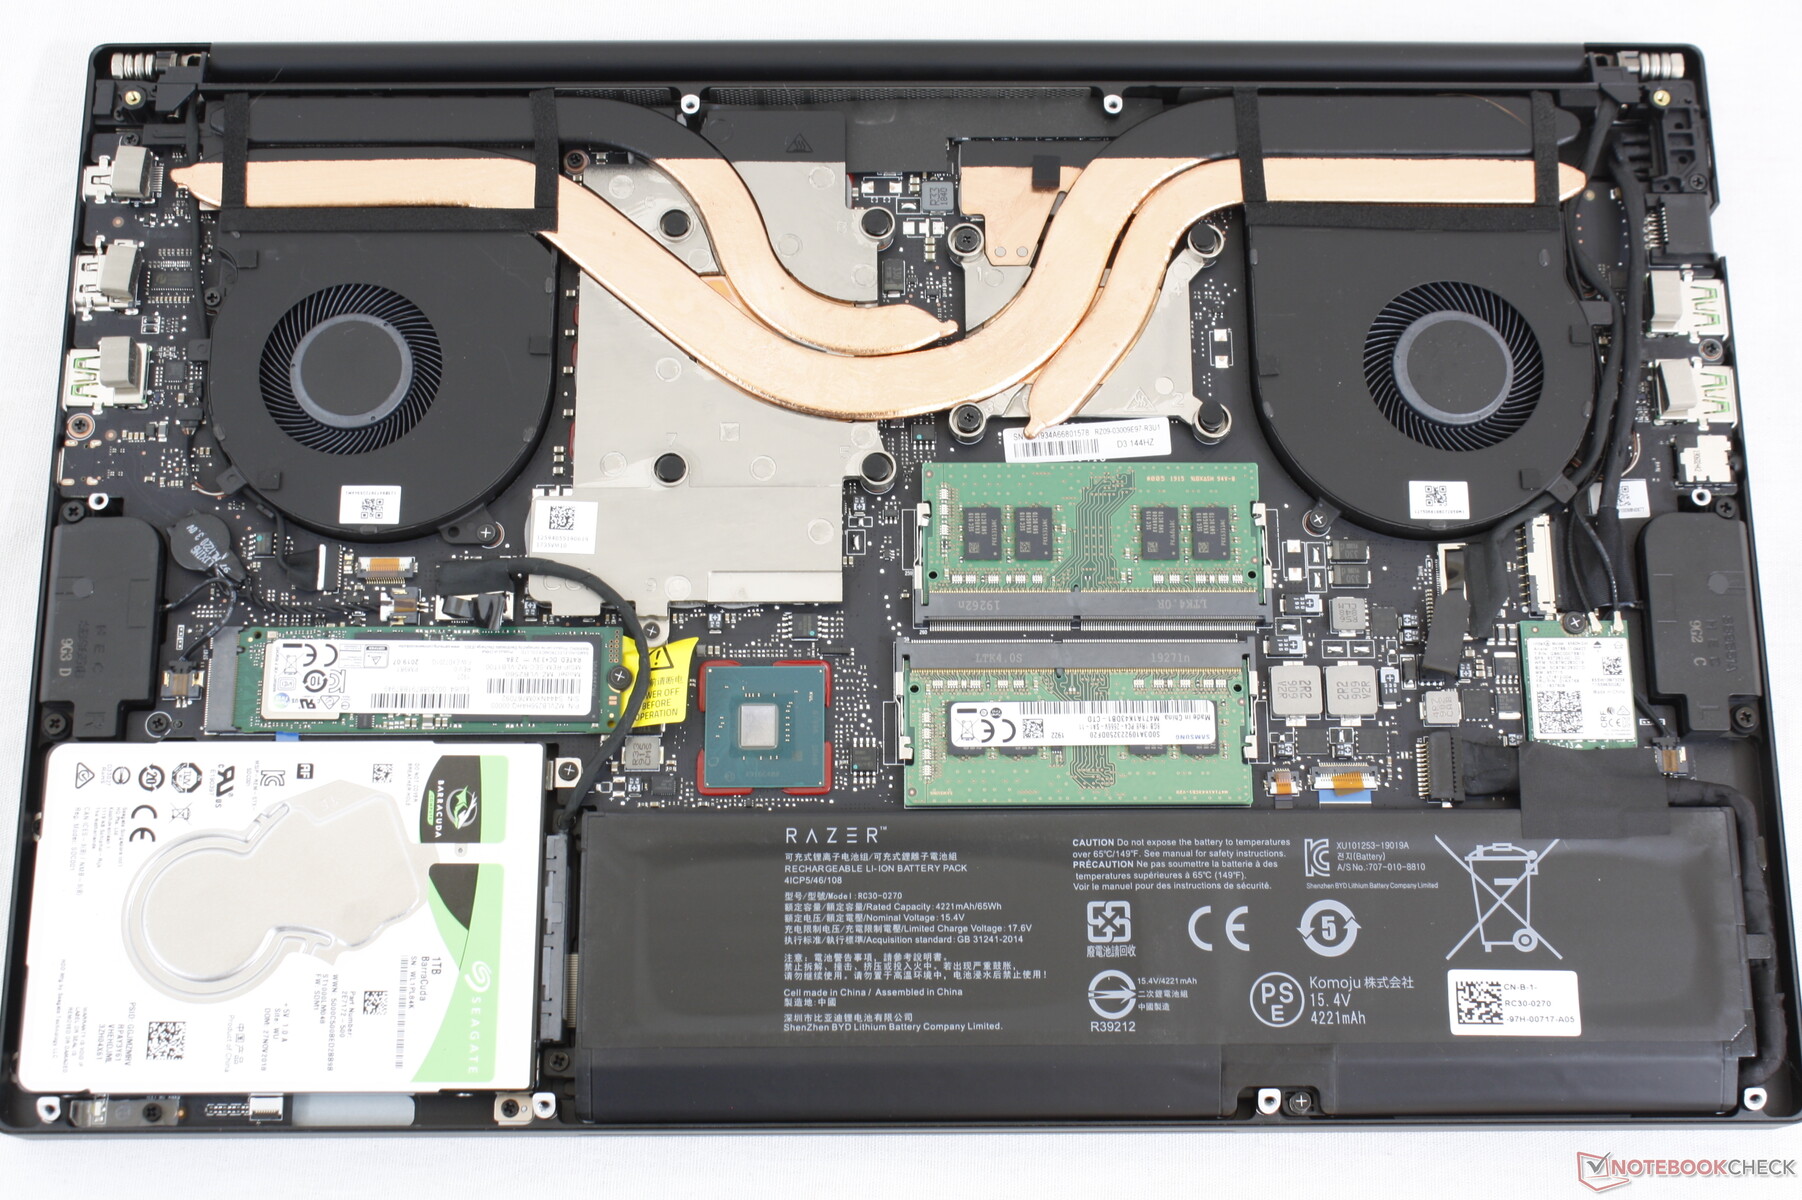
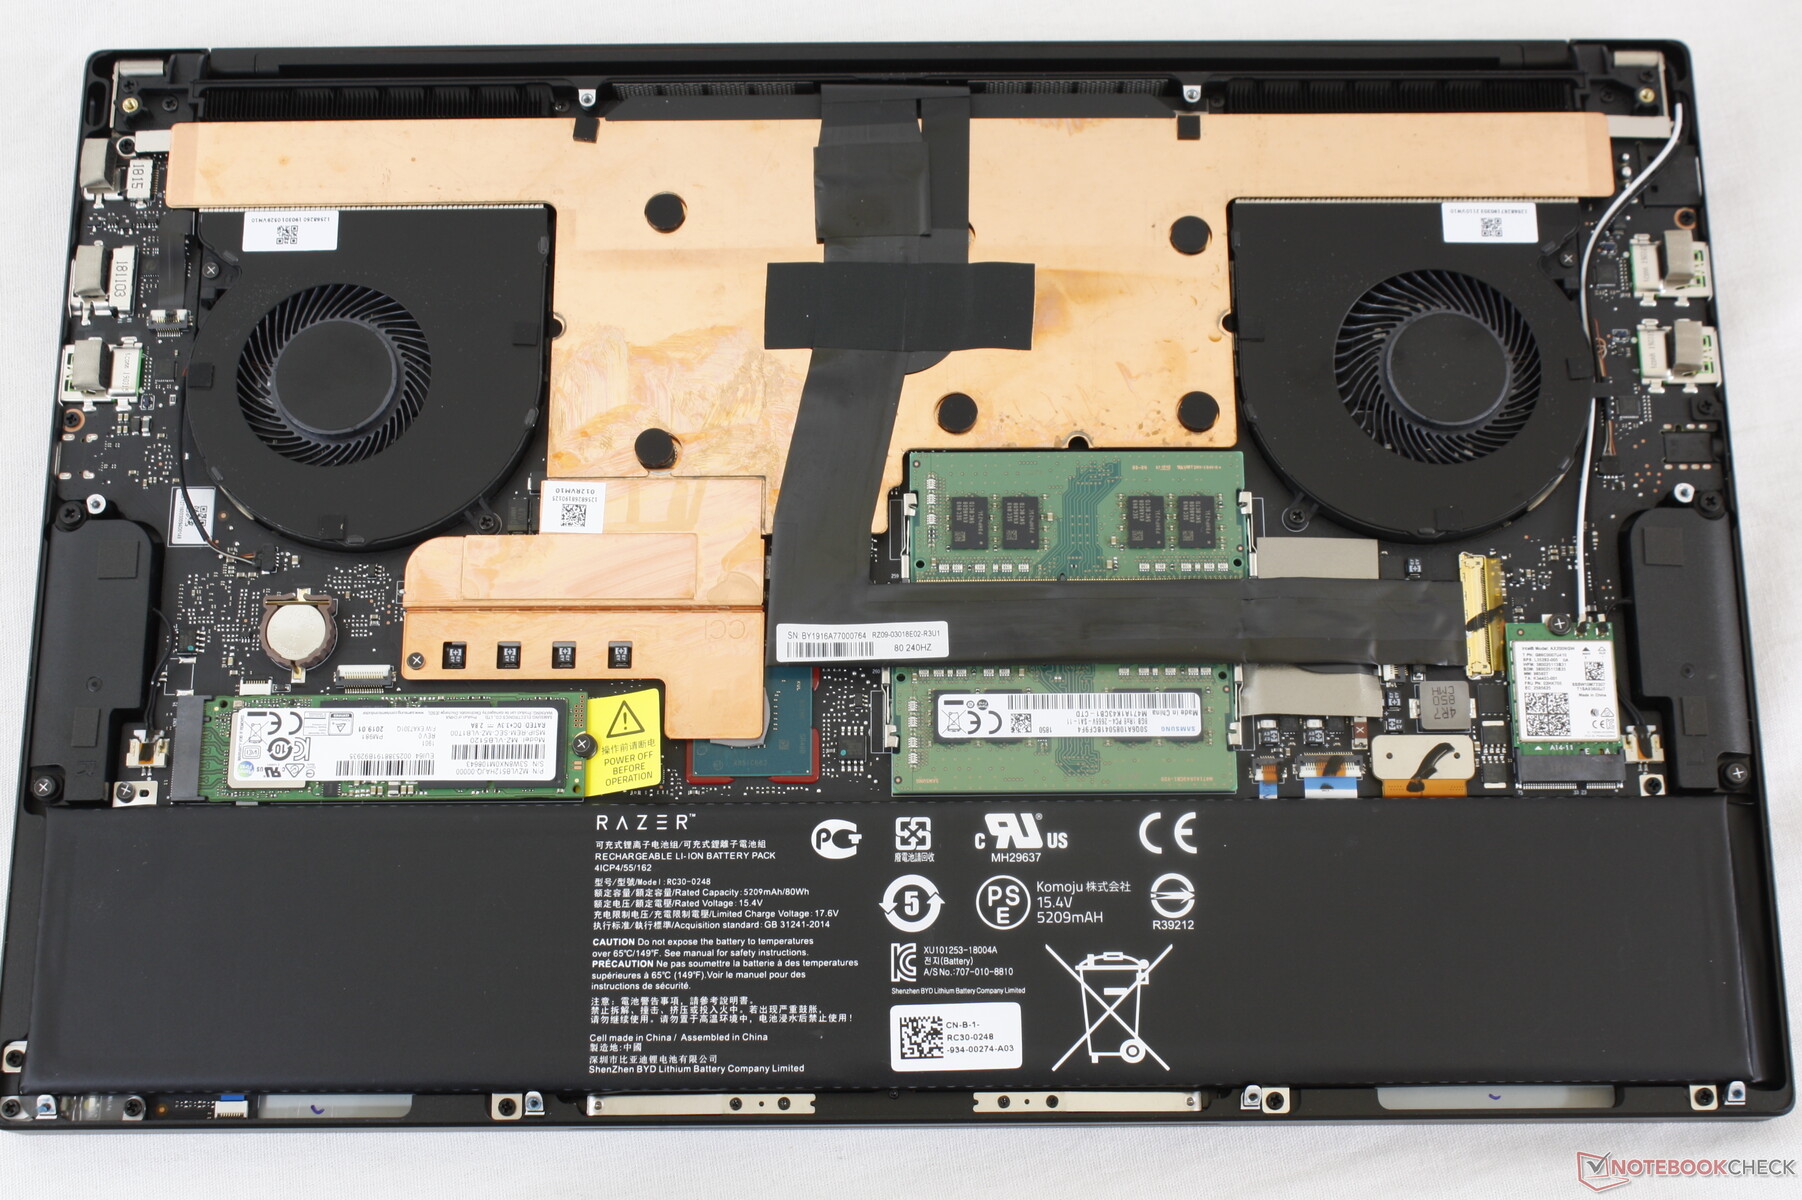
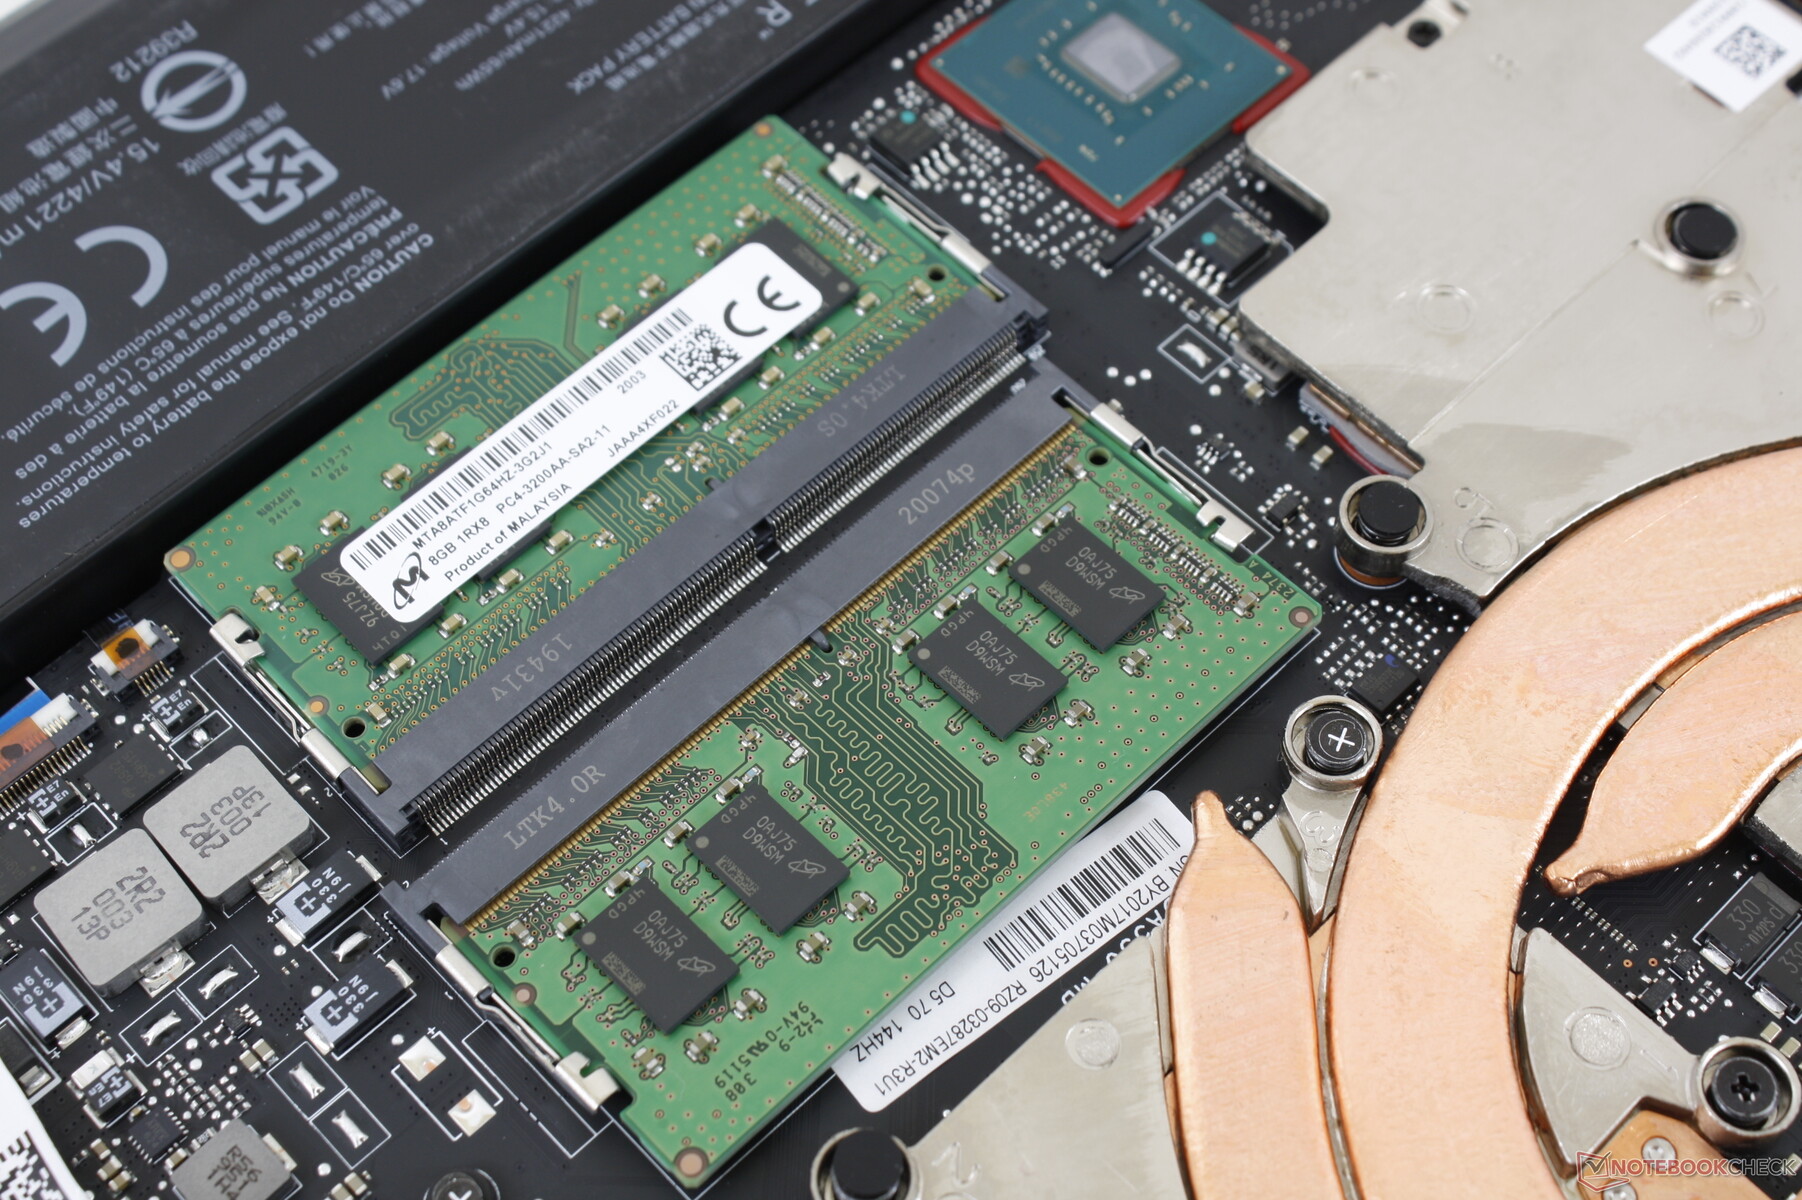
Razer made one sly change between the 2019 Blade 15 Base model and 2020 Base Model. Whereas the former would have 1x M.2 2280 and 1x 2.5-inch SATA III, the latter would have 2x M.2 2280. Supporting only M.2 drives will certainly save on overall weight, but it will also make storage expansion more expensive for the end-user. Otherwise, upgrading remains easy so long as you have a T5 Torx wrench.
Input Devices
Keyboard and TouchPad


Display
HWiNFO is unable to pull the exact panel name of the OLED screen, but it does reveal a Samsung SDCA029 controller like the ones on the OLED-equipped Dell XPS 15, Gigabyte Aero 15, Asus ZenBook Pro Duo, or Alienware m15. It's more than likely that all these OEMs are sourcing similar 15.6-inch 4K OLED panels from Samsung.
When compared to the FHD panel on last year's Blade 15, 4K OLED will get users deeper colors, infinite contrast ratio, and substantially faster response times for almost no ghosting when gaming. The main drawback of OLED lies in refresh rate which is only a fraction of what the latest IPS panels are able to offer these days. Thus, fast-paced games won't feel as smooth on OLED even though colors and graphics may look prettier and more defined.


| |||||||||||||||||||||||||
Brightness Distribution: 91 %
Center on Battery: 366.7 cd/m²
Contrast: ∞:1 (Black: 0 cd/m²)
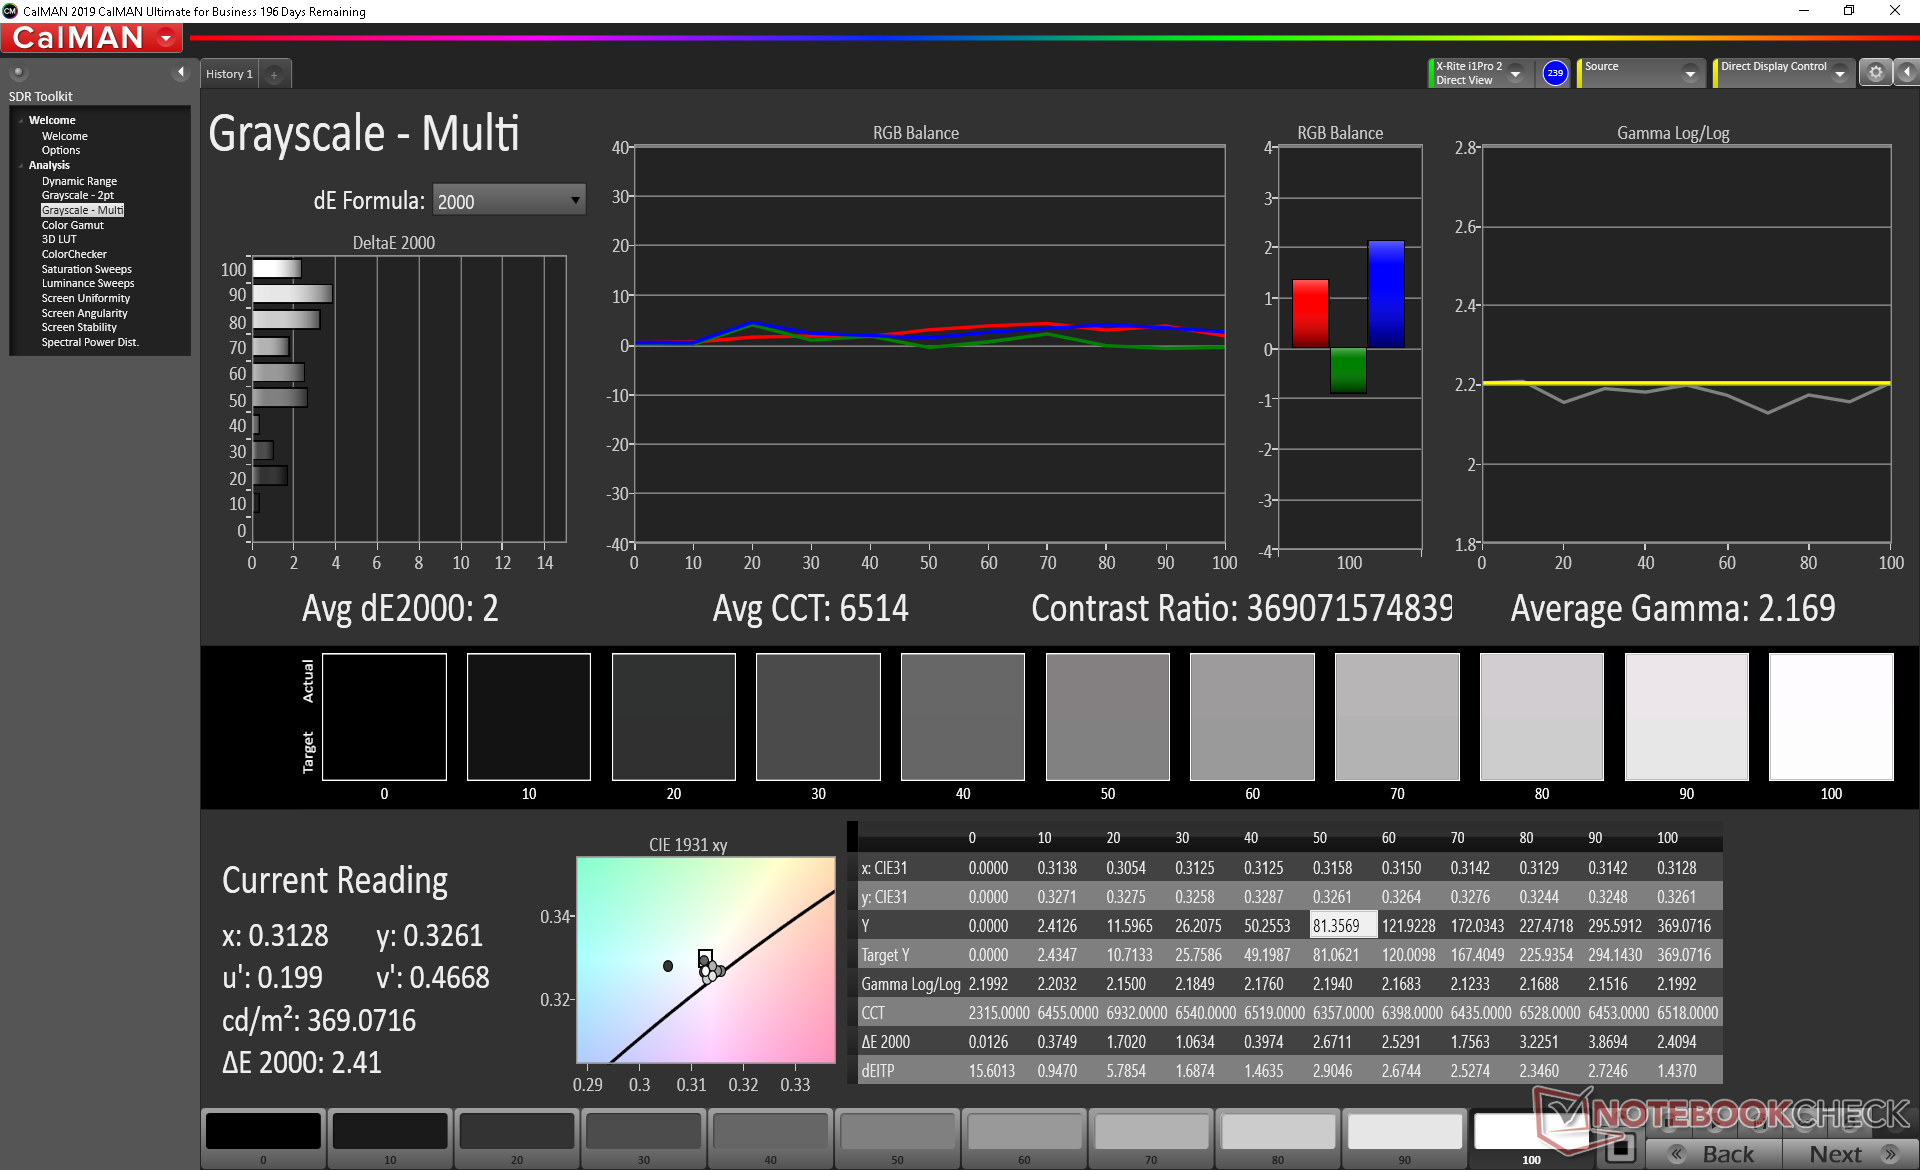
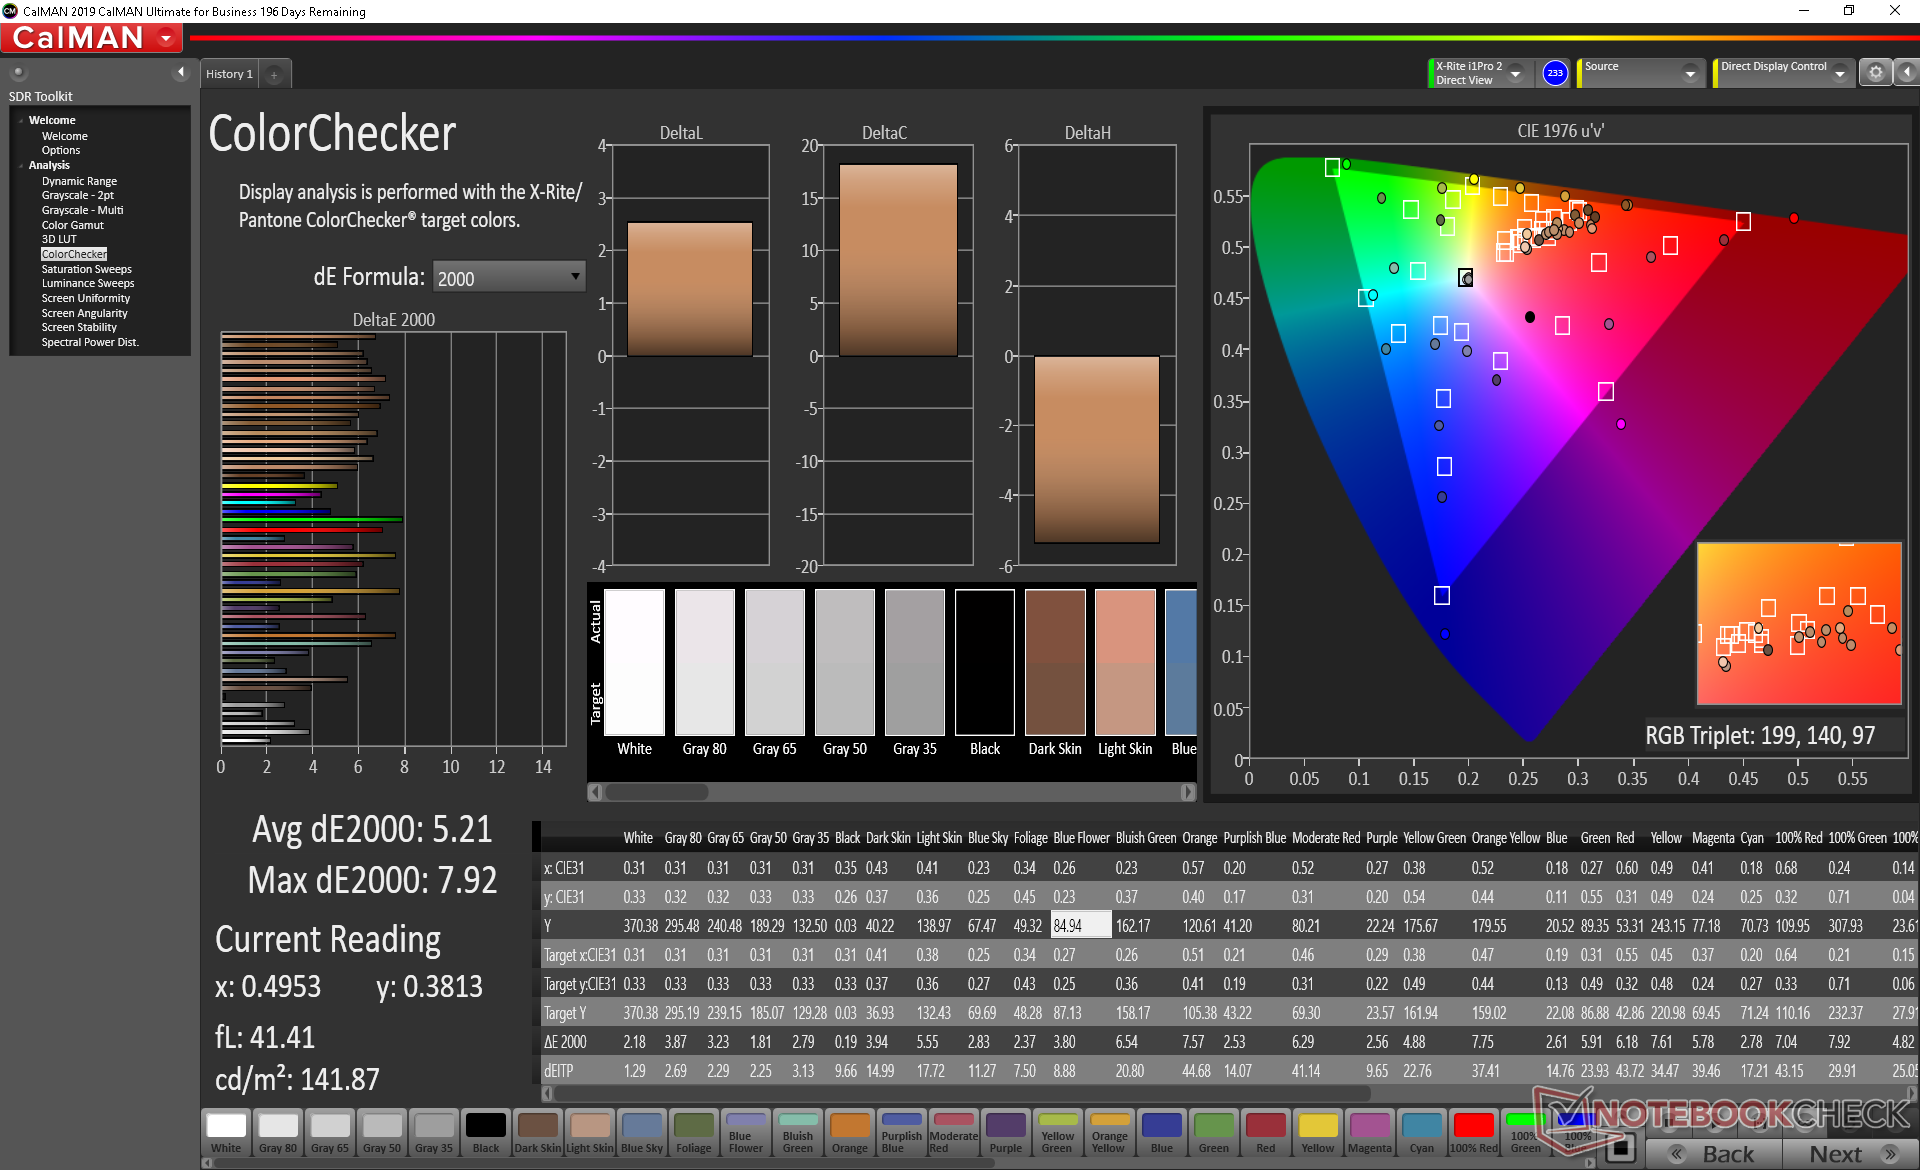
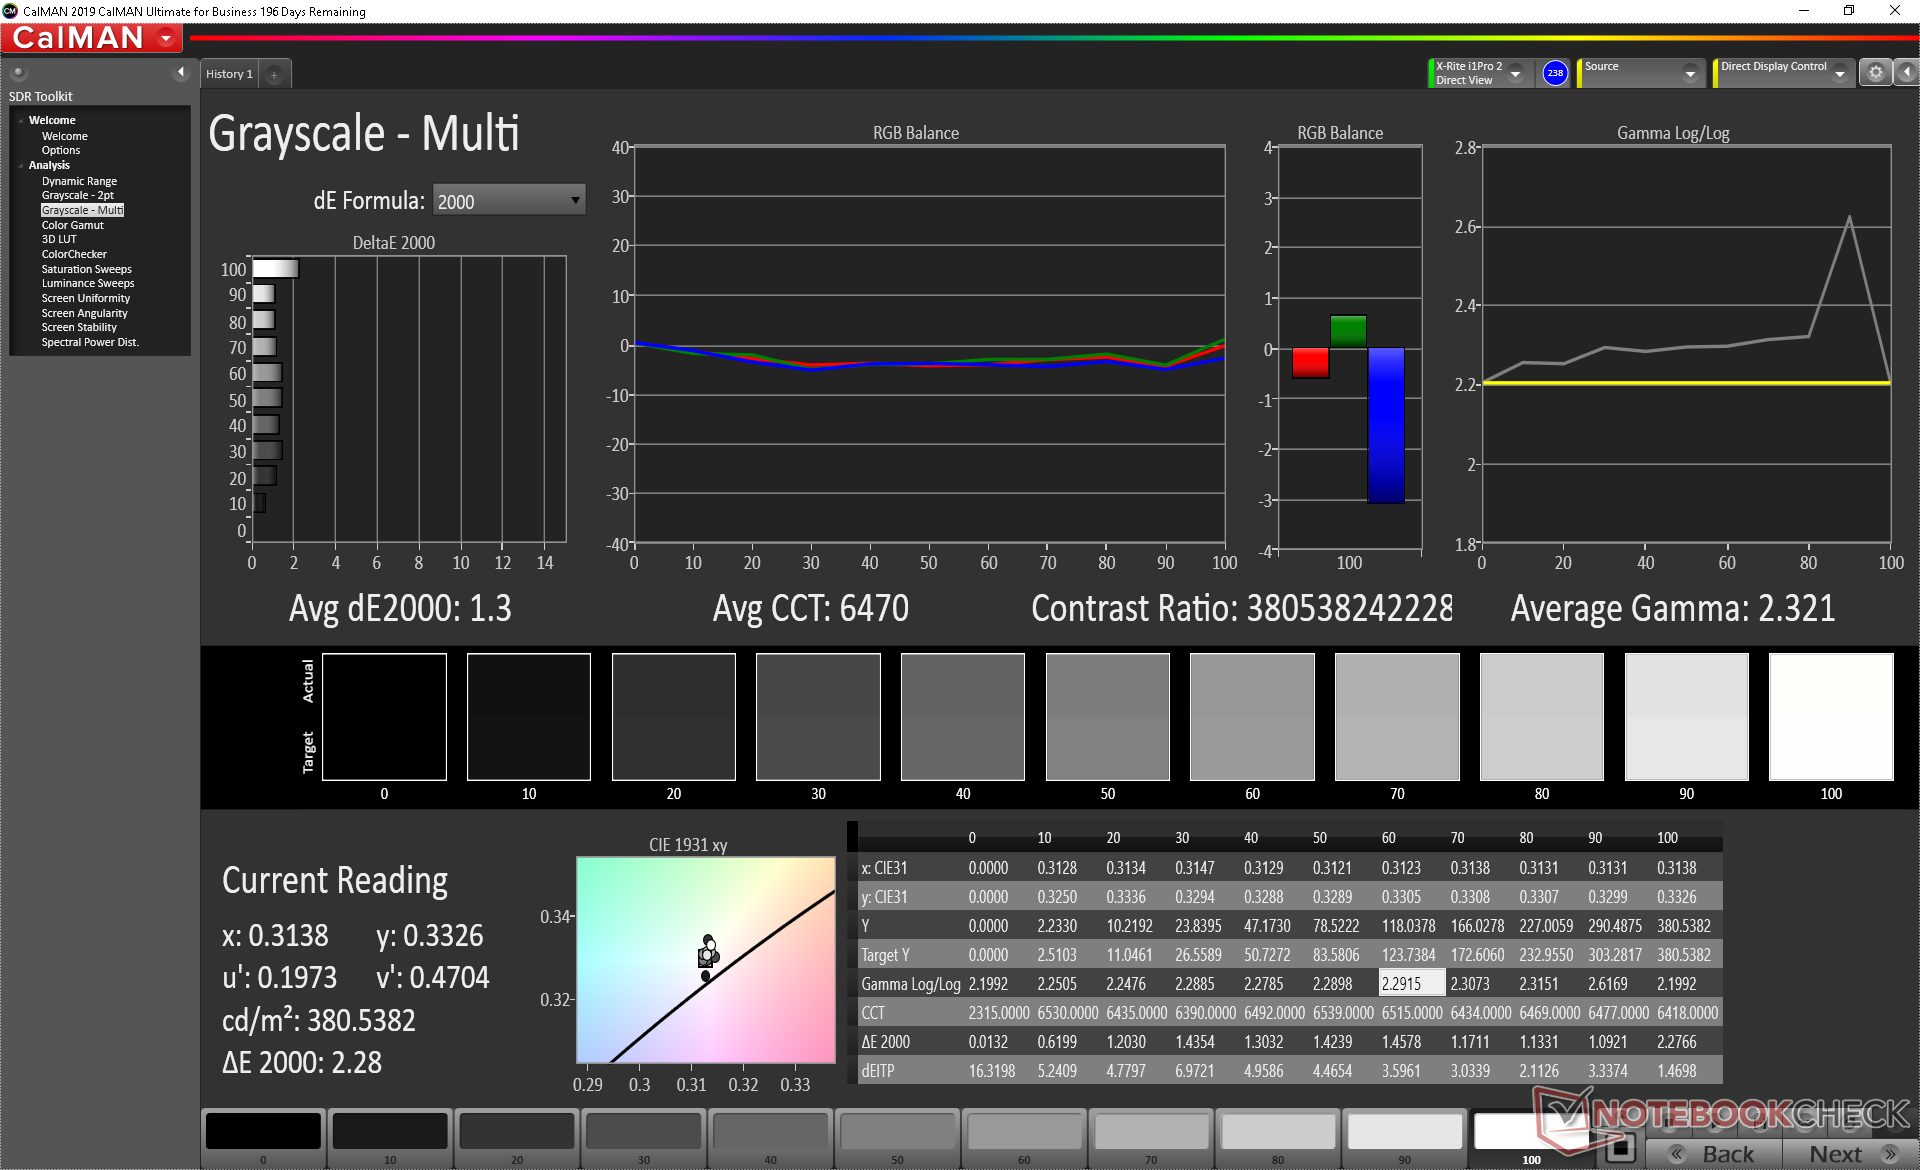
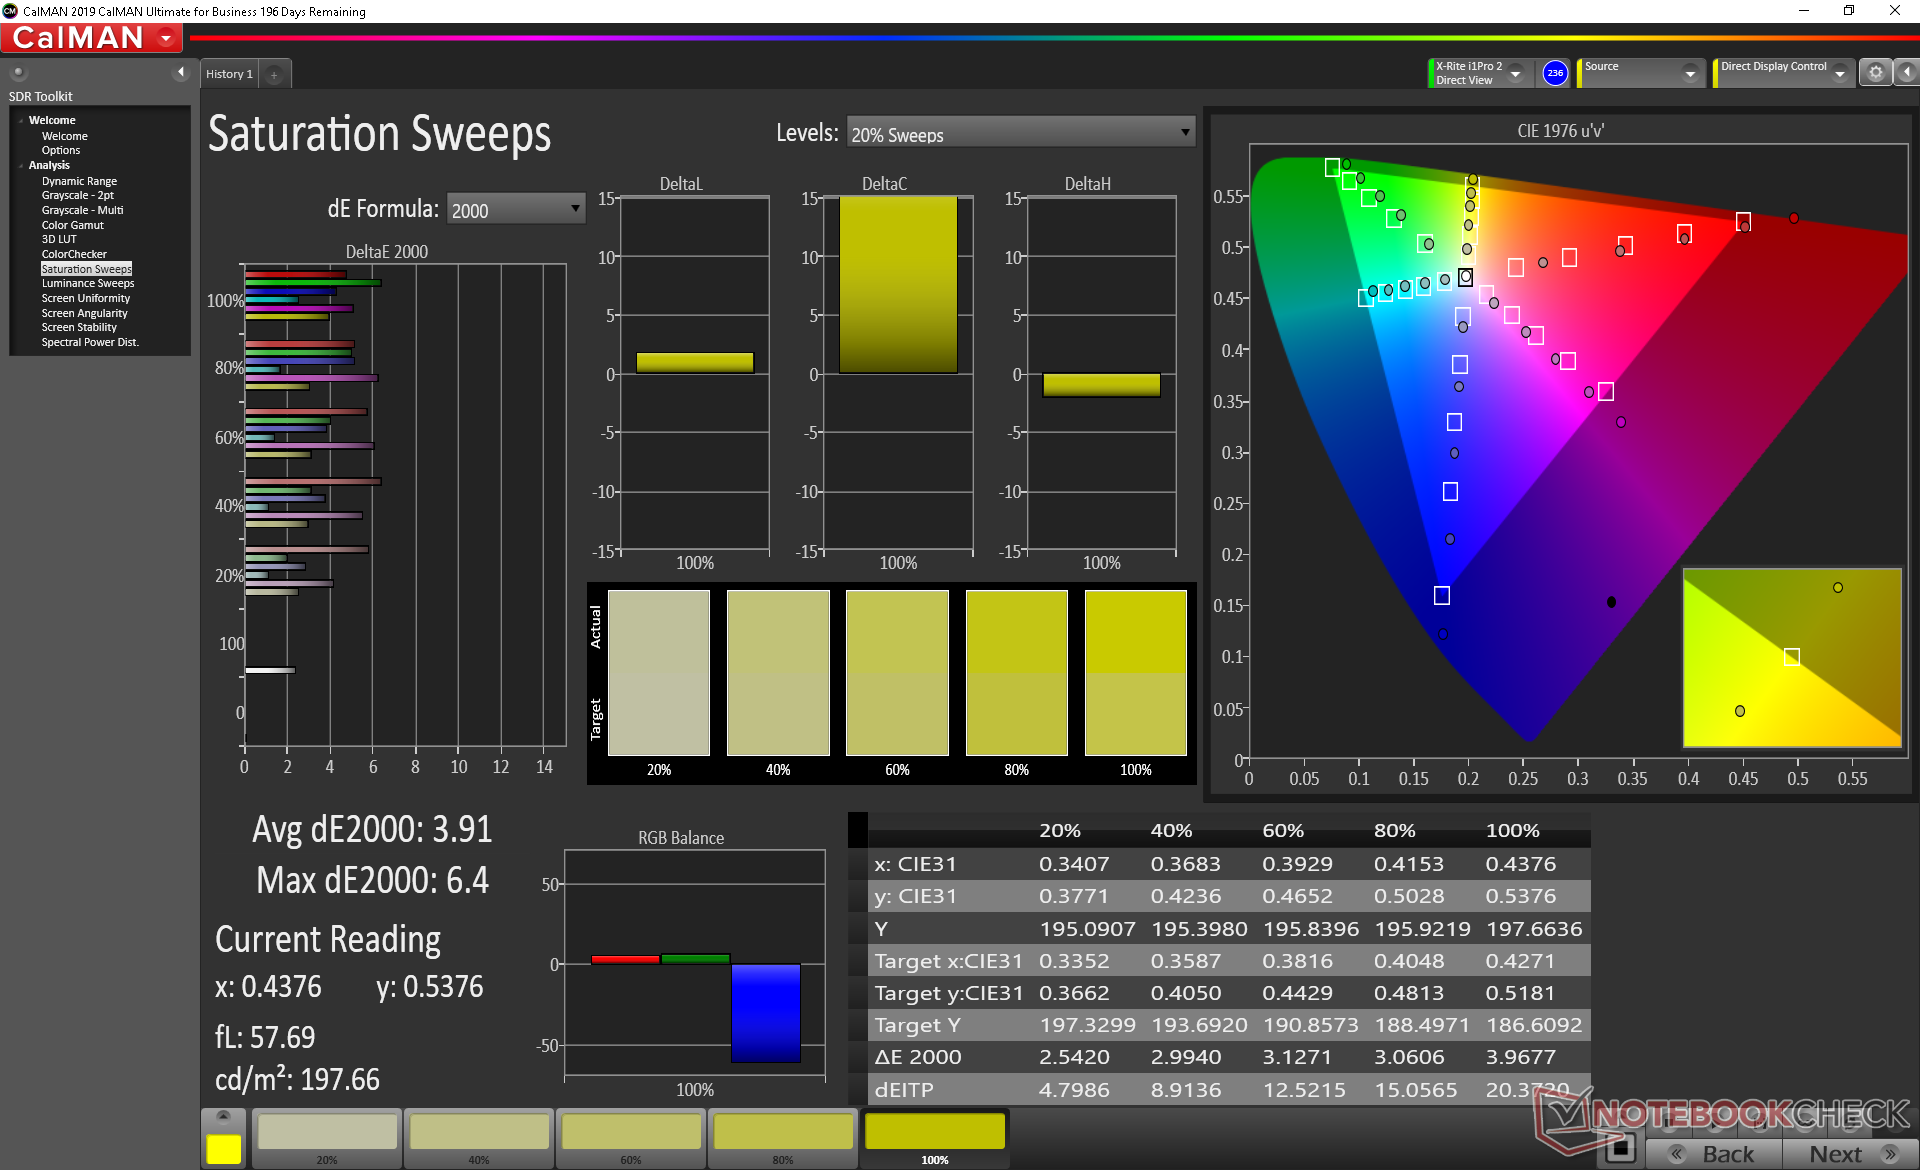
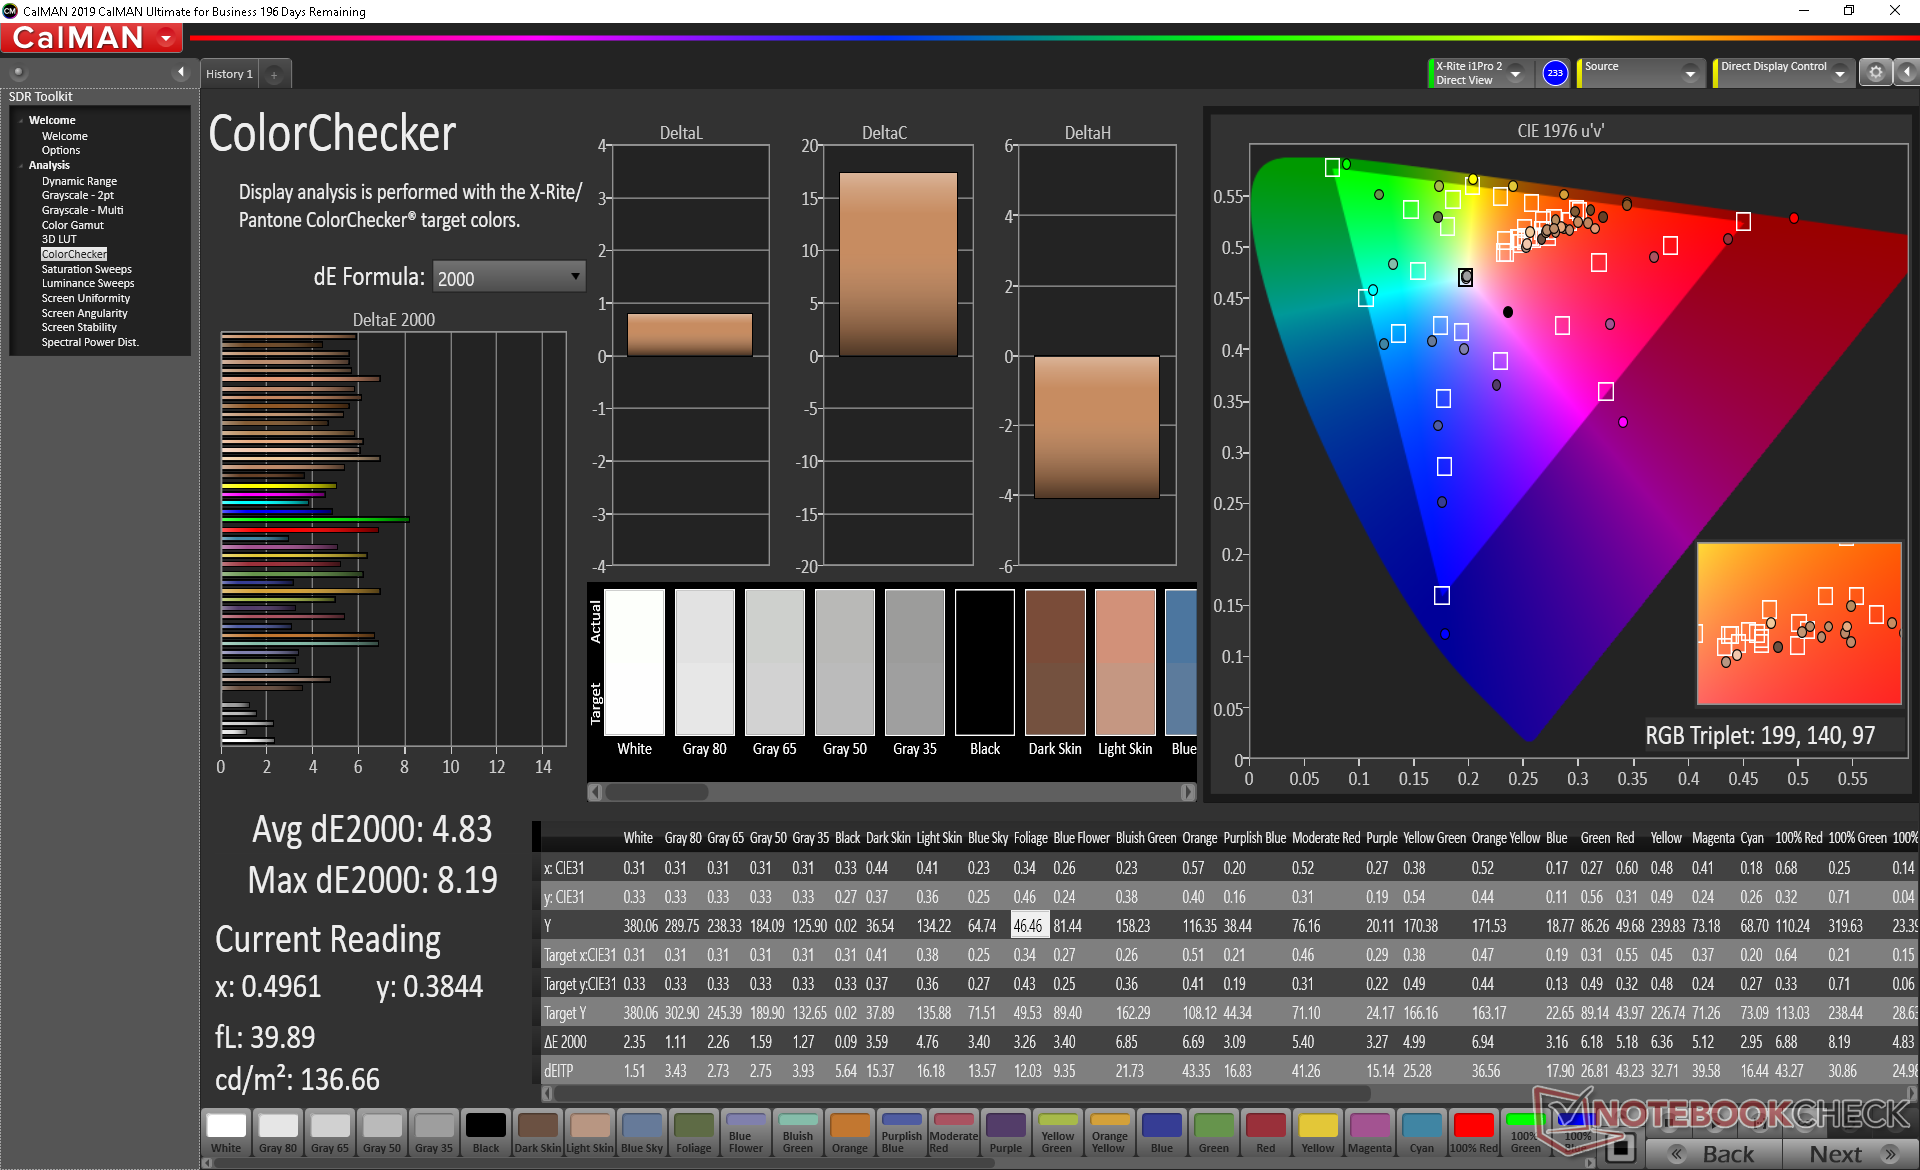
ΔE Color 5.21 | 0.5-29.43 Ø5
ΔE Greyscale 2 | 0.57-98 Ø5.3
100% sRGB (Argyll 1.6.3 3D)
86.6% AdobeRGB 1998 (Argyll 1.6.3 3D)
97.4% AdobeRGB 1998 (Argyll 2.2.0 3D)
100% sRGB (Argyll 2.2.0 3D)
99.9% Display P3 (Argyll 2.2.0 3D)
Gamma: 2.17
| Razer Blade 15 RZ09-0328 Samsung SDCA029, AMOLED, 15.60, 3840x2160 | MSI GS66 10SGS AU Optronics B156HAN12.0, IPS, 15.60, 1920x1080 | Razer Blade 15 RTX 2080 Max-Q Sharp LQ156M1JW03 (SHP14C5), IPS, 15.60, 1920x1080 | Asus Zephyrus S GX531GX AU Optronics B156HAN08.2, IPS, 15.60, 1920x1080 | Gigabyte Aero 15 OLED XB-8DE51B0SP Samsung SDCA029, OLED, 15.60, 3840x2160 | Alienware m15 R2 P87F Sharp LQ156M1, IPS, 15.60, 1920x1080 | |
|---|---|---|---|---|---|---|
| Display | -19% | -22% | -24% | 0% | -24% | |
| Display P3 Coverage | 99.9 | 69.9 -30% | 66.9 -33% | 65.6 -34% | 99.9 0% | 65.3 -35% |
| sRGB Coverage | 100 | 99.1 -1% | 98.1 -2% | 92.2 -8% | 100 0% | 95.1 -5% |
| AdobeRGB 1998 Coverage | 97.4 | 71.1 -27% | 68.5 -30% | 66.9 -31% | 98.2 1% | 65.9 -32% |
| Response Times | -300% | 13081% | -214% | 17% | 13057% | |
| Response Time Grey 50% / Grey 80% * | 2.7 ? | 11.2 ? -315% | 12.8 ? -374% | 7 ? -159% | 2.2 ? 19% | 16.4 ? -507% |
| Response Time Black / White * | 2.6 ? | 10 ? -285% | 10.4 ? -300% | 9.6 ? -269% | 1.8 ? 31% | 8.8 ? -238% |
| PWM Frequency | 59.5 ? | 23810 ? 39917% | 60 ? 1% | 23810 ? 39917% | ||
| Screen | 8% | 4% | -6% | 20% | -52% | |
| Brightness middle | 366.7 | 339.4 -7% | 293 -20% | 323.6 -12% | 385 5% | 324.2 -12% |
| Brightness | 371 | 331 -11% | 270 -27% | 315 -15% | 390 5% | 304 -18% |
| Brightness Distribution | 91 | 92 1% | 87 -4% | 91 0% | 93 2% | 90 -1% |
| Black Level * | 0.24 | 0.29 | 0.29 | 0.38 | ||
| Colorchecker dE 2000 * | 5.21 | 1.58 70% | 1.69 68% | 3.31 36% | 2.46 53% | 5.01 4% |
| Colorchecker dE 2000 max. * | 7.92 | 3.8 52% | 3.37 57% | 5.74 28% | 4.01 49% | 12.7 -60% |
| Greyscale dE 2000 * | 2 | 2.3 -15% | 2.3 -15% | 2.9 -45% | 1.39 30% | 7.9 -295% |
| Gamma | 2.17 101% | 2.24 98% | 2.3 96% | 2.29 96% | 2.31 95% | 2.35 94% |
| CCT | 6514 100% | 6952 93% | 6758 96% | 6765 96% | 6395 102% | 8455 77% |
| Color Space (Percent of AdobeRGB 1998) | 86.6 | 64.8 -25% | 63 -27% | 59.7 -31% | 98 13% | 60.8 -30% |
| Color Space (Percent of sRGB) | 100 | 99.4 -1% | 98.5 -1% | 91.8 -8% | 100 0% | 95.5 -4% |
| Contrast | 1414 | 1010 | 1116 | 853 | ||
| Colorchecker dE 2000 calibrated * | 1.47 | 1.24 | 2.73 | 2.6 | 1.64 | |
| Total Average (Program / Settings) | -104% /
-46% | 4354% /
2801% | -81% /
-42% | 12% /
15% | 4327% /
2763% |
* ... smaller is better
Color space is tricky because we normally calculate it against the AdobeRGB standard. In this case, the Blade 15 OLED covers approximately 86.6 percent of AdobeRGB with just 74.6 percent of its total color volume because DCI-P3 extends further into reds and yellows at the expense of cyan and green. With some math, this comes out to be about 112 percent of the AdobeRGB 3D volume and, by extension, all of sRGB as well.

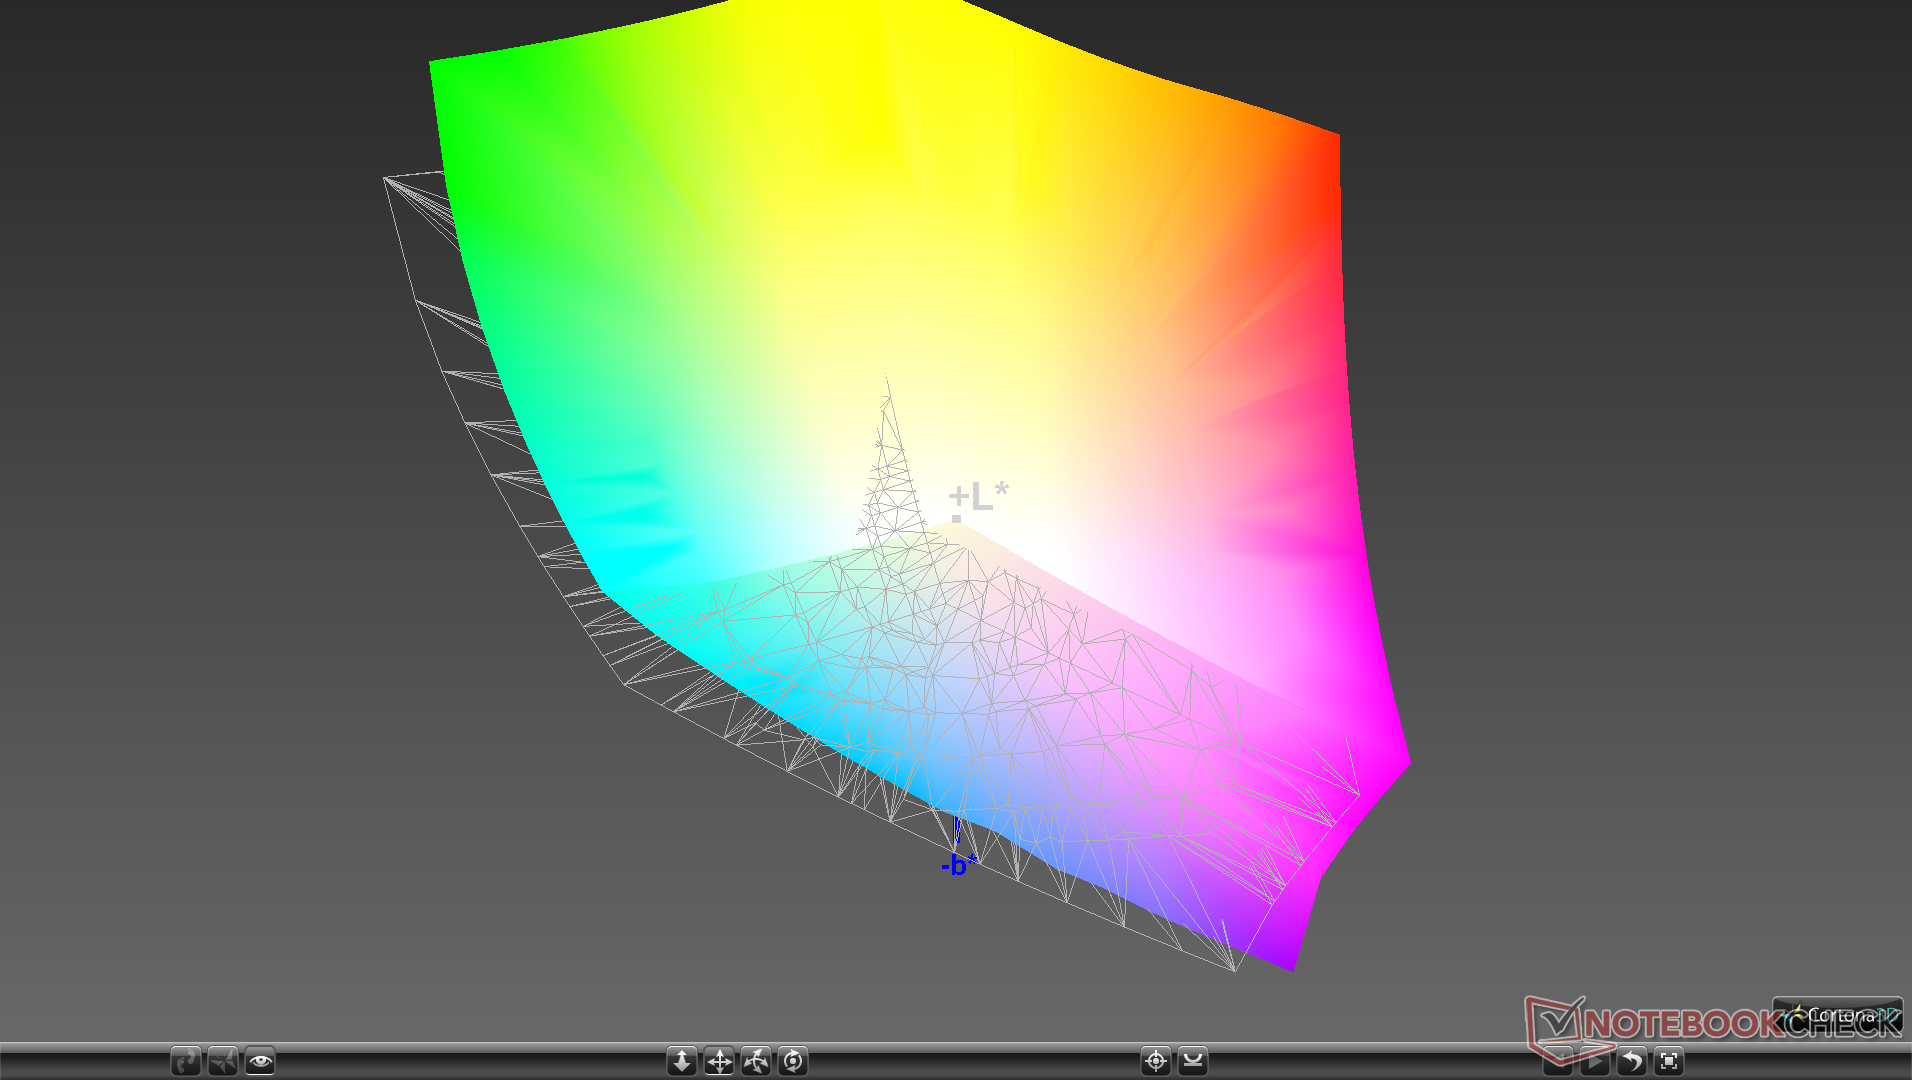
Razer factory calibrates each individual panel against the DCI-P3 standard and so an end-user calibration should not be necessary especially if you mostly plan on gaming. Our own attempt at calibrating the display would not yield noticeable improvements.
Display Response Times
| ↔ Response Time Black to White | ||
|---|---|---|
| 2.6 ms ... rise ↗ and fall ↘ combined | ↗ 1.1 ms rise | 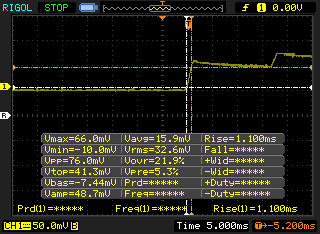 |
| ↘ 1.5 ms fall | ||
| The screen shows very fast response rates in our tests and should be very well suited for fast-paced gaming. In comparison, all tested devices range from 0.1 (minimum) to 240 (maximum) ms. » 8 % of all devices are better. This means that the measured response time is better than the average of all tested devices (21.5 ms). | ||
| ↔ Response Time 50% Grey to 80% Grey | ||
| 2.7 ms ... rise ↗ and fall ↘ combined | ↗ 1.2 ms rise | 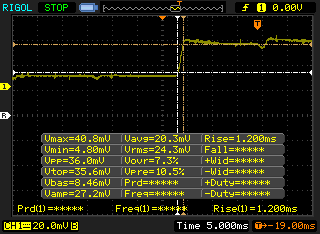 |
| ↘ 1.5 ms fall | ||
| The screen shows very fast response rates in our tests and should be very well suited for fast-paced gaming. In comparison, all tested devices range from 0.2 (minimum) to 636 (maximum) ms. » 7 % of all devices are better. This means that the measured response time is better than the average of all tested devices (33.7 ms). | ||
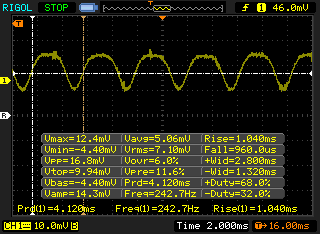
Screen Flickering / PWM (Pulse-Width Modulation)
| Screen flickering / PWM detected | 59.5 Hz | ≤ 100 % brightness setting | 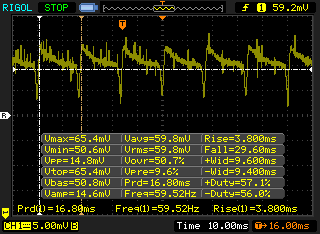 |
The display backlight flickers at 59.5 Hz (worst case, e.g., utilizing PWM) Flickering detected at a brightness setting of 100 % and below. There should be no flickering or PWM above this brightness setting. The frequency of 59.5 Hz is very low, so the flickering may cause eyestrain and headaches after extended use. In comparison: 53 % of all tested devices do not use PWM to dim the display. If PWM was detected, an average of 17900 (minimum: 5 - maximum: 3846000) Hz was measured. | |||
Pulse-width modulation changes depending on the brightness setting. In fact, the behavior, frequency, and level of PWM observed on our Blade 15 exactly matches what we observed on the XPS 15 meaning that it's almost a certainty that both are using the same OLED panels from Samsung. When brightness is set to 52 percent or higher, we're able to record a PWM frequency of 59 Hz. If brightness is set lower than 52 percent, however, PWM becomes sinusoidal at 242 Hz. The PWM turning point on the XPS 15 would also occur at 52 percent.

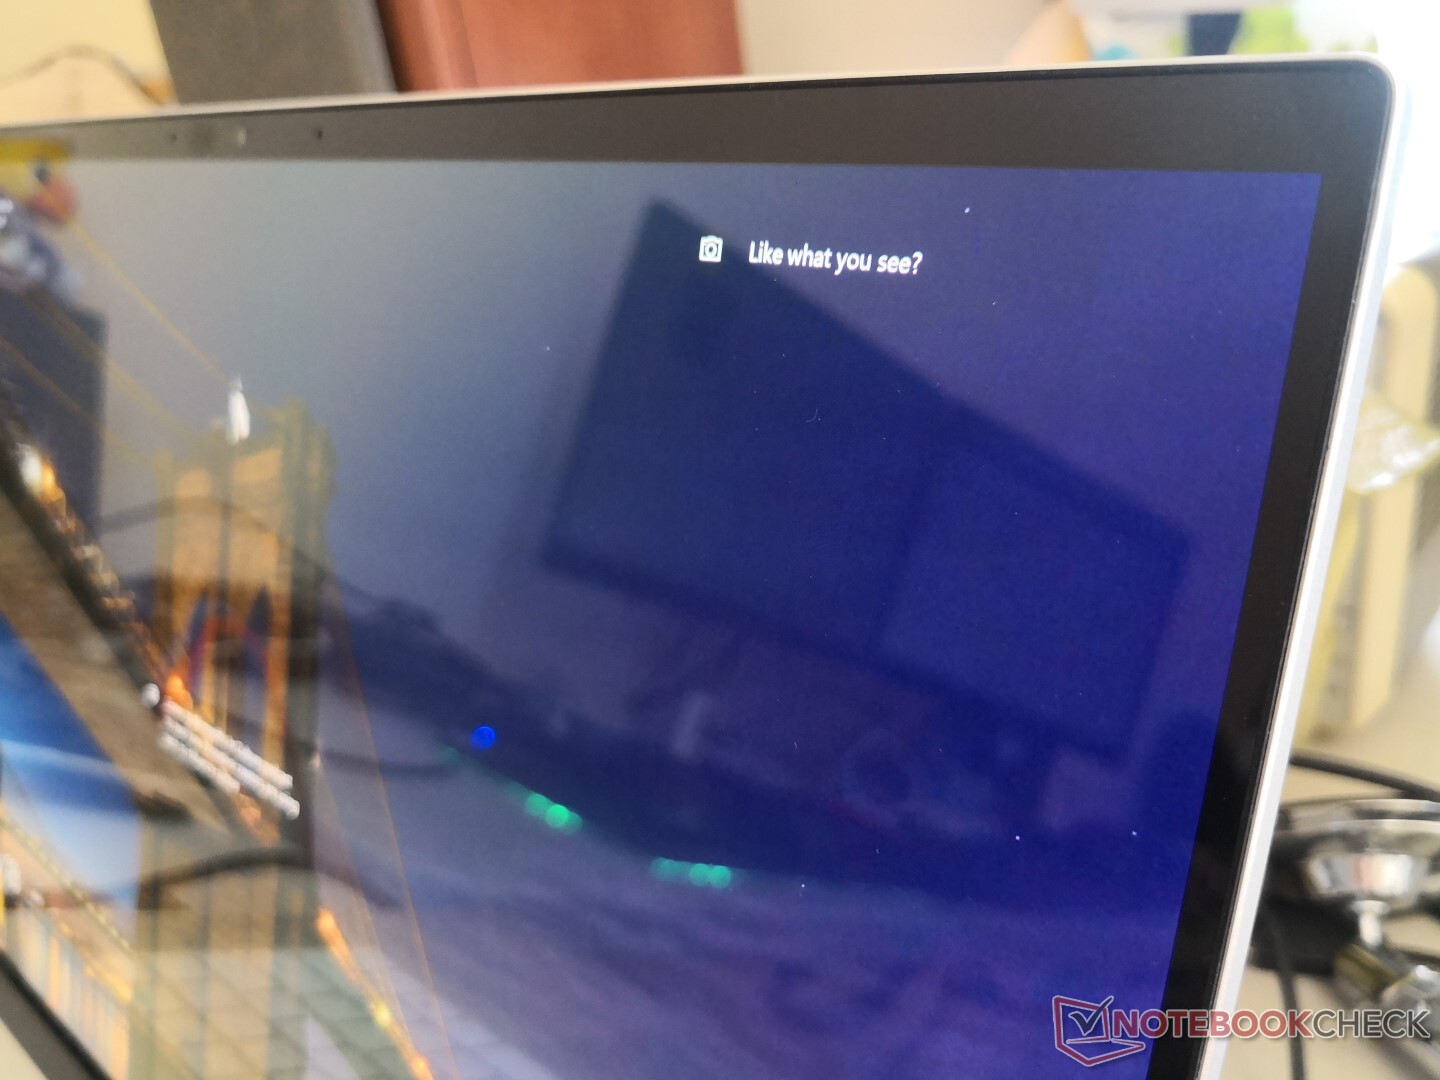
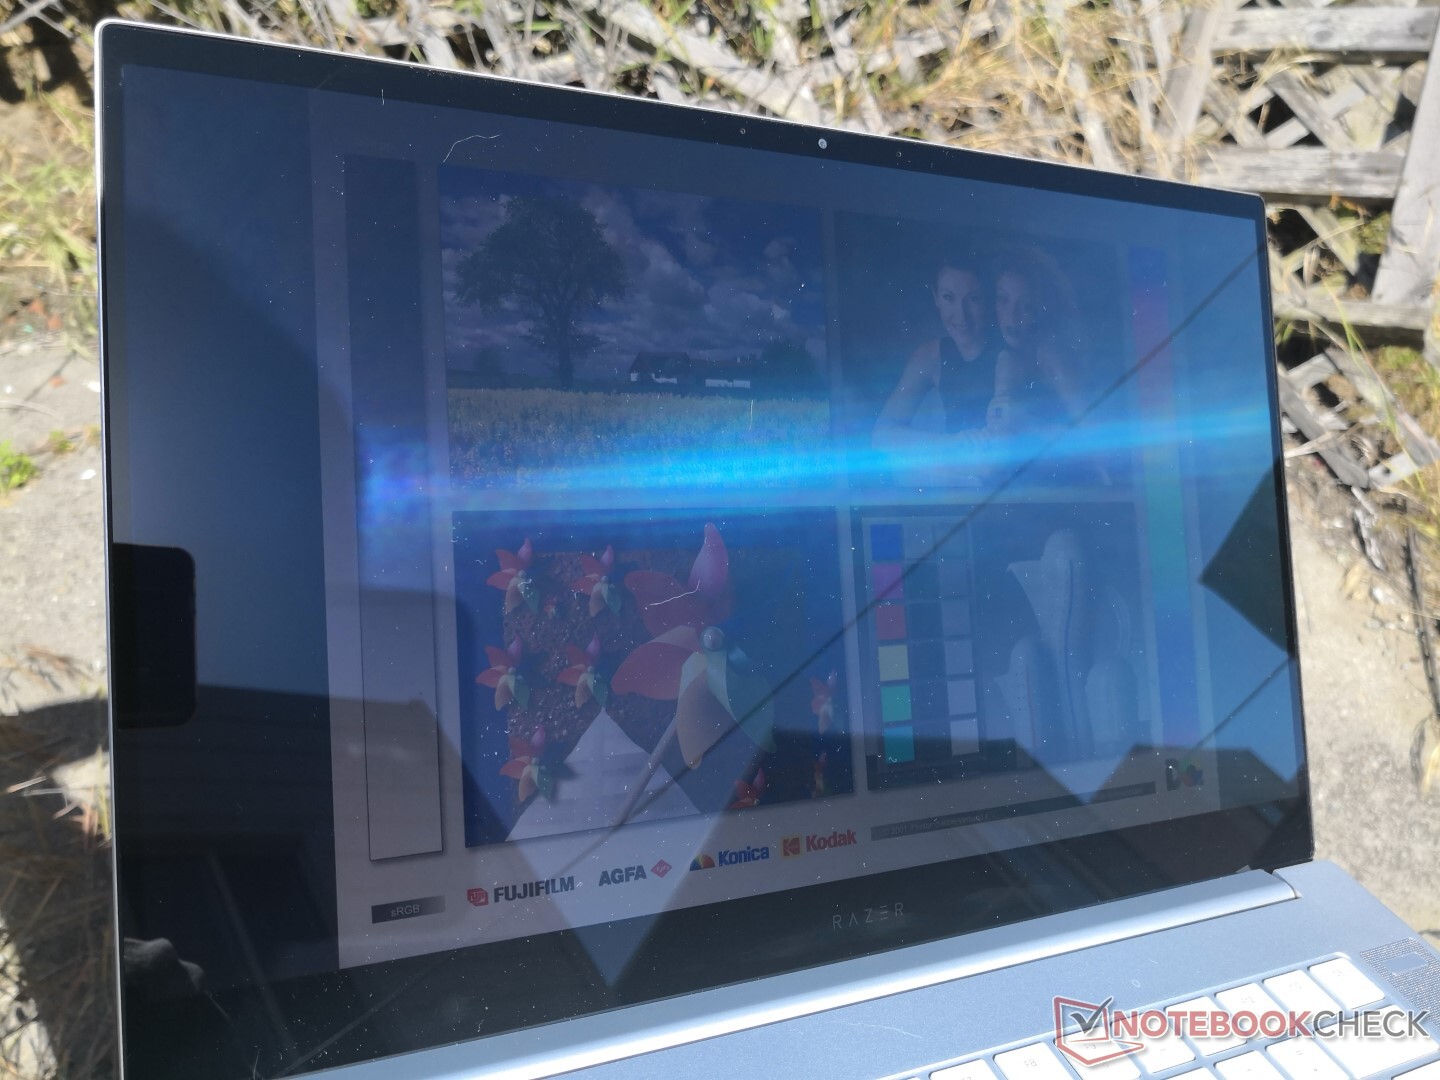
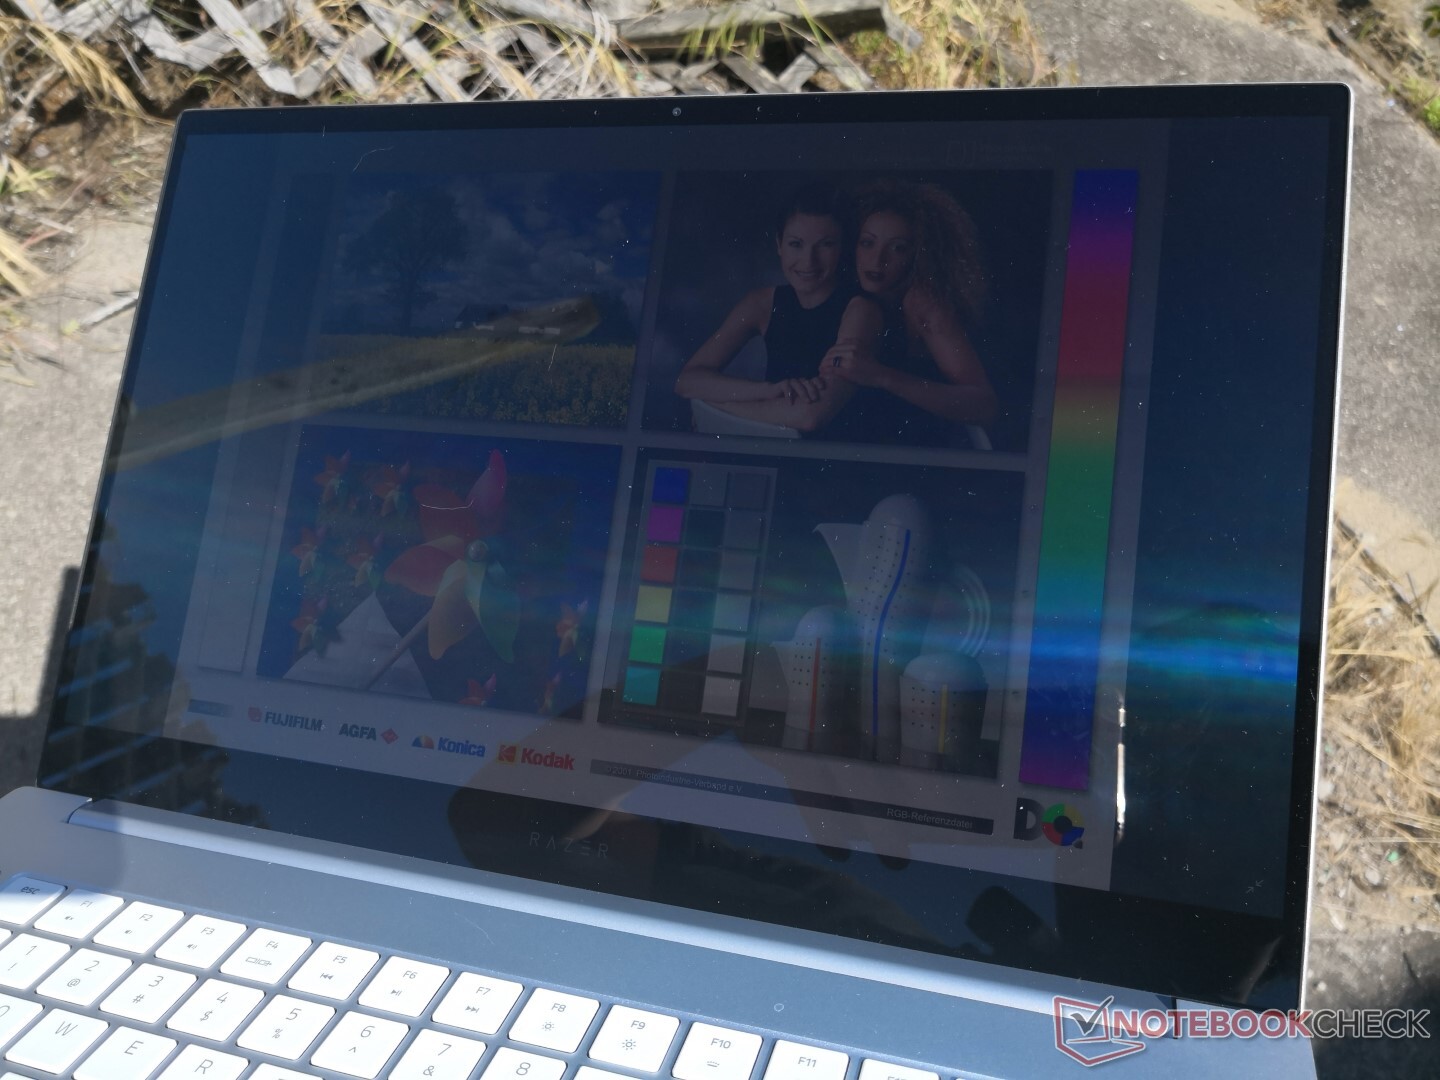
OLED displays tend to be easier to see outdoors when compared to IPS since they are often brighter with deeper contrast and colors. Though the Blade 15 OLED isn't yet bright enough to overcome direct sunlight, it works very well when under shade to be much better than most other gaming laptops. There is a slight rainbow effect if viewing from extreme angles that you wouldn't otherwise see on an IPS display, but brightness and contrast are more stable.


Performance
Processor
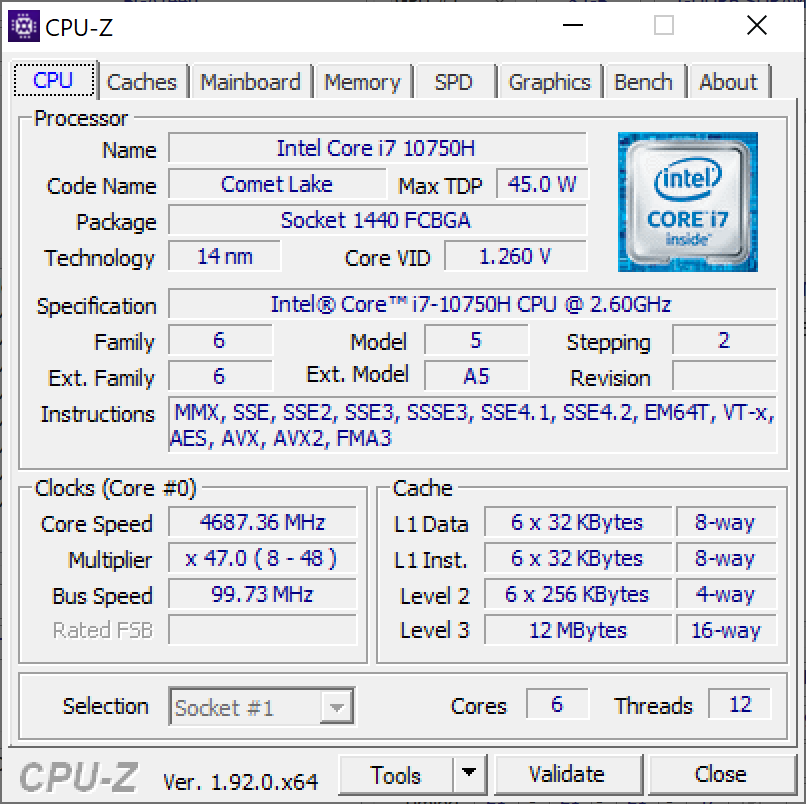
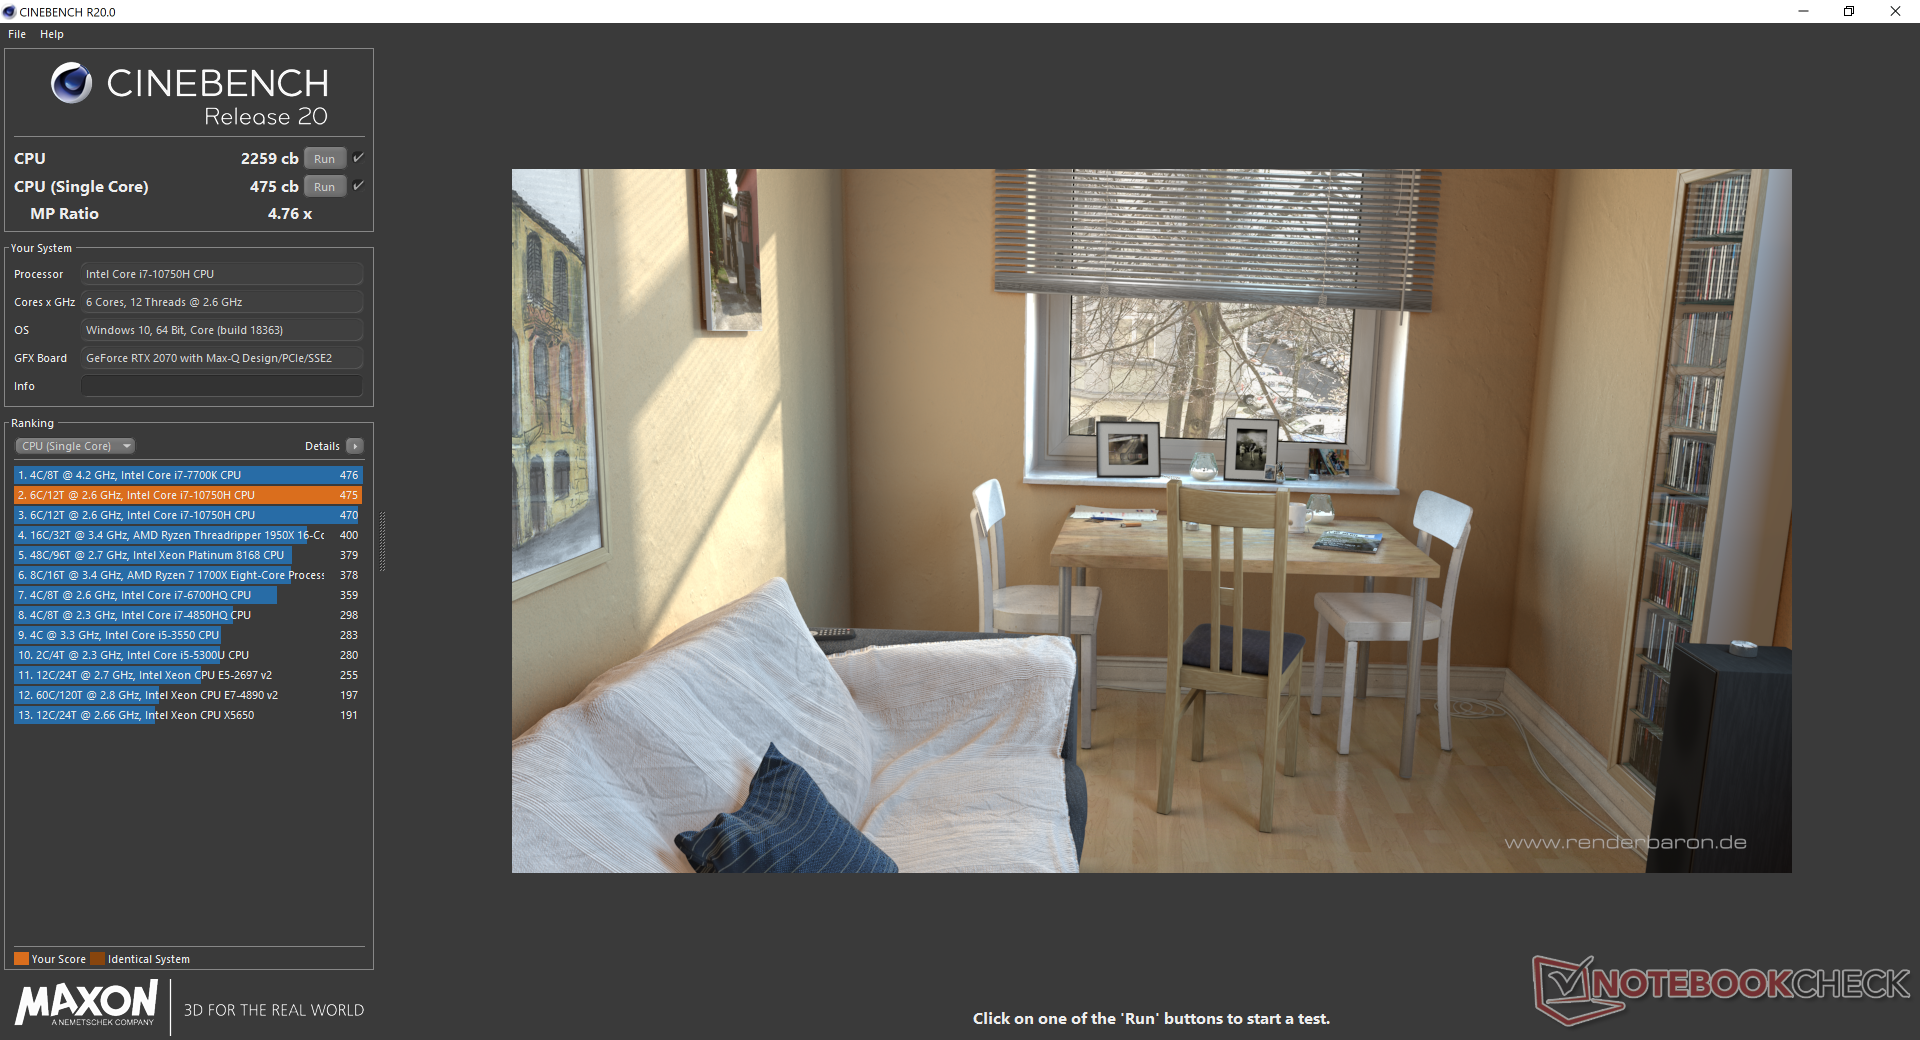
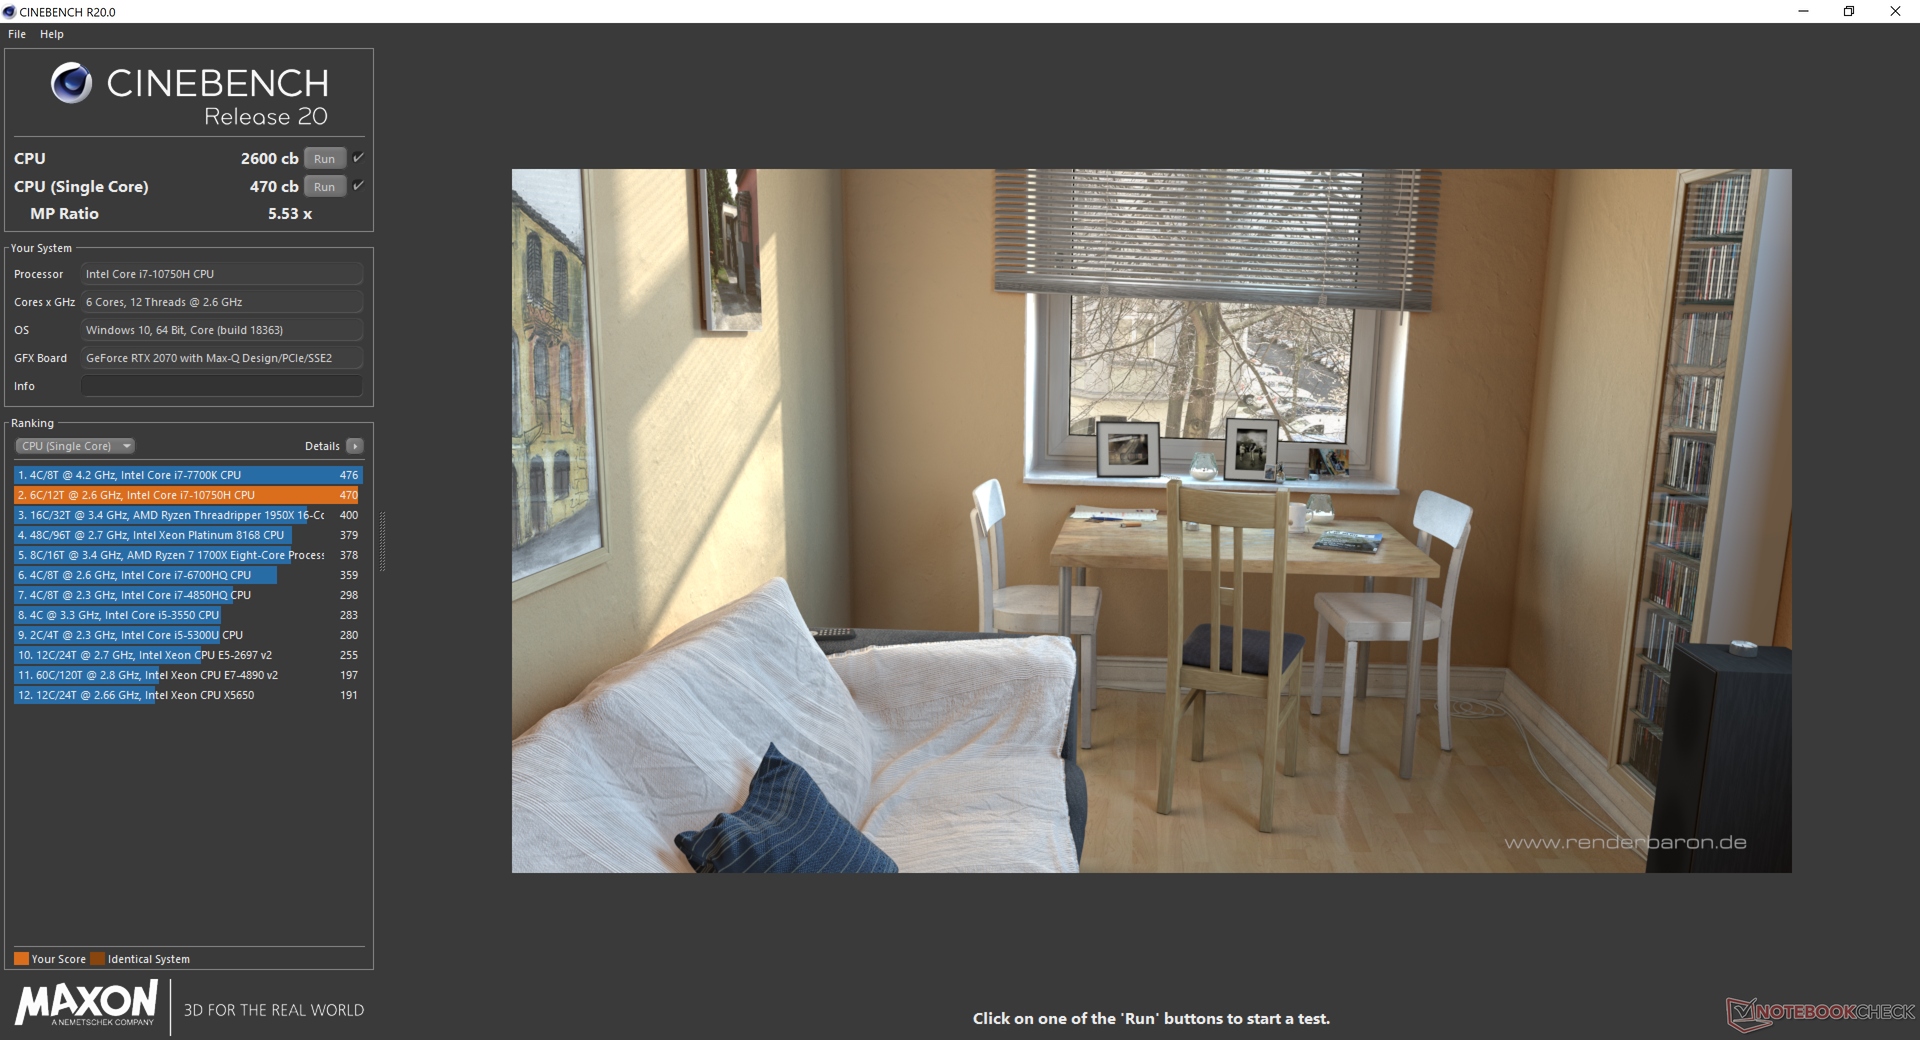
Razer offers two CPU options: the hexa-core Core i7-10750H and octa-core Core i7-10875H. The latter, however, is reserved only for the Blade 15 Advanced Model. Raw multi-thread performance on our 10th gen Core i7-10750H is roughly 12 to 25 percent faster than the 9th gen Core i7-9750H in the older 2019 Blade 15 Base Model. When looking at the bigger picture, however, the 2020 Blade 15 appears to be running the Core i7-10750H below average when compared to competing laptops with the same CPU. The average Core i7-10750H in our database is roughly 10 to 20 percent faster in multi-threaded loads than our Razer. In other words, the Blade 15 Core i7-10750H is one of the slower Core i7-10750H laptops at the moment even though it still outperforms the Blade 15 Core i7-9750H.
When running CineBench R15 Multi-Thread in a loop, performance would dip by about 9 percent over time since the system is unable to sustain maximum Turbo Boost clock rates indefinitely. Eventually, raw CPU performance would equalize to the same level as the Blade 15 Core i7-9750H after accounting for throttling.
See our dedicated page on the Core i7-10750H for more technical information and benchmarks. Note that these CPU benchmarks were performed on Razer Creator mode which prioritizes CPU performance. a CineBench R20 run on Creator mode would return 15 percent higher multi-thread performance than the default Balanced mode.
Cinebench R15: CPU Multi 64Bit | CPU Single 64Bit
Blender: v2.79 BMW27 CPU
7-Zip 18.03: 7z b 4 -mmt1 | 7z b 4
Geekbench 5.5: Single-Core | Multi-Core
HWBOT x265 Benchmark v2.2: 4k Preset
LibreOffice : 20 Documents To PDF
R Benchmark 2.5: Overall mean
| Cinebench R20 / CPU (Multi Core) | |
| Eurocom Sky X4C i9-9900KS | |
| Asus Zephyrus G14 GA401IV | |
| Asus TUF Gaming A15 FA506UI | |
| Gigabyte Aero 15 OLED XB-8DE51B0SP | |
| MSI GS66 Stealth 10SFS | |
| MSI GE65 Raider 9SF-049US | |
| Average Intel Core i7-10750H (1749 - 3325, n=43) | |
| Razer Blade 15 RZ09-0328 | |
| Average Intel Core i7-9750H (2017 - 3133, n=55) | |
| MSI GE63 Raider 8SG | |
| Razer Blade 15 GTX 1660 Ti | |
| MSI Alpha 15 A3DDK-034 | |
| Cinebench R20 / CPU (Single Core) | |
| Gigabyte Aero 15 OLED XB-8DE51B0SP | |
| Eurocom Sky X4C i9-9900KS | |
| Asus Zephyrus G14 GA401IV | |
| MSI GS66 Stealth 10SFS | |
| MSI GE65 Raider 9SF-049US | |
| Average Intel Core i7-10750H (431 - 504, n=43) | |
| Razer Blade 15 RZ09-0328 | |
| Average Intel Core i7-9750H (416 - 486, n=55) | |
| Razer Blade 15 GTX 1660 Ti | |
| MSI GE63 Raider 8SG | |
| MSI Alpha 15 A3DDK-034 | |
| Cinebench R15 / CPU Multi 64Bit | |
| Eurocom Sky X4C i9-9900KS | |
| Asus Zephyrus G14 GA401IV | |
| Asus TUF Gaming A15 FA506UI | |
| Gigabyte Aero 15 OLED XB-8DE51B0SP | |
| MSI GS66 Stealth 10SFS | |
| MSI GE65 Raider 9SF-049US | |
| Average Intel Core i7-10750H (804 - 1418, n=50) | |
| Average Intel Core i7-9750H (952 - 1306, n=85) | |
| Razer Blade 15 RZ09-0328 | |
| MSI GE63 Raider 8SG | |
| Razer Blade 15 GTX 1660 Ti | |
| MSI Alpha 15 A3DDK-034 | |
| Cinebench R15 / CPU Single 64Bit | |
| Eurocom Sky X4C i9-9900KS | |
| Gigabyte Aero 15 OLED XB-8DE51B0SP | |
| MSI GS66 Stealth 10SFS | |
| MSI GE65 Raider 9SF-049US | |
| Average Intel Core i7-10750H (184 - 213, n=45) | |
| Asus Zephyrus G14 GA401IV | |
| Razer Blade 15 RZ09-0328 | |
| Average Intel Core i7-9750H (170 - 194, n=82) | |
| Razer Blade 15 GTX 1660 Ti | |
| MSI GE63 Raider 8SG | |
| MSI Alpha 15 A3DDK-034 | |
| Blender / v2.79 BMW27 CPU | |
| Average Intel Core i7-9750H (342 - 495, n=21) | |
| Razer Blade 15 RZ09-0328 | |
| Average Intel Core i7-10750H (322 - 587, n=43) | |
| Asus Zephyrus G14 GA401IV | |
| MSI GS66 Stealth 10SFS | |
| Gigabyte Aero 15 OLED XB-8DE51B0SP | |
| Eurocom Sky X4C i9-9900KS | |
| 7-Zip 18.03 / 7z b 4 -mmt1 | |
| Eurocom Sky X4C i9-9900KS | |
| Gigabyte Aero 15 OLED XB-8DE51B0SP | |
| MSI GS66 Stealth 10SFS | |
| Average Intel Core i7-10750H (4504 - 5470, n=43) | |
| Razer Blade 15 RZ09-0328 | |
| Average Intel Core i7-9750H (4580 - 5090, n=21) | |
| Asus Zephyrus G14 GA401IV | |
| 7-Zip 18.03 / 7z b 4 | |
| Eurocom Sky X4C i9-9900KS | |
| Asus Zephyrus G14 GA401IV | |
| Gigabyte Aero 15 OLED XB-8DE51B0SP | |
| MSI GS66 Stealth 10SFS | |
| Average Intel Core i7-10750H (26040 - 37345, n=43) | |
| Average Intel Core i7-9750H (28512 - 35174, n=21) | |
| Razer Blade 15 RZ09-0328 | |
| Geekbench 5.5 / Single-Core | |
| Eurocom Sky X4C i9-9900KS | |
| Gigabyte Aero 15 OLED XB-8DE51B0SP | |
| MSI GS66 Stealth 10SFS | |
| Average Intel Core i7-10750H (1114 - 1333, n=43) | |
| Asus Zephyrus G14 GA401IV | |
| Average Intel Core i7-9750H (1117 - 1251, n=13) | |
| Razer Blade 15 RZ09-0328 | |
| MSI Alpha 15 A3DDK-034 | |
| Geekbench 5.5 / Multi-Core | |
| Eurocom Sky X4C i9-9900KS | |
| Gigabyte Aero 15 OLED XB-8DE51B0SP | |
| Asus Zephyrus G14 GA401IV | |
| MSI GS66 Stealth 10SFS | |
| Average Intel Core i7-10750H (4443 - 6674, n=43) | |
| Average Intel Core i7-9750H (4859 - 6262, n=13) | |
| Razer Blade 15 RZ09-0328 | |
| MSI Alpha 15 A3DDK-034 | |
| HWBOT x265 Benchmark v2.2 / 4k Preset | |
| Eurocom Sky X4C i9-9900KS | |
| Gigabyte Aero 15 OLED XB-8DE51B0SP | |
| MSI GS66 Stealth 10SFS | |
| Asus Zephyrus G14 GA401IV | |
| Average Intel Core i7-10750H (5.54 - 11.6, n=43) | |
| Average Intel Core i7-9750H (7.1 - 10.7, n=21) | |
| Razer Blade 15 RZ09-0328 | |
| LibreOffice / 20 Documents To PDF | |
| Average Intel Core i7-9750H (54.5 - 64.7, n=9) | |
| Average Intel Core i7-10750H (43.1 - 99.2, n=43) | |
| Razer Blade 15 RZ09-0328 | |
| MSI GS66 Stealth 10SFS | |
| Gigabyte Aero 15 OLED XB-8DE51B0SP | |
| R Benchmark 2.5 / Overall mean | |
| Average Intel Core i7-9750H (0.608 - 0.695, n=14) | |
| Average Intel Core i7-10750H (0.578 - 0.708, n=42) | |
| MSI GS66 Stealth 10SFS | |
| Gigabyte Aero 15 OLED XB-8DE51B0SP | |
* ... smaller is better
System Performance
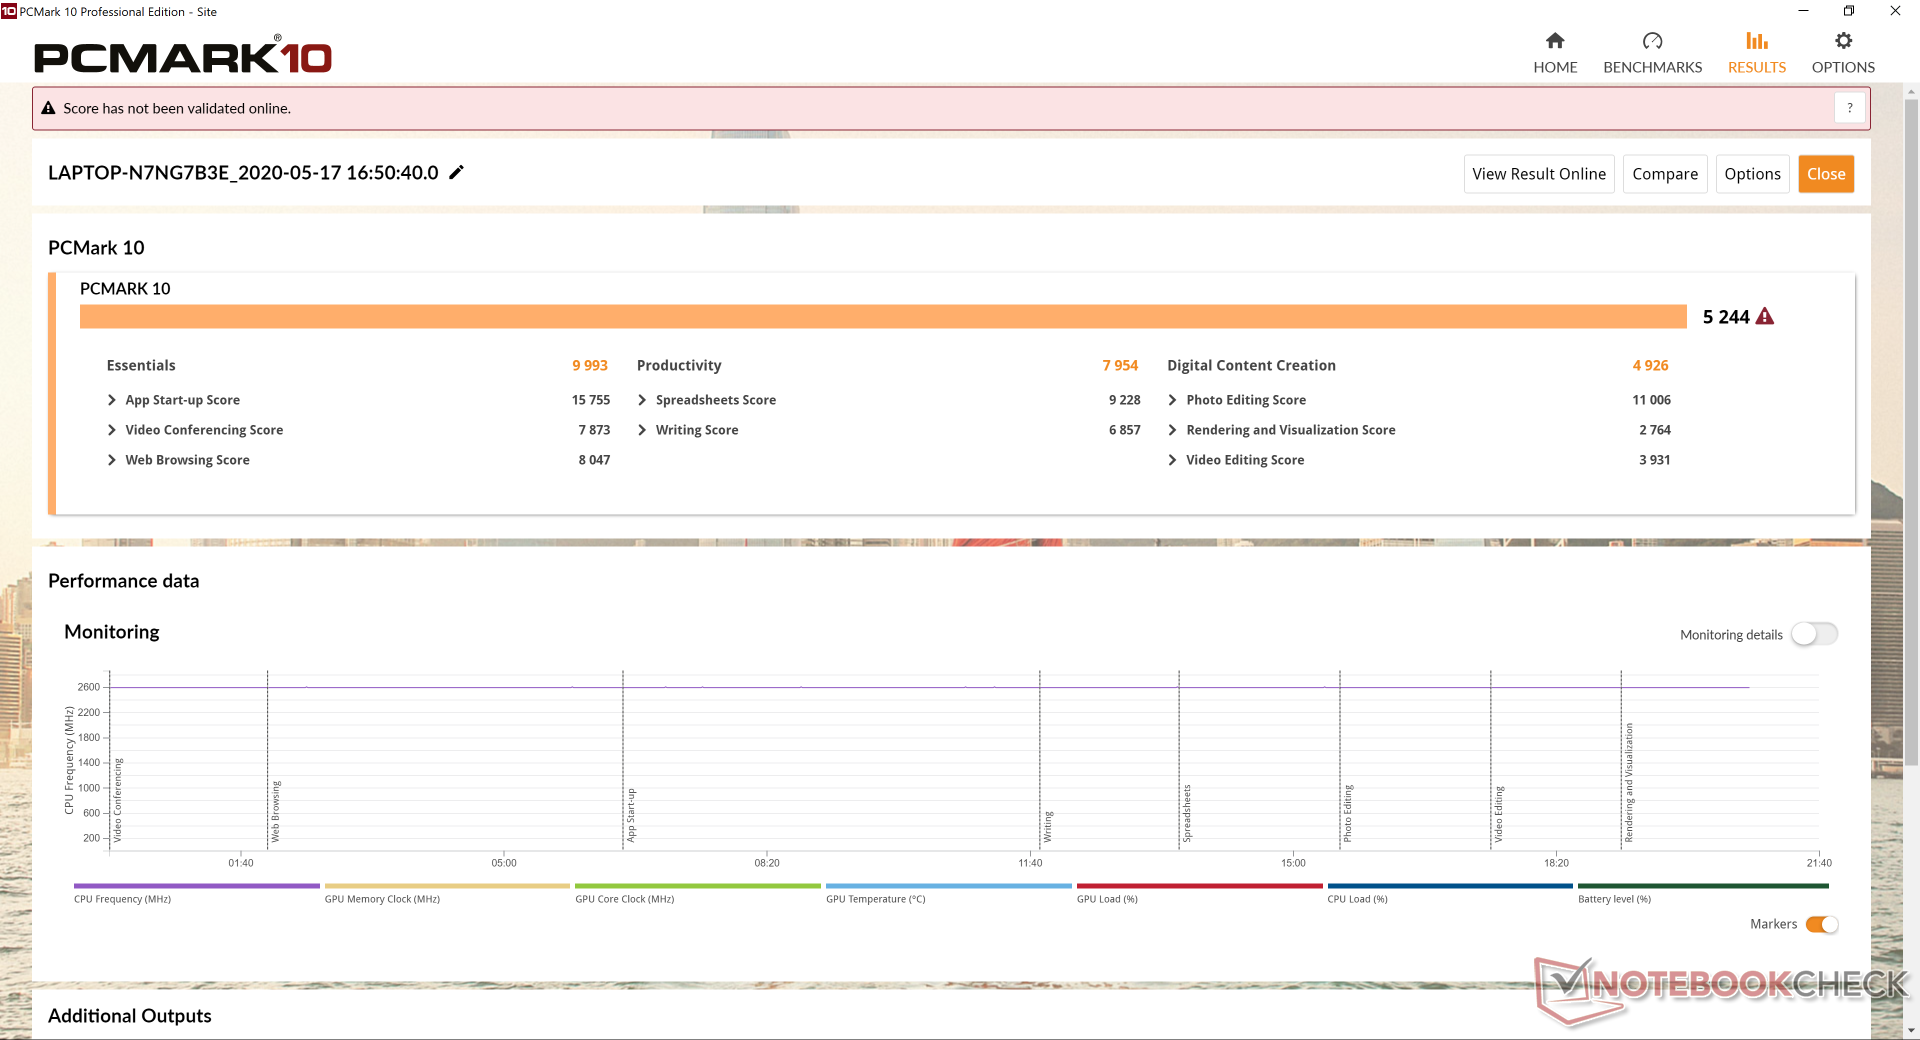
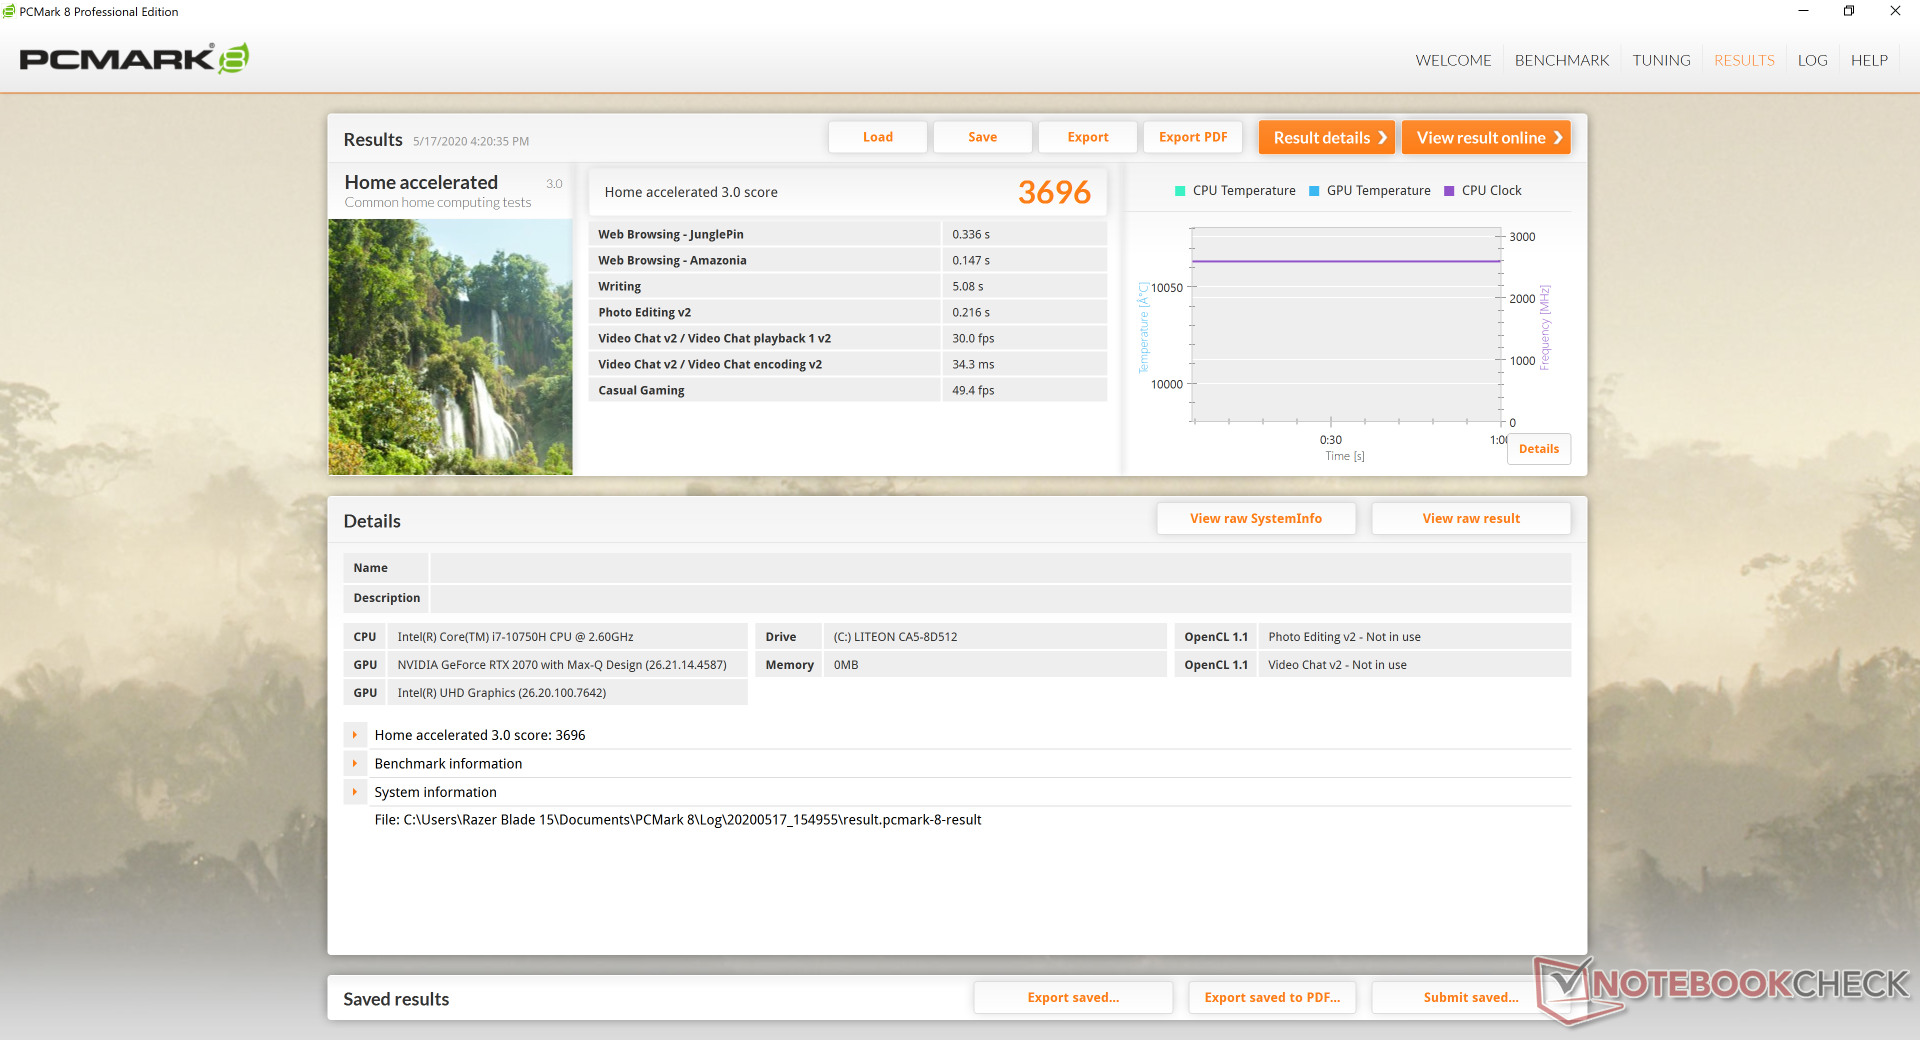
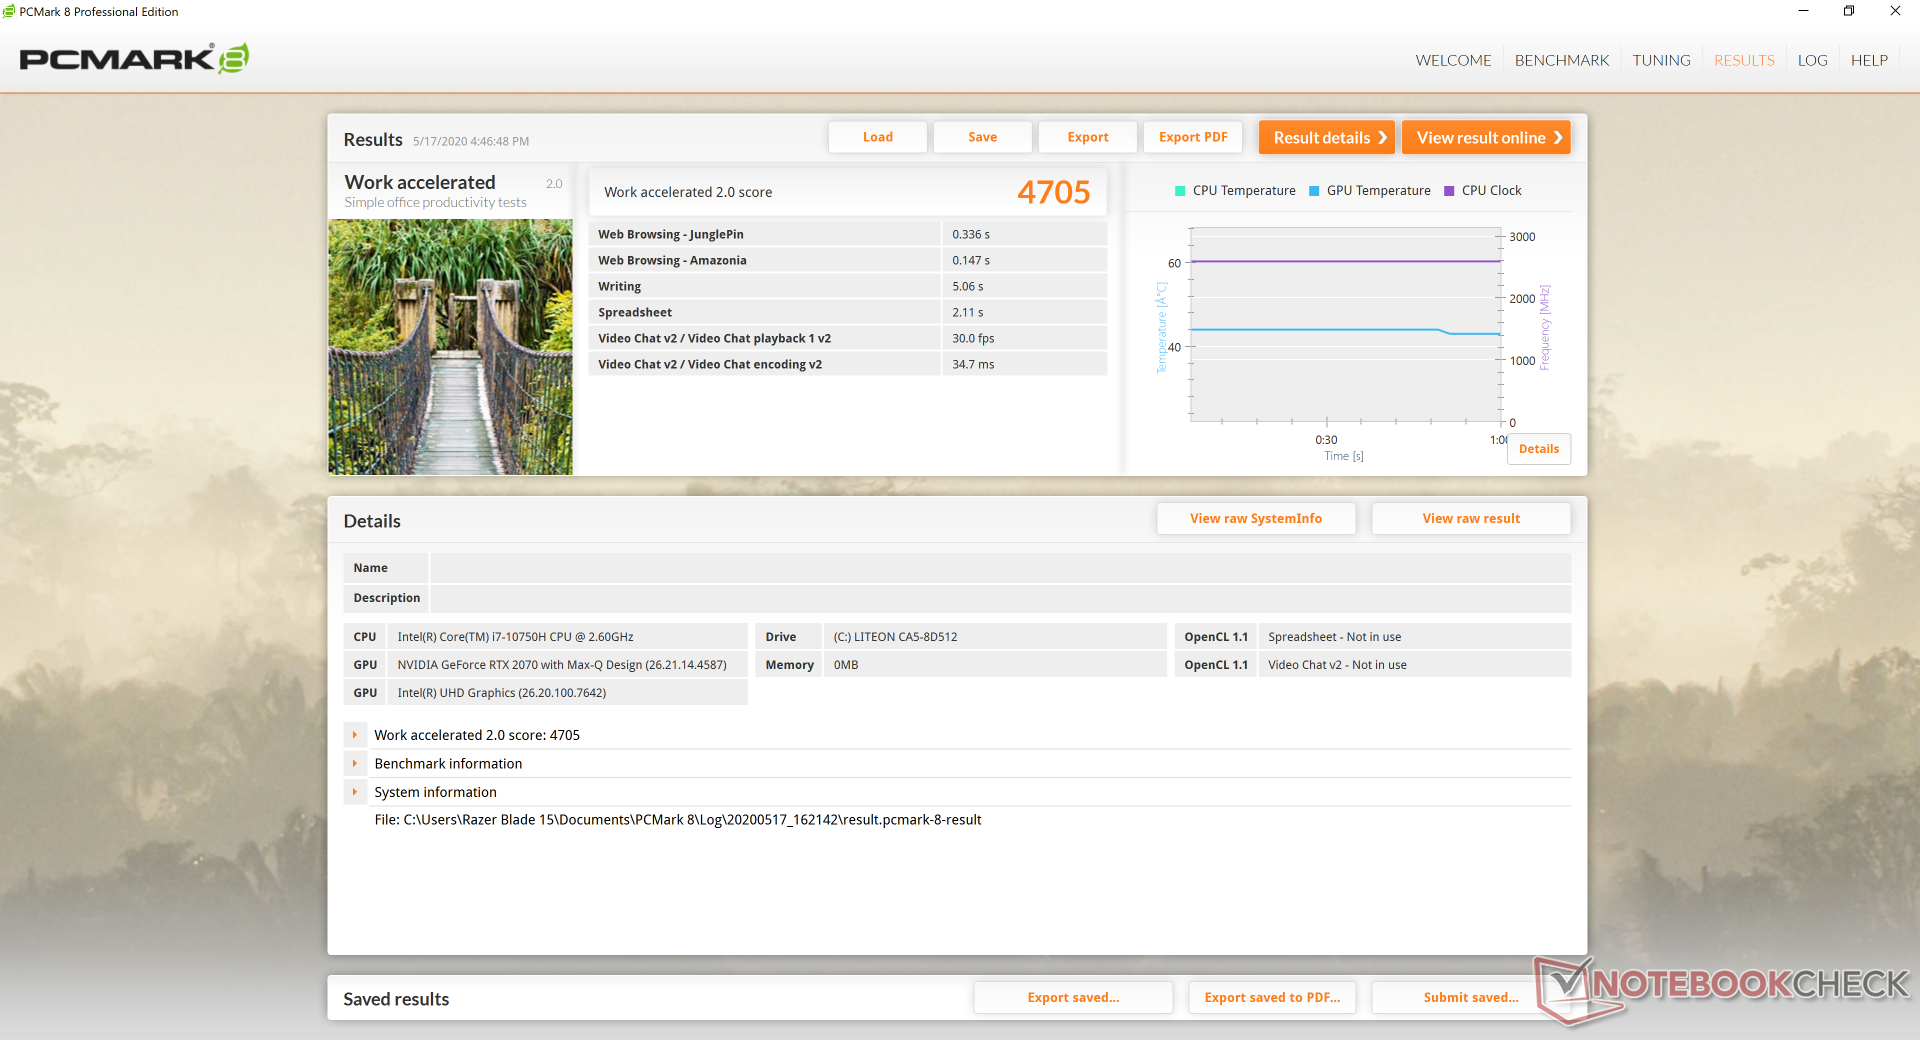
PCMark scores are comparable to other laptops with Core H-series CPUs and GeForce GPUs with the strange exception of the Digital Content Creation benchmark. Despite updating to the latest version at the time of review and double-checking that the system settings are on High Performance mode, the score remains unusually low on our Blade 15. Thankfully, this appears to be more of an oddity with the benchmark than any indication of real-world performance. We experienced no performance hiccups or bugs during our time with the test unit otherwise.
| PCMark 8 | |
| Home Score Accelerated v2 | |
| MSI GS66 10SGS | |
| Razer Blade 15 RTX 2080 Max-Q | |
| Alienware m15 R2 P87F | |
| Asus Zephyrus S GX531GX | |
| Razer Blade 15 RZ09-0328 | |
| Work Score Accelerated v2 | |
| MSI GS66 10SGS | |
| Razer Blade 15 RTX 2080 Max-Q | |
| Alienware m15 R2 P87F | |
| Asus Zephyrus S GX531GX | |
| Razer Blade 15 RZ09-0328 | |
| PCMark 8 Home Score Accelerated v2 | 3696 points | |
| PCMark 8 Work Score Accelerated v2 | 4705 points | |
| PCMark 10 Score | 5244 points | |
Help | ||
DPC Latency
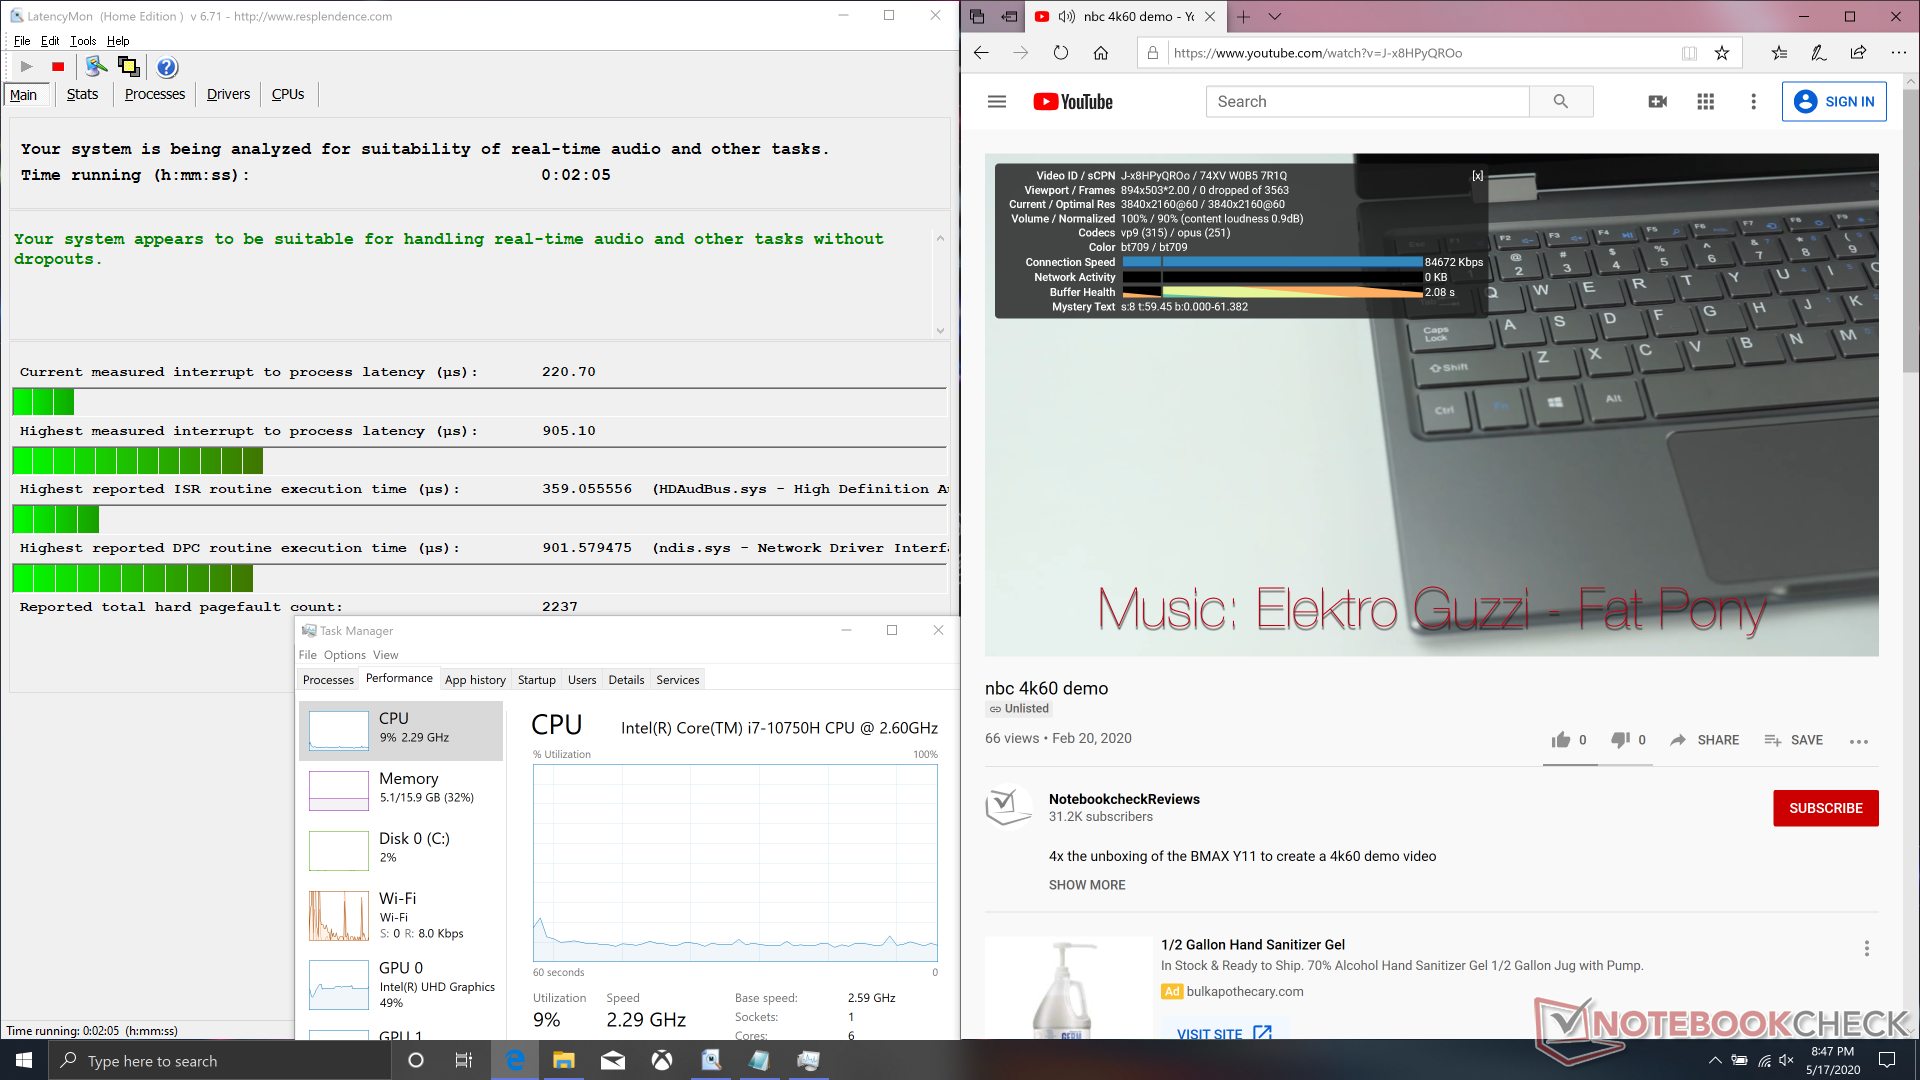
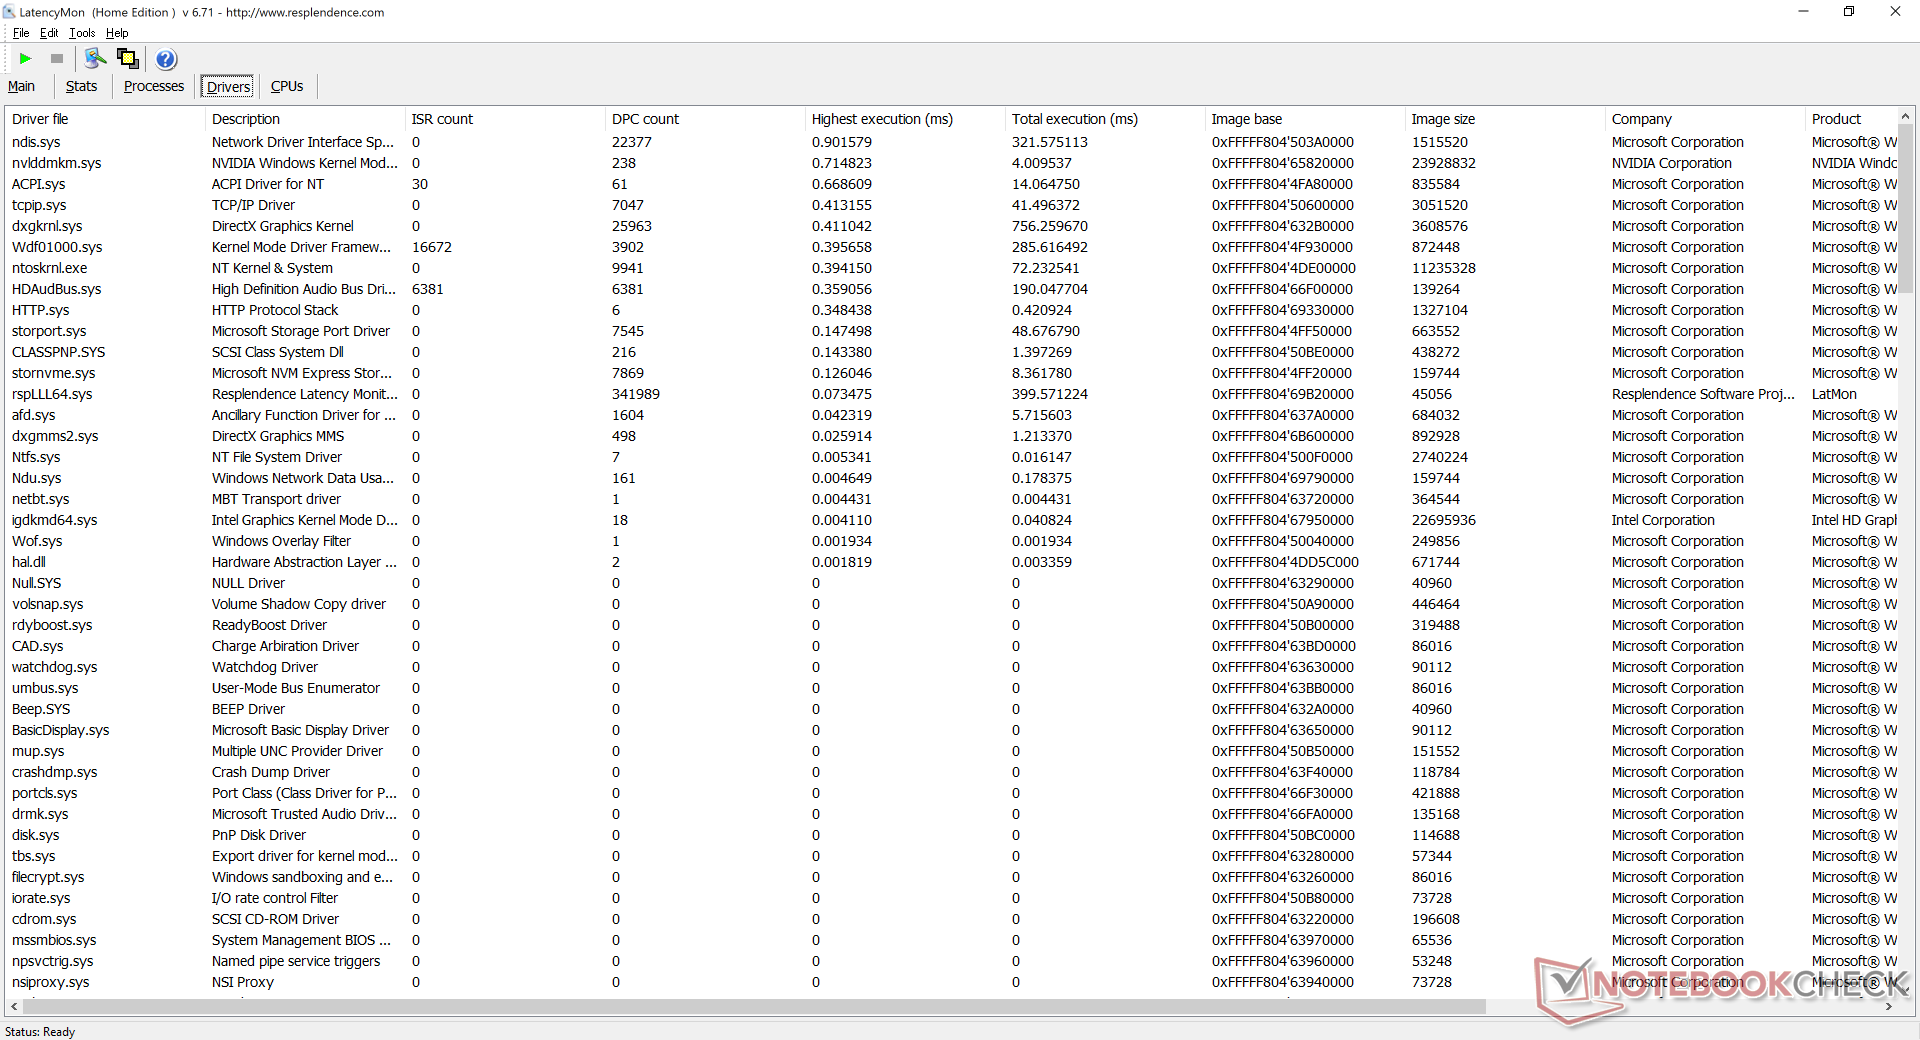
LatencyMon shows no DPC latency issues when opening multiple browser tabs on our homepage. 4K UHD playback on YouTube returns no dropped frames as well.
| DPC Latencies / LatencyMon - interrupt to process latency (max), Web, Youtube, Prime95 | |
| Apple MacBook Air 2020 i5 | |
| Gigabyte Aero 15 OLED XB-8DE51B0SP | |
| MSI GS66 10SGS | |
| SCHENKER XMG Apex 15 NH57AF1 | |
| Razer Blade 15 RZ09-0328 | |
* ... smaller is better
Storage Devices
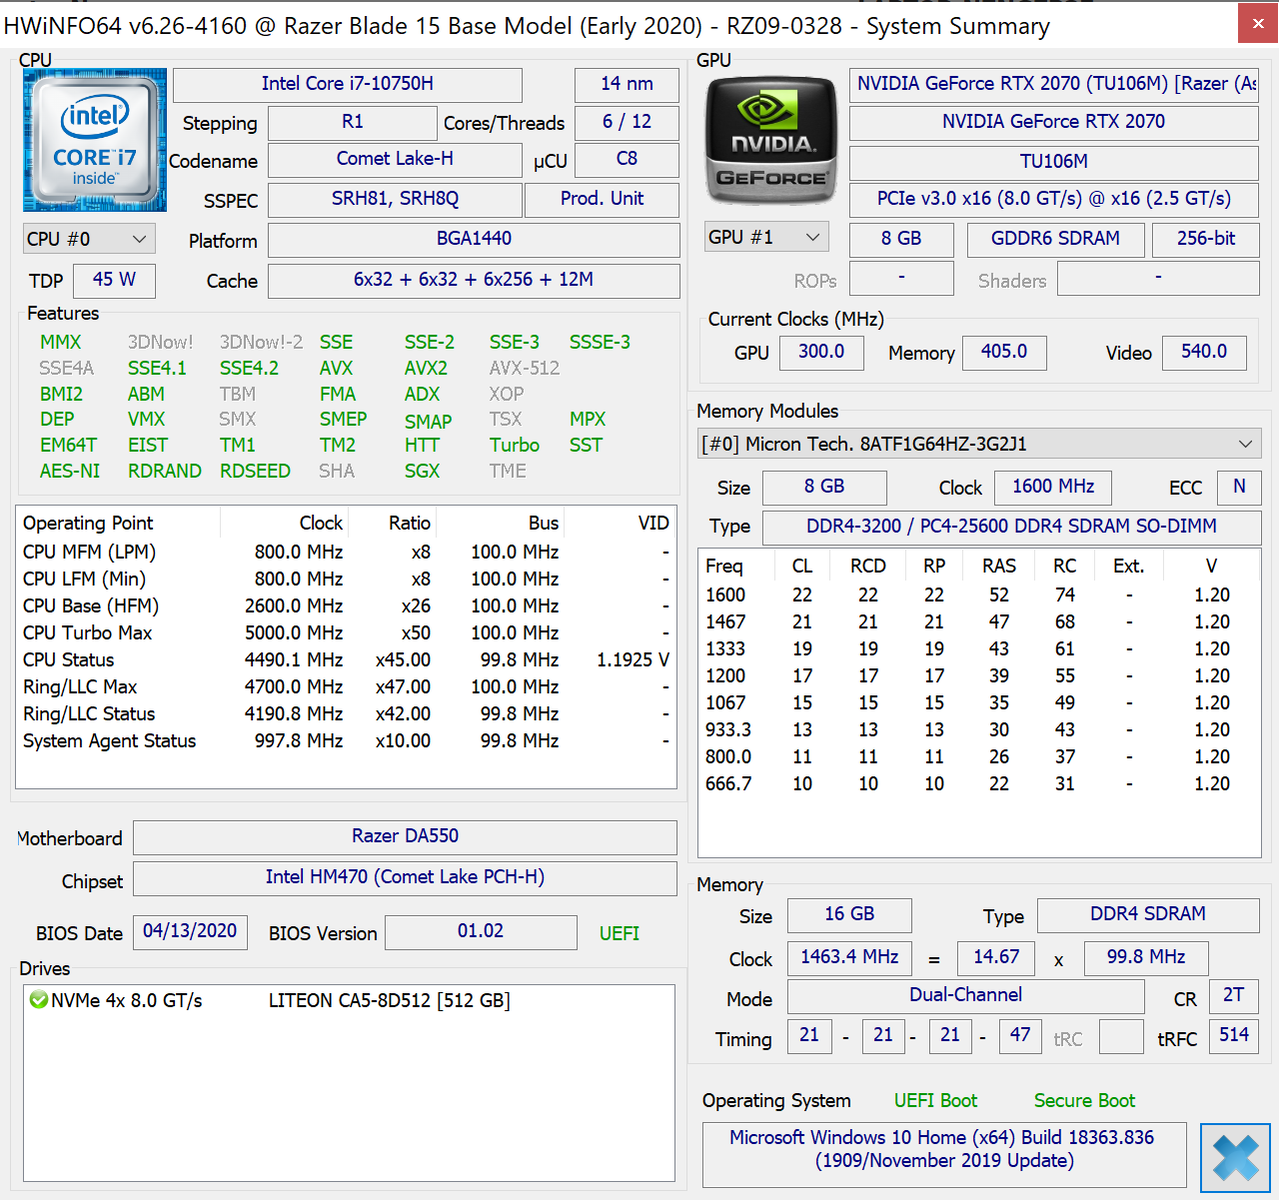
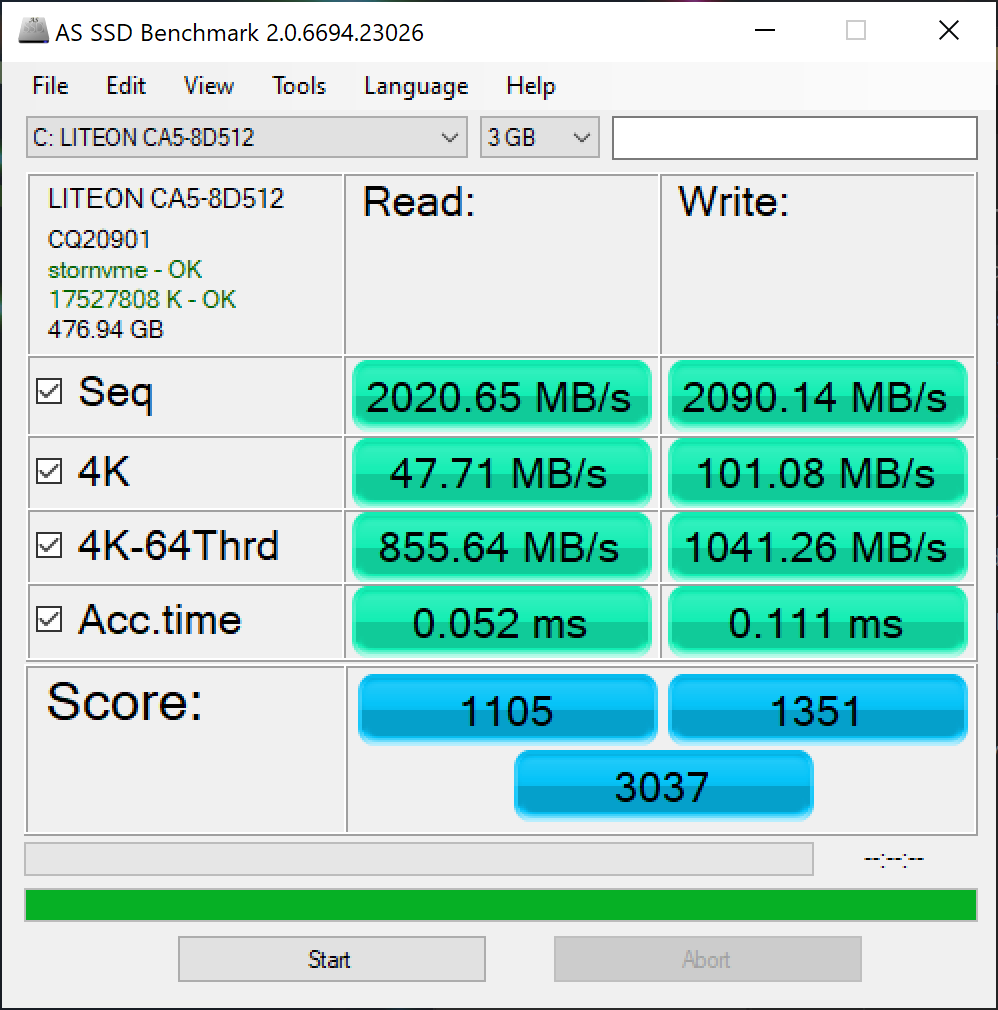
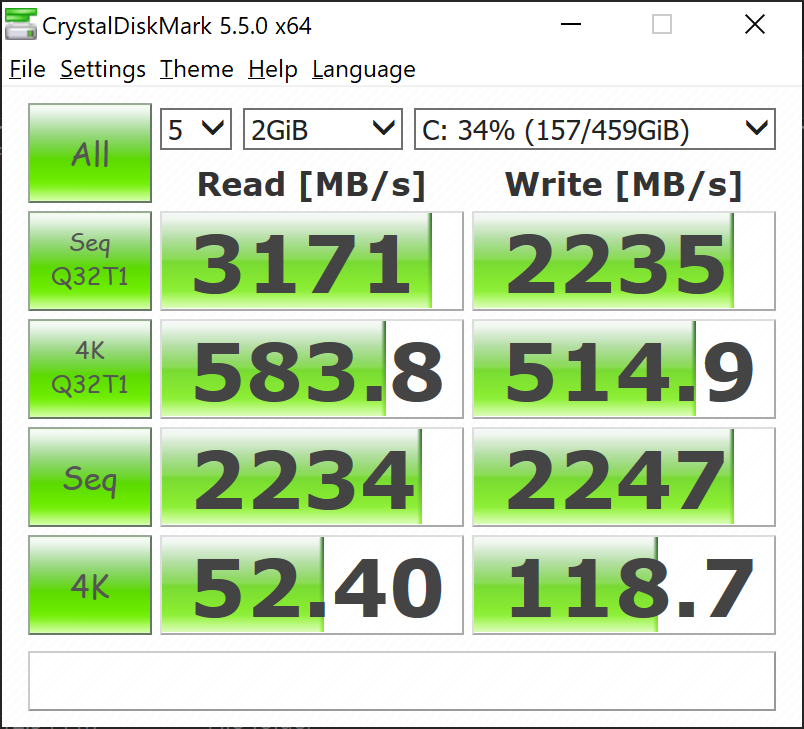
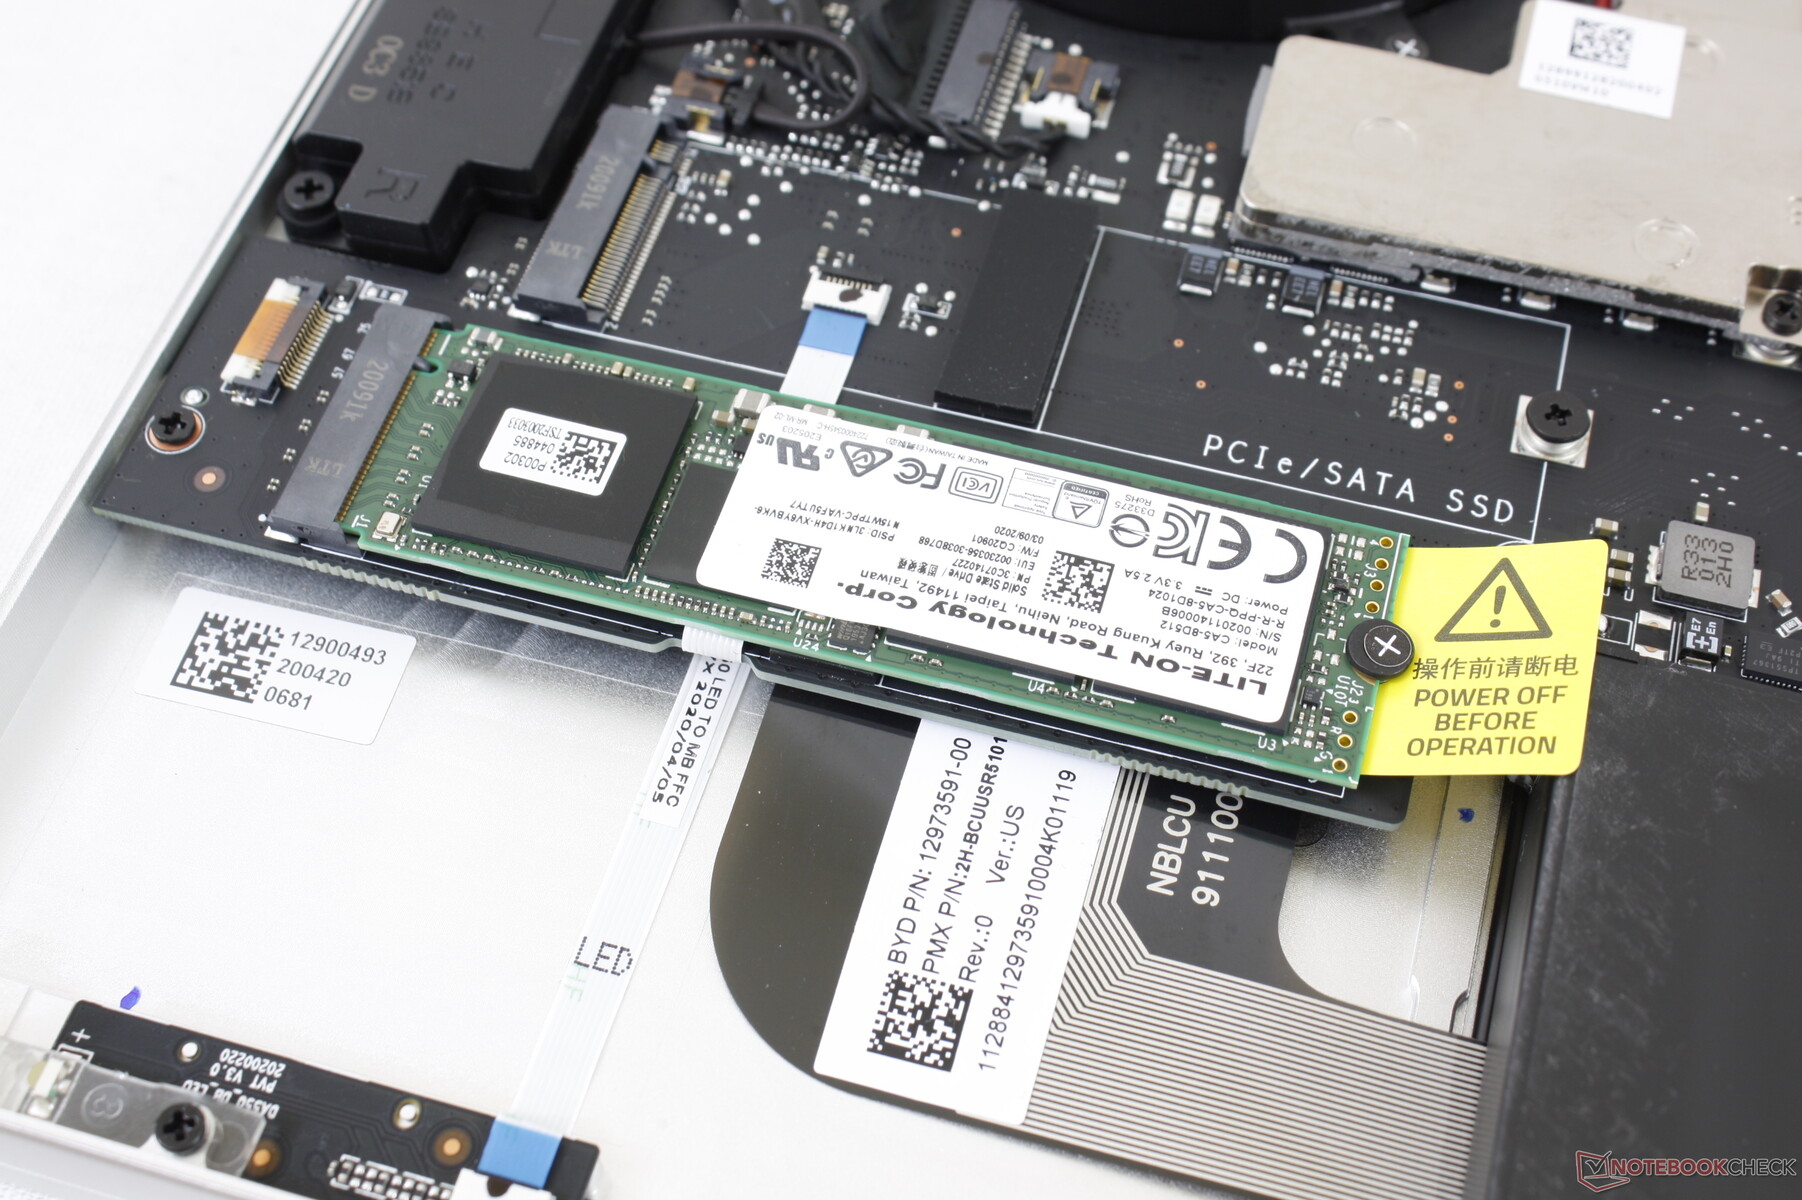
Though most Blade 15/17 SKUs come with Samsung SSDs, a few ship with Lite-On drives instead. Our particular test unit comes with a 512 GB Lite-On CA5-8D512 NVMe SSD which is a first for our database. Performance is comparable to the Samsung PM981 according to AS SSD and CrystalDiskMark.
Keep in mind that the Base Model comes with two M.2 slots at the expense of a larger battery. Users can double-up on two NVMe drives in RAID configuration which was previously impossible on older Blade 15 Base Model systems.
| Razer Blade 15 RZ09-0328 Lite-On CA5-8D512 | Razer Blade 15 RTX 2080 Max-Q Samsung SSD PM981 MZVLB512HAJQ | MSI GS66 10SGS Samsung SSD PM981 MZVLB512HAJQ | Asus Zephyrus S GX531GX Intel SSD 660p SSDPEKNW512G8 | Gigabyte Aero 15 OLED XB-8DE51B0SP Intel Optane Memory H10 with Solid State Storage 32GB + 512GB HBRPEKNX0202A(L/H) | Alienware m15 R2 P87F 2x Toshiba XG6 KXG60ZNV512G (RAID 0) | |
|---|---|---|---|---|---|---|
| AS SSD | 18% | 21% | -27% | -15% | 6% | |
| Seq Read | 2021 | 1832 -9% | 1086 -46% | 1239 -39% | 1200 -41% | 1925 -5% |
| Seq Write | 2090 | 1864 -11% | 1901 -9% | 920 -56% | 836 -60% | 2371 13% |
| 4K Read | 47.71 | 52.1 9% | 51 7% | 45.74 -4% | 65.8 38% | 37.2 -22% |
| 4K Write | 101.1 | 108.3 7% | 117.3 16% | 95.7 -5% | 103.8 3% | 108.9 8% |
| 4K-64 Read | 856 | 1159 35% | 1503 76% | 322 -62% | 789 -8% | 1177 38% |
| 4K-64 Write | 1041 | 1807 74% | 1721 65% | 722 -31% | 929 -11% | 1135 9% |
| Access Time Read * | 0.052 | 0.05 4% | 0.059 -13% | 0.073 -40% | 0.103 -98% | 0.065 -25% |
| Access Time Write * | 0.111 | 0.034 69% | 0.1 10% | 0.047 58% | 0.045 59% | 0.108 3% |
| Score Read | 1105 | 1394 26% | 1662 50% | 492 -55% | 975 -12% | 1407 27% |
| Score Write | 1351 | 2102 56% | 2029 50% | 910 -33% | 1117 -17% | 1481 10% |
| Score Total | 3037 | 4221 39% | 4588 51% | 1654 -46% | 2594 -15% | 3633 20% |
| Copy ISO MB/s | 2474 | 2083 -16% | 2155 -13% | 1236 -50% | 2073 -16% | |
| Copy Program MB/s | 679 | 496.5 -27% | 715 5% | 703 4% | 576 -15% | |
| Copy Game MB/s | 1037 | 977 -6% | 1506 45% | 812 -22% | 1426 38% | |
| CrystalDiskMark 5.2 / 6 | -11% | -9% | -41% | -2% | 4% | |
| Write 4K | 118.7 | 137.2 16% | 132.5 12% | 93.9 -21% | 127.4 7% | 108.8 -8% |
| Read 4K | 52.4 | 46.82 -11% | 45.03 -14% | 46.29 -12% | 147.5 181% | 45.41 -13% |
| Write Seq | 2247 | 1221 -46% | 1987 -12% | 974 -57% | 485.9 -78% | 2467 10% |
| Read Seq | 2234 | 1217 -46% | 1434 -36% | 1425 -36% | 1352 -39% | 2456 10% |
| Write 4K Q32T1 | 515 | 527 2% | 467.5 -9% | 259.4 -50% | 476.5 -7% | 532 3% |
| Read 4K Q32T1 | 584 | 614 5% | 536 -8% | 296.5 -49% | 531 -9% | 590 1% |
| Write Seq Q32T1 | 2235 | 1986 -11% | 2003 -10% | 977 -56% | 1061 -53% | 2801 25% |
| Read Seq Q32T1 | 3171 | 3234 2% | 3306 4% | 1666 -47% | 2552 -20% | 3172 0% |
| Total Average (Program / Settings) | 4% /
7% | 6% /
10% | -34% /
-32% | -9% /
-9% | 5% /
5% |
* ... smaller is better

Disk Throttling: DiskSpd Read Loop, Queue Depth 8
GPU Performance
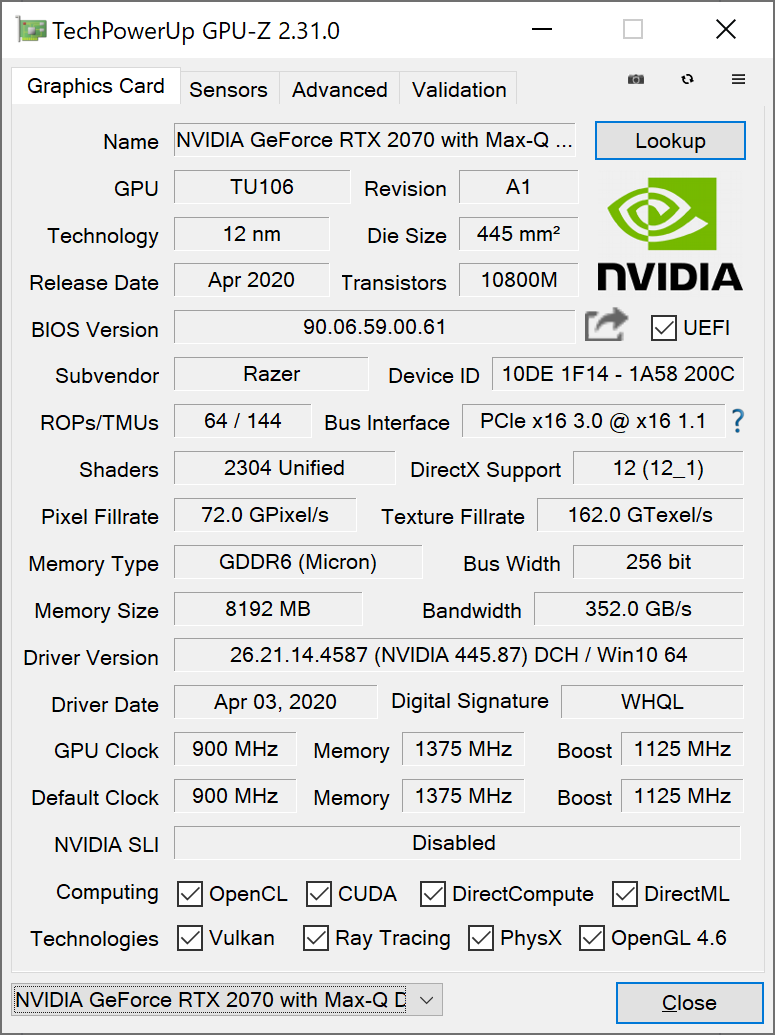
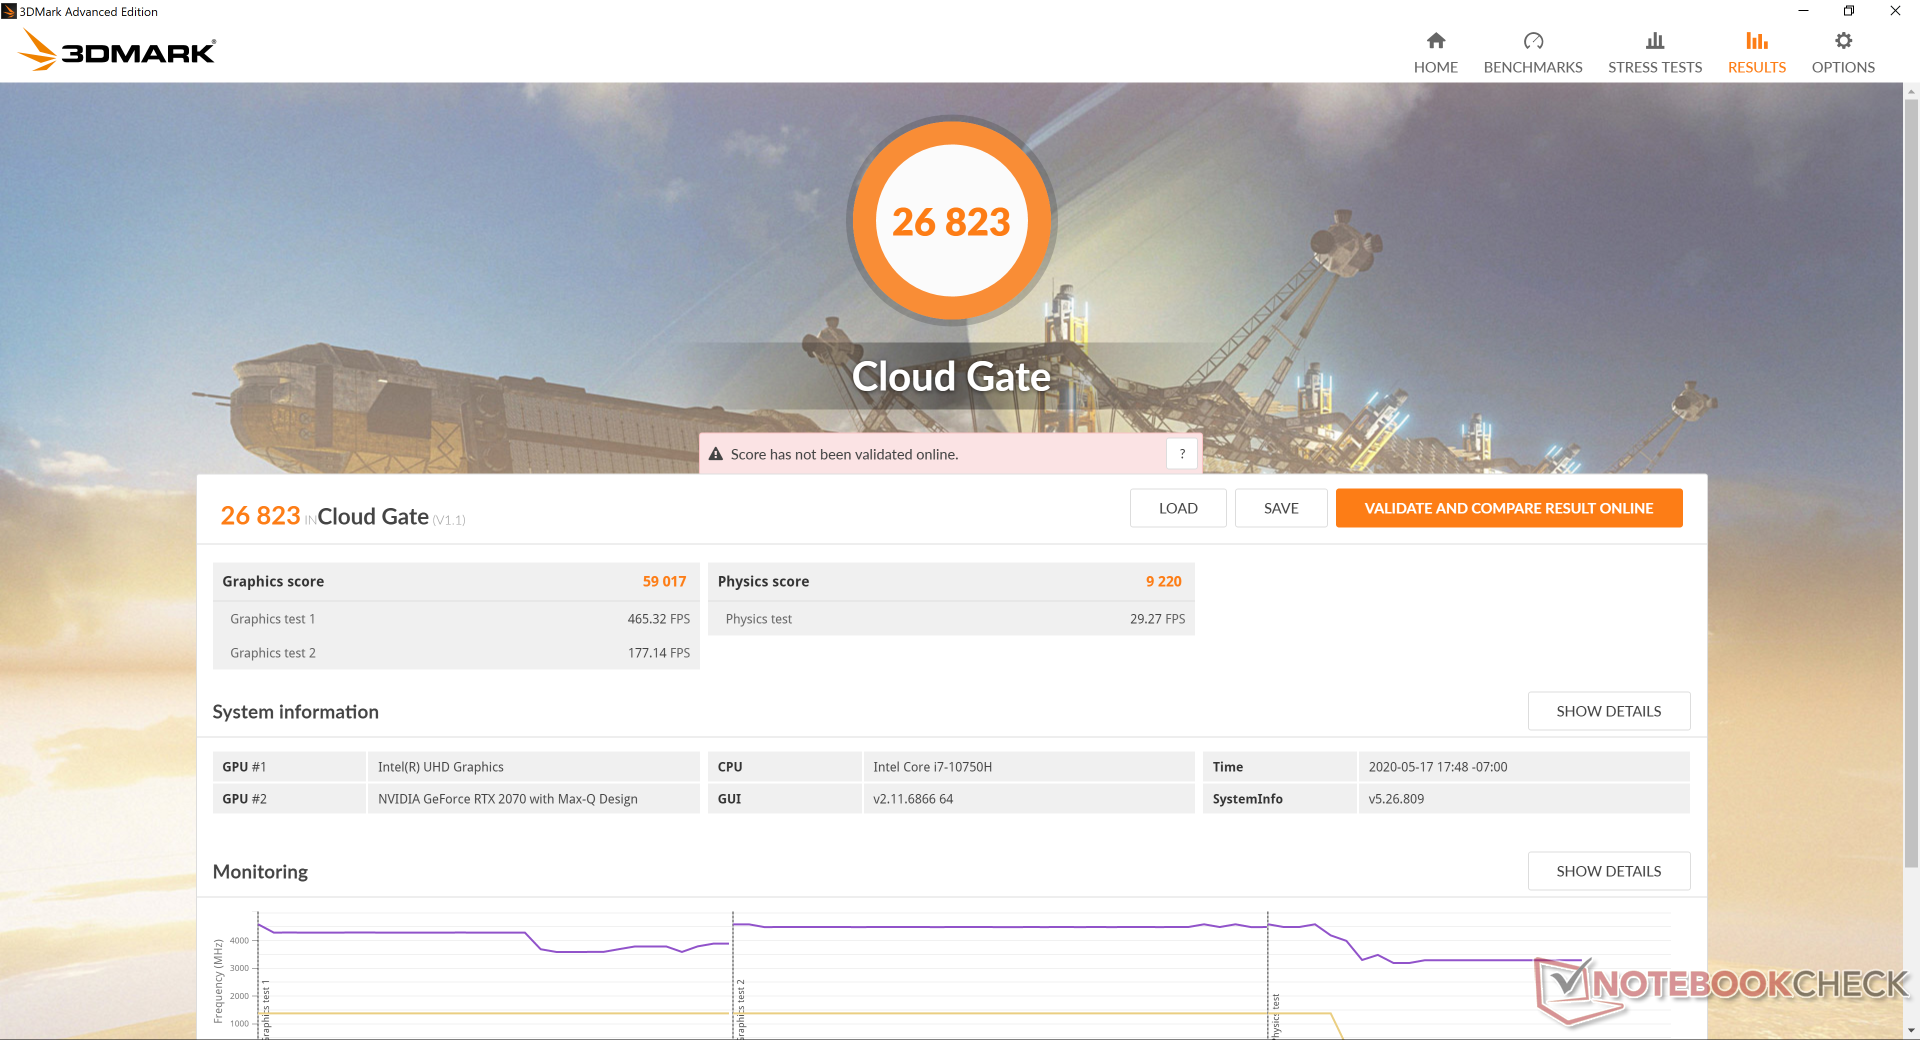
The Blade 15 Base Model uses the older GeForce RTX 2070 Max-Q instead of the newer GeForce RTX 2070 Super Max-Q. In practice, however, the Super variant will only net you 5 to 10 percent faster graphics performance at best which is minor relative to the increase in asking price. Gamers shouldn't feel like they're missing out by "settling" with last year's non-Super GPUs.
Upgrading from the GTX 1660 Ti or RTX 2060 Max-Q SKUs to the RTX 2070 Max-Q will grant roughly 15 to 20 percent faster graphics performance each before accounting for any RTX-specific advantages.
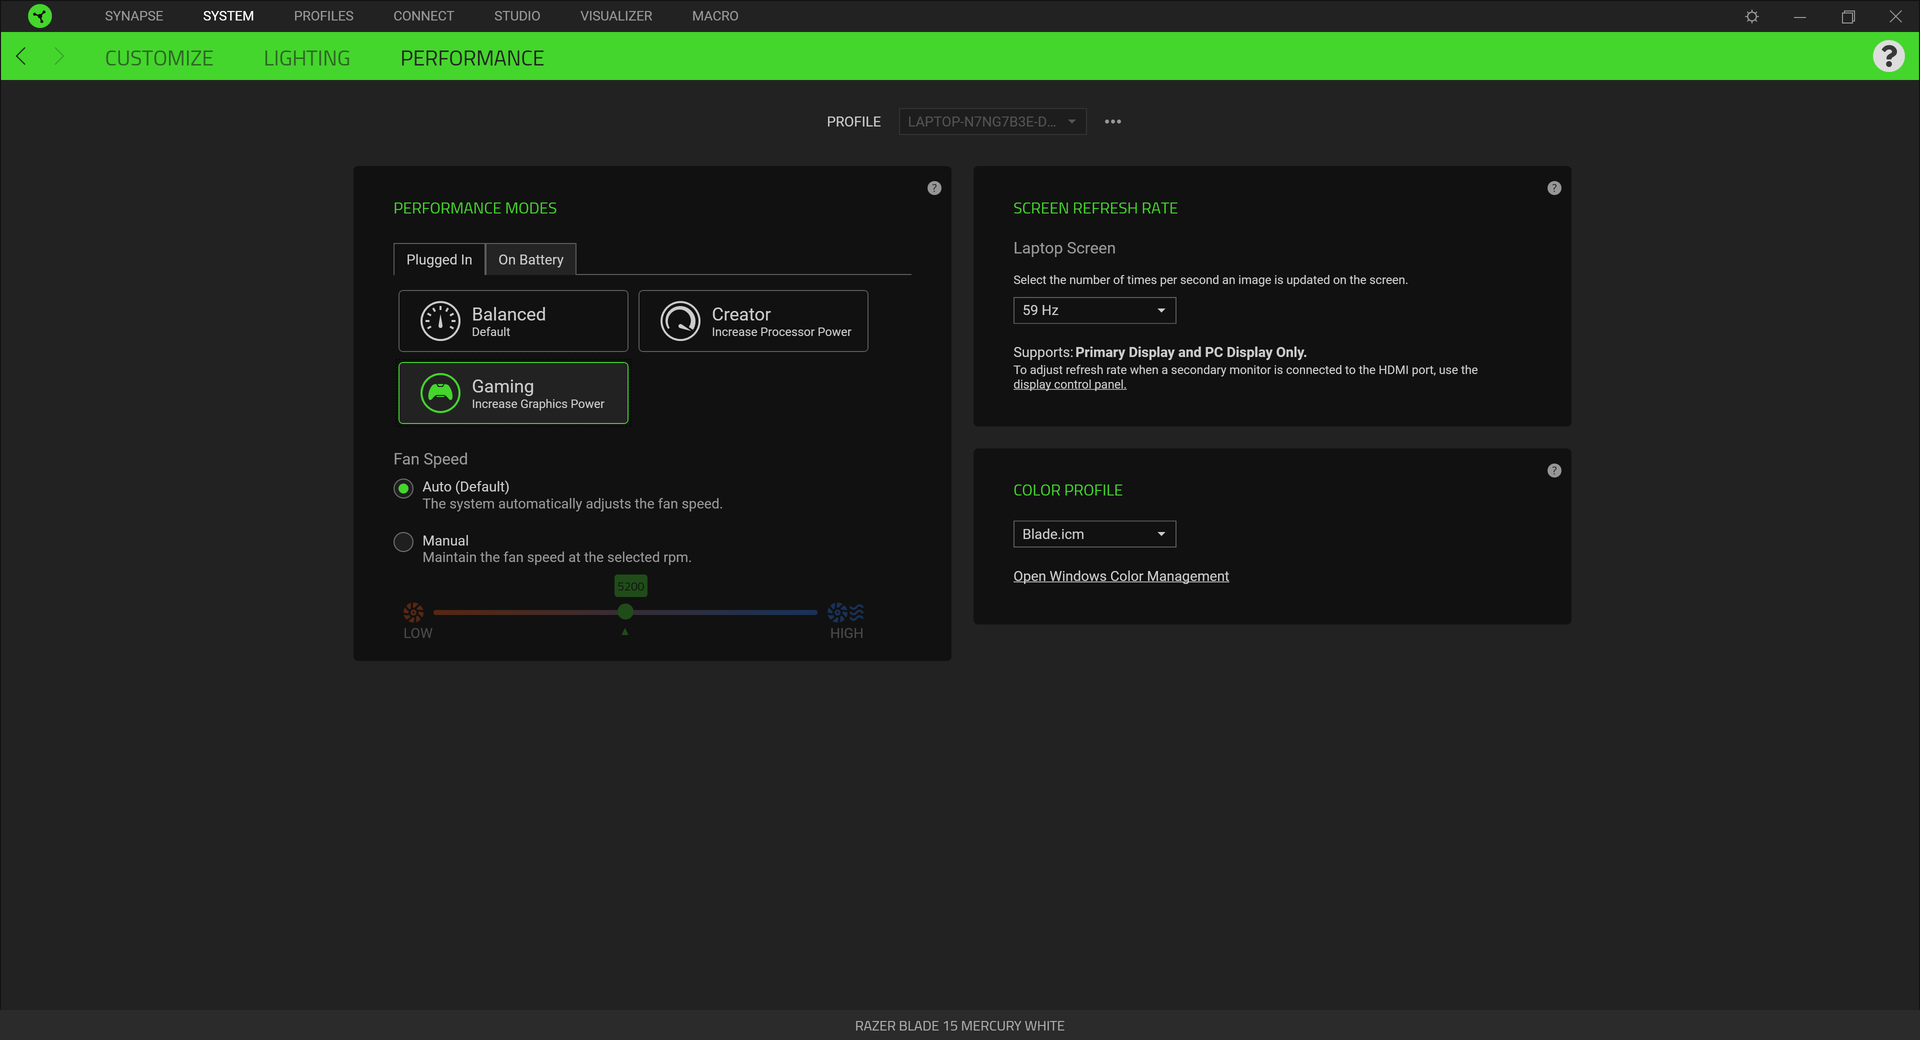
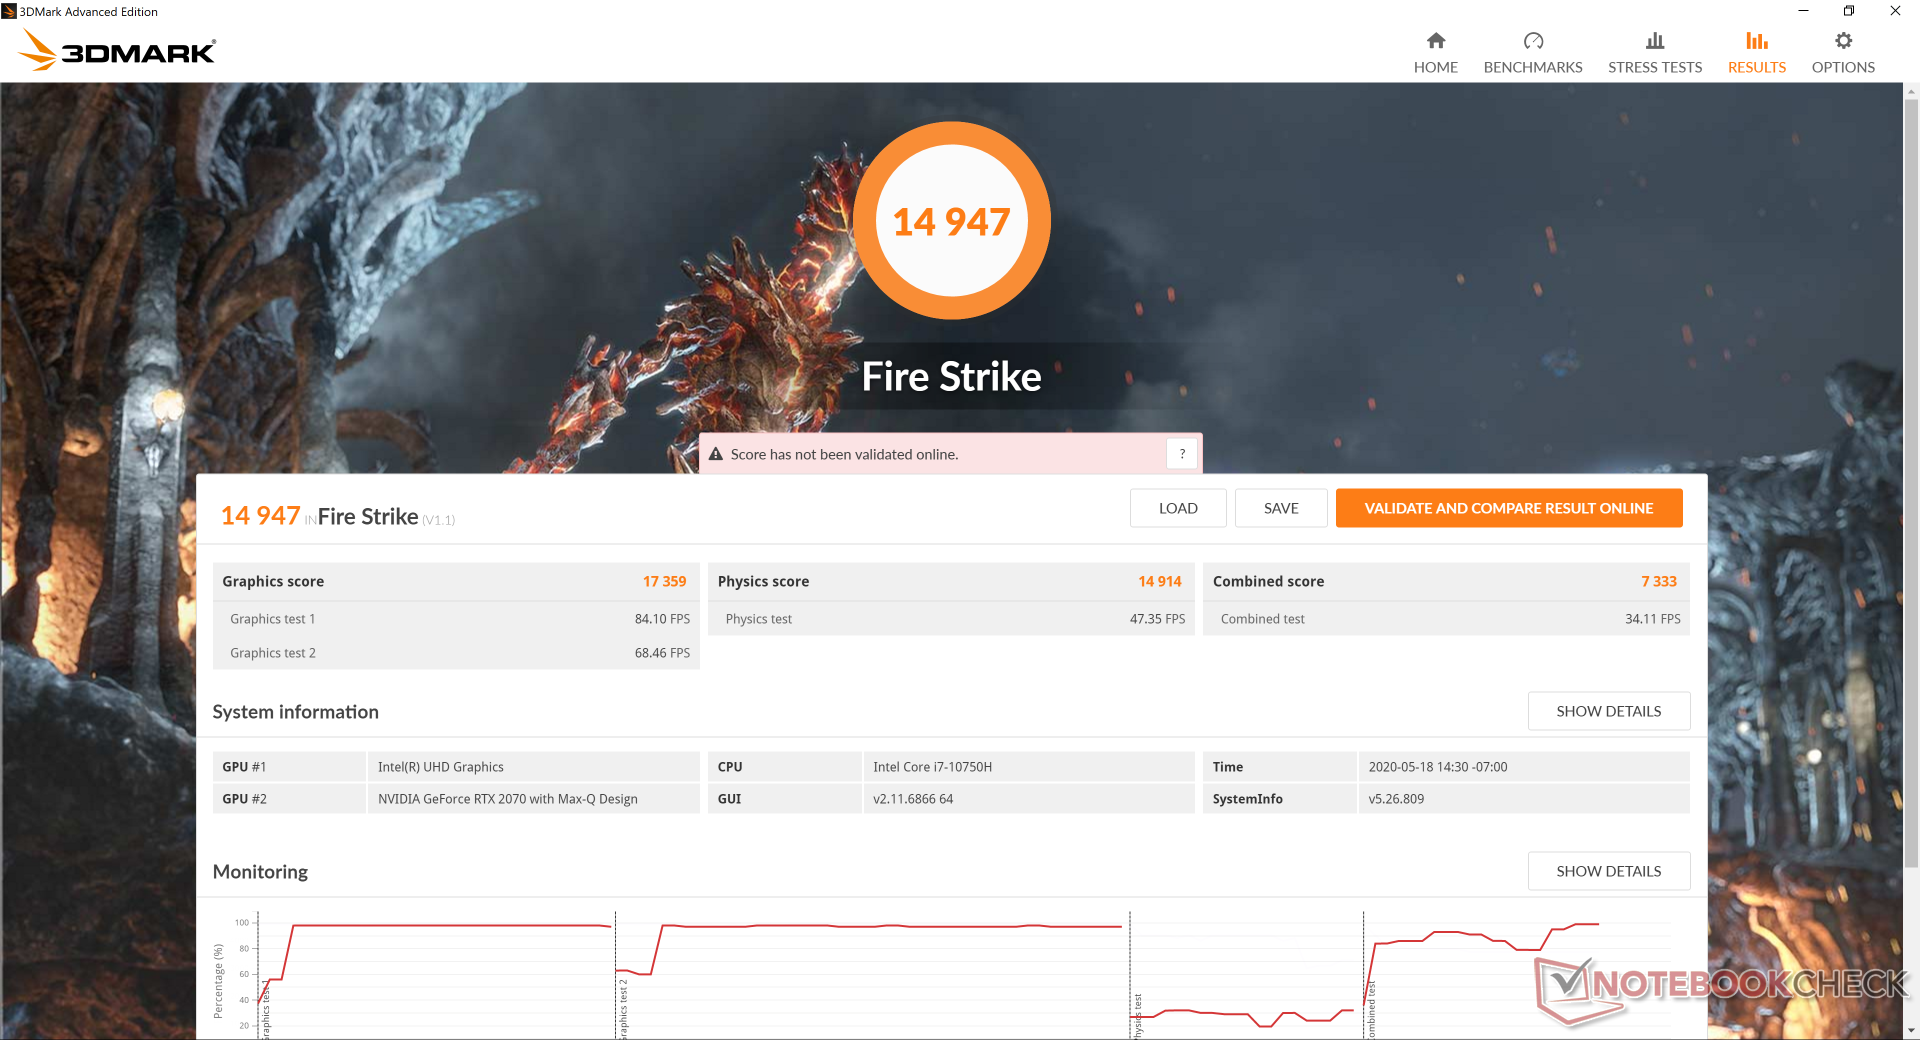
Setting the system to Gaming mode via Razer Synapse will increase performance just marginally. A Fire Strike run on Gaming mode returns 6 percent and 5 percent higher CPU and GPU scores than the default Balanced mode, respectively.
See our dedicated page on the GeForce RTX 2070 Max-Q for more technical information and benchmark comparisons.
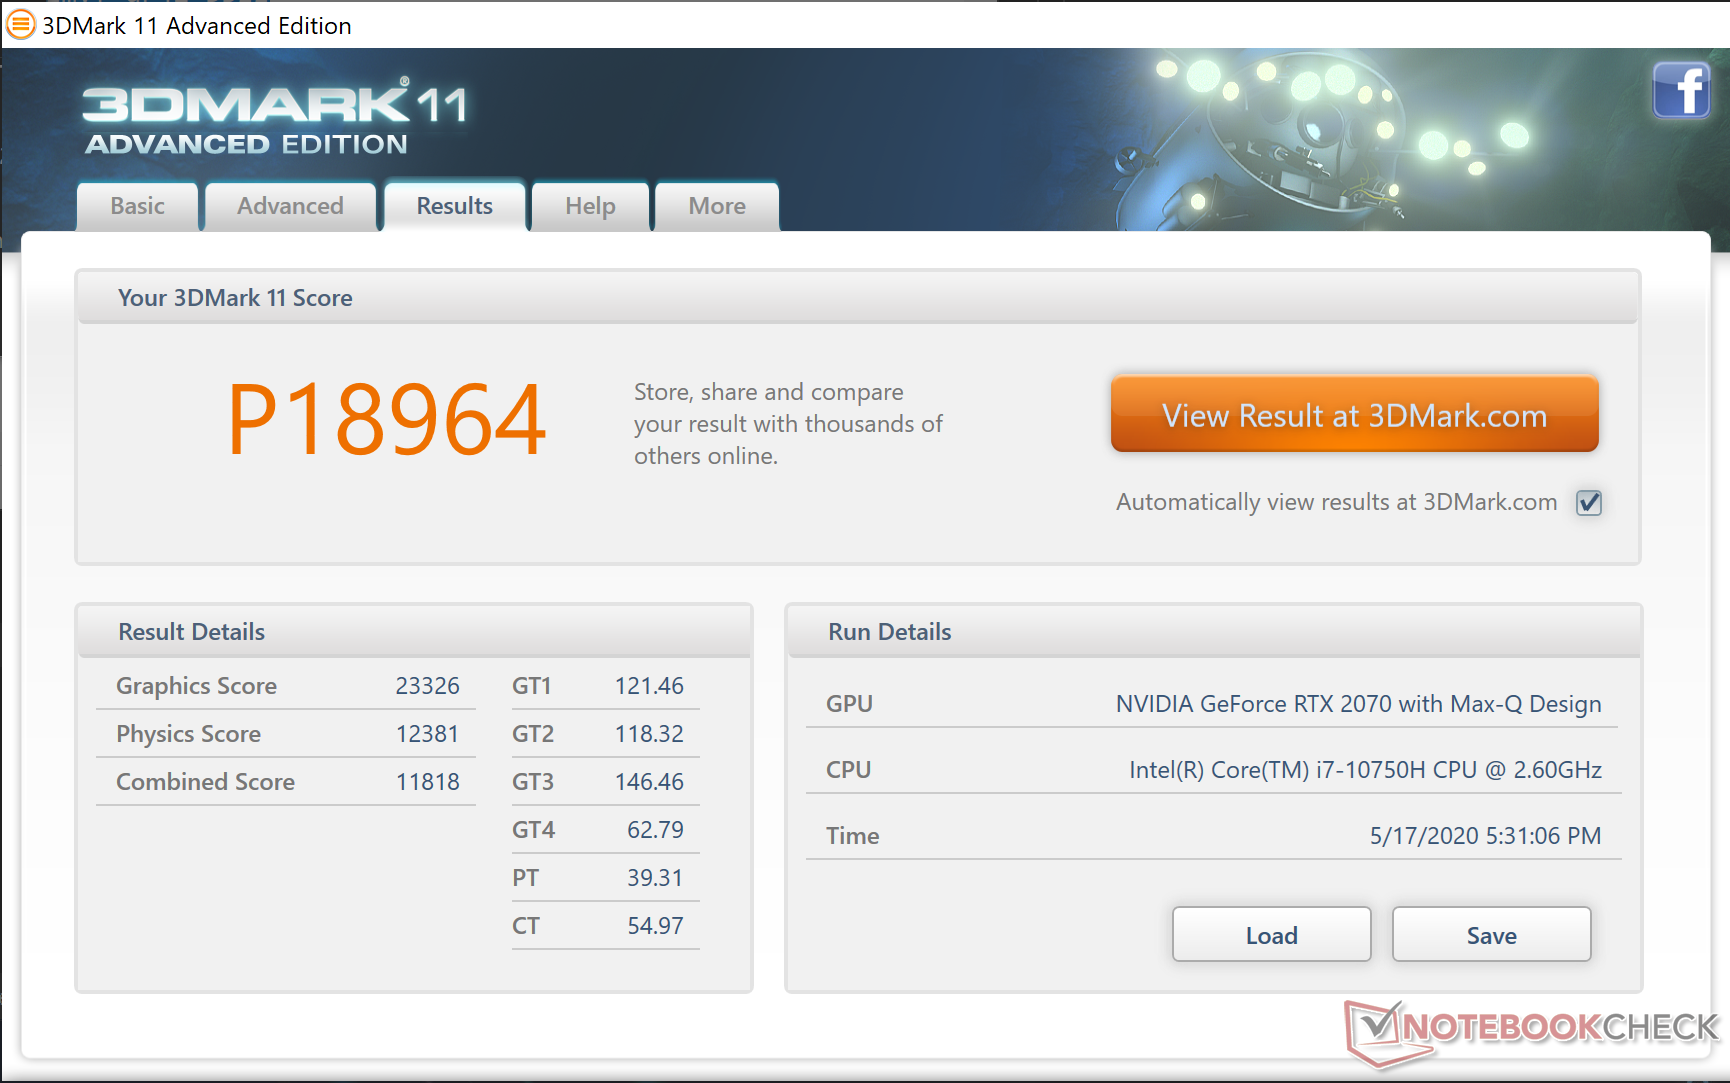


| 3DMark 11 Performance | 18964 points | |
| 3DMark Cloud Gate Standard Score | 26823 points | |
| 3DMark Fire Strike Score | 15800 points | |
| 3DMark Time Spy Score | 6527 points | |
Help | ||
| low | med. | high | ultra | 4K | |
| The Witcher 3 (2015) | 289.6 | 203.3 | 118.8 | 61.9 | 43.5 |
| Dota 2 Reborn (2015) | 143 | 132 | 124 | 116 | 90.8 |
| X-Plane 11.11 (2018) | 94.1 | 88.5 | 79.5 | 51.4 | |
| Shadow of the Tomb Raider (2018) | 129 | 100 | 94 | 85 | 30 |
| Borderlands 3 (2019) | 135.6 | 103.2 | 74.4 | 57.3 | 21.5 |
Emissions
System Noise
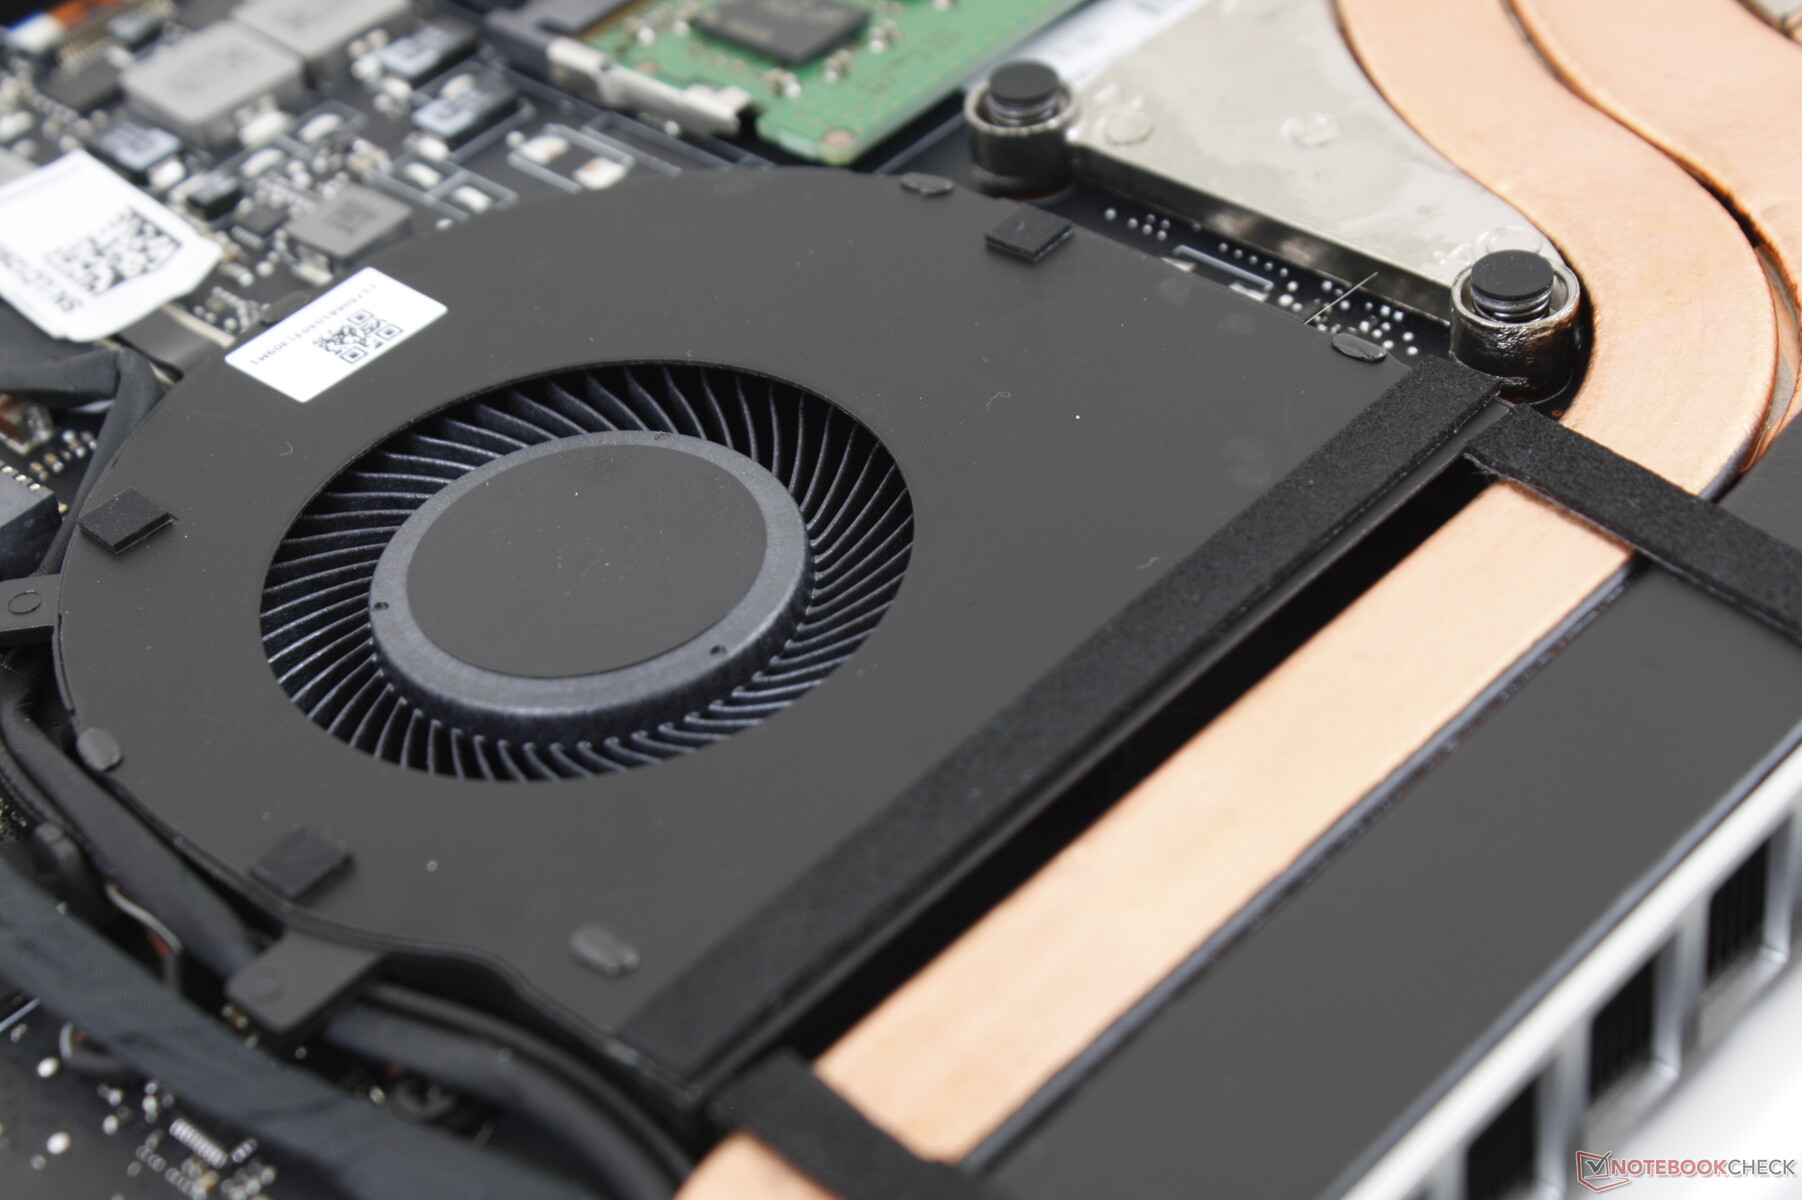
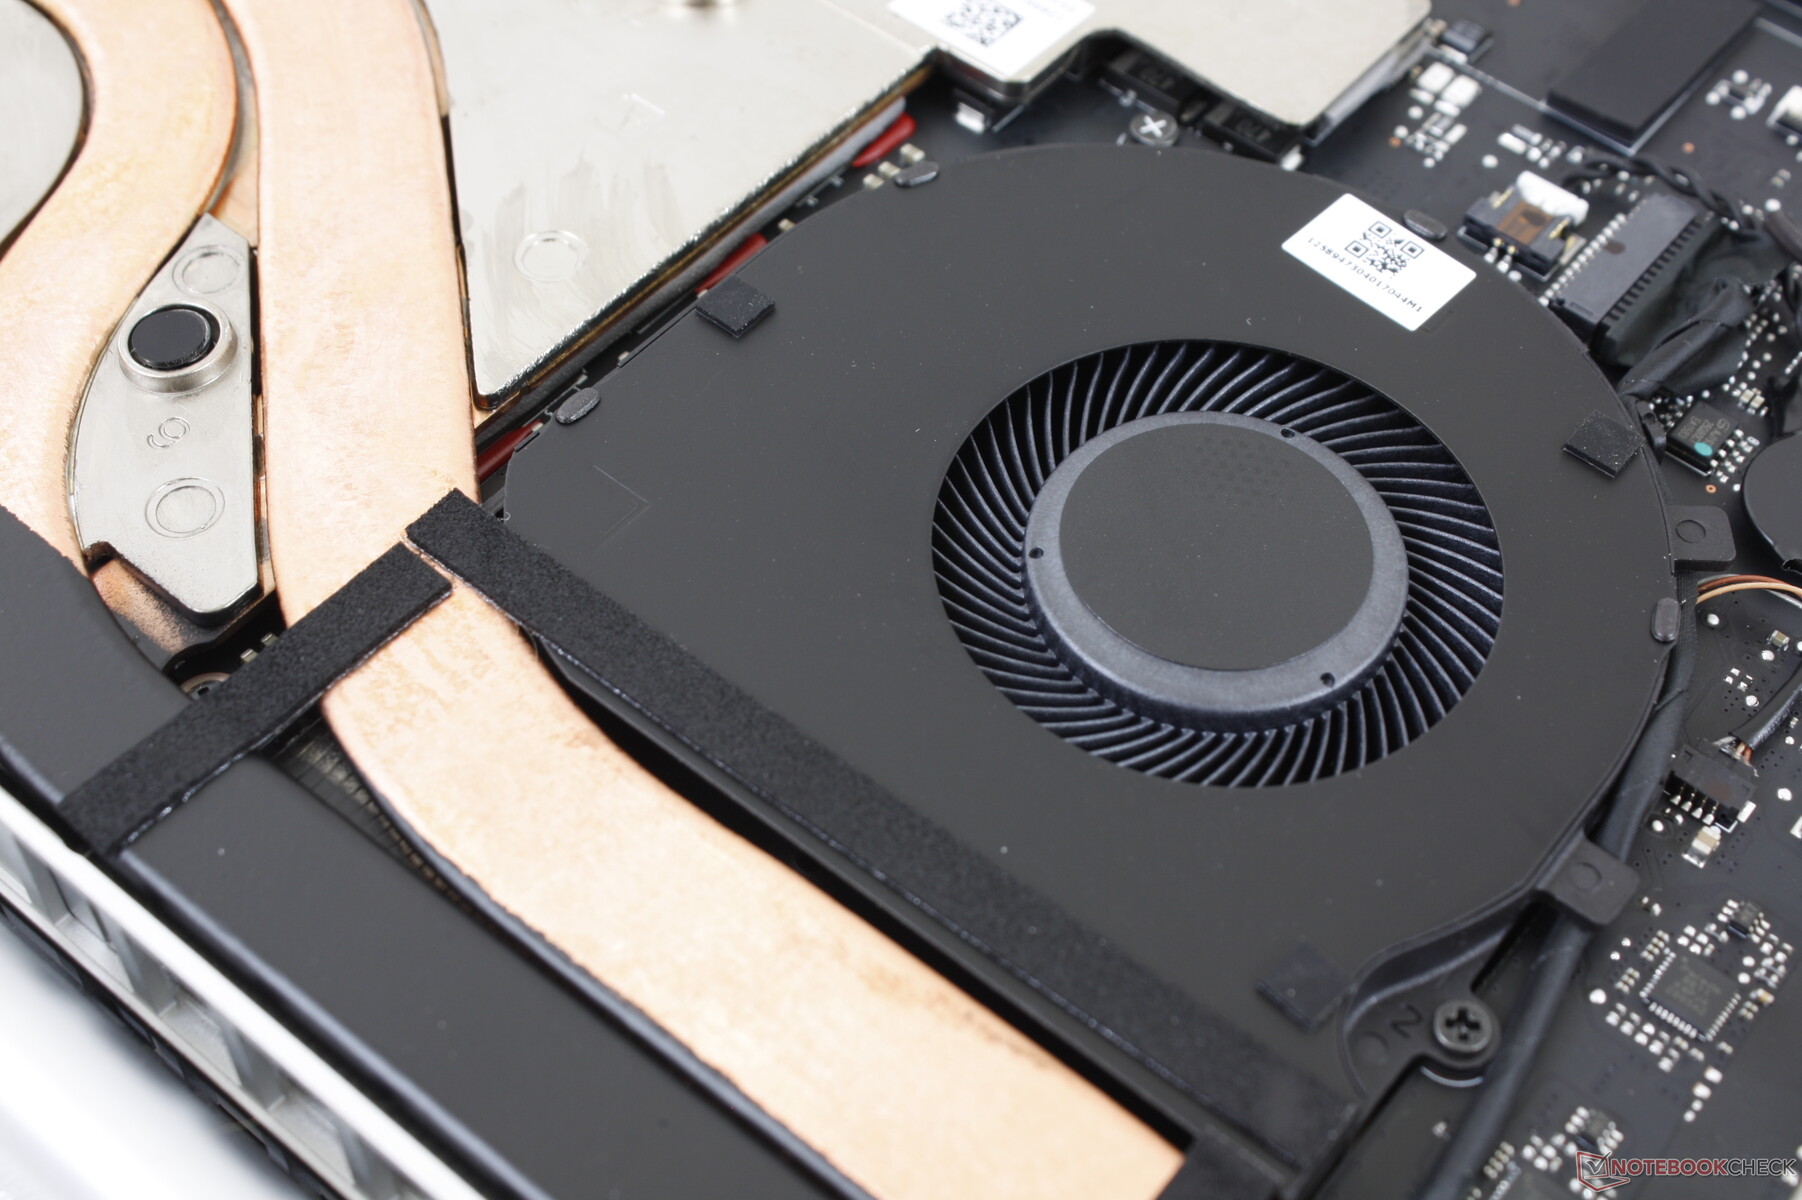
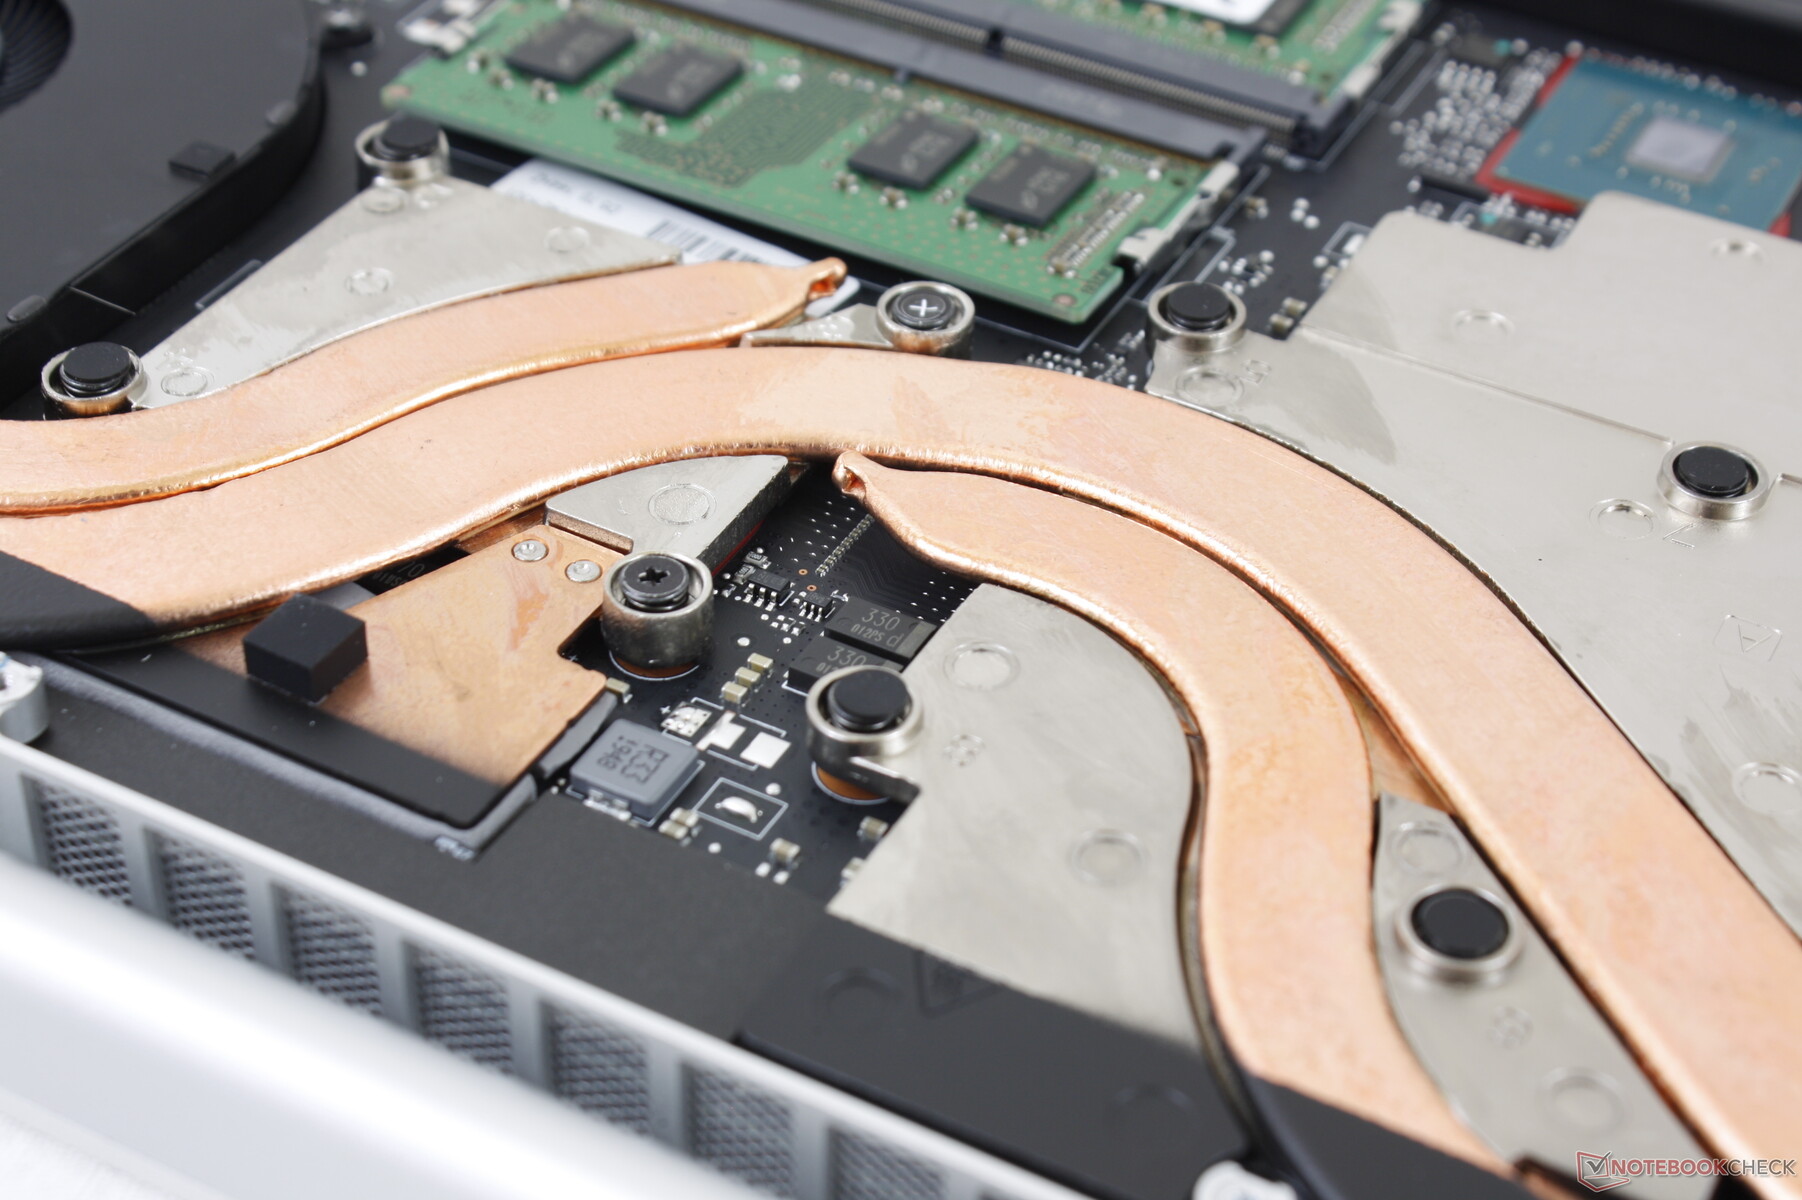
The cooling solution appears to be unchanged from last year's Base Model. The laptop will attempt to remain silent for as long as possible when under low loads, but just a few minutes of use will bump the fans from silent to 31.7 dB(A). This low range is audible but not audible enough to be a distraction when video streaming. However, we recommend the Balanced or Power Saver profiles if not gaming or else the fans will pulse frequently and noticeably.
When running Witcher 3 on Gaming Performance mode, fan noise will be at the 47.5 to 49.5 dB(A) range which is not unlike what we recorded on the MSI GS66, Gigabyte Aero 15, or Alienware m15 R2. In other words, the Razer is still a loud laptop when gaming and it doesn't break any new ground in this particular category.
We're able to notice slight electronic noise from our unit that's only audible when placing an ear near the keyboard keys.
| Razer Blade 15 RZ09-0328 GeForce RTX 2070 Max-Q, i7-10750H, Lite-On CA5-8D512 | MSI GS66 10SGS GeForce RTX 2080 Super Max-Q, i7-10750H, Samsung SSD PM981 MZVLB512HAJQ | Razer Blade 15 RTX 2080 Max-Q GeForce RTX 2080 Max-Q, i7-9750H, Samsung SSD PM981 MZVLB512HAJQ | Asus Zephyrus S GX531GX GeForce RTX 2080 Max-Q, i7-8750H, Intel SSD 660p SSDPEKNW512G8 | Gigabyte Aero 15 OLED XB-8DE51B0SP GeForce RTX 2070 Super Max-Q, i7-10875H, Intel Optane Memory H10 with Solid State Storage 32GB + 512GB HBRPEKNX0202A(L/H) | Alienware m15 R2 P87F GeForce RTX 2080 Max-Q, i7-9750H, 2x Toshiba XG6 KXG60ZNV512G (RAID 0) | |
|---|---|---|---|---|---|---|
| Noise | -2% | 7% | -8% | -13% | -10% | |
| off / environment * | 28.4 | 28.5 -0% | 28.3 -0% | 28.7 -1% | 30 -6% | 28.3 -0% |
| Idle Minimum * | 28.4 | 30 -6% | 28.8 -1% | 29.8 -5% | 34 -20% | 28.5 -0% |
| Idle Average * | 28.4 | 30 -6% | 28.8 -1% | 32.4 -14% | 36 -27% | 28.5 -0% |
| Idle Maximum * | 31.7 | 30.9 3% | 29 9% | 38 -20% | 41 -29% | 49 -55% |
| Load Average * | 47.7 | 39.5 17% | 33.5 30% | 38.2 20% | 48 -1% | 49 -3% |
| Witcher 3 ultra * | 47.5 | 48 -1% | 45 5% | 56.6 -19% | 48 -1% | 49 -3% |
| Load Maximum * | 49.5 | 59.4 -20% | 45.2 9% | 56.6 -14% | 54 -9% | 55 -11% |
* ... smaller is better
Noise Level
| Idle |
| 28.4 / 28.4 / 31.7 dB(A) |
| Load |
| 47.7 / 49.5 dB(A) |
 | ||
30 dB silent 40 dB(A) audible 50 dB(A) loud |
||
min: | ||
Temperature
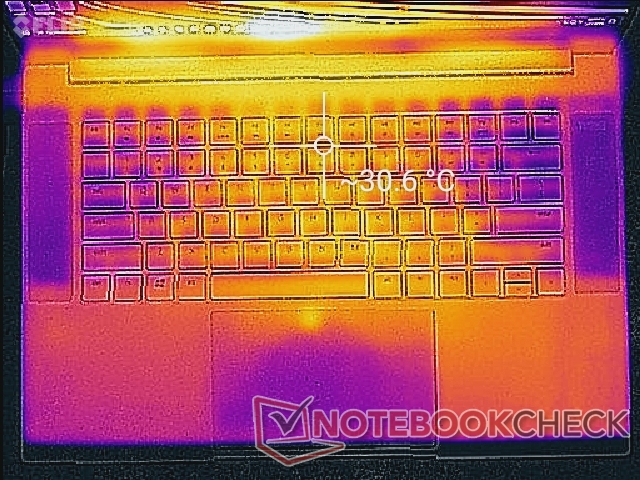
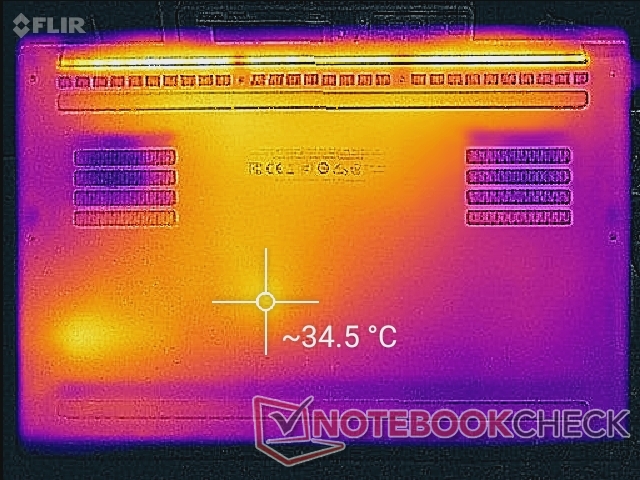
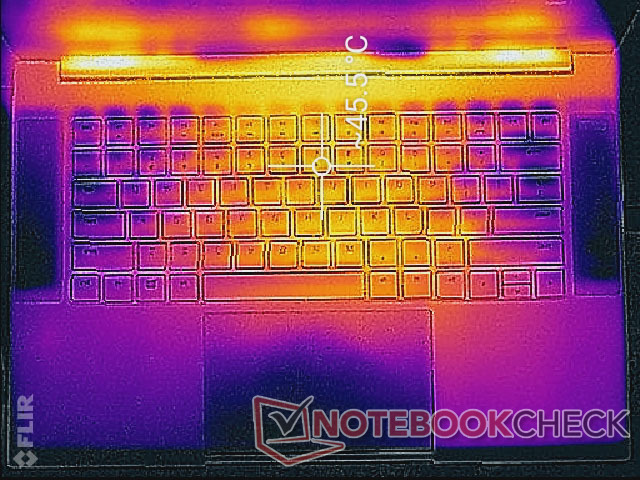
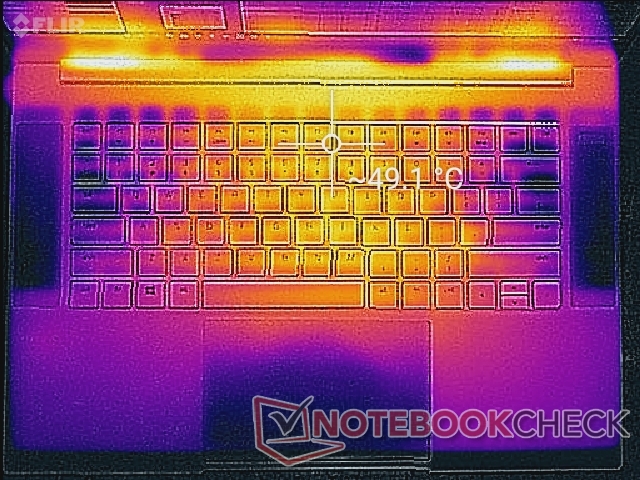
Surface temperatures are warm when simply idling on desktop at about 30 C to 34 C on both sides. Furthermore, the metal unibody chassis means that the palm rests will also heat up by quite a bit. When gaming, the palm rests and WASD keys can be as warm as 37 C or higher for sweaty palms when gaming. Cooler temperatures would have been preferred.
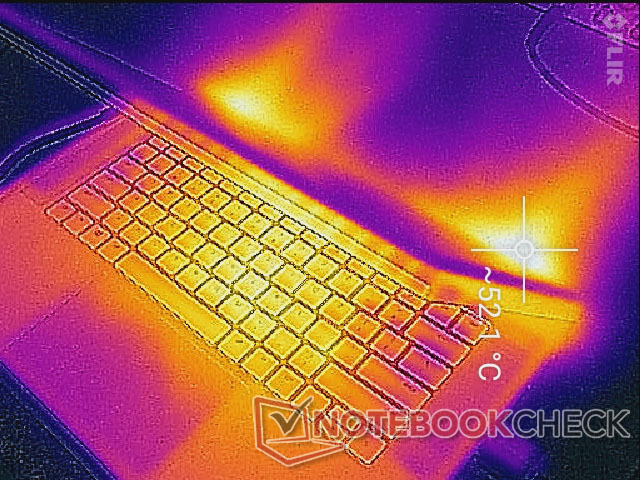
(-) The maximum temperature on the upper side is 49.6 °C / 121 F, compared to the average of 40.4 °C / 105 F, ranging from 21.2 to 68.8 °C for the class Gaming.
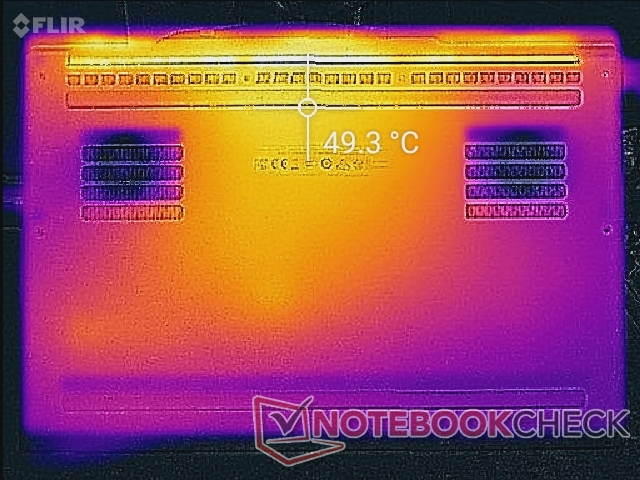
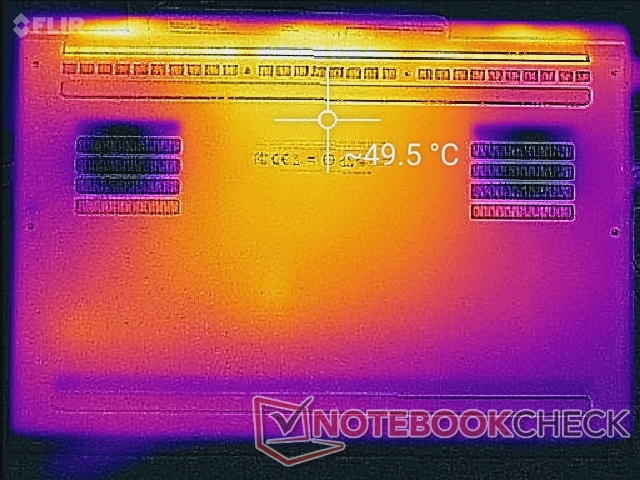
(-) The bottom heats up to a maximum of 50.2 °C / 122 F, compared to the average of 43.2 °C / 110 F
(+) In idle usage, the average temperature for the upper side is 30.3 °C / 87 F, compared to the device average of 33.8 °C / 93 F.
(-) Playing The Witcher 3, the average temperature for the upper side is 40.6 °C / 105 F, compared to the device average of 33.8 °C / 93 F.
(±) The palmrests and touchpad can get very hot to the touch with a maximum of 39.6 °C / 103.3 F.
(-) The average temperature of the palmrest area of similar devices was 28.9 °C / 84 F (-10.7 °C / -19.3 F).
Stress Test
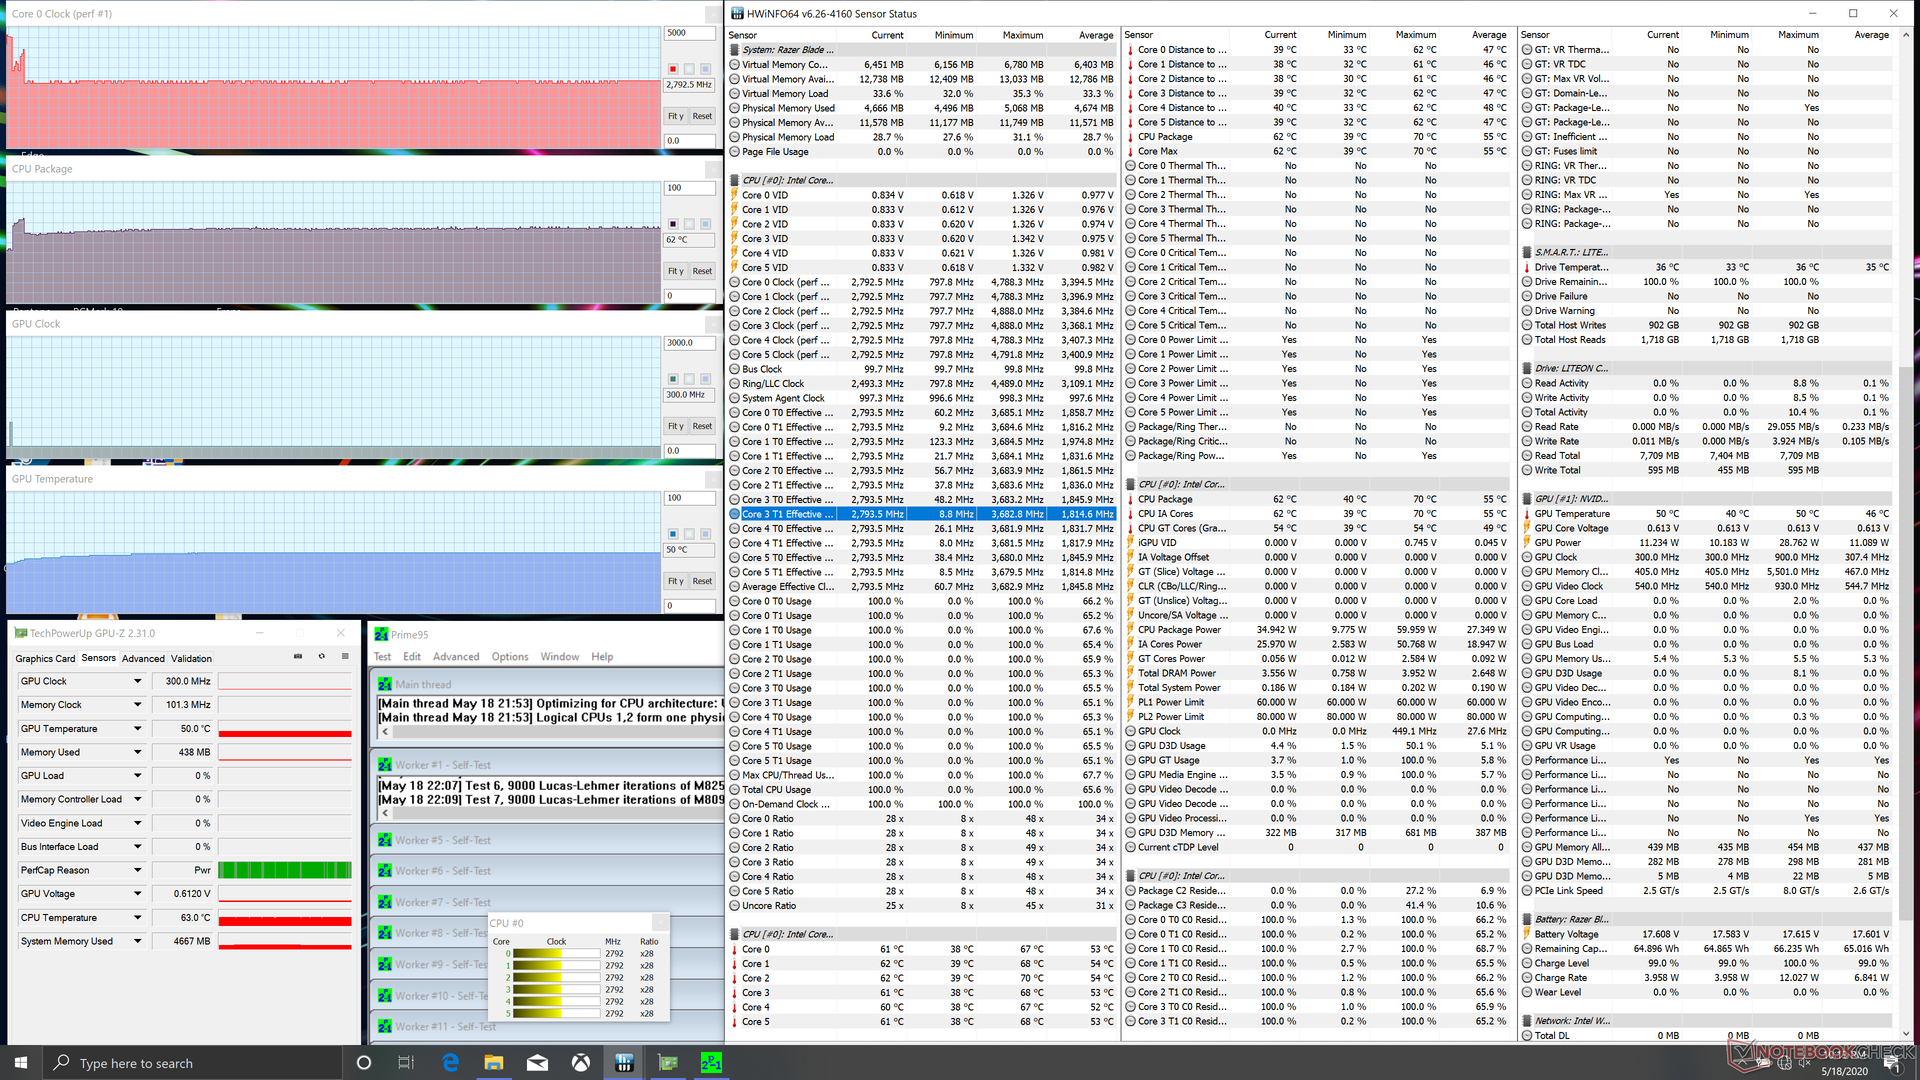
We stress the laptop with synthetic loads to identify for any potential throttling issues. When running Prime95 on Gaming mode, the CPU would boost up to 4.1 GHz for a few seconds until hitting a core temperature of 70 C. Thereafter, clock rates and temperature would drop and stabilize at 2.7 GHz and 58 C, respectively. If on Creator mode, the CPU would stabilize at higher clock rates and temperatures of 3.2 GHz and 70 C, respectively, as shown by the screenshots below.
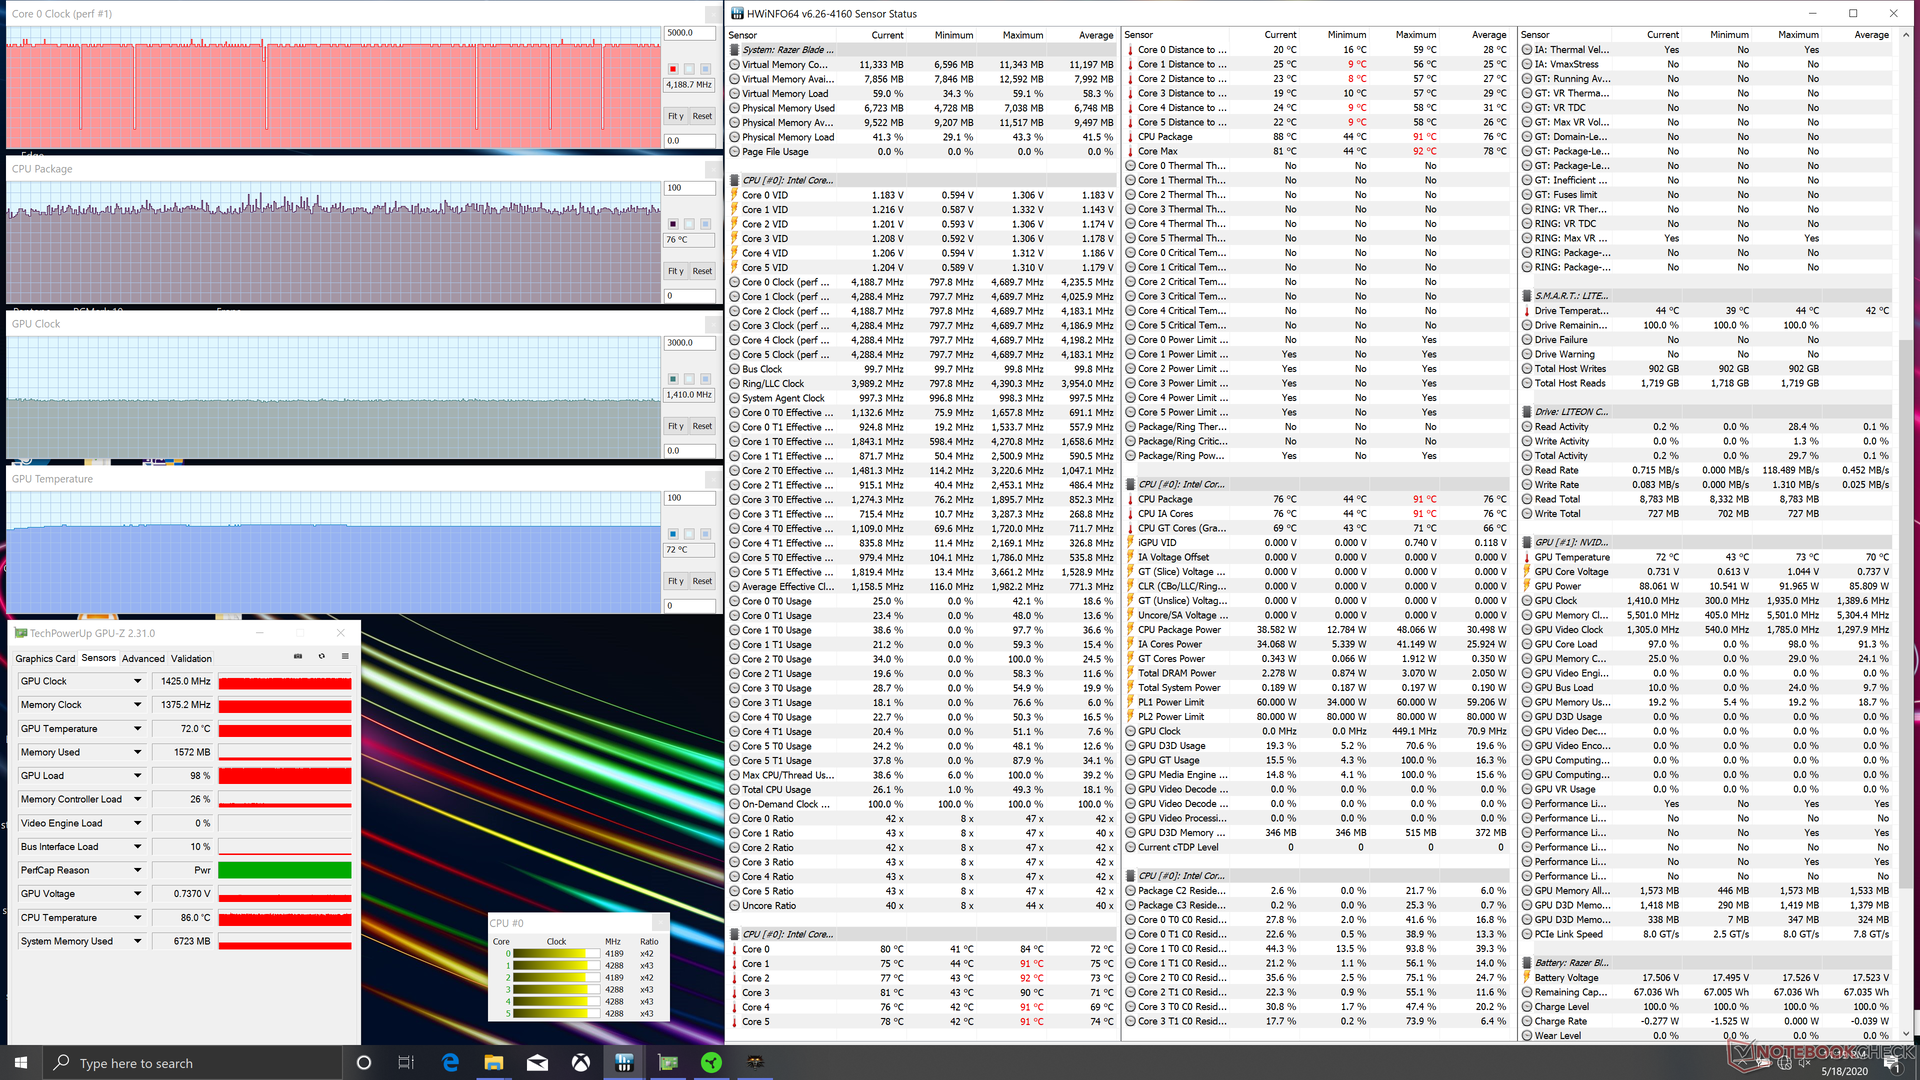
Running Witcher 3 to represent real-world gaming load would cause the CPU and GPU to stabilize at 76 C and 72 C, respectively, compared to 82 C and 68 C on the MSI GS66 10SGS when under similar conditions. Temperatures are also slightly cooler than on last year's Blade 15 Advanced Model with the same RTX 2070 Max-Q GPU.
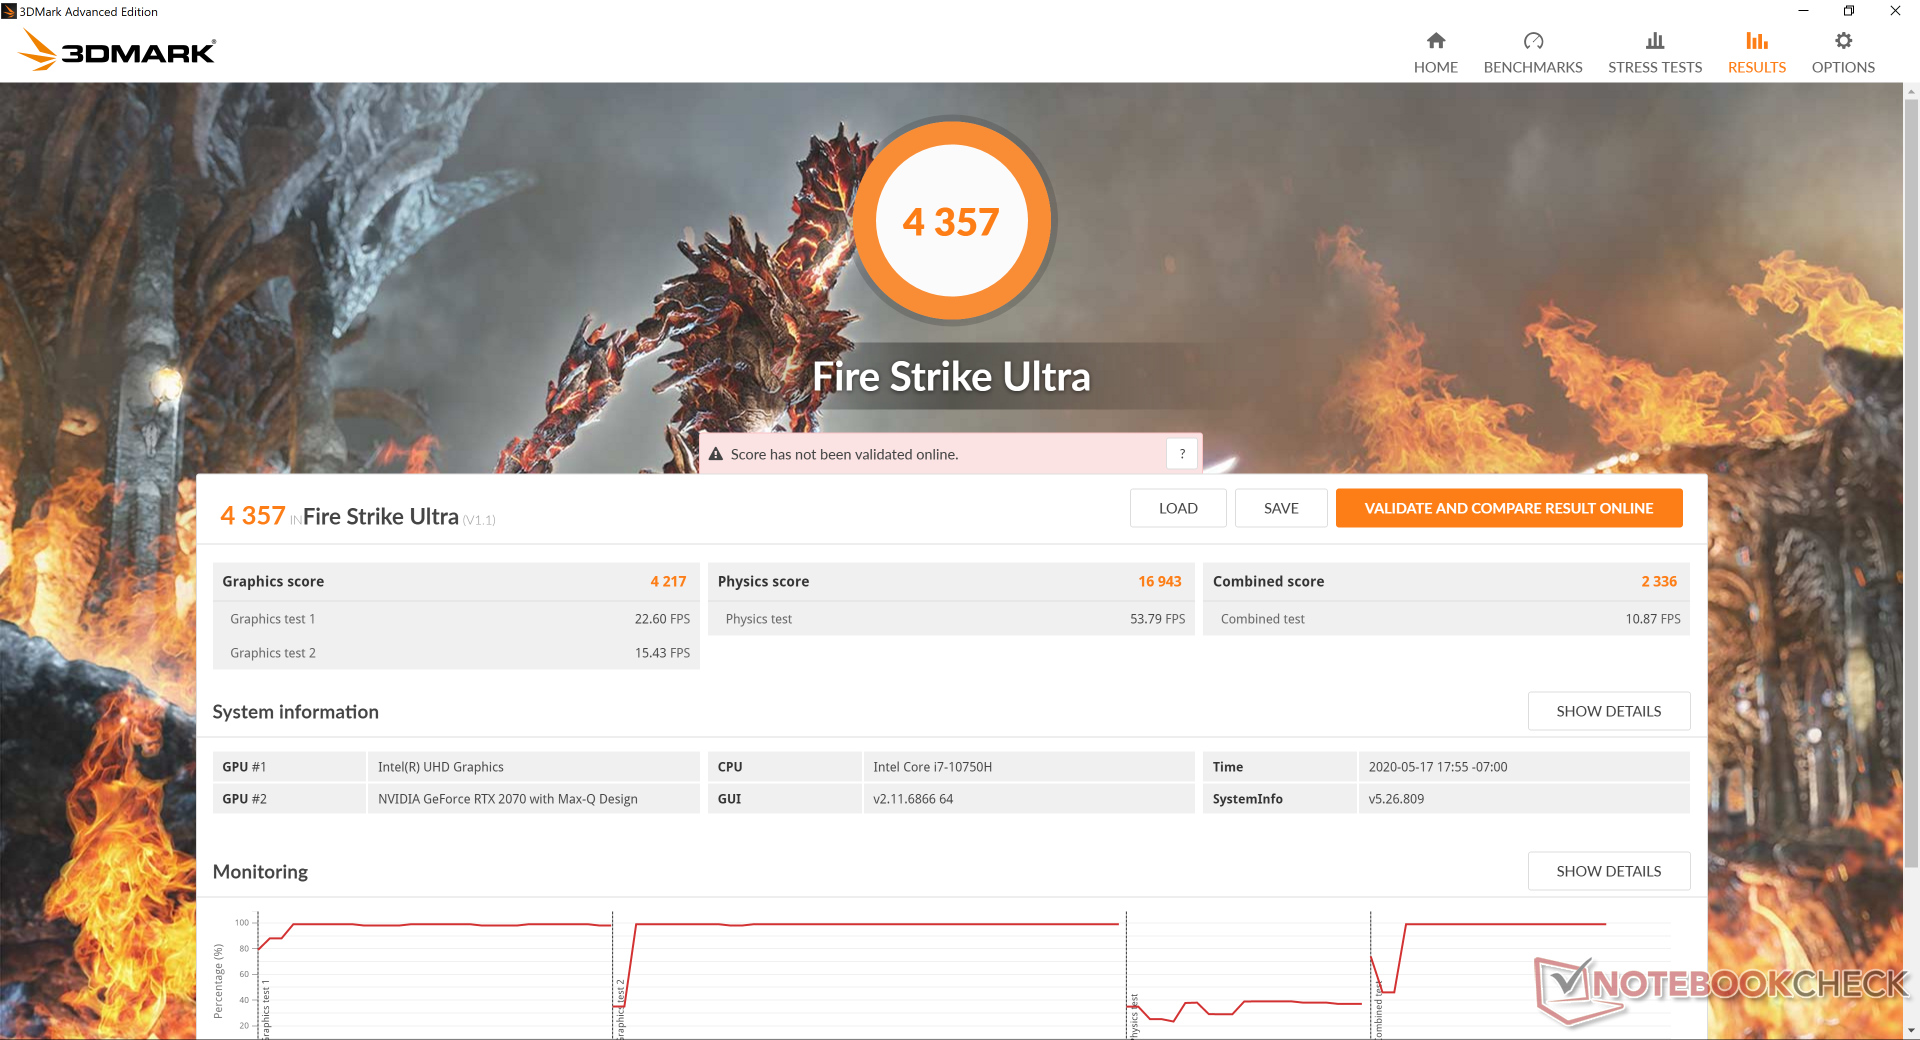
Running on batteries will impact performance since Gaming and Creator modes become unavailable. A Fire Strike run on battery power returns Physics and Graphics scores 11652 and 6358 points, respectively, compared to 15799 and 18166 points when on mains.

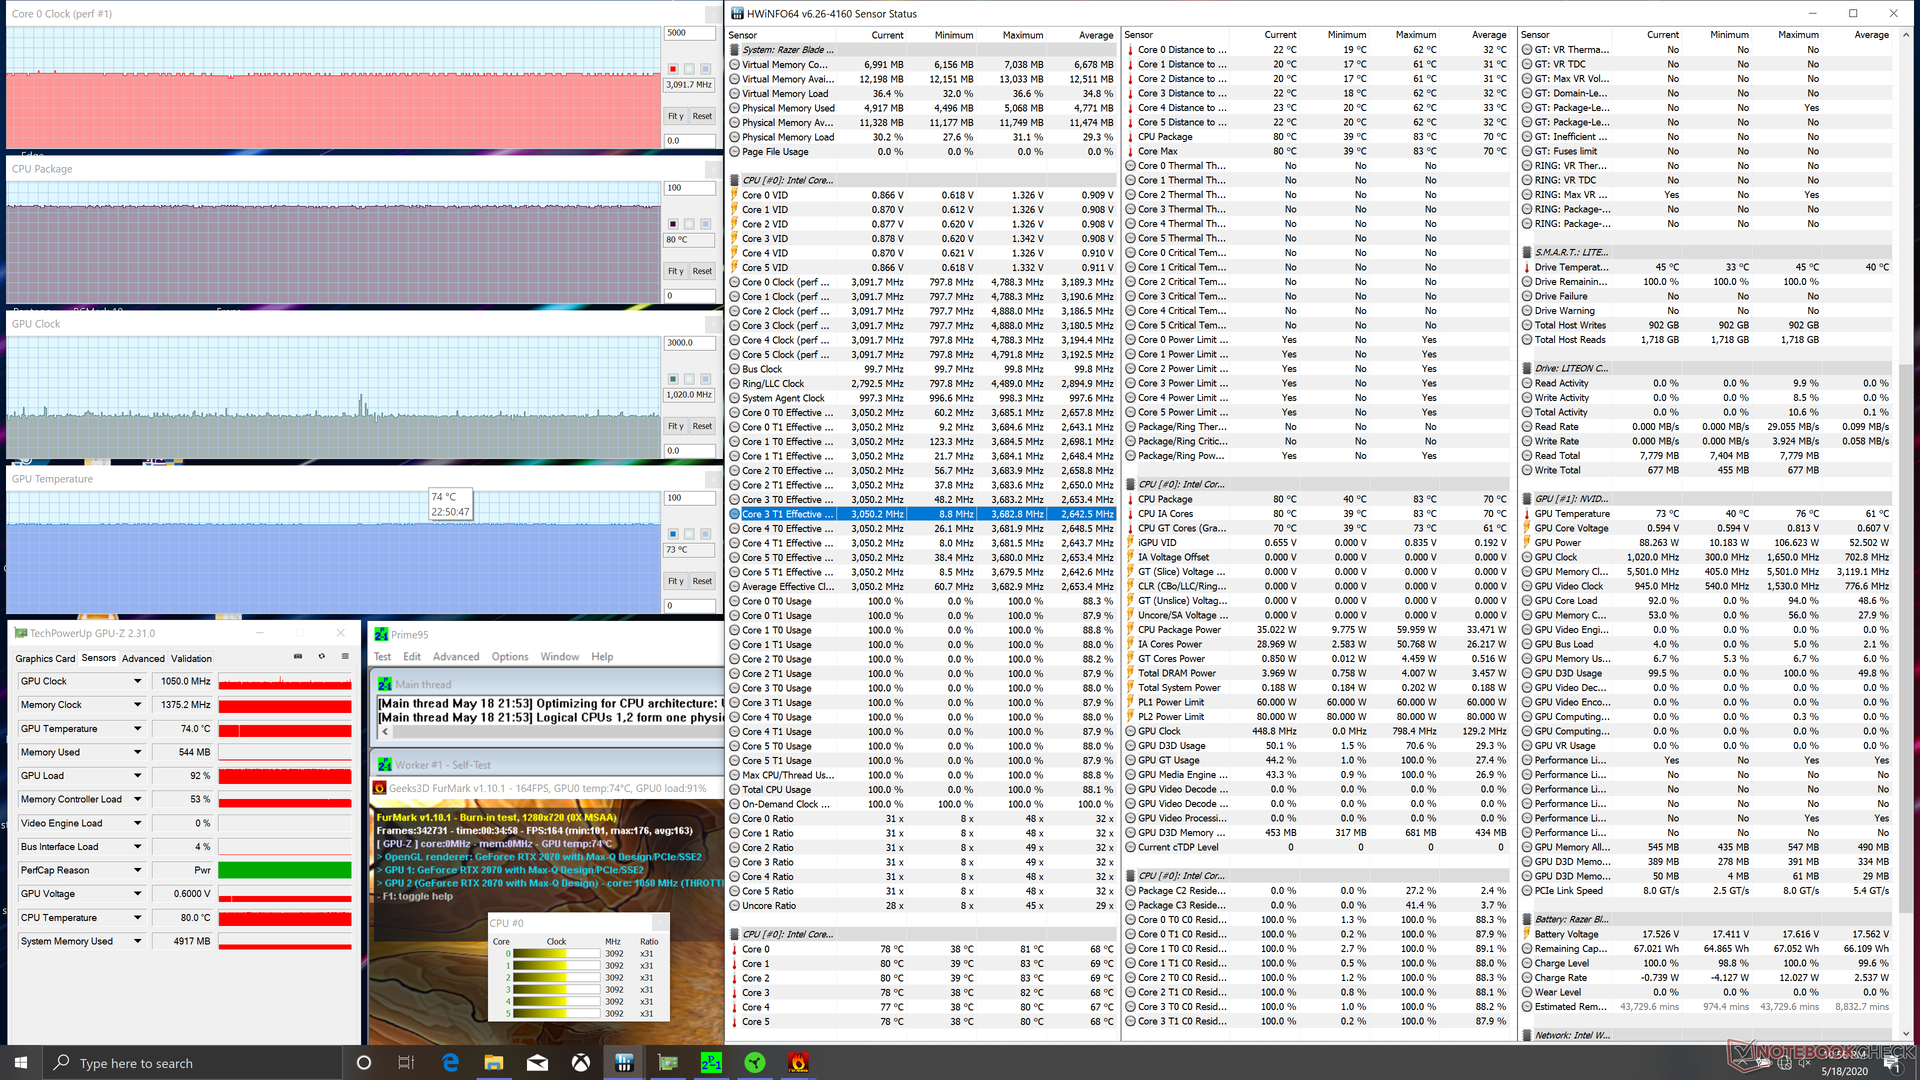
| CPU Clock (GHz) | GPU Clock (MHz) | Average CPU Temperature (°C) | Average GPU Temperature (°C) | |
| System Idle | -- | -- | 43 | 41 |
| Prime95 Stress | 2.8 | -- | 62 | 50 |
| Prime95 Stress (Creator mode) | 3.2 | -- | 69 | 52 |
| Prime95 + FurMark Stress | 3.1 | 1050 | 80 | 73 |
| Witcher 3 Stress | 4.1 - 4.2 | 1425 | 76 | 72 |
Speakers
Razer Blade 15 RZ09-0328 audio analysis
(±) | speaker loudness is average but good (79.2 dB)
Bass 100 - 315 Hz
(±) | reduced bass - on average 12.3% lower than median
(±) | linearity of bass is average (12.7% delta to prev. frequency)
Mids 400 - 2000 Hz
(±) | higher mids - on average 8.4% higher than median
(+) | mids are linear (5.9% delta to prev. frequency)
Highs 2 - 16 kHz
(±) | reduced highs - on average 7.3% lower than median
(±) | linearity of highs is average (7.5% delta to prev. frequency)
Overall 100 - 16.000 Hz
(±) | linearity of overall sound is average (27.7% difference to median)
Compared to same class
» 92% of all tested devices in this class were better, 2% similar, 6% worse
» The best had a delta of 6%, average was 18%, worst was 132%
Compared to all devices tested
» 81% of all tested devices were better, 4% similar, 15% worse
» The best had a delta of 4%, average was 25%, worst was 134%
Apple MacBook 12 (Early 2016) 1.1 GHz audio analysis
(+) | speakers can play relatively loud (83.6 dB)
Bass 100 - 315 Hz
(±) | reduced bass - on average 11.3% lower than median
(±) | linearity of bass is average (14.2% delta to prev. frequency)
Mids 400 - 2000 Hz
(+) | balanced mids - only 2.4% away from median
(+) | mids are linear (5.5% delta to prev. frequency)
Highs 2 - 16 kHz
(+) | balanced highs - only 2% away from median
(+) | highs are linear (4.5% delta to prev. frequency)
Overall 100 - 16.000 Hz
(+) | overall sound is linear (10.2% difference to median)
Compared to same class
» 5% of all tested devices in this class were better, 2% similar, 93% worse
» The best had a delta of 5%, average was 19%, worst was 53%
Compared to all devices tested
» 3% of all tested devices were better, 1% similar, 96% worse
» The best had a delta of 4%, average was 25%, worst was 134%
Energy Management
Power Consumption
Idling on desktop on Power Saver mode at the lowest brightness setting possible demands about 11 W. Increasing the brightness to maximum would then draw a total of 13.7 W, but this can be much higher depending on onscreen colors as detailed in our OLED power consumption test here. Power consumption would rise to over 33 W when set to High Performance mode with the GeForce GPU active and so it's worth running on Power Saver mode if simply web browsing, emailing, or video streaming.
Running 3DMark 06 or Witcher 3 draws almost the same amount of power as the Xiaomi Mi Gaming laptop with weaker RTX 2060 graphics. Thus, the Razer is able to offer roughly 10 percent faster graphics performance than many 15.6-inch RTX 2060 laptops without necessarily drawing more power in the process. This isn't a coincidence because the RTX 2060 mobile, RTX 2070 Max-Q, and RTX 2080 Max-Q share very similar TDP ranges.
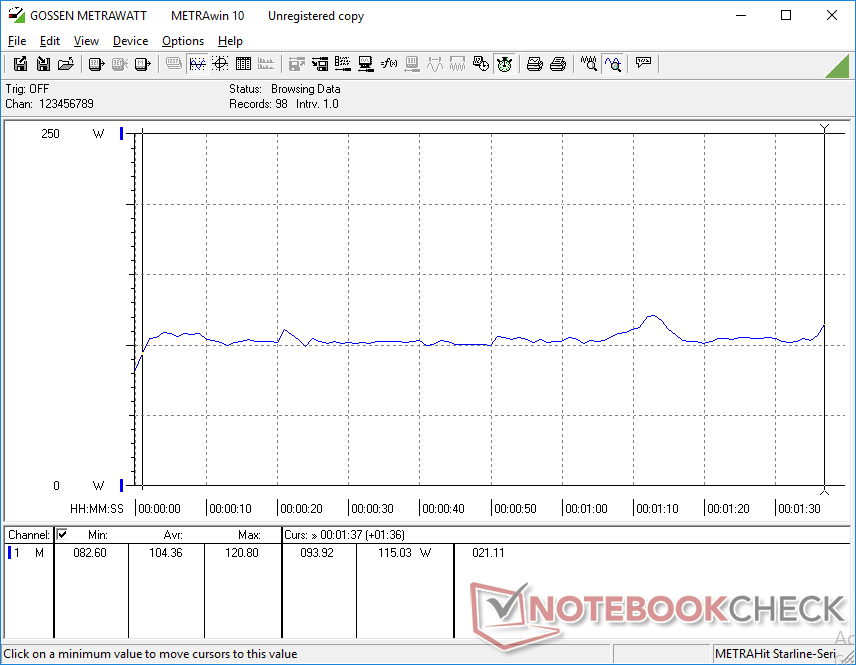
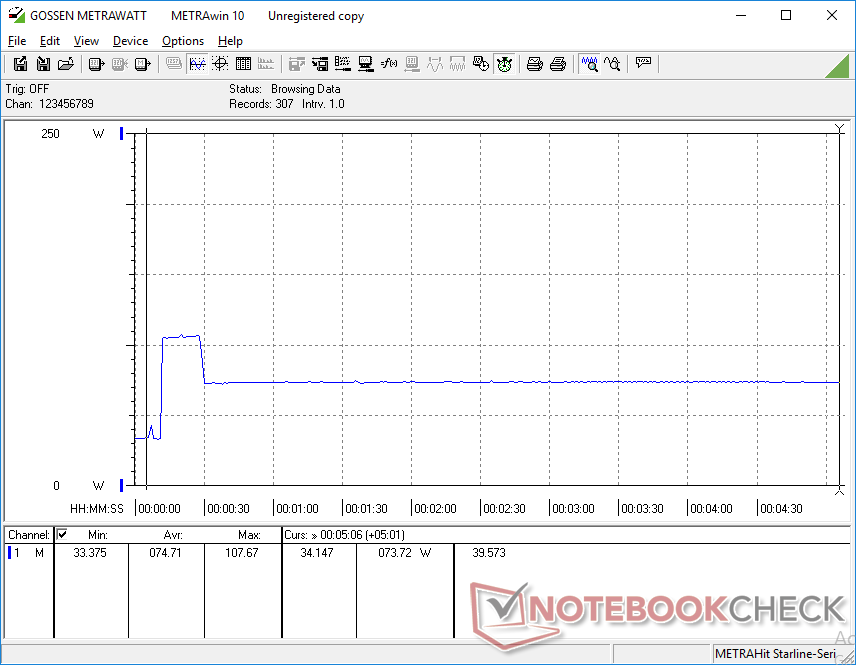
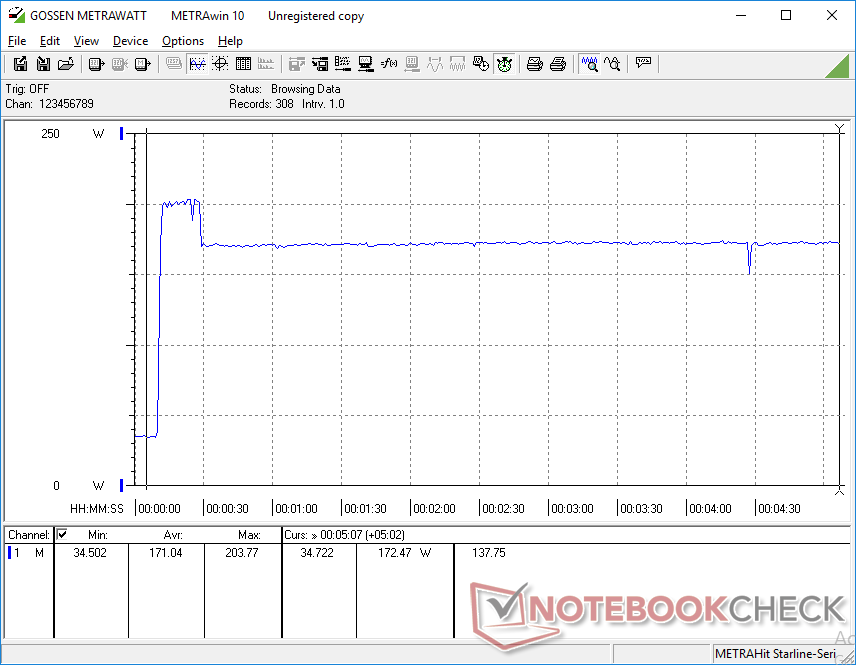
When running Prime95, consumption would spike to 108 W for approximately 20 seconds before falling and stabilizing at 74 W. The 20-second peak correlates with how long the initial Turbo Boost clock rate would last during our Prime95 Stress Test above.
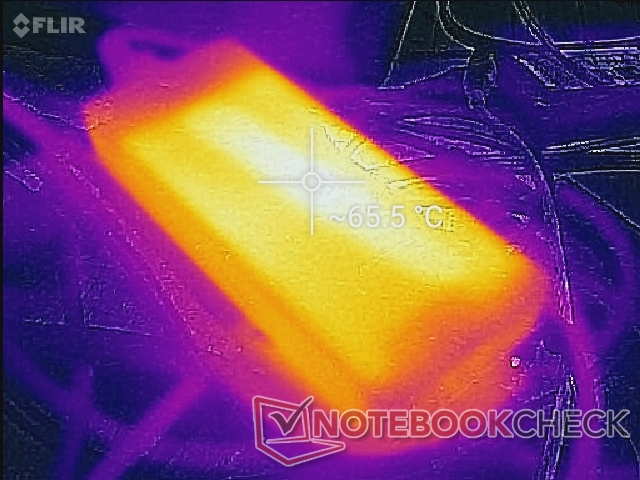
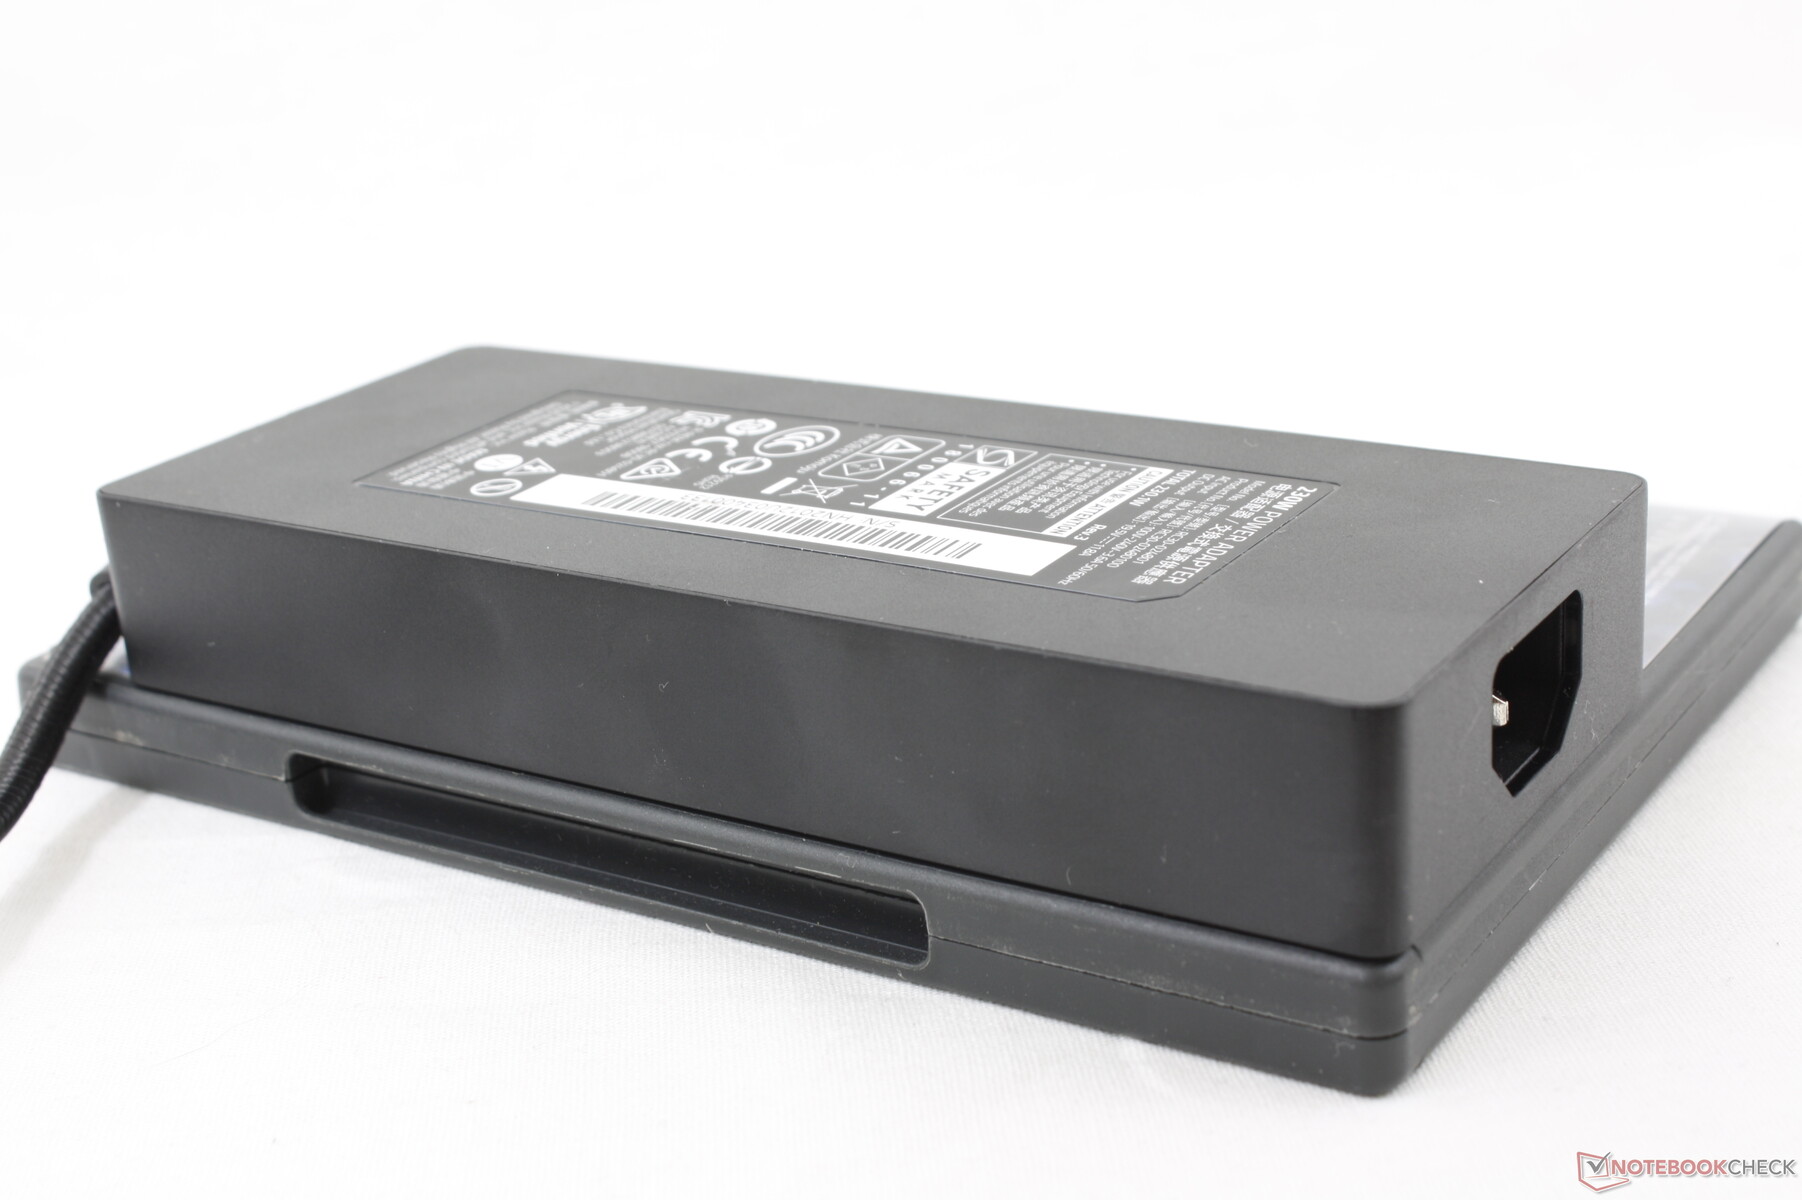
We're able to record a temporary maximum of 203.8 W from the medium-sized (17 x 7 x 2.5 cm) 230 W AC adapter when running both Prime95 and FurMark simultaneously. This eventually drops and stabilizes at 172.5 W as shown by our graphs below. All 2020 Blade 15 Base and Advanced models share the same 230 W AC adapter.
| Off / Standby | |
| Idle | |
| Load |
|
| Razer Blade 15 RZ09-0328 i7-10750H, GeForce RTX 2070 Max-Q, Lite-On CA5-8D512, AMOLED, 3840x2160, 15.60 | MSI GS66 10SGS i7-10750H, GeForce RTX 2080 Super Max-Q, Samsung SSD PM981 MZVLB512HAJQ, IPS, 1920x1080, 15.60 | Razer Blade 15 RTX 2080 Max-Q i7-9750H, GeForce RTX 2080 Max-Q, Samsung SSD PM981 MZVLB512HAJQ, IPS, 1920x1080, 15.60 | Gigabyte Aero 15 OLED XB-8DE51B0SP i7-10875H, GeForce RTX 2070 Super Max-Q, Intel Optane Memory H10 with Solid State Storage 32GB + 512GB HBRPEKNX0202A(L/H), OLED, 3840x2160, 15.60 | Alienware m15 R2 P87F i7-9750H, GeForce RTX 2080 Max-Q, 2x Toshiba XG6 KXG60ZNV512G (RAID 0), IPS, 1920x1080, 15.60 | Xiaomi Mi Gaming Laptop 2019 i7-9750H, GeForce RTX 2060 Mobile, Toshiba XG6 KXG60ZNV512G, IPS, 1920x1080, 15.60 | |
|---|---|---|---|---|---|---|
| Power Consumption | -6% | 4% | -26% | -62% | 11% | |
| Idle Minimum * | 11.1 | 14.9 -34% | 12.5 -13% | 18 -62% | 19 -71% | 10 10% |
| Idle Average * | 13.7 | 17.5 -28% | 15.3 -12% | 21 -53% | 40.5 -196% | 13 5% |
| Idle Maximum * | 33.4 | 29.5 12% | 20.7 38% | 38 -14% | 52 -56% | 20 40% |
| Load Average * | 104.4 | 94.8 9% | 90.2 14% | 113 -8% | 132.3 -27% | 100 4% |
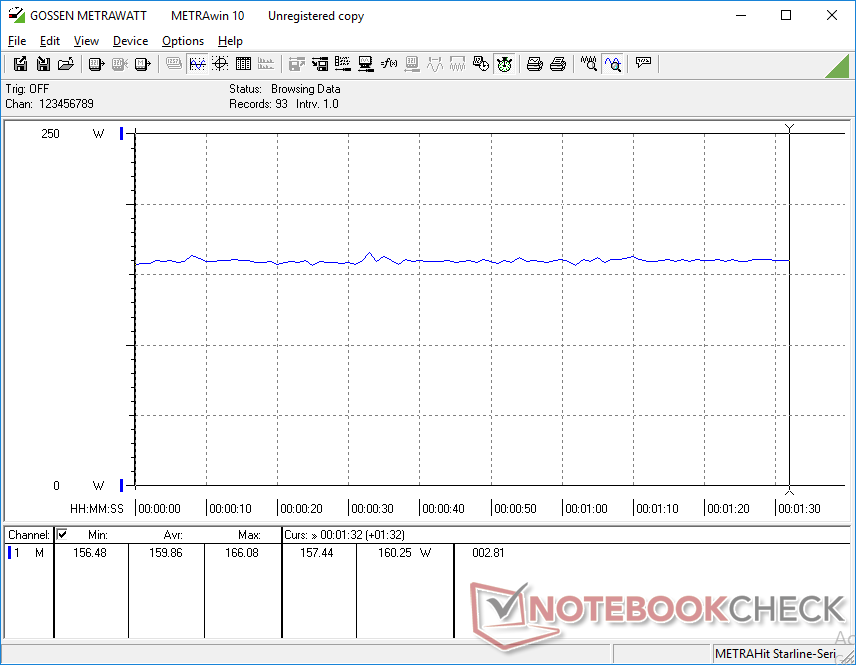
| Witcher 3 ultra * | 159.9 | 146.1 9% | 162 -1% | 149 7% | 183.3 -15% | 159 1% |
| Load Maximum * | 203.8 | 210.9 -3% | 209.3 -3% | 256 -26% | 217.2 -7% | 196 4% |
* ... smaller is better
Battery Life
Runtimes will be shorter than the Blade 15 Advanced Model because of the smaller battery in the Base Model. The more demanding OLED panel is likely a factor as well. We're able to record 4 hours of real-world WLAN use when on the Balanced profile with the iGPU active, keyboard backlight disabled, and display set to 150 nits compared to almost 7 hours on the IPS Blade 15 Advanced Model.
Charging from empty to full capacity takes about 1.5 hours.
| Razer Blade 15 RZ09-0328 i7-10750H, GeForce RTX 2070 Max-Q, 65 Wh | MSI GS66 10SGS i7-10750H, GeForce RTX 2080 Super Max-Q, 99.99 Wh | Razer Blade 15 RTX 2080 Max-Q i7-9750H, GeForce RTX 2080 Max-Q, 80 Wh | Asus Zephyrus S GX531GX i7-8750H, GeForce RTX 2080 Max-Q, 50 Wh | Gigabyte Aero 15 OLED XB-8DE51B0SP i7-10875H, GeForce RTX 2070 Super Max-Q, 94.2 Wh | Alienware m15 R2 P87F i7-9750H, GeForce RTX 2080 Max-Q, 76 Wh | |
|---|---|---|---|---|---|---|
| Battery Runtime | 71% | 63% | -25% | 51% | 38% | |
| WiFi v1.3 | 241 | 413 71% | 393 63% | 181 -25% | 364 51% | 332 38% |
| Reader / Idle | 614 | 953 | 518 | 554 | ||
| Load | 94 | 102 | 166 | 44 |
Pros
Cons
Verdict
Back in the old days, Intel had a "tick-tock" processor product cycle where the "tick" would represent a major architectural redesign with significant performance updates while the "tock" product would be a more fine-tuned version of the "tick" product. The analogy applies here on the 2020 Razer Blade 15 as the new 10th gen Core i7-10750H CPU and GeForce RTX Super Max-Q GPU are relatively minor updates to the 9th gen Core i7-9750H and GeForce RTX Max-Q, respectively. The chassis has a few tweaks here and there, but it's still the same chassis that we're all familiar with. Any gaming performance advantages over last year's models would be in the single-digit percentages on average.
If you're in the market for a Blade 15, it would be worth considering a 2019 model especially now that they're cheaper. You really wouldn't be missing out on anything worthwhile by skipping the 2020 Base Model series. Here's hoping that next year's models will bring more tangible upgrades like quieter fans and Ampere GPUs.
A refinement of the already excellent 2019 series. There are some new options thrown in for good measure, but they're mostly minor and nothing to write home about.
Razer Blade 15 RZ09-0328
-
08/31/2022 v7
Allen Ngo
More articles related to this device
Razer Blade 15 RZ09-0328 (Blade 15 Series)Related Articles


Pricecompare
